Notes. Input Data C:\Users\User\Documents\Dolly SPSS.sav. N of Rows in Working Data File
|
|
|
- Ralph Stephens
- 7 years ago
- Views:
Transcription
1 GET FILE='C:\Users\User\Documents\Dolly SPSS.sav'. REGRESSION /DESCRIPTIVES MEAN STDDEV CORR SIG N /MISSING LISTWISE /STATISTICS COEFF OUTS CI(95) R ANOVA COLLIN TOL CHANGE ZPP /CRITERIA=PIN(.05) POUT(.10) /NOORIGIN /DEPENDENT Y /METHOD=ENTER X1 X2 /PARTIALPLOT ALL /SCATTERPLOT=(*ZPRED,Y) /RESIDUALS DURBIN HIST(ZRESID) NORM(ZRESID). Regression Notes Output Created 23-Feb :48:48 Comments Input Data C:\Users\User\Documents\Dolly SPSS.sav Active Dataset Filter Weight Split File DataSet1 N of Rows in Working Data File 180 Missing Value Handling Definition of Missing User-defined missing values are treated as missing. Cases Used Syntax Statistics are based on cases with no missing values for any variable used. REGRESSION /DESCRIPTIVES MEAN STDDEV CORR SIG N /MISSING LISTWISE /STATISTICS COEFF OUTS CI(95) R ANOVA COLLIN TOL CHANGE ZPP /CRITERIA=PIN(.05) POUT(.10) /NOORIGIN /DEPENDENT Y /METHOD=ENTER X1 X2 /PARTIALPLOT ALL /SCATTERPLOT=(*ZPRED,Y) /RESIDUALS DURBIN HIST(ZRESID) NORM(ZRESID). Resources Processor Time 0:00: Elapsed Time 0:00: Memory Required 1644 bytes 55
2 Notes Output Created 23-Feb :48:48 Comments Input Data C:\Users\User\Documents\Dolly SPSS.sav Active Dataset Filter Weight Split File DataSet1 N of Rows in Working Data File 180 Missing Value Handling Definition of Missing User-defined missing values are treated as missing. Cases Used Syntax Statistics are based on cases with no missing values for any variable used. REGRESSION /DESCRIPTIVES MEAN STDDEV CORR SIG N /MISSING LISTWISE /STATISTICS COEFF OUTS CI(95) R ANOVA COLLIN TOL CHANGE ZPP /CRITERIA=PIN(.05) POUT(.10) /NOORIGIN /DEPENDENT Y /METHOD=ENTER X1 X2 /PARTIALPLOT ALL /SCATTERPLOT=(*ZPRED,Y) /RESIDUALS DURBIN HIST(ZRESID) NORM(ZRESID). Resources Processor Time 0:00: Elapsed Time 0:00: Memory Required Additional Memory Required for Residual Plots 1644 bytes 1624 bytes [DataSet1] C:\Users\User\Documents\Dolly SPSS.sav 56
3 Descriptive Statistics Mean Std. Deviation N WOM Positif Customer Delight Kepercayaan Pelanggan Correlations WOM Positif Customer Delight Kepercayaan Pelanggan Pearson Correlation WOM Positif Customer Delight Kepercayaan Pelanggan Sig. (1-tailed) WOM Positif Customer Delight Kepercayaan Pelanggan N WOM Positif Customer Delight Kepercayaan Pelanggan Variables Entered/Removed Variables Variables Entered Removed Method 1 Kepercayaan Pelanggan, Customer Delight a. Enter a. All requested variables entered. 57
4 Summary b R R Square Adjusted R Square Std. Error of the Estimate a a. Predictors: (Constant), Kepercayaan Pelanggan, Customer Delight b. Dependent Variable: WOM Positif Summary b Change Statistics R Square Change F Change df1 df2 Sig. F Change Durbin-Watson b. Dependent Variable: WOM Positif ANOVA b Sum of Squares df Mean Square F Sig. 1 Regression a Residual Total a. Predictors: (Constant), Kepercayaan Pelanggan, Customer Delight b. Dependent Variable: WOM Positif Coefficients a Unstandardized Coefficients Standardized Coefficients B Std. Error Beta t Sig. 1 (Constant) Customer Delight Kepercayaan Pelanggan
5 Coefficients a 95,0% Confidence Interval for B Correlations Lower Bound Upper Bound Zero-order Partial Part 1 (Constant) Customer Delight Kepercayaan Pelanggan Coefficients a Collinearity Statistics Tolerance VIF 1 Customer Delight Kepercayaan Pelanggan Collinearity Diagnostics a Variance Proportions Dimensi Kepercayaan on Eigenvalue Condition Index (Constant) Customer Delight Pelanggan Residuals Statistics a Minimum Maximum Mean Std. Deviation N Predicted Value Residual Std. Predicted Value Std. Residual
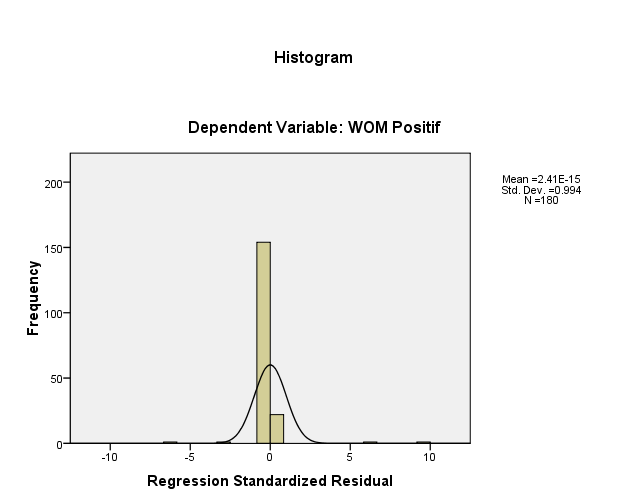
6 Charts 60
7 61

8 62
Multiple Regression in SPSS This example shows you how to perform multiple regression. The basic command is regression : linear.
 Multiple Regression in SPSS This example shows you how to perform multiple regression. The basic command is regression : linear. In the main dialog box, input the dependent variable and several predictors.
Simple Linear Regression, Scatterplots, and Bivariate Correlation
 1 Simple Linear Regression, Scatterplots, and Bivariate Correlation This section covers procedures for testing the association between two continuous variables using the SPSS Regression and Correlate analyses.
Moderation. Moderation
 Stats - Moderation Moderation A moderator is a variable that specifies conditions under which a given predictor is related to an outcome. The moderator explains when a DV and IV are related. Moderation
SPSS Guide: Regression Analysis
 SPSS Guide: Regression Analysis I put this together to give you a step-by-step guide for replicating what we did in the computer lab. It should help you run the tests we covered. The best way to get familiar
Using Correlation and Regression: Mediation, Moderation, and More
 Using Correlation and Regression: Mediation, Moderation, and More Part 2: Mediation analysis with regression Claremont Graduate University Professional Development Workshop August 22, 2015 Dale Berger,
Chapter Seven. Multiple regression An introduction to multiple regression Performing a multiple regression on SPSS
 Chapter Seven Multiple regression An introduction to multiple regression Performing a multiple regression on SPSS Section : An introduction to multiple regression WHAT IS MULTIPLE REGRESSION? Multiple
The Not-Even-Remotely Close to Being a Complete Guide to SPSS / PASW Syntax. (For SPSS / PASW v.18+)
") The Not-Even-Remotely Close to Being a Complete Guide to SPSS / PASW Syntax (For SPSS / PASW v.18+) Dr. Bryan R. Burnham Department of Psychology University of Scranton 1 of 49 Table of Contents 1. What
The Not-Even-Remotely Close to Being a Complete Guide to SPSS / PASW Syntax (For SPSS / PASW v.18+) Dr. Bryan R. Burnham Department of Psychology University of Scranton 1 of 49 Table of Contents 1. What
Multiple Regression. Page 24
 Multiple Regression Multiple regression is an extension of simple (bi-variate) regression. The goal of multiple regression is to enable a researcher to assess the relationship between a dependent (predicted)
Chapter 2 Probability Topics SPSS T tests
 Chapter 2 Probability Topics SPSS T tests Data file used: gss.sav In the lecture about chapter 2, only the One-Sample T test has been explained. In this handout, we also give the SPSS methods to perform
SPSS-Applications (Data Analysis)
") CORTEX fellows training course, University of Zurich, October 2006 Slide 1 SPSS-Applications (Data Analysis) Dr. Jürg Schwarz, juerg.schwarz@schwarzpartners.ch Program 19. October 2006: Morning Lessons
CORTEX fellows training course, University of Zurich, October 2006 Slide 1 SPSS-Applications (Data Analysis) Dr. Jürg Schwarz, juerg.schwarz@schwarzpartners.ch Program 19. October 2006: Morning Lessons
Chapter 13 Introduction to Linear Regression and Correlation Analysis
 Chapter 3 Student Lecture Notes 3- Chapter 3 Introduction to Linear Regression and Correlation Analsis Fall 2006 Fundamentals of Business Statistics Chapter Goals To understand the methods for displaing
DAFTAR PUSTAKA. Arifin Ali, 2002, Membaca Saham, Edisi I, Yogyakarta : Andi. Bapepam, 2004, Ringkasan Data Perusahaan, Jakarta : Bapepam
 03 DAFTAR PUSTAKA Arifin Ali, 00, Membaca Saham, Edisi I, Yogyakarta : Andi Bapepam, 004, Ringkasan Data Perusahaan, Jakarta : Bapepam Darmadji Tjiptono dan Fakhruddin M Hendy, 006, Pasar Modal di Indonesia,
Simple linear regression
 Simple linear regression Introduction Simple linear regression is a statistical method for obtaining a formula to predict values of one variable from another where there is a causal relationship between
Multicollinearity Richard Williams, University of Notre Dame, http://www3.nd.edu/~rwilliam/ Last revised January 13, 2015
 Multicollinearity Richard Williams, University of Notre Dame, http://www3.nd.edu/~rwilliam/ Last revised January 13, 2015 Stata Example (See appendices for full example).. use http://www.nd.edu/~rwilliam/stats2/statafiles/multicoll.dta,
Directions for using SPSS
 Directions for using SPSS Table of Contents Connecting and Working with Files 1. Accessing SPSS... 2 2. Transferring Files to N:\drive or your computer... 3 3. Importing Data from Another File Format...
JD Eveland PhD. Presented to TUI University Faculty Research Forum. 30 November 2007
 JD Eveland PhD Presented to TUI University Faculty Research Forum 30 November 2007 A follow-up to the CARMA presentation by Dr. James LeBreton on Relative Importance of Predictors with Regression Models
Chapter 23. Inferences for Regression
 Chapter 23. Inferences for Regression Topics covered in this chapter: Simple Linear Regression Simple Linear Regression Example 23.1: Crying and IQ The Problem: Infants who cry easily may be more easily
Moderator and Mediator Analysis
 Moderator and Mediator Analysis Seminar General Statistics Marijtje van Duijn October 8, Overview What is moderation and mediation? What is their relation to statistical concepts? Example(s) October 8,
Multiple Regression Using SPSS
 Multiple Regression Using SPSS The following sections have been adapted from Field (2009) Chapter 7. These sections have been edited down considerably and I suggest (especially if you re confused) that
1. What is the critical value for this 95% confidence interval? CV = z.025 = invnorm(0.025) = 1.96
 = 1.96") 1 Final Review 2 Review 2.1 CI 1-propZint Scenario 1 A TV manufacturer claims in its warranty brochure that in the past not more than 10 percent of its TV sets needed any repair during the first two years
1 Final Review 2 Review 2.1 CI 1-propZint Scenario 1 A TV manufacturer claims in its warranty brochure that in the past not more than 10 percent of its TV sets needed any repair during the first two years
1.1. Simple Regression in Excel (Excel 2010).
.") .. Simple Regression in Excel (Excel 200). To get the Data Analysis tool, first click on File > Options > Add-Ins > Go > Select Data Analysis Toolpack & Toolpack VBA. Data Analysis is now available under
.. Simple Regression in Excel (Excel 200). To get the Data Analysis tool, first click on File > Options > Add-Ins > Go > Select Data Analysis Toolpack & Toolpack VBA. Data Analysis is now available under
Factor Analysis. Principal components factor analysis. Use of extracted factors in multivariate dependency models
 Factor Analysis Principal components factor analysis Use of extracted factors in multivariate dependency models 2 KEY CONCEPTS ***** Factor Analysis Interdependency technique Assumptions of factor analysis
Regression Analysis: A Complete Example
 Regression Analysis: A Complete Example This section works out an example that includes all the topics we have discussed so far in this chapter. A complete example of regression analysis. PhotoDisc, Inc./Getty
Doing Multiple Regression with SPSS. In this case, we are interested in the Analyze options so we choose that menu. If gives us a number of choices:
 Doing Multiple Regression with SPSS Multiple Regression for Data Already in Data Editor Next we want to specify a multiple regression analysis for these data. The menu bar for SPSS offers several options:
Univariate Regression
 Univariate Regression Correlation and Regression The regression line summarizes the linear relationship between 2 variables Correlation coefficient, r, measures strength of relationship: the closer r is
A Basic Guide to Analyzing Individual Scores Data with SPSS
 A Basic Guide to Analyzing Individual Scores Data with SPSS Step 1. Clean the data file Open the Excel file with your data. You may get the following message: If you get this message, click yes. Delete
Student debt from higher education attendance is an increasingly troubling problem in the
 Morrie Swerlick Student Debt Policy Memo 2/23/2012 Student debt from higher education attendance is an increasingly troubling problem in the United States. Due to rising costs and shrinking state expenditures,
Introduction. Research Problem. Larojan Chandrasegaran (1), Janaki Samuel Thevaruban (2)
, Janaki Samuel Thevaruban (2)") Larojan Chandrasegaran (1), Janaki Samuel Thevaruban (2) Determining Factors on Applicability of the Computerized Accounting System in Financial Institutions in Sri Lanka (1) Department of Finance and
Larojan Chandrasegaran (1), Janaki Samuel Thevaruban (2) Determining Factors on Applicability of the Computerized Accounting System in Financial Institutions in Sri Lanka (1) Department of Finance and
Data Mining for Model Creation. Presentation by Paul Below, EDS 2500 NE Plunkett Lane Poulsbo, WA USA 98370 paul.below@eds.
 Sept 03-23-05 22 2005 Data Mining for Model Creation Presentation by Paul Below, EDS 2500 NE Plunkett Lane Poulsbo, WA USA 98370 paul.below@eds.com page 1 Agenda Data Mining and Estimating Model Creation
False. Model 2 is not a special case of Model 1, because Model 2 includes X5, which is not part of Model 1. What she ought to do is estimate
 Sociology 59 - Research Statistics I Final Exam Answer Key December 6, 00 Where appropriate, show your work - partial credit may be given. (On the other hand, don't waste a lot of time on excess verbiage.)
NCSS Statistical Software Principal Components Regression. In ordinary least squares, the regression coefficients are estimated using the formula ( )
") Chapter 340 Principal Components Regression Introduction is a technique for analyzing multiple regression data that suffer from multicollinearity. When multicollinearity occurs, least squares estimates
Chapter 340 Principal Components Regression Introduction is a technique for analyzing multiple regression data that suffer from multicollinearity. When multicollinearity occurs, least squares estimates
Regression Analysis (Spring, 2000)
") Regression Analysis (Spring, 2000) By Wonjae Purposes: a. Explaining the relationship between Y and X variables with a model (Explain a variable Y in terms of Xs) b. Estimating and testing the intensity
Regression Analysis (Spring, 2000) By Wonjae Purposes: a. Explaining the relationship between Y and X variables with a model (Explain a variable Y in terms of Xs) b. Estimating and testing the intensity
Correlation and Regression Analysis: SPSS
 Correlation and Regression Analysis: SPSS Bivariate Analysis: Cyberloafing Predicted from Personality and Age These days many employees, during work hours, spend time on the Internet doing personal things,
Comparing a Multiple Regression Model Across Groups
 Comparing a Multiple Regression Across Groups We might want to know whether a particular set of predictors leads to a multiple regression model that works equally effectively for two (or more) different
Simple Linear Regression Inference
 Simple Linear Regression Inference 1 Inference requirements The Normality assumption of the stochastic term e is needed for inference even if it is not a OLS requirement. Therefore we have: Interpretation
Predictability Study of ISIP Reading and STAAR Reading: Prediction Bands. March 2014
 Predictability Study of ISIP Reading and STAAR Reading: Prediction Bands March 2014 Chalie Patarapichayatham 1, Ph.D. William Fahle 2, Ph.D. Tracey R. Roden 3, M.Ed. 1 Research Assistant Professor in the
KSTAT MINI-MANUAL. Decision Sciences 434 Kellogg Graduate School of Management
 KSTAT MINI-MANUAL Decision Sciences 434 Kellogg Graduate School of Management Kstat is a set of macros added to Excel and it will enable you to do the statistics required for this course very easily. To
This chapter will demonstrate how to perform multiple linear regression with IBM SPSS
 CHAPTER 7B Multiple Regression: Statistical Methods Using IBM SPSS This chapter will demonstrate how to perform multiple linear regression with IBM SPSS first using the standard method and then using the
Didacticiel - Études de cas
 1 Topic Regression analysis with LazStats (OpenStat). LazStat 1 is a statistical software which is developed by Bill Miller, the father of OpenStat, a wellknow tool by statisticians since many years. These
Multiple Linear Regression
 Multiple Linear Regression A regression with two or more explanatory variables is called a multiple regression. Rather than modeling the mean response as a straight line, as in simple regression, it is
www.kellogg.northwestern.edu/kis/tek/ongoing/spss.htm
 First version: October 11, 2004 Last revision: January 14, 2005 KELLOGG RESEARCH COMPUTING Introduction to SPSS SPSS is a statistical package commonly used in the social sciences, particularly in marketing,
Independent t- Test (Comparing Two Means)
") Independent t- Test (Comparing Two Means) The objectives of this lesson are to learn: the definition/purpose of independent t-test when to use the independent t-test the use of SPSS to complete an independent
Independent t- Test (Comparing Two Means) The objectives of this lesson are to learn: the definition/purpose of independent t-test when to use the independent t-test the use of SPSS to complete an independent
Regression step-by-step using Microsoft Excel
 Step 1: Regression step-by-step using Microsoft Excel Notes prepared by Pamela Peterson Drake, James Madison University Type the data into the spreadsheet The example used throughout this How to is a regression
The Impact of Affective Human Resources Management Practices on the Financial Performance of the Saudi Banks
 327 The Impact of Affective Human Resources Management Practices on the Financial Performance of the Saudi Banks Abdullah Attia AL-Zahrani King Saud University azahrani@ksu.edu.sa Ahmad Aref Almazari*
Chapter 7: Simple linear regression Learning Objectives
 Chapter 7: Simple linear regression Learning Objectives Reading: Section 7.1 of OpenIntro Statistics Video: Correlation vs. causation, YouTube (2:19) Video: Intro to Linear Regression, YouTube (5:18) -
Final Exam Practice Problem Answers
 Final Exam Practice Problem Answers The following data set consists of data gathered from 77 popular breakfast cereals. The variables in the data set are as follows: Brand: The brand name of the cereal
Outline. Topic 4 - Analysis of Variance Approach to Regression. Partitioning Sums of Squares. Total Sum of Squares. Partitioning sums of squares
 Topic 4 - Analysis of Variance Approach to Regression Outline Partitioning sums of squares Degrees of freedom Expected mean squares General linear test - Fall 2013 R 2 and the coefficient of correlation
THE USE OF REGRESSION ANALYSIS IN MARKETING RESEARCH
 THE USE OF REGRESSION ANALYSIS IN MARKETING RESEARCH DUMITRESCU Luigi Lucian Blaga University of Sibiu, Romania STANCIU Oana Lucian Blaga University of Sibiu, Romania TICHINDELEAN Mihai Lucian Blaga University
Predictor Coef StDev T P Constant 970667056 616256122 1.58 0.154 X 0.00293 0.06163 0.05 0.963. S = 0.5597 R-Sq = 0.0% R-Sq(adj) = 0.
 = 0.") Statistical analysis using Microsoft Excel Microsoft Excel spreadsheets have become somewhat of a standard for data storage, at least for smaller data sets. This, along with the program often being packaged
Statistical analysis using Microsoft Excel Microsoft Excel spreadsheets have become somewhat of a standard for data storage, at least for smaller data sets. This, along with the program often being packaged
THE KRUSKAL WALLLIS TEST
 THE KRUSKAL WALLLIS TEST TEODORA H. MEHOTCHEVA Wednesday, 23 rd April 08 THE KRUSKAL-WALLIS TEST: The non-parametric alternative to ANOVA: testing for difference between several independent groups 2 NON
Premaster Statistics Tutorial 4 Full solutions
 Premaster Statistics Tutorial 4 Full solutions Regression analysis Q1 (based on Doane & Seward, 4/E, 12.7) a. Interpret the slope of the fitted regression = 125,000 + 150. b. What is the prediction for
DEPARTMENT OF PSYCHOLOGY UNIVERSITY OF LANCASTER MSC IN PSYCHOLOGICAL RESEARCH METHODS ANALYSING AND INTERPRETING DATA 2 PART 1 WEEK 9
 DEPARTMENT OF PSYCHOLOGY UNIVERSITY OF LANCASTER MSC IN PSYCHOLOGICAL RESEARCH METHODS ANALYSING AND INTERPRETING DATA 2 PART 1 WEEK 9 Analysis of covariance and multiple regression So far in this course,
HYPOTHESIS TESTING: CONFIDENCE INTERVALS, T-TESTS, ANOVAS, AND REGRESSION
 HYPOTHESIS TESTING: CONFIDENCE INTERVALS, T-TESTS, ANOVAS, AND REGRESSION HOD 2990 10 November 2010 Lecture Background This is a lightning speed summary of introductory statistical methods for senior undergraduate
SPSS TUTORIAL & EXERCISE BOOK
 UNIVERSITY OF MISKOLC Faculty of Economics Institute of Business Information and Methods Department of Business Statistics and Economic Forecasting PETRA PETROVICS SPSS TUTORIAL & EXERCISE BOOK FOR BUSINESS
Data Analysis for Marketing Research - Using SPSS
 North South University, School of Business MKT 63 Marketing Research Instructor: Mahmood Hussain, PhD Data Analysis for Marketing Research - Using SPSS Introduction In this part of the class, we will learn
THE RELATIONSHIP BETWEEN WORKING CAPITAL MANAGEMENT AND DIVIDEND PAYOUT RATIO OF FIRMS LISTED IN NAIROBI SECURITIES EXCHANGE
 International Journal of Economics, Commerce and Management United Kingdom Vol. III, Issue 11, November 2015 http://ijecm.co.uk/ ISSN 2348 0386 THE RELATIONSHIP BETWEEN WORKING CAPITAL MANAGEMENT AND DIVIDEND
Data driven approach in analyzing energy consumption data in buildings. Office of Environmental Sustainability Ian Tan
 Data driven approach in analyzing energy consumption data in buildings Office of Environmental Sustainability Ian Tan Background Real time energy consumption data of buildings in terms of electricity (kwh)
COMPARISONS OF CUSTOMER LOYALTY: PUBLIC & PRIVATE INSURANCE COMPANIES.
 277 CHAPTER VI COMPARISONS OF CUSTOMER LOYALTY: PUBLIC & PRIVATE INSURANCE COMPANIES. This chapter contains a full discussion of customer loyalty comparisons between private and public insurance companies
A SUCCESFULL WAY TO SELL HANDICRAFTS IN ALBANIA
 International Journal of Economics, Commerce and Management United Kingdom Vol. III, Issue 4, April 2015 http://ijecm.co.uk/ ISSN 2348 0386 A SUCCESFULL WAY TO SELL HANDICRAFTS IN ALBANIA EMPIRICAL EXPLORATION
The importance of graphing the data: Anscombe s regression examples
 The importance of graphing the data: Anscombe s regression examples Bruce Weaver Northern Health Research Conference Nipissing University, North Bay May 30-31, 2008 B. Weaver, NHRC 2008 1 The Objective
Chapter 5 Analysis of variance SPSS Analysis of variance
 Chapter 5 Analysis of variance SPSS Analysis of variance Data file used: gss.sav How to get there: Analyze Compare Means One-way ANOVA To test the null hypothesis that several population means are equal,
Additional sources Compilation of sources: http://lrs.ed.uiuc.edu/tseportal/datacollectionmethodologies/jin-tselink/tselink.htm
 Mgt 540 Research Methods Data Analysis 1 Additional sources Compilation of sources: http://lrs.ed.uiuc.edu/tseportal/datacollectionmethodologies/jin-tselink/tselink.htm http://web.utk.edu/~dap/random/order/start.htm
Introduction to Analysis of Variance (ANOVA) Limitations of the t-test
 Limitations of the t-test") Introduction to Analysis of Variance (ANOVA) The Structural Model, The Summary Table, and the One- Way ANOVA Limitations of the t-test Although the t-test is commonly used, it has limitations Can only
Introduction to Analysis of Variance (ANOVA) The Structural Model, The Summary Table, and the One- Way ANOVA Limitations of the t-test Although the t-test is commonly used, it has limitations Can only
SPSS Tests for Versions 9 to 13
 SPSS Tests for Versions 9 to 13 Chapter 2 Descriptive Statistic (including median) Choose Analyze Descriptive statistics Frequencies... Click on variable(s) then press to move to into Variable(s): list
Trust, Job Satisfaction, Organizational Commitment, and the Volunteer s Psychological Contract
 Trust, Job Satisfaction, Commitment, and the Volunteer s Psychological Contract Becky J. Starnes, Ph.D. Austin Peay State University Clarksville, Tennessee, USA starnesb@apsu.edu Abstract Studies indicate
ABSORBENCY OF PAPER TOWELS
 ABSORBENCY OF PAPER TOWELS 15. Brief Version of the Case Study 15.1 Problem Formulation 15.2 Selection of Factors 15.3 Obtaining Random Samples of Paper Towels 15.4 How will the Absorbency be measured?
SPSS Guide How-to, Tips, Tricks & Statistical Techniques
 SPSS Guide How-to, Tips, Tricks & Statistical Techniques Support for the course Research Methodology for IB Also useful for your BSc or MSc thesis March 2014 Dr. Marijke Leliveld Jacob Wiebenga, MSc CONTENT
EDUCATION AND VOCABULARY MULTIPLE REGRESSION IN ACTION
 EDUCATION AND VOCABULARY MULTIPLE REGRESSION IN ACTION EDUCATION AND VOCABULARY 5-10 hours of input weekly is enough to pick up a new language (Schiff & Myers, 1988). Dutch children spend 5.5 hours/day
C:\Users\<your_user_name>\AppData\Roaming\IEA\IDBAnalyzerV3
 Installing the IDB Analyzer (Version 3.1) Installing the IDB Analyzer (Version 3.1) A current version of the IDB Analyzer is available free of charge from the IEA website (http://www.iea.nl/data.html,
One-Way Analysis of Variance
 One-Way Analysis of Variance Note: Much of the math here is tedious but straightforward. We ll skim over it in class but you should be sure to ask questions if you don t understand it. I. Overview A. We
Coefficient of Determination
 Coefficient of Determination The coefficient of determination R 2 (or sometimes r 2 ) is another measure of how well the least squares equation ŷ = b 0 + b 1 x performs as a predictor of y. R 2 is computed
SPSS Resources. 1. See website (readings) for SPSS tutorial & Stats handout
 for SPSS tutorial & Stats handout") Analyzing Data SPSS Resources 1. See website (readings) for SPSS tutorial & Stats handout Don t have your own copy of SPSS? 1. Use the libraries to analyze your data 2. Download a trial version of SPSS
Analyzing Data SPSS Resources 1. See website (readings) for SPSS tutorial & Stats handout Don t have your own copy of SPSS? 1. Use the libraries to analyze your data 2. Download a trial version of SPSS
Determinants of the Total Quality Management Implementation in SMEs in Iran (Case of Metal Industry)
") International Journal of Business and Social Science Vol. 4 No. 16; December 2013 Determinants of the Total Quality Management Implementation in SMEs in Iran (Case of Metal Industry) Hamed Ramezani Planning
International Journal of Business and Social Science Vol. 4 No. 16; December 2013 Determinants of the Total Quality Management Implementation in SMEs in Iran (Case of Metal Industry) Hamed Ramezani Planning
5. Linear Regression
 5. Linear Regression Outline.................................................................... 2 Simple linear regression 3 Linear model............................................................. 4
The Relationship between Life Insurance and Economic Growth: Evidence from India
 Global Journal of Management and Business Studies. ISSN 2248-9878 Volume 3, Number 4 (2013), pp. 413-422 Research India Publications http://www.ripublication.com/gjmbs.htm The Relationship between Life
MISSING DATA TECHNIQUES WITH SAS. IDRE Statistical Consulting Group
 MISSING DATA TECHNIQUES WITH SAS IDRE Statistical Consulting Group ROAD MAP FOR TODAY To discuss: 1. Commonly used techniques for handling missing data, focusing on multiple imputation 2. Issues that could
Study on The Influence Factor of Cash Dividend Distribution in Listed
 Study on The Influence Factor of Cash Dividend Distribution in Listed Companies 1 Wu He, 2 Ping Liu 1, Management Department Ningbo Institute of Technology Zhejiang University Ningbo, China, hewucpa@163.com
Linear Models in STATA and ANOVA
 Session 4 Linear Models in STATA and ANOVA Page Strengths of Linear Relationships 4-2 A Note on Non-Linear Relationships 4-4 Multiple Linear Regression 4-5 Removal of Variables 4-8 Independent Samples
Basic Statistical and Modeling Procedures Using SAS
 Basic Statistical and Modeling Procedures Using SAS One-Sample Tests The statistical procedures illustrated in this handout use two datasets. The first, Pulse, has information collected in a classroom
Chapter 4 and 5 solutions
 Chapter 4 and 5 solutions 4.4. Three different washing solutions are being compared to study their effectiveness in retarding bacteria growth in five gallon milk containers. The analysis is done in a laboratory,
MULTIPLE REGRESSIONS ON SOME SELECTED MACROECONOMIC VARIABLES ON STOCK MARKET RETURNS FROM 1986-2010
 Advances in Economics and International Finance AEIF Vol. 1(1), pp. 1-11, December 2014 Available online at http://www.academiaresearch.org Copyright 2014 Academia Research Full Length Research Paper MULTIPLE
ijcrb.webs.com INTERDISCIPLINARY JOURNAL OF CONTEMPORARY RESEARCH IN BUSINESS OCTOBER 2013 VOL 5, NO 6 Abstract 1. Introduction:
 Impact of Management Information Systems to Improve Performance in Municipalities in North of Jordan Fawzi Hasan Altaany Management Information Systems Department, Faculty of Administrative Sciences, Irbid
Cash Flow Statement as an Evidence for Financial Distress
 Universal Journal of Accounting and Finance 1(3): 95-103, 2013 DOI: 10.13189/ujaf.2013.010302 http://www.hrpub.org Cash Flow Statement as an Evidence for Financial Distress Naz Sayari 1,*, F.N. Can Simga
11. Analysis of Case-control Studies Logistic Regression
 Research methods II 113 11. Analysis of Case-control Studies Logistic Regression This chapter builds upon and further develops the concepts and strategies described in Ch.6 of Mother and Child Health:
EXPLORATORY DATA ANALYSIS: GETTING TO KNOW YOUR DATA
 EXPLORATORY DATA ANALYSIS: GETTING TO KNOW YOUR DATA Michael A. Walega Covance, Inc. INTRODUCTION In broad terms, Exploratory Data Analysis (EDA) can be defined as the numerical and graphical examination
EMPIRICAL INVESTIGATION OF LEADERSHIP STYLE ON ENHANCING TEAM BUILDING SKILLS
 EMPIRICAL INVESTIGATION OF LEADERSHIP STYLE ON ENHANCING TEAM BUILDING SKILLS Prof. Dr. Muhammad Ehsan Malik Dean Faculty of Economics and Management Sciences Director, Institute of Business Administration
Time series analysis in loan management information systems
 Theoretical and Applied Economics Volume XXI (2014), No. 3(592), pp. 57-66 Time series analysis in loan management information systems Julian VASILEV Varna University of Economics, Bulgaria vasilev@ue-varna.bg
A full analysis example Multiple correlations Partial correlations
 A full analysis example Multiple correlations Partial correlations New Dataset: Confidence This is a dataset taken of the confidence scales of 41 employees some years ago using 4 facets of confidence (Physical,
SAS Software to Fit the Generalized Linear Model
 SAS Software to Fit the Generalized Linear Model Gordon Johnston, SAS Institute Inc., Cary, NC Abstract In recent years, the class of generalized linear models has gained popularity as a statistical modeling
A Brief Introduction to SPSS Factor Analysis
 A Brief Introduction to SPSS Factor Analysis SPSS has a procedure that conducts exploratory factor analysis. Before launching into a step by step example of how to use this procedure, it is recommended
Business Statistics. Successful completion of Introductory and/or Intermediate Algebra courses is recommended before taking Business Statistics.
 Business Course Text Bowerman, Bruce L., Richard T. O'Connell, J. B. Orris, and Dawn C. Porter. Essentials of Business, 2nd edition, McGraw-Hill/Irwin, 2008, ISBN: 978-0-07-331988-9. Required Computing
6 Variables: PD MF MA K IAH SBS
 options pageno=min nodate formdlim='-'; title 'Canonical Correlation, Journal of Interpersonal Violence, 10: 354-366.'; data SunitaPatel; infile 'C:\Users\Vati\Documents\StatData\Sunita.dat'; input Group
Statistical Control using Partial and Semi-partial (Part) Correlations
 Correlations") Statistical Control using Partial and Semi-partial (Part) A study of performance in graduate school produced the following correlations. 1st year graduate gpa -- criterion variable undergraduate gpa full
Statistical Control using Partial and Semi-partial (Part) A study of performance in graduate school produced the following correlations. 1st year graduate gpa -- criterion variable undergraduate gpa full
Equity Valuation Project
 Equity Valuation Project Data: May 1 st 2005 Group: Companies: Apple Computer (AAPL) Actividades de Construccion y Servicios ( ACS ) Alliance Capital Management Holdings (AC) DCF Valuation Relative Valuation
Outliers Richard Williams, University of Notre Dame, http://www3.nd.edu/~rwilliam/ Last revised April 7, 2016
 Outliers Richard Williams, University of Notre Dame, http://www3.nd.edu/~rwilliam/ Last revised April 7, 2016 These notes draw heavily from several sources, including Fox s Regression Diagnostics; Pindyck
Factors affecting online sales
 Factors affecting online sales Table of contents Summary... 1 Research questions... 1 The dataset... 2 Descriptive statistics: The exploratory stage... 3 Confidence intervals... 4 Hypothesis tests... 4
" Y. Notation and Equations for Regression Lecture 11/4. Notation:
 Notation: Notation and Equations for Regression Lecture 11/4 m: The number of predictor variables in a regression Xi: One of multiple predictor variables. The subscript i represents any number from 1 through
Economics and Finance Review Vol. 1(3) pp. 30 40, May, 2011 ISSN: 2047-0401 Available online at http://wwww.businessjournalz.
 pp. 30 40, May, 2011 ISSN: 2047-0401 Available online at http://wwww.businessjournalz.") ABSTRACT FACTORS THAT INFLUENCE WORKING CAPITAL REQUIREMENTS IN CANADA Amarjit Gill Professor of Business Administration College of Business Administration, Trident University International, 5665 Plaza
ABSTRACT FACTORS THAT INFLUENCE WORKING CAPITAL REQUIREMENTS IN CANADA Amarjit Gill Professor of Business Administration College of Business Administration, Trident University International, 5665 Plaza
INTERPRETING THE ONE-WAY ANALYSIS OF VARIANCE (ANOVA)
") INTERPRETING THE ONE-WAY ANALYSIS OF VARIANCE (ANOVA) As with other parametric statistics, we begin the one-way ANOVA with a test of the underlying assumptions. Our first assumption is the assumption of
INTERPRETING THE ONE-WAY ANALYSIS OF VARIANCE (ANOVA) As with other parametric statistics, we begin the one-way ANOVA with a test of the underlying assumptions. Our first assumption is the assumption of