Interim Report as of 31 March st quarter freenet AG Hollerstraße Büdelsdorf
|
|
|
- Jeffrey Miller
- 8 years ago
- Views:
Transcription
1 Interim Report as of 31 March st quarter 2014 freenet AG Hollerstraße Büdelsdorf

2

3 List of contents Key financials... 4 To our shareholders... 6 Letter to shareholders freenet AG on the capital market Interim group management report Economic report Opportunities and risk report Forecast Significant events after the reporting date Transactions with related parties Condensed interim consolidated financial statements Overview Consolidated income statement for the period from 1 January to 31 March Consolidated statement of comprehensive income for the period from 1 January to 31 March Consolidated balance sheet as of 31 March Schedule of changes in equity from the period from 1 January to 31 March Consolidated statement of cash flows for the period from 1 January to 31 March Selected explanatory notes in accordance with IAS Further information Financial calender Imprint, contact, publications... 50

4 4 Key financials Key financials: Group overview Result In EUR million/as indicated Q1/2014 Q4/2013 Q1/2013 Revenue Gross profit EBITDA EBIT EBT Group result from continued operations Group result from discontinued operations Group result Earnings per share ( ) (diluted and undiluted) Balance sheet In EUR million/as indicated Balance sheet total in million 2, , ,518.7 Shareholders equity in million 1, , ,239.2 Equity ratio in % Finances and investments In EUR million Q1/2014 Q4/2013 Q1/2013 Free cash flow 1, Depreciation and amortisation Net investments 2 (CAPEX) Net cash 2, Share Closing price Xetra in Number of ordinary shares in 000s 128, , ,061 Market capitalisation in EUR 000s 3 3,250,829 2,789,169 2,428,037 Employees Employees 3 4,961 4,576 4,557

5 Key financials 5 Key financials: overview Mobile Communications segment Customer development In million Q1/2014 Q4/2013 Q1/2013 Mobile Communications customers Thereof Customer Ownership Thereof contract customers Thereof no-frills customers Thereof prepaid cards Gross new customers Net change Result In EUR million Q1/2014 Q4/2013 Q1/2013 Revenue Gross profit EBITDA EBIT Monthly average revenue per user (ARPU) In EUR Q1/2014 Q4/2013 Q1/2013 Contract customer No-frills customer Prepaid card Free cash flow (FCF) is defined as cash flow from operating activities minus investment in property, plant and equipment and intangible assets, plus proceeds from the disposal of property, plant and equipment and intangible assets. 2 This information relates to the overall Group (including discontinued operations). 3 At the end of period.
 In EUR Q1/2014 Q4/2013 Q1/2013 Contract customer 21.2 21.6 22.4 No-frills customer 2.9 3.0 3.5 Prepaid card 2.7 3.0 2.")
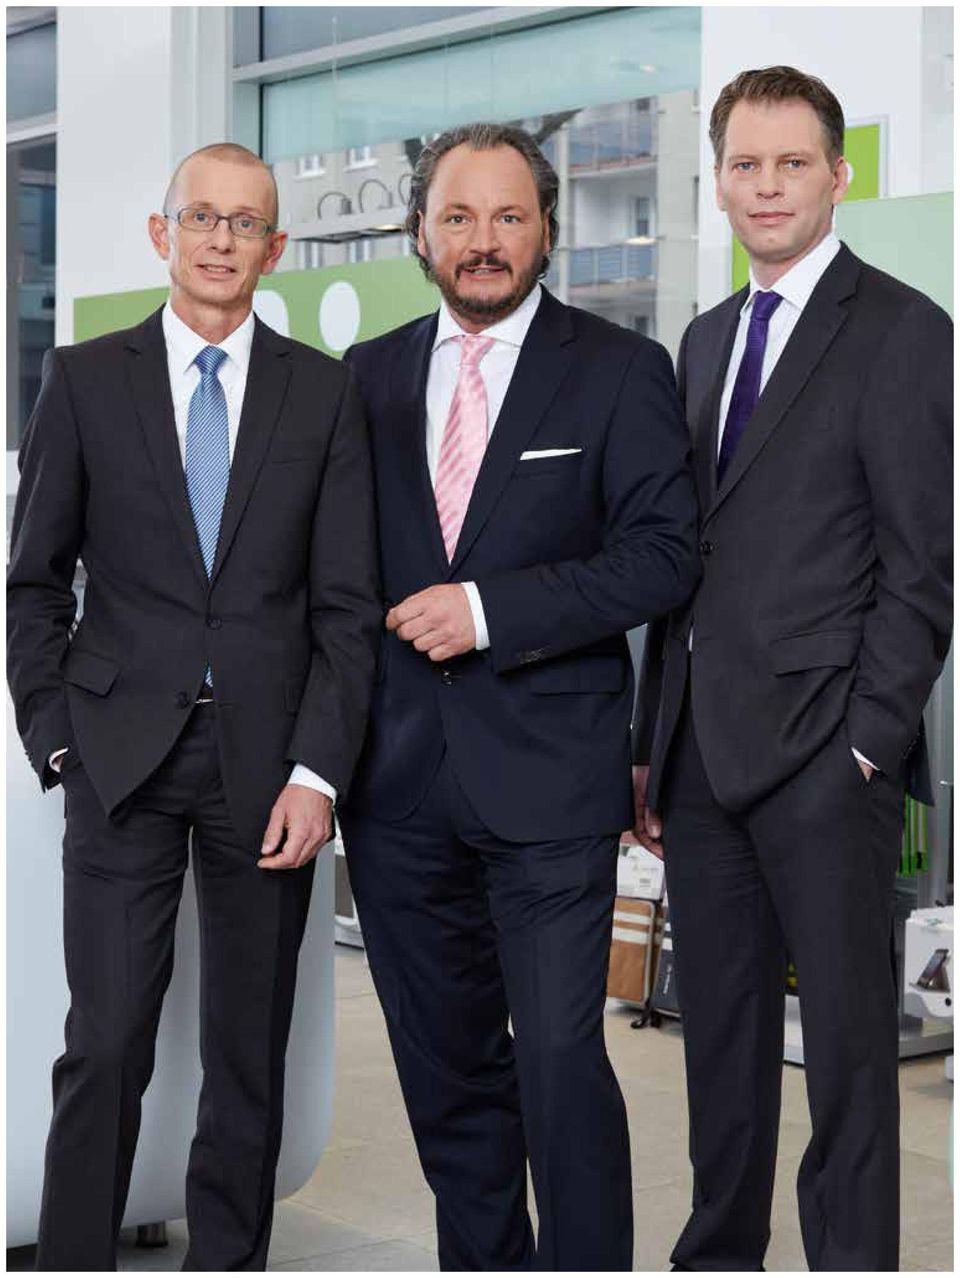
6 To our shareholders From left to right: Joachim Preisig, CFO; Christoph Vilanek, CEO; Stephan Esch, CTO

7
8 8 To our shareholders: Letter to shareholders Letter to shareholders The telecommunications market continues to be marked by dynamic trends and intense competition in the current year. This is being demonstrated once again by the current developments in our traditional area of business, mobile communications/mobile internet, and in the growing digital lifestyle segment. The number of SIM cards in Germany rose to a new record of 115 million at the start of the year, which means that each citizen now has 1.4 mobile connections for his/her mobile phone, smartphone or tablet PC. As the market becomes more and more saturated, we are seeing growing customer demand for affordable flat-rate tariffs which let them control costs. Meanwhile, this development means that providers have been seeing average revenue per user (ARPU) fall for some time now. In addition to this, the digital lifestyle is having an increasingly noticeable effect on our working and personal lives smartphones and tablets have become an almost indispensable companion. We surf, shop, book and pay with these mobile mini computers. We use them at work, for our studies, for entertainment or when we are travelling, and we even use them to make our homes safer and more comfortable controlling a wide range of functions remotely while we are elsewhere. Moreover, communication with friends, acquaintances and relatives is constantly becoming faster, more diverse and easier in the digital age. As a service provider and Germany s largest network-independent telecommunications provider, freenet AG has positioned itself very well in these market segments over the past years with appropriate strategic decisions and actions: our main brand mobilcom-debitel is primarily aimed at contract customers with distinct user profiles who want a quality service and a lot of advice, while our lower-priced discount brands cater for cost-conscious smartphone users in particular. At the same time, we are successfully active in the digital lifestyle area with innovative products and customer-oriented services. The acquisitions and consolidations made in the past financial year GRAVIS, MOTION TM and, most recently, Jesta Digital Group have helped to further improve our competitive position, range of services, customer proximity and marketing strength. This is demonstrated by the positive developments and the figures posted by freenet AG for the first quarter of the current financial year: At million euros, revenue fell short of the level seen in the same period of 2013 particularly as a result of the declining low-margin share of revenue (Hardware Sales) but also because of dwindling ARPU across all markets in our core business of mobile communications. The aforementioned acquisitions also helped to partially compensate Group revenue.

9 To our shareholders: Letter to shareholders 9 Compared to Q1 2013, gross profit rose slightly to million euros, equivalent to a gross margin of 25.4 per cent. EBITDA was on a par with the previous year at 85.4 million euros. The slightly higher free cash flow of 57.1 million euros was within the parameters indicated in our guidance for the year as a whole. Postpaid ARPU continued to fall and stood at 21.2 euros. Customer Ownership a key performance indicator for our company improved again. The number of customers in the postpaid and no-frills segment rose further in the first quarter of 2014 by around 30,000, taking the figure to 8.79 million. This means that we successfully took our first step towards meeting the guidance figures issued at the start of the year for 2014 as a whole. We forecast a Group EBITDA of around 365 million euros and a free cash flow of approximately 265 million euros based on a slight year-on-year increase in revenue. The positive results for the first quarter also confirm our strategy of working tirelessly to secure our strong competitive position in the long term and maintain our high level of profitability and opening up new, attractive growth segments in the process. The operating business of freenet AG was marked by this commercial continuity in the first few months of this year. Firstly, we increased and upgraded our range of digital lifestyle products and affordable tariffs for mobiles/smartphones/tablets thereby actively shaping competition in the segment: For instance, in the entertainment segment, our users with GamePack Plus now have additional options in the form of attractive Freemium Games. In addition to a considerable increase in storage capacity for the same price, mobilcomdebitel cloud was improved with much better operating functions and updates that make it easier to use. The subsidiary GRAVIS offered a number of products at an attractive price in double packs as part of the Digital Valentine promotion. We also launched various special offers in February selling the latest premium smartphones and tablets produced by the world s leading manufacturers, usually combined with... Very low-cost tariffs from our discount subsidiaries and the main brand mobilcom-debitel; in some cases, these results in savings of several hundred euros compared with our competitors standard charges. At the same time, we are working hard to improve our marketing, services and range of products on an ongoing basis. To this end, in another step we intensified our existing sales cooperation with Kabel Deutschland. Germany s largest cable network operator now has its own wall-mounted screens in the 320 or so mobilcom-debitel shops within its distribution area. This allows us to present and sell the shared internet and TV products in an even more customerfriendly manner.

10 10 To our shareholders: Letter to shareholders We are continuously increasing the number of directly controlled shops and, by extension, our proximity to our customers. Over the course of the past twelve months, for instance, the number of mobilcom-debitel stores managed by franchise partners rose to 176. Our aim for the end of 2014 is to have more than 200 partner shops in the company s franchise network. We support these partners with intensive training and tried and tested programmes to boost their performance. Everyone involved franchisees, customers and mobilcom-debitel itself benefits here from the motivation, competence and customer proximity which go hand in hand with independent commercial activities. Furthermore, we recently completed the takeover of Jesta Digital Group which was agreed at the end of As with the two preceding acquisitions of GRAVIS and MOTION TM, we will now integrate Jesta s digital entertainment formats including ring tones, dial tones, logos, mobile phone games and videos, download portals and mobile dating/advertising platforms into the product range of freenet. In this way, we gain access to all-new customer potential that far exceeds our traditional business areas and customer segments. Following on from our acquisitions and consolidations, we will therefore align company processes in the Group with one another over the coming months and further optimise these. We should and will be able to achieve this with the experience and expertise gained from various mergers in previous years. Our efforts were buoyed by a recent Accenture study examining the digitalisation of Germany s 500 largest companies, which accorded us an excellent position: freenet AG occupies an impressive seventh place among the 20 major German companies where digitalisation is at its most advanced. We also perform very well in another, equally important company division customer support call centres. We are managing to constantly improve the speed and efficiency with which we handle customer enquiries over the phone. A current example is our Balance project, which was launched in 2013: it aims to ensure that customer queries are handled by service agents with the corresponding skill set. As a result of this project, customer satisfaction levels in this area rose significantly in a short space of time and our Head of Customer Care at mobilcom-debitel was recently named Call Centre Manager of the Year. Good customer care is also fostered by the extremely low staff fluctuation rate in this area. Our agents have been working at the company for an average of 9.4 years an exceptionally good level for the teleservices sector, where employees usually work at a call centre for between two and five years. Last but not least, another major factor for the success of a company is continuity in its management. This is particularly true in an industry such as telecommunications, which has been marked by considerable dynamism, challenges and opportunities for many years. Against this backdrop, the Supervisory Board of freenet AG extended the three Executive Board members contracts ahead of schedule until the end of 2018 and 2019 respectively in February this year.

11 To our shareholders: Letter to shareholders 11 We view the faith placed in us as recognition of our work so far and the achievements of each and every employee of freenet AG who works hard every day to ensure the long-term success of our company. At the same time, this ringing endorsement encourages us to channel all our expertise and experience into continuing along the successful path chosen for freenet over the coming months and years with unwavering commitment. Christoph Vilanek Joachim Preisig Stephan Esch

12 12 To our shareholders: freenet AG on the capital market: Performance of the freenet share freenet AG on the capital market Performance of the freenet share Figure 1: Performance of the freenet share in 2013 (indexed; 100 = Xetra closing price on 29 March 2013) 150 % 140 % 130 % 120 % 110 % 100 % 90 % 80 % 70 % April May June July August Sept. Oct. Nov. Dec. Jan. Feb. March freenet AG TecDAX SDAX German stock market While overall economic growth in the real sector gathered pace again in the first quarter, the mood on the German stock market was mixed. Stock trading in Germany was dominated by long-term investors foreign purchases in the quarter under review. The focus of buyer interest was on dividend-bearing stocks. In contrast to this, domestic investors were increasingly neutral in their behaviour. This is probably due to the fact that market players felt that the share price was relatively high. Nevertheless, an upward trend set in from the middle of March without any major dips. Economic policy with regard to existing risks in the eurozone continues to set the tone for further growth on the capital market as well. Against this backdrop, the German stock market trended sideways in the first quarter of While the DAX closed at 9,556 points on 31 March 2014 and therefore remained virtually unchanged in first quarter, the TecDAX recorded a sharp increase of 7 per cent to 1,252 points in the reporting period.

13 To our shareholders: freenet AG on the capital market: The freenet share 13 The freenet share The freenet share continued to gain in value significantly in the quarter under review. The share started the new year with a Xetra daily closing price of euros, and continued to trend dynamically throughout the quarter, ending at euros. The average Xetra daily closing price in the reporting period was euros. Over the past quarter, around 32.8 million freenet shares were traded on the electronic trading platform Xetra compared with 31.8 million in the fourth quarter of 2013 and 29.9 million in Q The proportion traded on alternative exchanges (dark pools) fell to 40 per cent of the total volume traded in the first quarter, down from 42 per cent in the preceding quarter and 50 per cent in the third quarter of The average daily volume traded on Xetra amounted to around 512,000 shares in the reporting period. An average of 517,000 freenet shares were traded per day on Xetra in the previous quarter, and 453,000 in the third quarter of With a rise in price of approximately 17 per cent during the first three months of the current financial year, the freenet share developed much better than its benchmark index, TecDAX, which was only able to achieve an increase of 7 per cent in the same period. In contrast, the SXKP index, in which European telecoms companies are compiled, posted a slight decrease of 1 per cent in the first quarter of In a twelve-month comparison, the freenet AG share saw a rise of 34 per cent and trended just as dynamically as the TecDAX, while the SXKP only improved by 23 per cent. Dividend The Executive Board and Supervisory Board have decided to propose the payment of a dividend for the 2013 financial year in the amount of 1.45 euros per no-par-value share from net income to the Annual General Meeting on 13 May This corresponds to a dividend payout ratio of around 72.5 per cent of free cash flow in Shareholder structure freenet AG s share capital totals 128,061,016 euros and is divided into 128,061,016 no-par-value bearer shares. Each share represents 1.00 euro of the share capital. According to the voting rights disclosures received pursuant to Section 21 of the German Securities Trading Act (WpHG), freenet s shareholder structure changed as follows during the reporting period: On 24 January 2014, LSV ASSET MANAGEMENT (USA) informed us that it had exceeded the 3 per cent reporting threshold on 14 September Its share of the voting rights in freenet AG on this day amounted to 3.04 per cent (3,897,259 voting rights).

14 14 To our shareholders: freenet AG on the capital market: Shareholder structure On 6 February 2014, BlackRock (USA) informed us that it had exceeded the 5 per cent reporting threshold on 4 February. Its share of the voting rights in freenet AG on this day amounted to 5.05 per cent (6,465,114 voting rights). On 19 March 2014, J. P. Morgan (USA) informed us that it had exceeded the 3 per cent reporting threshold on 13 March. Its share of the voting rights in freenet AG on this day amounted to 3.08 per cent (3,943,983 voting rights). On 27 March 2014, LSV ASSET MANAGEMENT (USA) informed us that it had fallen below the 3 per cent reporting threshold on 25 March. Its share of the voting rights in freenet AG on this day amounted to 2.99 per cent (3,830,300 voting rights). State of Norway, Norges Bank: 3.02 % J. P. Morgan: 3.08 % BlackRock: 5.05 % Free float: % Source: freenet AG, 31 March 2014 Based on the voting rights disclosures received during the quarter under review, free float has decreased from per cent to per cent compared with the end of According to the definition of Deutsche Börse AG, the free float continues be 100 per cent.
. On 27 March 2014, LSV ASSET MANAGEMENT (USA) informed us that it had fallen below the 3 per cent reporting threshold on 25 March.")
15 15

16 Interim group management report

17 Interim group management report: Economic report: Business performance 17 Economic report Business performance As an independent service provider, freenet AG serves the growing digital lifestyle market with integrated product worlds, affordable mobile tariffs and customer-oriented services, in all of Germany s mobile telecommunications networks. The portfolio encompasses the company s own tariffs and services in the traditional business segment of mobile communications/mobile internet and corresponding services from network operators in Germany. In addition to this, the company offers innovative digital applications relating to entertainment and infotainment, data security, home automation and security including the latest smartphones, tablets and notebooks as end devices and attractive accessories. Private customers make up the key target group as part of a multi-brand strategy. In view of the intense level of competition in the industry, the main brand, mobilcom-debitel, concentrates primarily on high-quality contractual relationships when acquiring customers and managing existing ones, while freenet s discount brands successfully cover the no-frills segment. In the first three months of the 2014 financial year, the company continued to pursue its successful strategy relating to digital lifestyle and mobile communications/mobile internet, and increased its products, services and activities in this segment. Upgraded digital lifestyle services mobilcom-debitel has been offering the add-on service GameFlat since May 2013 with a variety of current Gameloft premium games for all new and existing customers who subscribe to its voice and data tariffs. In mid-january 2014, another option for Android smartphones and tablets was added in the form of GamePack Plus. This gives gaming enthusiasts access to Freemium Games for 3.99 euros a month. Moreover, when playing the blockbusters most of which are free such as Asphalt 8, Dungeon Hunter 4, Modern Combat 4 or Real Football 2013, they can purchase virtual goods and features to improve their chances of success. GamePack Plus users receive starting credit of at least 3.99 euros for every available game and there is no limit of the number of downloads. After the contract expires (24 months), the games remain in the possession of the user. Subsequently, several promotions were launched in February offering smartphones, tablets and other digital lifestyle products from various premium manufacturers at low prices usually in combination with attractive voice and data tariffs. The offers included: The Samsung Galaxy S3 mini for a one-off payment of 1.00 euro with the Smart Surf tariff. The package cost euros per month, including 1 GB of data and 50 free minutes to any German network. The iphone 5c for a special price of euros, available from the subsidiary GRAVIS. A Samsung package consisting of the Galaxy S4 mini smartphone and the Galaxy Tab plus a voice/data tariff, which offers savings of around euros over buying the two devices separately.

18 18 Interim group management report: Economic report: Business performance The Nokia Lumia 520 for 9.99 euros including a free Microsoft Xbox 360 and the Flat Light 100 tariff with 100 free minutes, 3,000 text messages and a flat-rate mobile data package with 250 MB included for euros per month. The Sony Xperia Tablet Z for 1 euro in combination with the data tariff Internet Flat 3,000 special for a reduced price of euros per month and the data volume increased from 3.0 to 4.5 GB during the first twelve months of the contract. The Samsung Galaxy S4 mini for a one-off payment of euros or the LG G2 and Sony Xperia Z1 each for euros in combination with the Red XS tariff from Vodafone for euros per month. Red XS includes an any-network flat-rate voice tariff and a flatrate text message tariff to any German network, as well as a mobile internet data volume of 200 MB and maximum speeds of 14.4 MBit. As part of its Digital Valentine promotion, GRAVIS offered an additional range of products at a particularly low price when customers bought two together under the motto Experience more together. For instance, two sets of earphones from Urbanears Plattan for a total price of euros a saving of over 30 per cent compared with offers available online. Also in February, mobilcom-debitel widened the scope of its mobilcom-debitel cloud available as an add-on since April last year with the cost remaining unchanged. With the Cloud Basic option, costing 1.99 euros per month, the user now receives 40 GB of storage space, while Cloud Pro gives customers 80 GB of storage space for a monthly fee of 3.99 euros. All existing cloud customers are also able to take advantage of the extra capacity without paying more. At the same time, the functions of the Web interface were improved, together with the app to access the cloud, with convenient rights administration options to ensure maximum data security. In addition to this, the PC and Mac desktop clients were updated to further simplify operation and facilitate desktop syncing. Cheaper smartphone tariffs in the discount segment In the no-frills segment, freenet s discount brands once again made waves in the first quarter of 2014, not least as a result of a range of limited promotions on special deal platforms such as crash.tarife.de or Groupon. For instance, in February the subsidiary klarmobil s any-network flat rate was available at a monthly rate of euros using the D1 network with unlimited calls to any German network, 3,000 free text messages and 500 MB of data per month. This was followed in March by the any-network flat rate using the D2 network for euros per month, with a special bonus for taking your number with you and two months for free a saving of euros over the regular price with a contract term of two years. The any-network starter tariff was even cheaper, at just 9.95 euros per month with 200 MB of data, 200 free minutes and 200 free text messages also with a bonus for taking your number with you. Customers could

19 Interim group management report: Economic report: Business performance 19 even secure three months free with the mobile data tariff Flat-to-go with 500 MB of data on the O2 3G network, followed by a monthly fee of 9.95 euros. In February, the Talk Allnet comfort tariff was available under the Talkline brand on the O2network for a discounted price of euros for the first 24 months with free minutes to any German network and 500 MB of downloads at speeds of 7.2 Mbit per second. Finally, freenetmobile permanently cut the price of its freeflat tariff to euros per month. This gives users unlimited calls to any German network in D1 quality plus 250 MB of high-speed data.... and at mobilcom-debitel Various tariffs from the main brand mobilcom-debitel have been upgraded further over the course of the past few months. For instance, in the case of Real Allnet, the data volume was doubled to 1 GB and there was a monthly discount of euros on a second card linked to a signed contract. In the Flat 4 You tariff, the monthly basic fee was cut in half to euros at the beginning of March. The offer for the Vodafone network includes a flat rate for same-network calls and another flat rate to German landlines or alternatively to another mobile network of the customer s choice. The tariff also includes 3,000 free text messages, an internet flat rate which is reduced to GPRS speed after more than 300 MB is downloaded in a month, and the Samsung Galaxy S4 mini smartphone at a price of 1 euro. In March, new customers choosing the Flex Basic tariff with no basic monthly fees and considerable flexibility for users received a fuel voucher worth euros. In addition to this, the new Flex 100 tariff offers a considerable range of options with 100 units included for 4.99 euros per month, which can be used for calls and text messages to any German network. Enhancing service and driving up sales freenet AG constantly works to improve its customer proximity and services. This includes, for instance: Optimising the number, structure and design of its own shops. Expanding sales activities, platforms and partnerships. Implementing projects to improve customer service on a continual basis. The Balance project which was rolled out in 2013 forms part of this overall strategy. It uses intelligent routing to ensure that each customer query is handled by a service agent with the appropriate skill set, regardless of whether the customer contacts the company by telephone, , fax or post. The first few weeks and months of the current financial year showed that the project has already produced excellent results, in both senses of the word. Customer satisfaction levels increased significantly in a short space of time, inactive call times were reduced as a result of new automated workload distribution, and off-peak times in the call centre were handled more efficiently.

20 20 Interim group management report: Economic report: Key drivers of the business development Consequently, the Head of Customer Care at mobilcom-debitel, Birgit Geffke, received an award for Call Centre Manager of the Year. freenet AG subsidiaries have also set their sights on achieving the greatest possible degree of customer proximity. For instance, GRAVIS which for many years was an exclusive Apple dealer but since the takeover has become a broad-based digital lifestyle provider is currently introducing the innovative service Yapital. This enables customers at its 34 stores across the country and in its online shop to make use of the Otto Group s multi-channel payment service. mobilcom-debitel will also further intensify its sales cooperation with Kabel Deutschland. Germany s largest cable network operator will have its own wall-mounted screen in the 320 or so mobilcom-debitel shops in its distribution area to improve the presentation of the firms joint internet and TV product s. Key drivers of the business development Customer development In million Mobile Communications customers Thereof Customer Ownership Thereof postpaid customers Thereof no-frills customers Thereof prepaid cards Despite persistently tough competition on the market, the number of contract customers rose slightly in the first quarter of The increase over the previous quarter amounts to around 10,000 customers, with a postpaid customer base of 5.87 million as at 31 March This means we were able to grow this customer group, which is a key focus for our strategic business approach, following a period of stabilisation in 2012 and slight growth in In a year-onyear comparison, the increase translates into some 70,000 customers. In our view, this positive development is attributable to the constantly updated range of products we offer with attractive contract tariffs in conjunction with rising customer demand for data usage with modern smartphones. We also further increased our customer base in the second strategically important customer group, the no-frills segment. The quarterly rise of 20,000 to 2.92 million customers as at 31 March 2014 is evidence of the ongoing growth in this discount market segment, in which we primarily use online sales channels to serve particularly price-sensitive customers who need less individual advice. A year-on-year comparison illustrates the persistently dynamic trend in this market segment, revealing growth of around 250,000 customers.

21 Interim group management report: Economic report: Key drivers of the business development 21 Accordingly, our Customer Ownership which includes the postpaid and no-frills customer groups and serves as a key performance indicator for our company rose slightly by 30,000 (0.3 per cent) in the reporting period. This represents a 320,000 increase in our customer base, taking it to 8.79 million and corresponding to a rise of approximately 3.8 per cent compared with the first quarter of The number of prepaid SIM cards in circulation continued to fall as expected in a year-on-year comparison, amounting to 4.34 million cards on 31 March At the end of 2013, the number of prepaid SIM cards in circulation totalled 4.53 million. The number was down by 0.9 million cards year on year (31 March 2013: 5.24 million cards). This further fall is the result of more inactive SIM cards being deactivated by network operators. This means the total number of mobile customers declined by approximately 160,000 to million compared with the end of 2013 (13.29 million customers). Consequently, the customer base has shrunk by around 580,000 compared with the same period of the previous year (13.71 million). Monthly average revenue per user (ARPU) in the Mobile Communications segment In EUR Q1/2014 Q4/2013 Q3/2013 Q2/2013 Q1/2013 Contract customer No-frills customer Prepaid cards The average monthly revenue per contract customer (postpaid ARPU) fell to euros in Q1 2014, 0.40 euros below the level of the previous quarter. The decline amounted to 1.20 euros compared with the same period of 2013 (22.40 euros). This was primarily attributable to unrelenting price competition on the German market. This means that some freenet customers with older contracts, which in some cases still have relatively high basic monthly fees, are also switching to the current smartphone tariffs on offer. At 2.90 euros, the average monthly revenue per no-frills customer in the quarter under review (no-frills ARPU) remained virtually unchanged compared with the previous quarter (3.00 euros). However, the no-frills ARPU was 0.60 euros lower than in the first quarter of 2013 (3.50 euros). This trend also reflects competitive pressure e. g. from sales promotions in this price-sensitive market. The no-frills segment primarily caters for particularly price-conscious mobile communications customers who take out contracts online. Prepaid ARPU in the first quarter of 2014 came to 2.70 euros, which corresponds to a decline of 0.30 euros over the previous quarter and 0.10 euros compared with the same period of the previous year.
How To Profit From Freenet
 Preliminary results 2012 Analyst and Investor Conference Call Hamburg, 1 March 2013 Cautionary statement This presentation contains forward-looking statements which involve risks and uncertainties. The
Management Presentation Q2/2012 Results. 8 August 2012
 Management Presentation Q2/2012 Results 8 August 2012 Cautionary statement This presentation contains forward-looking statements which involve risks and uncertainties. The actual performance, results and
TO OUR SHAREHOLDERS PROFITABLE GROWTH COURSE INTERNATIONALIZATION FURTHER EXTENDED US MARKET IN FOCUS
 QUARTERLY STATEMENT AS OF MARCH 31, 2015 TO OUR SHAREHOLDERS Patrik Heider, Spokesman of the Executive Board and CFOO The Nemetschek Group has made a dynamic start in the 2015 financial year and continues
TO OUR SHAREHOLDERS DYNAMIC FIRST HALF YEAR
 HALF YEAR REPORT AS OF JUNE 30, 2015 TO OUR SHAREHOLDERS Patrik Heider, Spokesman of the Executive Board and CFOO The Nemetschek Group maintained its dynamic development from the first quarter of 2015
Overview of the key figures for the first half of the year
 Half-Year Report 2015 Q2 Revenues increase in the first half of the year by 23% EBIT increased by 1.5 million euros compared to the previous year Order book is growing Overall annual forecast remains unchanged
Consolidated Interim Report
 Consolidated Interim Report as of 31 March 2015 UNIWHEELS AG CONTENTS 1. Key performance data 2. Condensed group management report as of 31 March 2015 3. Condensed consolidated financial statements as
HALF YEAR REPORT AS OF JUNE 30
 2 0 1 4 HALF YEAR REPORT AS OF JUNE 30 T O O U R S H A R E H O L D E R S Dear shareholders, ladies and gentlemen, The Nemetschek Group continued its successful development in the second quarter of 2014
Logwin AG. Interim Financial Report as of 31 March 2015
 Logwin AG Interim Financial Report as of 31 March 2015 Key Figures 1 January 31 March 2015 Earnings position In thousand EUR 2015 2014 Revenues Group 274,433 278,533 Change on 2014-1.5% Solutions 101,821
9-MONTHS REPORT. Stable development of business in Q3 Lila Logistik confirms full-year forecast
 /08 9-MONTHS REPORT Stable development of business in Q3 Lila Logistik confirms full-year forecast Key figures for the first three quarters of 2008 in accordance with IFRS 01.01. 01.01. Change in Change
Drillisch AG Company Presentation. August 2014
 Drillisch AG Company Presentation August 2014 Part 1: A Successful H1-2014 Part 2: Drillisch MBA MVNO Agreement Part 3: Guidance and Outlook Page 2 Agenda Highlights H1-2014 Trends in the Mobile Communications
Letter from the Management Board 3. Key Financial Figures 4. Management Report 5. Consolidated Income Statement (IFRS) 9
 9") 3-Months Report 2015 Content Letter from the Management Board 3 Key Financial Figures 4 Management Report 5 Consolidated Income Statement (IFRS) 9 Consolidated Statement of Comprehensive Income (IFRS)
3-Months Report 2015 Content Letter from the Management Board 3 Key Financial Figures 4 Management Report 5 Consolidated Income Statement (IFRS) 9 Consolidated Statement of Comprehensive Income (IFRS)
Interim consolidated financial statements as of September 30, 2007
 1 Interim consolidated financial statements as of September 30, 2007 January 1 through September 30, 2007 MeVis Medical Solutions AG laying the foundation for further dynamic growth: Sales plus other operating
Interim report as at 30 September 2014
 Interim report as at 30 September 2014 Fielmann increases unit sales, revenue and profit Result registers significant growth in the 3 rd quarter of 2014 Fielmann trains more than 2,900 opticians Fielmann
Interim Report 201. Celesio AG. report as of 30 September 2015
 Interim Report 201 Celesio AG H1 Half-year financial report as of 30 September 2015 The Celesio Group Celesio is a leading international wholesale and retail company and provider of logistics and services
2015 Quarterly Report II
 2015 Quarterly Report II 2 Key data Eckert & Ziegler 01 06/2015 01 06/2014 Change Sales million 69.0 61.9 + 11 % Return on revenue before tax % 16 % 9 % + 87 % EBITDA million 15.6 9.7 + 61 % EBIT million
DEUFOL SE JOHANNES-GUTENBERG-STR. 3 5 65719 HOFHEIM (WALLAU), GERMANY PHONE: + 49 (61 22) 50-00 FAX: + 49 (61 22) 50-13 00 WWW.
, GERMANY PHONE: + 49 (61 22) 50-00 FAX: + 49 (61 22) 50-13 00 WWW.") SEMI-ANNUAL REPORT 5 Key Figures for the Deufol Group figures in thousand 6M 2015 6M 2014 Results of operations Revenue (total) 152,088 141,450 Germany 83,770 77,730 Rest of the World 68,318 63,720 International
SEMI-ANNUAL REPORT 5 Key Figures for the Deufol Group figures in thousand 6M 2015 6M 2014 Results of operations Revenue (total) 152,088 141,450 Germany 83,770 77,730 Rest of the World 68,318 63,720 International
CONSOLIDATED INTERIM FINANCIAL STATEMENTS
 CONSOLIDATED INTERIM FINANCIAL STATEMENTS AND GROUP INTERIM MANAGEMENT REPORT SECOND QUARTER OF 2008 JUNE 30, 2008 FRANCONOFURT AG FRANKFURT AM MAIN FRANCONOFURT AG, FRANKFURT AM MAIN CONSOLIDATED INTERIM
Quarter Report 2014 ESSANELLE HAIR GROUP AG
 Quarter Report 2014 ESSANELLE HAIR GROUP AG Q1 2 Q1/2014 ESSANELLE HAIR GROUP KEY FIGURES for 1 January to 31 March 2014/2013 (IFRS) million 2014 2013 Change* Consolidated sales 32.3 30.8 +4.7% essanelle
Interim report as at 30 September 2015
 Interim report as at 30 September 2015 Fielmann improves unit sales, revenue and profit Specialists of tomorrow: 3,000 apprentices Fielmann creates 500 new jobs Fielmann Aktiengesellschaft Group interim
Quarterly Financial Report March 31, 2009. MBB Industries AG. Berlin
 Quarterly Financial Report March 31, 2009 MBB Industries AG. Berlin Quarterly Financial Report March 31, 2009 MBB Industries AG MBB Industries in Numbers 03 MBB Industries in Numbers Three Month (Jan.
CONSOLIDATED STATEMENT OF INCOME
 CONSOLIDATED STATEMENT OF INCOME Notes Sales 1) 5,429,574 5,169,545 Cost of Goods Sold 2) 3,041,622 2,824,771 Gross Profit 2,387,952 2,344,774 Selling Expenses 3) 1,437,010 1,381,132 General and Administrative
Group 9-month report Bastei Lübbe AG 1 Apr - 31 Dec 2015
 Group 9-month report Bastei Lübbe AG 1 Apr - 31 Dec 2015 At a Glance Key figures (IFRS) 01/04/2015-2015 01/04/- Change in % Business development in million Group turnover 79.4 86.8-8.5 % EBITDA 14.0 11.5
Interim report as at 31 March 2015
 Interim report as at 31 March 2015 Increase of unit sales, revenue and profit Dividend raises to 1.60 per share Fielmann expects continuation of positive business performance Fielmann Aktiengesellschaft
Interim report as at 31 March 2014. Unit sales, revenue and profit increase Dividend increases to 2.90 per share Stock split ratio of two-for-one
 Interim report as at 31 March 2014 Unit sales, revenue and profit increase Dividend increases to 2.90 per share Stock split ratio of two-for-one Fielmann Aktiengesellschaft Group interim report as at 31
Overview of the key figures for the first nine months
 Continued revenue growth: up 12% on previous year Results impacted by revenue structure and one-off effects High volume of orders: outlook remains optimistic Q3 Overview of the key figures for the first
Key figures as of June 30, 2013 1st half
 Never standing still. Interim Report as of June 30, 2013 Contents 2 Key figures as of June 30, 2013 1st half 3 Key figures as of June 30, 2013 2nd quarter 6 Strong revenue growth 12 Consolidated interim
Interim Report 2014 January - June
 Interim Report 2014 January - June Letter to the shareholders Interim Report Jan Jun 2014 RIB Software AG Dear Shareholders, The Chinese Year of the Horse has met the high expectations placed on it within
INTERIM REPORT Q3 FY2015
 REVENUE +23.2 % YOY [TO 160.4 M IN Q3 FY15 ] INTERIM REPORT Q3 FY2015 ADJUSTED EBIT +10.6 % YOY [TO 19.8 M IN Q3 FY15 ] ADJUSTED PROFIT 9.5 M [ Q3 FY14: 11.3 M ] CONTENT 01 KEY FIGURES 02 HIGHLIGHTS 03
Ahlers AG, Herford. ISIN DE0005009708 and DE0005009732 INTERIM REPORT
 Ahlers AG, Herford ISIN DE0005009708 and DE0005009732 I N T E R I M R E P O R T for the first six months of the 2006/07 financial year (December 1, 2006 to May 31, 2007) BUSINESS DEVELOPMENT IN THE FIRST
2013 HALF YEAR REPORT AS OF JUNE 30
 2013 HALF YEAR REPORT AS OF JUNE 30 To our shareholders Tanja Tamara Dreilich, Executive Board Dear shareholders, ladies and gentlemen, In the second quarter we were able to continue the solid development
Unaudited Nine Months Financial Report
 RECRUITING SERVICES Amadeus FiRe AG Unaudited Nine Months Financial Report January to September 2015 Temporary Staffing. Permanent Placement Interim Management. Training www.amadeus-fire.de Unaudited Nine
ARM Holdings plc Consolidated balance sheet - IFRS
 ARM Holdings plc Consolidated balance sheet - IFRS 30 June 31 December 2010 2009 Unaudited Audited 000 000 Assets Current assets: Financial assets: Cash and cash equivalents 53,746 34,489 Short-term investments
Consolidated balance sheet
 83 Consolidated balance sheet December 31 Non-current assets Goodwill 14 675.1 978.4 Other intangible assets 14 317.4 303.8 Property, plant, and equipment 15 530.7 492.0 Investment in associates 16 2.5
SoftBank Corp. Consolidated Financial Report For the three-month period ended June 30, 2014 (IFRS)
") This English translation of the financial report was prepared for reference purposes only and is qualified in its entirety by the original Japanese version. The financial information contained in this
This English translation of the financial report was prepared for reference purposes only and is qualified in its entirety by the original Japanese version. The financial information contained in this
ATS AUTOMATION TOOLING SYSTEMS INC.
 Interim Consolidated Financial Statements For the period ended June 29, 2014 (Unaudited) (Condensed) Interim Consolidated Statements of Financial Position (in thousands of Canadian dollars unaudited) June
6-Month Report 2013 Focus on the Essence
 6-Month Report 2013 Focus on the Essence Page 2 AUGUSTA 6-Month Report 2013 Key Figures in EUR thousand Q2 2012 Q2 2013 1 HY 2012 1 HY 2013 Key figures for consolidated statement of comprehensive income
Note 2 SIGNIFICANT ACCOUNTING
 Note 2 SIGNIFICANT ACCOUNTING POLICIES BASIS FOR THE PREPARATION OF THE FINANCIAL STATEMENTS The consolidated financial statements have been prepared in accordance with International Financial Reporting
Consolidated financial statements
 Summary of significant accounting policies Basis of preparation DSM s consolidated financial statements have been prepared in accordance with International Financial Reporting Standards (IFRS) as adopted
Interim Financial Statements 30 July 2014
 KPN Condensed Consolidated Interim Financial Statements Q2 2014 1 KPN Interim Financial Statements For the six months ended 30 June 2014 Condensed Consolidated Interim Financial Statements for the six
Condensed consolidated income statement
 RESTATED AND PREVIOUSLY COMMUNICATED (OLD) QUARTERLY INFORMATION FOR Fortum signed the agreement to sell its Swedish distribution business on 13 March 2015, which concludes Fortum s divestment of its electricity
T-MOBILE USA REPORTS SECOND QUARTER OF 2011 RESULTS
 T-MOBILE USA REPORTS SECOND QUARTER OF RESULTS Adjusted OIBDA of $1.3 billion in the second quarter of, up from $1.2 billion in the first quarter of but down from $1.4 billion in the second quarter of
IFrS. Disclosure checklist. July 2011. kpmg.com/ifrs
 IFrS Disclosure checklist July 2011 kpmg.com/ifrs Contents What s new? 1 1. General presentation 2 1.1 Presentation of financial statements 2 1.2 Changes in equity 12 1.3 Statement of cash flows 13 1.4
ILLUSTRATIVE FINANCIAL STATEMENTS YEAR ENDED 31 DECEMBER 2013 International Financial Reporting Standards
 ILLUSTRATIVE FINANCIAL STATEMENTS YEAR ENDED 31 DECEMBER 2013 International Financial Reporting Standards 2 A Layout (International) Group Ltd Annual report and financial statements For the year ended
How To Calculate Earnings In Euro
 3 MONTH REPORT AS AT 31 DECEMBER 2014 KEY FIGURES IFRS in KEUR 10/2014 12/2014 10/2013 12/2013 Difference in % Earnings situation Sales revenues 61,403 56,296 5,107 9% EBITDA 7,159 5,901 1,258 21% EBITDA
Interim Report. January - September
 Interim Report January - September LETTER TO THE SHAREHOLDERS RIB SOFTWARE AG LETTER TO THE SHAREHOLDERS Dear Shareholders, With two strategic acquisitions in the third quarter of, we have taken a further
Definitions of Terms
 Definitions of Terms Operating and financial measures are utilized by T-Mobile's management to evaluate its operating performance and, in certain cases, its ability to meet liquidity requirements. Although
Consolidated Statement of Profit or Loss (in million Euro)
") Consolidated Statement of Profit or Loss (in million Euro) Q2 2012 Q2 2013 % H1 2012 H1 2013 % Restated * change Restated * change Revenue 779 732-6.0% 1,513 1,437-5.0% Cost of sales (553) (521) -5.8%
Consolidated Statement of Profit or Loss (in million Euro) Q2 2012 Q2 2013 % H1 2012 H1 2013 % Restated * change Restated * change Revenue 779 732-6.0% 1,513 1,437-5.0% Cost of sales (553) (521) -5.8%
3-month report January - March 2007 Published on August 10, 2007
 3-month report January - March 2007 Published on August 10, 2007 3-month report January March 2007 1. Group management report for the first quarter of 2007 Overview of the first quarter in 2007 Continued
Financial statements of the EnBW Group 2014
 Financial statements of the EnBW Group 204 Version without management report 204 financial statements of the EnBW Group Financial statements of the EnBW Group Income statement 2 (6) Income tax refund
International Financial Reporting Standard 5 Non-current Assets Held for Sale and Discontinued Operations
 EC staff consolidated version as of 21/06/2012, FOR INFORMATION PURPOSES ONLY EN IFRS 5 International Financial Reporting Standard 5 Non-current Assets Held for Sale and Discontinued Operations Objective
IFRS. Disclosure checklist. August 2012. kpmg.com/ifrs
 IFRS Disclosure checklist August 2012 kpmg.com/ifrs Contents About this publication 1 What s new? 2 The Checklist 3 1. General presentation 3 1.1 Presentation of financial statements 3 1.2 Changes in equity
SAGICOR FINANCIAL CORPORATION
 Interim Financial Statements Nine-months ended September 30, 2015 FINANCIAL RESULTS FOR THE CHAIRMAN S REVIEW The Sagicor Group recorded net income from continuing operations of US $60.4 million for the
2014/2015 The IndusTrIal Group
 Q1 2014/2015 Interim Report 1 April to 30 june 2014 The Industrial Group The essentials at a glance in the first quarter Big increase in incoming orders, sales on par with previous year, earnings considerably
2014/2015 The IndusTrIal Group
 Q2 2014/2015 Half-Year Interim Report 2014/2015 1 April to 30 September 2014 The Industrial Group The first six months of financial year 2014/2015 at a glance Incoming orders increased in the first half
Unaudited Financial Report
 RECRUITING SERVICES Amadeus FiRe AG Unaudited Financial Report Quarter I - 2015 Temporary Staffing. Permanent Placement Interim Management. Training www.amadeus-fire.de Unaudited Amadeus FiRe Group Financial
SKW Metallurgie s World in Figures
 Report for the 3 rd Quarter 2014 SKW Metallurgie s World in Figures Key Figures Unit Q1-3 2014 Q1-3 2013 P&L Revenues EUR mill 234.8 243.6 EBITDA EUR mill 13.6 15.0 EBIT EUR mill -56.4 7.4 EBT EUR mill
N Brown Group plc Interim Report 2013
 N Brown Group plc Interim Report 2013 2013 4CUSTOMER CENTRIC SEGMENTS FINANCIAL SUMMARY Financial Highlights 2013 2012 Revenue 409.6m 379.3m Operating profit 48.4m 45.7m Adjusted profit before taxation*
FINANCIAL REPORT H1 2014
 FINANCIAL REPORT H1 2014 HIGH SPEED BY PASSION 02_Key Figures 03_Group Status Report 05_Consolidated Financial Statements 10_Notes 11_Declaration of the Legal Representatives 02 PANKL KEY FIGURES EARNING
Elements of a Pharmaceutical Spending in the United Kingdom
 Half-yearly Financial Report January 1 June 30, engineering for a better world GEA Group: Key IFRS figures GEA Group: Key IFRS figures (EUR million) Q2 Q2 1 Q1-Q2 Q1-Q2 1 Results of operations Order intake
Financial Results. siemens.com
 s Financial Results Fourth Quarter and Fiscal 2015 siemens.com Key figures (in millions of, except where otherwise stated) Volume Q4 % Change Fiscal Year % Change FY 2015 FY 2014 Actual Comp. 1 2015 2014
Financial Report 9M 2014
 Financial Report 9M 2014 1 von 10 12.11.14 13:19 1. Financial Summary Income (in TEUR) 9M 2014 9M 2013 Revenues 9,485 9,992 Software & Subscriptions 8,668 8,127 Services 817 1,865 EBIT 2,926 1,051 as a
Regulated information
 Regulated information JENSEN-GROUP Half Year Results 2012 1 Consolidated, not audited key figures: Income Statement 30/06/2012-30/06/2011 Non-audited, consolidated key figures (million euro) June 30, 2012
Financial statements of the EnBW Group 2015»
 Financial statements of the EnBW Group 201» Version without management report EnBW-Konzernabschluss 2014 1 Financial statements of the EnBW Group Income statement 2 (12) Investment properties 36 Statement
InVision AG Workforce Management Cloud Services Call Center Training. Financial Report 9M 2014
 Financial Report 9M 2014 Seite 1 von 7 1. Financial Summary Income (in TEUR) 9M 2014 9M 2013 Revenues 9,485 9,992-5% Software & Subscriptions 8,668 8,127 +7% Services 817 1,865-56% EBIT 2,926 1,051 +178%
How To Calculate Solvay'S Financial Results
 SOLVAC SOCIETE ANONYME Rue de Ransbeek 310 - B-1120 Brussels Belgium Tel. + 32 2 639 66 30 Fax + 32 2 639 66 31 www.solvac.be Press Release Embargo, 27 February 2015 at 5:40 p.m. Regulated information
Consolidated Statement of Profit or Loss (in million Euro)
") Consolidated Statement of Profit or Loss (in million Euro) Q3 2014 Q3 2015 % change 9m 2014 9m 2015 % change Revenue 636 661 3.9% 1,909 1,974 3.4% Cost of sales (440) (453) 3.0% (1,324) (1,340) 1.2% Gross
Consolidated Statement of Profit or Loss (in million Euro) Q3 2014 Q3 2015 % change 9m 2014 9m 2015 % change Revenue 636 661 3.9% 1,909 1,974 3.4% Cost of sales (440) (453) 3.0% (1,324) (1,340) 1.2% Gross
Unaudited Half Year Financial Report January June 2013. Creating career prospects and deploying targeted professional skills.
 Creating career prospects and deploying targeted professional skills Amadeus FiRe AG Unaudited Half Year Financial Report January June 2013 Unaudited Half Year Financial Report, January June 2013 1 Unaudited
Ströer continuing on its profitable course of digital growth in Q3 and significantly raising its guidance for both 2015 and 2016
 PRESS RELEASE Ströer continuing on its profitable course of digital growth in Q3 and significantly raising its guidance for both 2015 and 2016 Ströer anticipating consolidated revenue of between EUR 1.1b
CENIT AG Systemhaus. Industriestraße 52-54 D-70565 Stuttgart Tel: + 49 711 7825-30 Fax: + 49 711 7825-4000 Internet: http://www.cenit.
 9 Months Report 2007 CENIT AG Systemhaus Industriestraße 52-54 D-70565 Stuttgart Tel: + 49 711 7825-30 Fax: + 49 711 7825-4000 Internet: http://www.cenit.de Investor Relations: ISIN:DE0005407100 Fabian
Interim report as per March 31, 2015
 Interim report as per March 31, 2015 5 / General 5 / Group profile 7 / Economic report 12 / Outlook 14 / Consolidated balance sheet 15 / Consolidated statement of comprehensive income 16 / Statement
3 M O N T H S R E P O R T 2 O O 3 / 2 O O 4
 3 M O N T H S R E P O R T 2 O O 3 / 2 O O 4 Content 03 Hönle at a glance 04 Letter to the Shareholders 06 Management Report 09 Consolidated financial statement 17 Shareholdings of the corporate bodies
12.31.2014 CONSOLIDATED FINANCIAL STATEMENTS. (Unaudited figures)
") 12.31.2014 CONSOLIDATED FINANCIAL STATEMENTS (Unaudited figures) CONTENTS Consolidated financial statements Consolidated balance sheet 1 Consolidated income statement 3 Statement of net income and unrealised
12.31.2014 CONSOLIDATED FINANCIAL STATEMENTS (Unaudited figures) CONTENTS Consolidated financial statements Consolidated balance sheet 1 Consolidated income statement 3 Statement of net income and unrealised
In addition, Outokumpu has adopted the following amended standards as of January 1, 2009:
 1. Corporate information Outokumpu Oyj is a Finnish public limited liability company organised under the laws of Finland and domiciled in Espoo. The parent company, Outokumpu Oyj, has been listed on the
D.E MASTER BLENDERS 1753 N.V.
 UNAUDITED CONDENSED CONSOLIDATED INTERIM FINANCIAL STATEMENTS For the six months periods ended 31 December 2012 and 31 December 2011 TABLE OF CONTENTS UNAUDITED CONDENSED CONSOLIDATED INTERIM FINANCIAL
2 This Standard shall be applied by all entities that are investors with joint control of, or significant influence over, an investee.
 International Accounting Standard 28 Investments in Associates and Joint Ventures Objective 1 The objective of this Standard is to prescribe the accounting for investments in associates and to set out
OBRASCÓN HUARTE LAIN, S.A. AND SUBSIDIARIES. Consolidated financial statements and directors report for the year ended 31 December 2013
 OBRASCÓN HUARTE LAIN, S.A. AND SUBSIDIARIES Consolidated financial statements and directors report for the year ended 31 December 2013 CONTENT CONSOLIDATED FINANCIAL STATEMENTS Consolidated balance sheets
Consolidated Statement of Profit or Loss (in million Euro)
") Consolidated Statement of Profit or Loss (in million Euro) Q3 2013 Q3 2014 % change 9m 2013 9m 2014 % change Revenue 689 636-7.7% 2,126 1,909-10.2% Cost of sales (497) (440) -11.5% (1,520) (1,324) -12.9%
Consolidated Statement of Profit or Loss (in million Euro) Q3 2013 Q3 2014 % change 9m 2013 9m 2014 % change Revenue 689 636-7.7% 2,126 1,909-10.2% Cost of sales (497) (440) -11.5% (1,520) (1,324) -12.9%
Total revenue (incl share of joint ventures) 1,082.2m 1,017.8m +6.3% EBITDA* 40.0m 40.0m +0.0% EBITA* 32.7m 30.5m +6.9% EBIT* 31.3m 28.3m +10.
 1,082.2m 1,017.8m +6.3% EBITDA* 40.0m 40.0m +0.0% EBITA* 32.7m 30.5m +6.9% EBIT* 31.3m 28.3m +10.") Fyffes delivers further growth in revenue and earnings Preliminary Results Restated Change % Total revenue (incl share of joint ventures) 1,082.2m 1,017.8m +6.3% EBITDA* 40.0m 40.0m +0.0% EBITA* 32.7m
Fyffes delivers further growth in revenue and earnings Preliminary Results Restated Change % Total revenue (incl share of joint ventures) 1,082.2m 1,017.8m +6.3% EBITDA* 40.0m 40.0m +0.0% EBITA* 32.7m
Abbey plc ( Abbey or the Company ) Interim Statement for the six months ended 31 October 2007
 Interim Statement for the six months ended 31 October 2007") Abbey plc ( Abbey or the Company ) Interim Statement for the six months ended 31 October 2007 The Board of Abbey plc reports a profit before taxation of 18.20m which compares with a profit of 22.57m for
Abbey plc ( Abbey or the Company ) Interim Statement for the six months ended 31 October 2007 The Board of Abbey plc reports a profit before taxation of 18.20m which compares with a profit of 22.57m for
Interim Financial Report for the period ending June 30, 2010. Kennzahlen I
 Interim Financial Report for the period ending June 30, 2010 Kennzahlen I Key figures for Synaxon AG (Group) in TEUR Q2/2010 Q2/2009 +/- in % 6-Mon 2010 6-Mon 2009 +/- in % 2009 Turnover 4,625 3,239 42.8
1st quarter interim financial report
 2011 1st quarter interim financial report Contents Contents 2 Contents 2 Management report Key fi gures 3 Letter to the shareholders 4 Earnings and performance 5 Financial position 6 Net worth 6 Risk report
INTERIM REPORT AS OF 30 JUNE 2015 Q2 2015 MOBILCOM-DEBITEL / FREENET / GRAVIS / FREENET DIGITAL / KLARMOBIL.DE / TALKLINE / MFE ENERGIE / MOTION TM
 INTERIM REPORT AS OF 30 JUNE 2015 Q2 2015 MOBILCOM-DEBITEL / FREENET / GRAVIS / FREENET DIGITAL / KLARMOBIL.DE / TALKLINE / MFE ENERGIE / MOTION TM 2 freenet AG Interim Report as of 30 June 2015 Q2/2015
Contact 6-Month Report 2005
 Contact 6-Month Report 2005 Security Networks AG Kronprinzenstrasse 30 45128 ssen Germany Phone: +49 (0) 201 54 54-0 Fax: +49 (0) 201 54 54-456 Internet: www..com -mail: investor.relations@.com Key figures
2014 Quarterly Report II
 2014 Quarterly Report II 2 Key data Eckert & Ziegler 01 06/2014 01 06/2013 Change Sales million 61.9 55.3 12% Return on revenue before tax % 9 % 12 % 26 % EBITDA million 9.7 10.2 5 % EBIT million 6.2 6.9
Interim report as at 30 June 2015
 Interim report as at 30 June 2015 Fielmann improves unit sales, revenue and profit Fielmann employs more than 1,000 trainees Fielmann expects positive business performance Fielmann Aktiengesellschaft Group
International Accounting Standard 12 Income Taxes. Objective. Scope. Definitions IAS 12
 International Accounting Standard 12 Income Taxes Objective The objective of this Standard is to prescribe the accounting treatment for income taxes. The principal issue in accounting for income taxes
TomTom reports first quarter 2012 results
 De Ruyterkade 154 1011 AC Amsterdam, The Netherlands corporate.tomtom.com ir@tomtom.com 25 April 2012 TomTom reports first quarter 2012 results Financial headlines - Group revenue of 233 million - Content
Financial Summary. as a % of balance sheet total
 InVision AG Financial Report 6M 2015 Consolidated Interim Financial Statements of InVision AG as of 30 June 2015 in accordance with IFRS and 315a of the German Commercial Code as well as the Group management
Quarterly Report II/2004
 Quarterly Report II/ Foreword Group management report Dear Shareholders, Result of operations Stagnating share prices and declining trading volumes dominated the German stock exchanges in Q2. The hike
Kabel Deutschland Holding AG Unterfoehring. Interim Condensed Consolidated Financial Statements Pursuant to Section 37w WpHG
 Kabel Deutschland Holding AG Unterfoehring Interim Condensed Consolidated Financial Statements Pursuant to Section 37w WpHG for the Quarter and the Six Months Ended September 30, 2012 TABLEOFCONTENTS
Logwin AG. Interim Financial Report as of 30 September 2015
 Logwin AG Interim Financial Report as of 30 September 2015 Key Figures 1 January 30 September 2015 Earnings position In thousand EUR 2015 2014 Revenues Group 805,065 842,390 Change on 2014-4.4% Solutions
Quarterly Financial Report. as of March 31, 2010. Qarterly Financial Report. as of March 31, 2010
 Quarterly Financial Report as of March 31, 2010 Qarterly Financial Report as of March 31, 2010 PULSION Quarterly Financial Report as at March 31, 2010 1 PULSION at a glance PULSION (Group) according to
CONSOLIDATED FINANCIAL STATEMENTS
 Consolidated financial statements CONSOLIDATED FINANCIAL STATEMENTS Consolidated balance sheet ASSETS IFRS (In millions of euros) December 31, 2009 December 31, 2008 Cash, due from central banks Note 5
2OO 6 9 MONTHS REPORT 2OO 7
 2OO 6 9 MONTHS REPORT 2OO 7 Hönle at a glance Hönle Group Figures 1) 2006/2007 2005/2006 Changes 9 months 9 months Income Statement T T in % Revenues 19,055 17,081 11.6 EBITDA 3,504 2,661 31.7 EBIT 3,005
Consolidated Financial Statements Notes to the Consolidated Financial Statements for Fiscal Year 2014
 171 The most important exchange rates applied in the consolidated financial statements developed as follows in relation to the euro: Currency Average rate Closing rate Country 1 EUR = 2014 2013 2014 2013
CONSOLIDATED PROFIT AND LOSS ACCOUNT For the six months ended June 30, 2002
 CONSOLIDATED PROFIT AND LOSS ACCOUNT For the six months ended June 30, 2002 Unaudited Unaudited Note Turnover 2 5,576 5,803 Other net losses (1) (39) 5,575 5,764 Direct costs and operating expenses (1,910)
The consolidated financial statements of
 Our 2014 financial statements The consolidated financial statements of plc and its subsidiaries (the Group) for the year ended 31 December 2014 have been prepared in accordance with International Financial
How To Report Third Quarter 2013 Results From Tomtom.Com
 De Ruyterkade 154 1011 AC Amsterdam, The Netherlands corporate.tomtom.com ir@tomtom.com 30 October 2013 TomTom reports third quarter 2013 results Financial summary Group revenue of 244 million (Q3 '12:
International Accounting Standard 12 Income Taxes
 EC staff consolidated version as of 21 June 2012, EN IAS 12 FOR INFORMATION PURPOSES ONLY International Accounting Standard 12 Income Taxes Objective The objective of this Standard is to prescribe the
FRANCOTYP-POSTALIA HOLDING AG. The Digital Mailroom
 FRANCOTYP-POSTALIA HOLDING AG The Digital Mailroom INTERIM REPORT FOR THE FIRST NINE MONTHS 2015 KEY FIGURES FIGURES IN ACCORDANCE WITH CONSOLIDATED FINANCIAL STATEMENTS IN EUR MILLION 1.1 30.9.2015 1.1.