Prediction of Adjusted Net National Income Per Capita of Countries
|
|
|
- Beatrix Jennings
- 7 years ago
- Views:
Transcription
1 Prediction of Adjusted Net National Income Per Capita of Countries
2 Introduction to the Research Question The purpose of this study was to identify the best predictors for Adjusted Net National Income Per Capita of countries from multiple World Bank development indicators such as Exports of Goods and Services, Food Production Index, Foreign Direct Investment- Net Inflows, Forest Area, Gdp at Market Prices, and Gdp Growth As someone who has had a keen interest in the development of countries and the work of the World Bank in helping the development of countries, I will like to find out about the best development factors that will lead to an increase or decrease in the Adjusted Net National Income Per Capita of Countries. Such knowledge will enable countries, governments and stakeholders to make informed decisions and focus on the factors that will help increase their Adjusted Net National Income Per Capita without wasting much time and resources on indicators that do not count much. This, will in effect, help drive forward the development of each country.
3 Methods Sample The sample included N=248 countries and regions of the world for the years 2012 and The sample is made up of national, regional and global estimates. I am only looking at the 2012 data for this sample data. I will also be looking at all the 86 variables in the World Bank data for 2012 which will help predict the Adjusted Net National Income Per Capita of countries for that year 2012 and also help make future predictions of subsequent years, such as the year, 2013 Measures The Adjusted Net National Income Per Capita,(Current Us$), quantitative response variable, measures the Gross National Income (GNI) minus consumption of fixed capital and natural resources depletion. Predictors used in the algorithm are all quantitative and they are: Predictor x100_2012 x121_2012 x125_2012 x126_2012 Meaning Death Rate, Crude (Per 1,000 People) Exports Of Goods And Services (% Of Gdp) Fertility Rate, Total (Births Per Woman) Fixed Broadband Subscriptions (Per 100 People) x129_2012 Food Production Index ( = 100) x12_2012 x131_2012 x132_2012 x134_2012 x139_2012 Adjusted Savings: Carbon Dioxide Damage (% Of Gni) Foreign Direct Investment, Net Inflows (% Of Gdp) Foreign Direct Investment, Net Inflows (Bop, Current Us$) Forest Area (% Of Land Area) Gdp At Market Prices (Current Us$) x140_2012 Gdp Growth (Annual %) x142_2012 Gdp Per Capita (Current Us$) x143_2012 Gdp Per Capita Growth (Annual %) x146_2012 Gross Domestic Savings (% Of Gdp)
4 x149_2012 x14_2012 x150_2012 x153_2012 x154_2012 x155_2012 x156_2012 x157_2012 x15_2012 x161_2012 Health Expenditure Per Capita (Current Us$) Adjusted Savings: Consumption Of Fixed Capital (% Of Gni) Health Expenditure, Total (% Of Gdp) Household Final Consumption Expenditure, Etc. (% Of Gdp) Imports Of Goods And Services (% Of Gdp) Improved Sanitation Facilities (% Of Population With Access) Improved Water Source (% Of Population With Access) Incidence Of Tuberculosis (Per 100,000 People) Adjusted Savings: Consumption Of Fixed Capital (Current Us$) Industry, Value Added (% Of Gdp) x162_2012 Inflation, Consumer Prices (Annual %) x163_2012 x167_2012 x169_2012 x16_2012 x171_2012 x172_2012 x173_2012 Intentional Homicides (Per 100,000 People) Internet Users (Per 100 People) Labor Force, Female (% Of Total Labor Force) Adjusted Savings: Education Expenditure (% Of Gni) Life Expectancy At Birth, Female (Years) Life Expectancy At Birth, Male (Years) Life Expectancy At Birth, Total (Years) x174_2012 Lifetime Risk Of Maternal Death (%) x179_2012 x187_2012 x18_2012 x190_2012 x191_2012 Manufacturing, Value Added (% Of Gdp) Mobile Cellular Subscriptions (Per 100 People) Adjusted Savings: Energy Depletion (% Of Gni) Mortality Rate, Infant (Per 1,000 Live Births) Mortality Rate, Neonatal (Per 1,000 Live Births) x192_2012 Mortality Rate, Under-5 (Per 1,000)
5 x195_2012 x19_2012 x1_2012 Net Migration Adjusted Savings: Energy Depletion (Current Us$) Access To Electricity (% Of Population) x204_2012 Out-Of-Pocket Health Expenditure (% Of Total Expenditure On Health) x25_2012 Adolescent Fertility Rate (Births Per 1,000 Women Ages 15-19) x261_2012 x268_2012 x274_2012 x275_2012 Secure Internet Servers (Per 1 Million People) Surface Area (Sq. Km) Survival To Age 65, Female (% Of Cohort) Survival To Age 65, Male (% Of Cohort) x277_2012 Terrestrial And Marine Protected Areas (% Of Total Territorial Area) x283_2012 Urban Population (% Of Total) x284_2012 Urban Population Growth (Annual %) x29_2012 x2_2012 x31_2012 x35_2012 x36_2012 x37_2012 x38_2012 x45_2012 x47_2012 Age Dependency Ratio (% Of Working-Age Population) Access To Non-Solid Fuel (% Of Population) Agricultural Land (% Of Land Area) Agriculture, Value Added (% Of Gdp) Agriculture, Value Added (Annual % Growth) Air Transport, Passengers Carried Air Transport, Registered Carrier Departures Worldwide Arable Land (% Of Land Area) Armed Forces Personnel (% Of Total Labor Force) x205_2012 Percentage Of Students In Primary Education Who Are Female (%) x211_2012 x212_2012 x213_2012 Personal Remittances, Paid (Current Us$) Personal Remittances, Received (% Of Gdp) Personal Remittances, Received (Current Us$)
6 x218_2012 x219_2012 x21_2012 Population Ages 65 And Above (% Of Total) Population Density (People Per Sq. Km Of Land Area) Adjusted Savings: Natural Resources Depletion (% Of Gni) x220_2012 Population Growth (Annual %) x221_2012 x222_2012 x223_2012 x242_2012 Population, Ages 0-14 (% Of Total) Population, Ages (% Of Total) Population, Female (% Of Total) Private Credit Bureau Coverage (% Of Adults) x243_2012 Proportion Of Seats Held By Women In National Parliaments (%) x244_2012 x253_2012 Public Credit Registry Coverage (% Of Adults) Renewable Electricity Output (% Of Total Electricity Output) x255_2012 Renewable Internal Freshwater Resources Per Capita (Cubic Meters) x258_2012 x48_2012 x49_2012 x58_2012 x67_2012 Maternal, x68_2012 x69_2012 x86_2012 x9_2012 Rural Population (% Of Total Population) Armed Forces Personnel, Total Automated Teller Machines (Atms) (Per 100,000 Adults) Birth Rate, Crude (Per 1,000 People) Cause Of Death, By Communicable Diseases And Prenatal And Nutrition Conditions (% Of Total) Cause Of Death, By Injury (% Of Total) Cause Of Death, By Non-Communicable Diseases (% Of Total) Commercial Bank Branches (Per 100,000 Adults) Adjusted Net National Income (Current Us$)
7 Analyses The distributions for the predictors and the Adjusted Net National Income Per Capita,(Current Us$), response variable were evaluated by calculating the mean, standard deviation and minimum and maximum values for the quantitative predictor variables. This is because all the predictors are quantitative. Scatter plot was also examined, and Pearson correlation was used to test bivariate associations between individual quantitative predictors and the Adjusted Net National Income Per Capita,(Current Us$), response variable. Lasso regression with the least angle regression selection algorithm was used to identify the subset of variables that best predicted Adjusted Net National Income Per Capita,(Current Us$). The lasso regression model was estimated on a training data set consisting of a random sample of 60% of the batches (N=148.8), and a test data set included the other 40% of the batches (N=99.2). All predictor variables were standardized to have a mean=0 and standard deviation=1 prior to conducting the lasso regression analysis. Cross validation was performed using k-fold cross validation specifying 10 folds. The change in the cross validation mean squared error rate at each step was used to identify the best subset of predictor variables. Predictive accuracy was assessed by determining the mean squared error rate of the training data prediction algorithm when applied to observations in the test data set
")
8 Results The data included a lot of predictor variables for the 2012 year; a total of 85 predictor variables. Therefore, I first of all, I conducted a Lasso regression analyses to only get the predictor variables that are relevant in predicting The Adjusted Net National Income Per Capita,(Current Us$) response variable. As a result 74 of the variables were shrunk to zero (0) hence not retained in the model. And 11 of them were retained. The retained 11 are I. GDP PER CAPITA (CURRENT US$), II. HEALTH EXPENDITURE PER CAPITA (CURRENT US$), III. SECURE INTERNET SERVERS (PER 1 MILLION PEOPLE), IV. FIXED BROADBAND SUBSCRIPTIONS (PER 100 PEOPLE), V. ADJUSTED NET NATIONAL INCOME (CURRENT US$), VI. SURVIVAL TO AGE 65, MALE (% OF COHORT), VII. POPULATION AGES 65 AND ABOVE (% OF TOTAL), VIII. ADJUSTED SAVINGS: NATURAL RESOURCES DEPLETION (% OF GNI), IX. RURAL POPULATION (% OF TOTAL POPULATION), X. ADJUSTED SAVINGS: CARBON DIOXIDE DAMAGE (% OF GNI), XI. EXPORTS OF GOODS AND SERVICES (% OF GDP) ) Fig1 shows Table1 which gives descriptive Statistics for Data Analytic Variables which were retained in the model. Fig1: The average Adjusted Net National Income Per Capita,(Current Us$) was ( sd= ). The predictor variable with the highest average was Adjusted Net National Income (Current Us$) with a
 Bivariate Analyses Scatter plots, Fig2 and Fig3, were generated to visualise the association between Adjusted Net National Income Per Capita,(Current Us$) and the quantitative predictor variables")
9 mean of (sd= ) followed by Gdp Per Capita (Current Us$) with a mean of (sd = ) Bivariate Analyses Scatter plots, Fig2 and Fig3, were generated to visualise the association between Adjusted Net National Income Per Capita,(Current Us$) and the quantitative predictor variables and Pearson correlation r values were calculated for the associations. Fig2 Association Between Quantitative Predictors and x11_ Adjusted Net National Income Per Capita,(Current Us$)- first 5 Fig 3 Association Between Quantitative Predictors and x11_ Adjusted Net National Income Per Capita,(Current Us$) last 6 The Pearson correlation r values and the associated p-values revealed that all the retained variables were significantly associated with The Adjusted Net National Income Per Capita,(Current Us$) as can be seen in the Table 2 below.
 is the most strongest relation to the response variable, Adjusted Net National Income Per Capita,(Current Us$) followed by HEALTH EXPENDITURE PER")
10 Table2 From the Scatter Plots and the Pearson r values it can be seen that GDP PER CAPITA (CURRENT US$) (r = 1.00, p=.0001) is the most strongest relation to the response variable, Adjusted Net National Income Per Capita,(Current Us$) followed by HEALTH EXPENDITURE PER CAPITA (CURRENT US$) (r= 0.99, p=.0001).

11 Multivariable analyses Table 3 shows the retained predictor variables and their respective model co-efficients. Table 3 From the Table 3 and also Fig 4 below: Fig 4
. This corroborates the -Pearson correlation r results. The Adjusted Net National Income Per Capita,(Current Us$) increases when GDP PER CAPITA (CURRENT US$) increases.")
12 it can be seen that GDP PER CAPITA (CURRENT US$) is most strongly associated with Adjusted Net National Income Per Capita,(Current Us$) and this is followed by HEALTH EXPENDITURE PER CAPITA (CURRENT US$). This corroborates the -Pearson correlation r results. The Adjusted Net National Income Per Capita,(Current Us$) increases when GDP PER CAPITA (CURRENT US$) increases. The response variable also increases when HEALTH EXPENDITURE PER CAPITA (CURRENT US$) increases. The reverse is true. These were the 2 strongest variables that is positively associated with The Adjusted Net National Income Per Capita,(Current Us$)- the target variable. And increase in SECURE INTERNET SERVERS (PER 1 MILLION PEOPLE), FIXED BROADBAND SUBSCRIPTIONS (PER 100 PEOPLE), ADJUSTED NET NATIONAL INCOME (CURRENT US$), SURVIVAL TO AGE 65, MALE (% OF COHORT), POPULATION AGES 65 AND ABOVE (% OF TOTAL) all result in an increase in the The Adjusted Net National Income Per Capita,(Current Us$) and vice versa. Hence there is a positive relationship between the Adjusted Net National Income Per Capita,(Current Us$) and the above stated 7 variables. However, it can be seen that for ADJUSTED SAVINGS: NATURAL RESOURCES DEPLETION (% OF GNI), RURAL POPULATION (% OF TOTAL POPULATION), ADJUSTED SAVINGS: CARBON DIOXIDE DAMAGE (% OF GNI) and EXPORTS OF GOODS AND SERVICES (% OF GDP) an increase in any of these results in a decrease in the Adjusted Net National Income Per Capita,(Current Us$) and vice versa. Hence there is a negative relationship between these 4 predictor variables and Adjusted Net National Income Per Capita,(Current Us$) Together, these 11 predictors accounted for 99.5% (almost 100%) of the variance in The Adjusted Net National Income Per Capita,(Current Us$). The mean squared error (MSE) for the test data (MSE= ) differed slightly from the MSE for the training data (MSE= ). This suggests that predictive accuracy may decline a little bit when the lasso regression algorithm developed on the training data set is applied to predict future Adjusted Net National Income Per Capita,(Current Us$) as seen in (Figure 5) below.
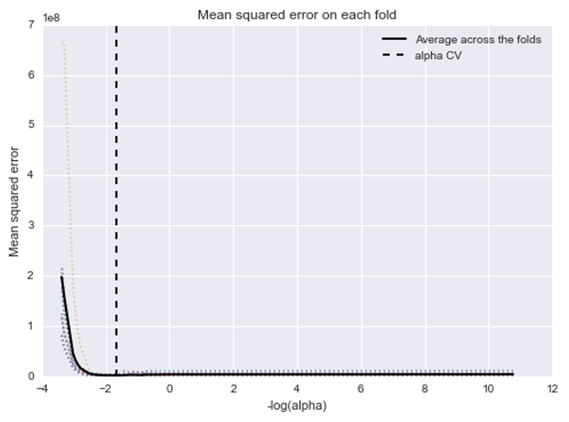
13 Fig5
14 Conclusions/Limitations Brief Overview Of Key Findings And Implications This project used lasso regression analysis to identify the best predictors for Adjusted Net National Income Per Capita, (Current Us$) of countries from multiple World Bank development indicators in N= 248 countries and regions of the world for the year 2012 which is made up of national, regional and global estimates. The Adjusted Net National Income Per Capita, (Current Us$) for this period ranged from (Current Us$) to (Current Us$) indicating that there was considerable variability in the Adjusted Net National Income Per Capita, (Current Us$) of countries and regions of the world for that year. The prediction accuracy of the model was (96%) on the training dataset and (99.5%) when ran on the test dataset. Hence, the algorithm helped to identify the best predictors for Adjusted Net National Income Per Capita, (Current Us$) of countries for the year 2012 given the indicators available in this World Bank dataset. There was significant increase in the MSE when the training set lasso regression algorithm was used to predict the Adjusted Net National Income Per Capita, (Current Us$) in the test data set. This suggests that the predictive accuracy of the algorithm may not be very stable for future datasets and hence has to be looked into further by using other analytic methods such as Multiple Regression. The Pearson correlation r values and associated p-values revealed that all the retained variables were significantly associated with Adjusted Net National Income Per Capita,(Current Us$) as can be seen in the Table 2 above. From the Scatter Plots and the Pearson r values and also from the multivariate analysis it can be seen that GDP PER CAPITA (CURRENT US$) is the most strongest relation to the Adjusted Net National Income Per Capita,(Current Us$) followed by HEALTH EXPENDITURE PER CAPITA (CURRENT US$). This means that countries and regions should spend more on increasing their GDP PER CAPITA (CURRENT US$) and also they should make more efforts and allocate more resources to HEALTH EXPENDITURE PER CAPITA (CURRENT US$) as the more these two variables increase, there is more likelihood of increase in their Adjusted Net National Income Per Capita,(Current Us$). Although, SECURE INTERNET SERVERS (PER 1 MILLION PEOPLE), FIXED BROADBAND SUBSCRIPTIONS (PER 100 PEOPLE),
15 ADJUSTED NET NATIONAL INCOME (CURRENT US$), SURVIVAL TO AGE 65, MALE (% OF COHORT), POPULATION AGES 65 AND ABOVE (% OF TOTAL) all indicated a positive co-efficient,meaning an increase in these variables are likely to lead to increase in the Adjusted Net National Income Per Capita,(Current Us$) of countries and regions, due to general scarcity of resources globally, if there is only a few resources at the disposal of countries and regions, it will be advisable to allocate this scarce resources to GDP PER CAPITA (CURRENT US$) and HEALTH EXPENDITURE PER CAPITA (CURRENT US$). This is because these were the 2 that indicated the most strongest positive association with Adjusted Net National Income Per Capita,(Current Us$). On the other hand, it is advisable for countries and regions to reduce their ADJUSTED SAVINGS: NATURAL RESOURCES DEPLETION (% OF GNI), RURAL POPULATION (% OF TOTAL POPULATION), ADJUSTED SAVINGS: CARBON DIOXIDE DAMAGE (% OF GNI) and EXPORTS OF GOODS AND SERVICES (% OF GDP) as a decrease in these variables have the tendency to increase their Adjusted Net National Income Per Capita,(Current Us$) as these factors are negatively associated with the Adjusted Net National Income Per Capita,(Current Us$). Limitations Although the p-values associated with the Pearson correlation r values indicated that all the retained 11 variables were significantly associated with The Adjusted Net National Income Per Capita,(Current Us$), it can be seen that some of the associations were not linear hence the Pearson correlation could not capture the true relationship between those indicators and The Adjusted Net National Income Per Capita,(Current Us$); therefore could not help in interpreting the Adjusted Net National Income Per Capita,(Current Us$) variability given those non-linear associations. In effect, though the model accurately predicts 99.5% (almost 100%) of the variance in The Adjusted Net National Income Per Capita,(Current Us$), with all the indicators combined, a further examination of the variables using other analysis like Multiple Regression will further enlighten the true associations between these non-linear curves and The Adjusted Net National Income Per Capita,(Current Us$). What is more, as indicated in the codebook, this World Bank data set is a subset of data extracted from the primary World Bank collection of development indicators, which means there are other development indicators which were not provided and hence not captured in this analysis. It is possible that the indicators identified as important predictors of The Adjusted Net National Income Per Capita,(Current Us$), among the set of predictors analyzed in this project are confounded by other factors not considered in this analysis,
16 As a result, these same factors may not emerge as important factors when other factors are taken into consideration. Therefore, future efforts to develop a solid predictive algorithm for The Adjusted Net National Income Per Capita, (Current Us$), should expand the algorithm by adding more development indicators to the statistical model, and testing the applicability of the algorithm for more other years.
INDICATOR REGION WORLD
 SUB-SAHARAN AFRICA INDICATOR REGION WORLD Demographic indicators Total population (2005) 713,457,000 6,449,371,000 Population under 18 (2005) 361,301,000 2,183,143,000 Population under 5 (2005) 119,555,000
Goal 1: Eradicate extreme poverty and hunger. 1. Proportion of population below $1 (PPP) per day a
 per day a") Annex II Revised Millennium Development Goal monitoring framework, including new targets and indicators, as recommended by the Inter-Agency and Expert Group on Millennium Development Goal Indicators At
Annex II Revised Millennium Development Goal monitoring framework, including new targets and indicators, as recommended by the Inter-Agency and Expert Group on Millennium Development Goal Indicators At
INDICATOR REGION WORLD
 SUB-SAHARAN AFRICA INDICATOR REGION WORLD Demographic indicators Total population (2006) 748,886,000 6,577,236,000 Population under 18 (2006) 376,047,000 2,212,024,000 Population under 5 (2006) 125,254,000
Population, Health, and Human Well-Being-- Nigeria
 Population, Health, and Human Well-Being-- EarthTrends Country Profiles Demographic and Health Indicators Total Population (in thousands of people) 195 29,79 176,775 2,519,495 22 12,47 683,782 6,211,82
Population, Health, and Human Well-Being-- Kuwait
 Population, Health, and Human Well-Being-- EarthTrends Country Profiles Demographic and Health Indicators Total Population (in thousands of people) 195 152 111,647 2,519,495 22 2,23 423,296 6,211,82 225
Summary. Accessibility and utilisation of health services in Ghana 245
 Summary The thesis examines the factors that impact on access and utilisation of health services in Ghana. The utilisation behaviour of residents of a typical urban and a typical rural district are used
Ireland and the EU 1973-2003 Economic and Social Change
 Ireland and the EU 1973-2003 Economic and Social Change Table 1 Population, 1971-2002 viii Table 2 Population of the provinces ix Table 3 Births, deaths and life expectancy ix Table 4 Numbers in education
Indicators of Sustainable Development Principles and Practices
 Indicators of Sustainable Development Principles and Practices Division for Sustainable Development United Nations Department of Economic and Social Affairs Policy demand for SD indicators (UNCED) Chapter
Population, Health, and Human Well-Being-- Benin
 Population, Health, and Human Well-Being-- Benin Demographic and Health Indicators Benin Sub- Saharan Africa World Total Population (in thousands of people) 1950 2,046 176,775 2,519,495 2002 6,629 683,782
HEALTH TRANSITION AND ECONOMIC GROWTH IN SRI LANKA LESSONS OF THE PAST AND EMERGING ISSUES
 HEALTH TRANSITION AND ECONOMIC GROWTH IN SRI LANKA LESSONS OF THE PAST AND EMERGING ISSUES Dr. Godfrey Gunatilleke, Sri Lanka How the Presentation is Organized An Overview of the Health Transition in Sri
Development of Social Statistics in Indonesia: a brief note
 Development of Social Statistics in Indonesia: a brief note Wynandin Imawan wynandin@bps.go.id BPS Statistics Indonesia 29 September 2011 1 Legal Setting Institutional: Statistics Law No 16 1997; BPS Statistics
Course Objective This course is designed to give you a basic understanding of how to run regressions in SPSS.
 SPSS Regressions Social Science Research Lab American University, Washington, D.C. Web. www.american.edu/provost/ctrl/pclabs.cfm Tel. x3862 Email. SSRL@American.edu Course Objective This course is designed
Annex 8: SDG Indicator Mapping
 Annex 8 SDG Indicator Mapping 1. Annex 8 responds to Executive Board decision below, regarding the refinement of indicators and targets of the Strategic Plan Integrated Results and Resources Framework
Section 14 Simple Linear Regression: Introduction to Least Squares Regression
 Slide 1 Section 14 Simple Linear Regression: Introduction to Least Squares Regression There are several different measures of statistical association used for understanding the quantitative relationship
Russian Federation. Country coverage and the methodology of the Statistical Annex of the 2015 HDR
 Human Development Report 2015 Work for human development Briefing note for countries on the 2015 Human Development Report Russian Federation Introduction The 2015 Human Development Report (HDR) Work for
Children in Egypt 2014 A STATISTICAL DIGEST
 Children in Egypt 2014 A STATISTICAL DIGEST CHAPTER 1 DEMOGRAPHY Children in Egypt 2014 is a statistical digest produced by UNICEF Egypt to present updated and quality data on major dimensions of child
Univariate Regression
 Univariate Regression Correlation and Regression The regression line summarizes the linear relationship between 2 variables Correlation coefficient, r, measures strength of relationship: the closer r is
United Kingdom. Country coverage and the methodology of the Statistical Annex of the 2015 HDR
 Human Development Report 2015 Work for human development Briefing note for countries on the 2015 Human Development Report United Kingdom Introduction The 2015 Human Development Report (HDR) Work for Human
4. Simple regression. QBUS6840 Predictive Analytics. https://www.otexts.org/fpp/4
 4. Simple regression QBUS6840 Predictive Analytics https://www.otexts.org/fpp/4 Outline The simple linear model Least squares estimation Forecasting with regression Non-linear functional forms Regression
PRESENTATION OF PROPOSED MONITORING STRATEGY FOR NIGERIA
 PRESENTATION OF PROPOSED MONITORING STRATEGY FOR NIGERIA BY DR ANTHONIA I ACHIKE TEAM LEADER, CBMS NIGERIA FEBRUARY, 2009. TABLE OF CONTENTS Revision of Key Points in Proposal Transmission Channels of
Brazil. Country coverage and the methodology of the Statistical Annex of the 2015 HDR
 Human Development Report 2015 Work for human development Briefing note for countries on the 2015 Human Development Report Brazil Introduction The 2015 Human Development Report (HDR) Work for Human Development
East African Community Facts. and Figures - 2012
 EAST AFRICAN COMMUNITY SECRETARIAT East African Community Facts and Figures - 2012 ARUSHA, TANZANIA EAC Secretariat, AICC Building, 5 TH Floor Kilimanjaro Wing P.O. BOX 1096, Arusha, Tanzania. Tel: +255
Nepal. Country coverage and the methodology of the Statistical Annex of the 2015 HDR
 Human Development Report 2015 Work for human development Briefing note for countries on the 2015 Human Development Report Nepal Introduction The 2015 Human Development Report (HDR) Work for Human Development
El Salvador. Country coverage and the methodology of the Statistical Annex of the 2015 HDR
 Human Development Report 2015 Work for human development Briefing note for countries on the 2015 Human Development Report El Salvador Introduction The 2015 Human Development Report (HDR) Work for Human
Briefing note for countries on the 2015 Human Development Report. Philippines
 Human Development Report 2015 Work for human development Briefing note for countries on the 2015 Human Development Report Philippines Introduction The 2015 Human Development Report (HDR) Work for Human
Malawi. Country coverage and the methodology of the Statistical Annex of the 2015 HDR
 Human Development Report 2015 Work for human development Briefing note for countries on the 2015 Human Development Report Malawi Introduction The 2015 Human Development Report (HDR) Work for Human Development
Sierra Leone. Country coverage and the methodology of the Statistical Annex of the 2015 HDR
 Human Development Report 2015 Work for human development Briefing note for countries on the 2015 Human Development Report Sierra Leone Introduction The 2015 Human Development Report (HDR) Work for Human
Answer: C. The strength of a correlation does not change if units change by a linear transformation such as: Fahrenheit = 32 + (5/9) * Centigrade
 * Centigrade") Statistics Quiz Correlation and Regression -- ANSWERS 1. Temperature and air pollution are known to be correlated. We collect data from two laboratories, in Boston and Montreal. Boston makes their measurements
Statistics Quiz Correlation and Regression -- ANSWERS 1. Temperature and air pollution are known to be correlated. We collect data from two laboratories, in Boston and Montreal. Boston makes their measurements
Briefing note for countries on the 2015 Human Development Report. Niger
 Human Development Report 2015 Work for human development Briefing note for countries on the 2015 Human Development Report Niger Introduction The 2015 Human Development Report (HDR) Work for Human Development
Briefing note for countries on the 2015 Human Development Report. Burkina Faso
 Human Development Report 2015 Work for human development Briefing note for countries on the 2015 Human Development Report Burkina Faso Introduction The 2015 Human Development Report (HDR) Work for Human
Thailand. Country coverage and the methodology of the Statistical Annex of the 2015 HDR
 Human Development Report 2015 Work for human development Briefing note for countries on the 2015 Human Development Report Thailand Introduction The 2015 Human Development Report (HDR) Work for Human Development
Congo (Democratic Republic of the)
") Human Development Report 2015 Work for human development Briefing note for countries on the 2015 Human Development Report Congo (Democratic Republic of the) Introduction The 2015 Human Development Report
Human Development Report 2015 Work for human development Briefing note for countries on the 2015 Human Development Report Congo (Democratic Republic of the) Introduction The 2015 Human Development Report
Briefing note for countries on the 2015 Human Development Report. Mozambique
 Human Development Report 2015 Work for human development Briefing note for countries on the 2015 Human Development Report Mozambique Introduction The 2015 Human Development Report (HDR) Work for Human
Tanzania (United Republic of)
") Human Development Report 2015 Work for human development Briefing note for countries on the 2015 Human Development Report Tanzania (United Introduction The 2015 Human Development Report (HDR) Work for
Human Development Report 2015 Work for human development Briefing note for countries on the 2015 Human Development Report Tanzania (United Introduction The 2015 Human Development Report (HDR) Work for
Nigeria: Population and Demographic trends
 Nigeria: Population and Demographic trends Bolatito Ogunbiyi Atlas Fellow, Population Action International Nigeria Beyond the Headlines: Population Health, Natural Resources, and Governance The Woodrow
New South Wales State and Regional Population Projections 2001-2051. 2004 Release TRANSPORT AND POPULATION DATA CENTRE
 New South Wales State and Regional Population Projections 21-251 251 24 Release TRANSPORT AND POPULATION DATA CENTRE THE TRANSPORT AND POPULATION DATA CENTRE (TPDC) The TPDC is located in the NSW Department
RESOURCE EFFICIENCY SCOREBOARD DATA CENTRE ON NATURAL RESOURCES
 RESOURCE EFFICIENCY SCOREBOARD DATA CENTRE ON NATURAL RESOURCES NETGREEN thematic policy workshop 'Maximizing resource efficiency throughout the EU economy' 11 March 2015, CEPS, Brussels Evi Ford-Alexandraki
Water scarcity as an indicator of poverty in the world
 Water scarcity as an indicator of poverty in the world Maëlle LIMOUZIN CE 397 Statistics in Water Resources Dr David MAIDMENT University of Texas at Austin Term Project Spring 29 Introduction Freshwater
Appendix E. Methodology for Statistical Analyses. Comparing North Carolina s Local Public Health Agencies 1
 Appendix E Methodology for Statistical Analyses Comparing North Carolina s Local Public Health Agencies 1 Appendix E Methodology for Statistical Analyses Data Based on prior research and data availability,
Sustainable Development Strategy: Egypt Vision 2030
 Sustainable Development Strategy: Egypt Vision 2030 Nihal El Megharbel, PhD First Assistant to the Minister of Planning, Monitoring and Administrative Reform Workshop on National Development Strategies
Indicators of Sustainable Development: Guidelines and Methodologies
 E c o n o m i c & Indicators of Sustainable Development: Guidelines and Methodologies October 2007 Third Edition S o c i a l A f f a i r s United Nations Indicators of Sustainable Development: Guidelines
Assignment 2: Exploratory Data Analysis: Applying Visualization Tools
 : Exploratory Data Analysis: Applying Visualization Tools Introduction Economic boom, though inspiring, is always connected with unsustainable development. Because of this, people tend to view economic
Better decision making under uncertain conditions using Monte Carlo Simulation
 IBM Software Business Analytics IBM SPSS Statistics Better decision making under uncertain conditions using Monte Carlo Simulation Monte Carlo simulation and risk analysis techniques in IBM SPSS Statistics
Location matters. 3 techniques to incorporate geo-spatial effects in one's predictive model
 Location matters. 3 techniques to incorporate geo-spatial effects in one's predictive model Xavier Conort xavier.conort@gear-analytics.com Motivation Location matters! Observed value at one location is
Simple linear regression
 Simple linear regression Introduction Simple linear regression is a statistical method for obtaining a formula to predict values of one variable from another where there is a causal relationship between
Targets in the proposed SDGs framework
 Targets in the proposed SDGs framework Goal 3. Ensure healthy lives and promote well-being for all at all ages 3.2 By 2030, end preventable deaths of newborns and children under 5 years of age 3.6 By 2020,
Includ acc to all tabl and graphs in Excel TM
 100 INDICATORS FOR THE WORLD'S LEADING ECONOMIES Includ acc to all tabl and graphs in Excel TM OECD Factbook 2006 Economic, Environmental and Social Statistics Population and migration Macroeconomic trends
Cross Validation. Dr. Thomas Jensen Expedia.com
 Cross Validation Dr. Thomas Jensen Expedia.com About Me PhD from ETH Used to be a statistician at Link, now Senior Business Analyst at Expedia Manage a database with 720,000 Hotels that are not on contract
Portugal. Country coverage and the methodology of the Statistical Annex of the 2015 HDR
 Human Development Report 2015 Work for human development Briefing note for countries on the 2015 Human Development Report Portugal Introduction The 2015 Human Development Report (HDR) Work for Human Development
Differentials in Infant and Child Mortality Rates in Nigeria: Evidence from the Six Geopolitical Zones
 Differentials in Infant and Child Mortality Rates in Nigeria: Evidence from the Six Geopolitical Zones Aigbe, Gladys O., PhD Department of Geography and Planning Lagos State University, Ojo Lagos State,
The Big Picture. Correlation. Scatter Plots. Data
 The Big Picture Correlation Bret Hanlon and Bret Larget Department of Statistics Universit of Wisconsin Madison December 6, We have just completed a length series of lectures on ANOVA where we considered
Chapter 10. Key Ideas Correlation, Correlation Coefficient (r),
,") Chapter 0 Key Ideas Correlation, Correlation Coefficient (r), Section 0-: Overview We have already explored the basics of describing single variable data sets. However, when two quantitative variables
Chapter 0 Key Ideas Correlation, Correlation Coefficient (r), Section 0-: Overview We have already explored the basics of describing single variable data sets. However, when two quantitative variables
Islamic Republic of Afghanistan Ministry of Public Health. Contents. Health Financing Policy 2012 2020
 Islamic Republic of Afghanistan Ministry of Public Health Contents Health Financing Policy 2012 2020 Table of Content 1. Introduction 1 1.1 Brief County Profile 1 1.2 Health Status Data 1 1.3 Sources
Briefing note for countries on the 2015 Human Development Report. Palestine, State of
 Human Development Report 2015 Work for human development Briefing note for countries on the 2015 Human Development Report Palestine, State of Introduction The 2015 Human Development Report (HDR) Work for
CHILD SAFETY COUNTRY PROFILE 2012. Hungary
 CHILD SAFETY COUNTRY PROFILE 2012 Hungary The Child Safety Country Profile 2012 for Hungary highlights the burden of child and adolescent injury and examines socio-demographic determinants to provide a
A Basic Introduction to Missing Data
 John Fox Sociology 740 Winter 2014 Outline Why Missing Data Arise Why Missing Data Arise Global or unit non-response. In a survey, certain respondents may be unreachable or may refuse to participate. Item
The Impact of Privatization in Insurance Industry on Insurance Efficiency in Iran
 The Impact of Privatization in Insurance Industry on Insurance Efficiency in Iran Shahram Gilaninia 1, Hosein Ganjinia, Azadeh Asadian 3 * 1. Department of Industrial Management, Islamic Azad University,
India. Country coverage and the methodology of the Statistical Annex of the 2015 HDR
 Human Development Report 2015 Work for human development Briefing note for countries on the 2015 Human Development Report India Introduction The 2015 Human Development Report (HDR) Work for Human Development
Madagascar. Country coverage and the methodology of the Statistical Annex of the 2015 HDR
 Human Development Report 2015 Work for human development Briefing note for countries on the 2015 Human Development Report Madagascar Introduction The 2015 Human Development Report (HDR) Work for Human
2. Germany. (a) Past trends
 Past trends") 2. Germany (a) Past trends While the total fertility rate increased steadily from 2.1 to 2.4 children per woman between 15-155 and 1-15, Germany experienced a continuous decline afterwards, to 1. children
2. Germany (a) Past trends While the total fertility rate increased steadily from 2.1 to 2.4 children per woman between 15-155 and 1-15, Germany experienced a continuous decline afterwards, to 1. children
Human Development Index (HDI)
") Human Development Report 2015 Work for human development Briefing note for countries on the 2015 Human Development Report Iraq Introduction The 2015 Human Development Report (HDR) Work for Human Development
Human Development Report 2015 Work for human development Briefing note for countries on the 2015 Human Development Report Iraq Introduction The 2015 Human Development Report (HDR) Work for Human Development
Bolivia (Plurinational State of)
") Human Development Report 2015 Work for human development Briefing note for countries on the 2015 Human Development Report Bolivia (Plurinational Introduction The 2015 Human Development Report (HDR) Work
Human Development Report 2015 Work for human development Briefing note for countries on the 2015 Human Development Report Bolivia (Plurinational Introduction The 2015 Human Development Report (HDR) Work
Schneps, Leila; Colmez, Coralie. Math on Trial : How Numbers Get Used and Abused in the Courtroom. New York, NY, USA: Basic Books, 2013. p i.
 New York, NY, USA: Basic Books, 2013. p i. http://site.ebrary.com/lib/mcgill/doc?id=10665296&ppg=2 New York, NY, USA: Basic Books, 2013. p ii. http://site.ebrary.com/lib/mcgill/doc?id=10665296&ppg=3 New
AS Economics. Introductory Macroeconomics. Sixth Form pre-reading
 AS Economics Introductory Macroeconomics Sixth Form pre-reading National income National income (Y) = money value of goods and services produced in an economy over a period of time, usually one year. National
Explanatory note on the 2014 Human Development Report composite indices. United Kingdom
 Human Development Report 2014 Sustaining Human Progress: Reducing Vulnerabilities and Building Resilience Explanatory note on the 2014 Human Development Report composite indices United Kingdom HDI values
Module 5: Multiple Regression Analysis
 Using Statistical Data Using to Make Statistical Decisions: Data Multiple to Make Regression Decisions Analysis Page 1 Module 5: Multiple Regression Analysis Tom Ilvento, University of Delaware, College
Critical Thinking ANALOGIES. Skills Worksheet
 Skills Worksheet Critical Thinking ANALOGIES In the space provided, write the letter of the pair of terms or phrases that best complete the analogy shown. An analogy is a relationship between two pairs
Demographic transition and economic growth in Benin
 Demographic transition and economic growth in Benin Barthélémy Biao and Benin Team 1 Contents 1. Introduction 2. Data 3.Principal results 4.Conclusion and project plans 2 1. Introduction Meaning and importance
An Analysis of the Telecommunications Business in China by Linear Regression
 An Analysis of the Telecommunications Business in China by Linear Regression Authors: Ajmal Khan h09ajmkh@du.se Yang Han v09yanha@du.se Graduate Thesis Supervisor: Dao Li dal@du.se C-level in Statistics,
MGT 267 PROJECT. Forecasting the United States Retail Sales of the Pharmacies and Drug Stores. Done by: Shunwei Wang & Mohammad Zainal
 MGT 267 PROJECT Forecasting the United States Retail Sales of the Pharmacies and Drug Stores Done by: Shunwei Wang & Mohammad Zainal Dec. 2002 The retail sale (Million) ABSTRACT The present study aims
Pearson's Correlation Tests
 Chapter 800 Pearson's Correlation Tests Introduction The correlation coefficient, ρ (rho), is a popular statistic for describing the strength of the relationship between two variables. The correlation
SUMMARY- REPORT on CAUSES of DEATH: 2001-03 in INDIA
 SUMMARY- REPORT on CAUSES of DEATH: 2001-03 in INDIA Background: Long-term mortality measurement by cause, gender and geographic area has been the requirement of every country. With this in view, Medical
Norway. HDI values and rank changes in the 2013 Human Development Report
 Human Development Report 2013 The Rise of the South: Human Progress in a Diverse World Explanatory note on 2013 HDR composite indices Norway HDI values and rank changes in the 2013 Human Development Report
United Kingdom. HDI values and rank changes in the 2013 Human Development Report
 Human Development Report 2013 The Rise of the South: Human Progress in a Diverse World Explanatory note on 2013 HDR composite indices United Kingdom HDI values and rank changes in the 2013 Human Development
Analysis of Population Cancer Risk Factors in National Information System SVOD
 Analysis of Population Cancer Risk Factors in National Information System SVOD Mužík J. 1, Dušek L. 1,2, Pavliš P. 1, Koptíková J. 1, Žaloudík J. 3, Vyzula R. 3 Abstract Human risk assessment requires
HYPOTHESIS TESTING: CONFIDENCE INTERVALS, T-TESTS, ANOVAS, AND REGRESSION
 HYPOTHESIS TESTING: CONFIDENCE INTERVALS, T-TESTS, ANOVAS, AND REGRESSION HOD 2990 10 November 2010 Lecture Background This is a lightning speed summary of introductory statistical methods for senior undergraduate
The People s Report Card: A Note On Methodology
 The People s Report Card: A Note On Methodology www.socialprogressimperative.org THE CONCEPT We need to help people understand what the Global Goals mean in a way that is relevant for their own lives.
NCDs POLICY BRIEF - INDIA
 Age group Age group NCDs POLICY BRIEF - INDIA February 2011 The World Bank, South Asia Human Development, Health Nutrition, and Population NON-COMMUNICABLE DISEASES (NCDS) 1 INDIA S NEXT MAJOR HEALTH CHALLENGE
Simple Linear Regression Inference
 Simple Linear Regression Inference 1 Inference requirements The Normality assumption of the stochastic term e is needed for inference even if it is not a OLS requirement. Therefore we have: Interpretation
Introduction to Regression and Data Analysis
 Statlab Workshop Introduction to Regression and Data Analysis with Dan Campbell and Sherlock Campbell October 28, 2008 I. The basics A. Types of variables Your variables may take several forms, and it
Explanatory note on the 2014 Human Development Report composite indices. Spain. HDI values and rank changes in the 2014 Human Development Report
 Human Development Report 2014 Sustaining Human Progress: Reducing Vulnerabilities and Building Resilience Explanatory note on the 2014 Human Development Report composite indices Spain HDI values and rank
SUB-SAHARAN AFRICA. Economic indicators. Demographic indicators. Survival HIV/AIDS. Health and nutrition. Child protection. Education.
 SUB-SAHARAN AFRICA Total population (2004) 697,561,000 6,374,050,000 Population under 18 (2004) 354,355,000 2,181,991,000 Population under 5 (2004) 117,346,000 614,399,000 Life expectancy at birth (2004)
Business Briefing: Germany
 159870 Business Briefing: Germany May 2015 Overview Area Population Population density 357,340.0 sq km 2014: 80.9 million people Population growth rate 2014: -0.2%* Fertility rate Birthrate Age group distribution
KEY STATISTICS REQUIRED UNDER THE CARICOM CSME
 ECCB/IMF International Conference on Statistics LIMITED Basseterre, St. Kitts and Nevis LC/CAR/L.137 5-7 September 2007 18 September 2007 ORIGINAL: ENGLISH KEY STATISTICS REQUIRED UNDER THE CARICOM CSME
Methods for Meta-analysis in Medical Research
 Methods for Meta-analysis in Medical Research Alex J. Sutton University of Leicester, UK Keith R. Abrams University of Leicester, UK David R. Jones University of Leicester, UK Trevor A. Sheldon University
RATIOS, PROPORTIONS, PERCENTAGES, AND RATES
 RATIOS, PROPORTIOS, PERCETAGES, AD RATES 1. Ratios: ratios are one number expressed in relation to another by dividing the one number by the other. For example, the sex ratio of Delaware in 1990 was: 343,200
Economics 212 Principles of Macroeconomics Study Guide. David L. Kelly
 Economics 212 Principles of Macroeconomics Study Guide David L. Kelly Department of Economics University of Miami Box 248126 Coral Gables, FL 33134 dkelly@miami.edu First Version: Spring, 2006 Current
Personal Accident and Health Insurance in Malaysia, Key Trends and Opportunities to 2016
 Personal Accident and Health Insurance in Malaysia, Key Trends and Opportunities to 2016 Market Intelligence Report Reference code: IS0055MR Published: September 2012 www.timetric.com Timetric John Carpenter
Macroeconomia Capitolo 7. Seguire l andamento della macroeconomia. What you will learn in this chapter:
 Macroeconomia Capitolo 7 Seguire l andamento della macroeconomia PowerPoint Slides by Can Erbil 2006 Worth Publishers, all rights reserved What you will learn in this chapter: How economists use aggregate
Chapter 24. What will you learn in this chapter? Valuing an economy. Measuring the Wealth of Nations
 Chapter 24 Measuring the Wealth of Nations 2014 by McGraw-Hill Education 1 What will you learn in this chapter? How to calculate gross domestic product (GDP). Why each component of GDP is important. What
THE IMPACT OF MACROECONOMIC FACTORS ON NON-PERFORMING LOANS IN THE REPUBLIC OF MOLDOVA
 Abstract THE IMPACT OF MACROECONOMIC FACTORS ON NON-PERFORMING LOANS IN THE REPUBLIC OF MOLDOVA Dorina CLICHICI 44 Tatiana COLESNICOVA 45 The purpose of this research is to estimate the impact of several
4. Multiple Regression in Practice
 30 Multiple Regression in Practice 4. Multiple Regression in Practice The preceding chapters have helped define the broad principles on which regression analysis is based. What features one should look
2.2 How much does Australia spend on health care?
 2.2 How much does Australia spend on health care? Health expenditure occurs where money is spent on health goods and services. Health expenditure data includes health expenditure by governments as well
AP HUMAN GEOGRAPHY 2008 SCORING GUIDELINES
 AP HUMAN GEOGRAPHY 2008 SCORING GUIDELINES Question 3 Countries in the graph above have been chosen to illustrate an important trend in education patterns in the developing world. Part A (1 point) Identify
The correlation coefficient
 The correlation coefficient Clinical Biostatistics The correlation coefficient Martin Bland Correlation coefficients are used to measure the of the relationship or association between two quantitative
Module 5: Statistical Analysis
 Module 5: Statistical Analysis To answer more complex questions using your data, or in statistical terms, to test your hypothesis, you need to use more advanced statistical tests. This module reviews the
10. European Union. (a) Past trends
 Past trends") . European Union (a) Past trends The total fertility rate in the 15 countries that presently constitute the European Union was on a rising curve until 196-65, when it attained 2.69 births per woman. Since
. European Union (a) Past trends The total fertility rate in the 15 countries that presently constitute the European Union was on a rising curve until 196-65, when it attained 2.69 births per woman. Since
Economic Development and the Gender Wage Gap Sherri Haas
 Economic Development and the Gender Wage Gap I. INTRODUCTION General wage inequality within countries is a topic that has received a great deal of attention in the economic literature. Differences in wages
16 : Demand Forecasting
 16 : Demand Forecasting 1 Session Outline Demand Forecasting Subjective methods can be used only when past data is not available. When past data is available, it is advisable that firms should use statistical
Predicting daily incoming solar energy from weather data
 Predicting daily incoming solar energy from weather data ROMAIN JUBAN, PATRICK QUACH Stanford University - CS229 Machine Learning December 12, 2013 Being able to accurately predict the solar power hitting