CHAPTER 9: FLOOD RISKS
|
|
|
- Sophia Phillips
- 8 years ago
- Views:
Transcription
1 9.1 CHAPTER 9: FLOOD RISKS Miriam Middelmann, Bruce Harper and Rob Lacey The Flood Threat A simple definition of flooding is water where it is not wanted (Chapman, 1994). Four different mechanisms can cause flooding including heavy rainfall, storm surge, tsunami and dam failure (ARMCANZ, 2000). In this chapter we discuss flood risk associated with heavy rainfall, and briefly, flood risk associated with dam failure. Riverine flooding occurs when the amount of water reaching the watercourse or stream network exceeds the amount of water which can be contained by the network and subsequently water overflows out onto the floodplain. Several factors influence whether or not a flood occurs, including: the total amount of rainfall falling over the catchment; the geographic spread and concentration of rainfall over the catchment, i.e. spatial variation; rainfall intensity, duration and temporal variation; antecedent catchment and weather conditions; ground cover; the capacity of the watercourse or stream network to carry the runoff; and, tidal influence. This complex set of factors influences whether or not flooding occurs in a catchment, consequently it is difficult to define the causes or the impacts of an average flood. Put simply, no two floods in the same catchment are ever identical. To overcome this problem, floodplain managers and hydraulic engineers rely on a series of design flood events and historical rainfall and flood level information. It is upon these that this report is based. Localised and/or flash flooding typically occurs when intense rainfall falls over a small subcatchment which responds to that rainfall in six hours or less. In urban or rural areas where drainage is poor, the risk of localised flooding is high under such circumstances. Widespread flooding, by contrast, occurs following rainfall of high intensity or long duration over the whole, or a large proportion of a catchment. Runoff is typically less in areas where the percentage of vegetation is high, as vegetated areas allow high infiltration until the earth is saturated. Where the ground is pre-saturated, such as following a long wet period, medium rainfall events may then cause flooding as runoff begins almost immediately. Flood levels in urban areas quickly rise where the percentage of impermeable surfaces in the local catchment, such as buildings, roads and car parks, is high. On sloping concrete and bitumen surfaces, for example, runoff is almost immediate. Average recurrence interval (ARI) or annual exceedance probability (AEP) are statistical benchmarks used for flood comparison. ARI is the average, or expected, value of the number of years between exceedances of flood events of a given magnitude (gauge height or discharge volume). AEP is the probability of a flood event of a given magnitude being equalled or exceeded in any one year. The Probable Maximum Flood (PMF) is the limiting-value flood which can reasonably be expected to occur. It is usually perceived as having an ARI of between and years (Nathan & Weinmann 1999, Laurenson 1994 in ARMCANZ, 2000).

2 9.2 Flood levels are typically related to the Australian Height Datum (AHD), which is approximately Mean Sea Level (MSL). Accordingly, the gauge height of floods varies depending on the location of the gauge and its relative elevation in the floodplain. The depth of any flood is then calculated as the difference between the flood water level elevation and the local ground elevation relative to the AHD. Cost of flooding Major flooding causing inundation of large areas, isolating towns and disrupting road and rail links occurs on average about every ten years somewhere in the South-East Queensland region. Smith (1998) estimated that around 35% of the buildings at risk from flooding in Australia are located in Queensland, with 21% being in the South-East Queensland region. The large numbers of buildings at risk of flooding in South-East Queensland is exacerbated by the absence of Statewide floodplain management regulations which might typically aim to preclude residential development in areas subject to flooding up to the 1% AEP (100 year ARI) level. In Queensland such regulations are left to individual Local Government Authorities (LGAs) to establish. The average economic cost of urban flooding (stormwater and mainstream flooding 1 ) in Australia is estimated to be in the order of $200 million per year at 1998 dollar terms (ARMCANZ 2000). The estimate is however based on the DPIE (1992) study and significantly underestimate flood damage. The more recent study by Smith (1998) estimated annual average urban flood damage in Queensland alone at about $100 million. Economic loss due to flooding varies widely from year to year and is dependent on a number of factors, for example, flood severity and location. During the 1974 Brisbane floods, for example, the flood damage in 1998 values was $700 million, however, damage was much lower in both previous and subsequent years (ARMCANZ, 2000). In recent years good work has been undertaken by a number of local governments to minimise flood risk through stringent development application guidelines, however, flooding remains a large problem for many areas across the region. The Flood Phenomenon Heavy rainfall capable of causing flooding (flash and non-flash) in South-East Queensland can arise from a number of different meteorological mechanisms, as described below: Severe Thunderstorms isolated storms typically cause flash flooding in relatively small catchments organised systems may extend to affect more than one catchment Tropical Cyclones capable of causing widespread flooding across the South-East region typically heaviest rainfall is associated with coast-crossing and decaying phases 1 The dollar loss to buildings affected by mainstream flooding is significantly larger though the number of properties affected are less than for stormwater flooding.

3 9.3 may interact with and draw the monsoon trough southwards creating an extensive rainfall event over the whole state (e.g. BoM, refer to Figure 9.1) East Coast Lows capable of causing widespread flooding across the South-East region (e.g. BoM, 1996) more common in autumn and early winter establish large scale moist onshore flow conditions heavy rainfall triggered by upper level coupling creating large scale lifting of the onshore flow Other fronts and troughs low pressure systems coastal convergence high pressure intensification in the Tasman Sea, combined with upper trough interaction. All of these events are also influenced by the regional topography which provides significant orographic lift to assist the creation of favourable conditions for heavy rainfall. The detailed characteristics of these meteorological situations is discussed in Chapters 4 (cyclones), 5 (east coast lows) and 6 (thunderstorms). Figure 9. 1 Rainfall isohyets (mm) over the five day period of the January 1974 floods Major river systems in South-East Queensland South-East Queensland is crossed by a number of major river systems and numerous creeks. Typically the headwaters rise in the Great Dividing Range to the west and the rivers traverse the coastal plains in a generally eastward direction, emptying into Moreton Bay, The Broadwater or the Pacific Ocean. The rivers are fed by an average annual rainfall which varies between 800 mm

4 9.4 and 1500 mm across the region and has helped create a particularly fertile region which, prior to European settlement, supported a large number of aboriginal communities. From the earliest days of European settlement, many rivers provided not only abundant fresh water supplies and fertile adjacent lands but also served as important transportation corridors. In the past 100 years the extensive urban development of the region has impinged onto many areas of the floodplains and several river courses have been altered through the creation of water storages in their upper reaches and dredging or reclamation works in their lower reaches. An overview of the major river catchments in South-East Queensland was shown in Figure 2.3 and in more detail in Figures The northern coastal region is drained by the Caboolture River, Burpengary Creek, North and South Pine Rivers and the northern creeks of Brisbane which flow to Moreton Bay. The Brisbane-Bremer River system is the major catchment in the region and includes a number of urban creeks including Oxley and Bulimba Creeks on the southern side and Moggill and Enoggera Creeks in the north. The southern coastal region is traversed by the Logan River and its major tributary, the Albert River, which empties into the southern extent of Moreton Bay, whilst the Pimpama, Coomera and Nerang River systems empty into The Broadwater. An extensive network of rainfall and river height reporting stations cross the region that provide data on flood events used for both operational warnings and investigations into the probability of occurrence of extreme floods. Caboolture River and Burpengary Creek System The Caboolture River is situated about 40 km north of Brisbane and has a total catchment area of 370 square kilometres (CSC 1994a). It rises in the D Aguilar Ranges and flows in an easterly direction towards the coast, passing through Caboolture and entering Deception Bay (the northern part of Moreton Bay) near the township of Beachmere. Its major tributaries include Wararba, Sheep Station, King John and Lagoon Creeks. The topography is steep in the upper portions but flattens out progressively towards the coast, forming a mature floodplain in the middle and lower reaches. Downstream of Caboolture, the floodplain is very flat and consists of scattered swamps and extensive areas that are highly floodprone. Other than the townships of Caboolture (12 km from the mouth) and Morayfield, Beachmere is the only other significant urban area on the lower floodplain, which is otherwise characterised by rural industry, pastures and pine forest plantations. Figure 9.2 indicates the extent of the Caboolture River catchment. Burpengary Creek, the creek system immediately to the south of the Caboolture River catchment, also flows in a general easterly direction to the northern end of Deception Bay, just south of the Caboolture River mouth (Figure 9.2). The topography is generally flat and, other than the township of Burpengary which has some flood-affected residential properties, the land use is largely rural industry. Pine River System The Pine River catchment drains in a generally easterly direction from the relatively steep D Aguilar Ranges towards the flat coastal plains of Bramble Bay between Sandgate and Redcliffe. North Pine River and South Pine River join some 7 km upstream from the mouth, where the combined system forms an extensive coastal estuary. The tidal influence extends upstream in the North Pine to Young s Crossing, and in the South Pine to the Bald Hills Railway Bridge. The major river catchments of Pine Rivers are shown in Figure 9.3. The North Pine rises near Mt Pleasant towards the northwest corner of the catchment while its major tributary Laceys Creek flows from the south. Approximately 18% of the North Pine

5 9.5 catchment consists of State forest, 1% is national park and the remainder is rural. The North Pine Dam was constructed 5 km upstream of Petrie in 1976 and forms the 2000 hectare Lake Samsonvale. The dam provides water supply to Brisbane, Pine Rivers and Redcliffe. Just downstream, Sideling Creek was also dammed for water supply purposes in 1959 and forms the smaller Lake Kurwongbah. The main urban areas of the North Pine catchment are located downstream of the dam and include Petrie, Lawnton and Strathpine. The South Pine River rises in the D Aguilar Ranges to the south and flows in an easterly and northeasterly direction towards Bramble Bay. Cedar Creek is the major tributary which joins the river 4 km upstream of Cash s Crossing. At this point the river forms an extensive floodplain area which extends through the urban areas of Albany Creek, Strathpine and Bald Hills. Grazing and rural residential are the major land uses in the catchment. Figure 9. 2 Caboolture River catchment

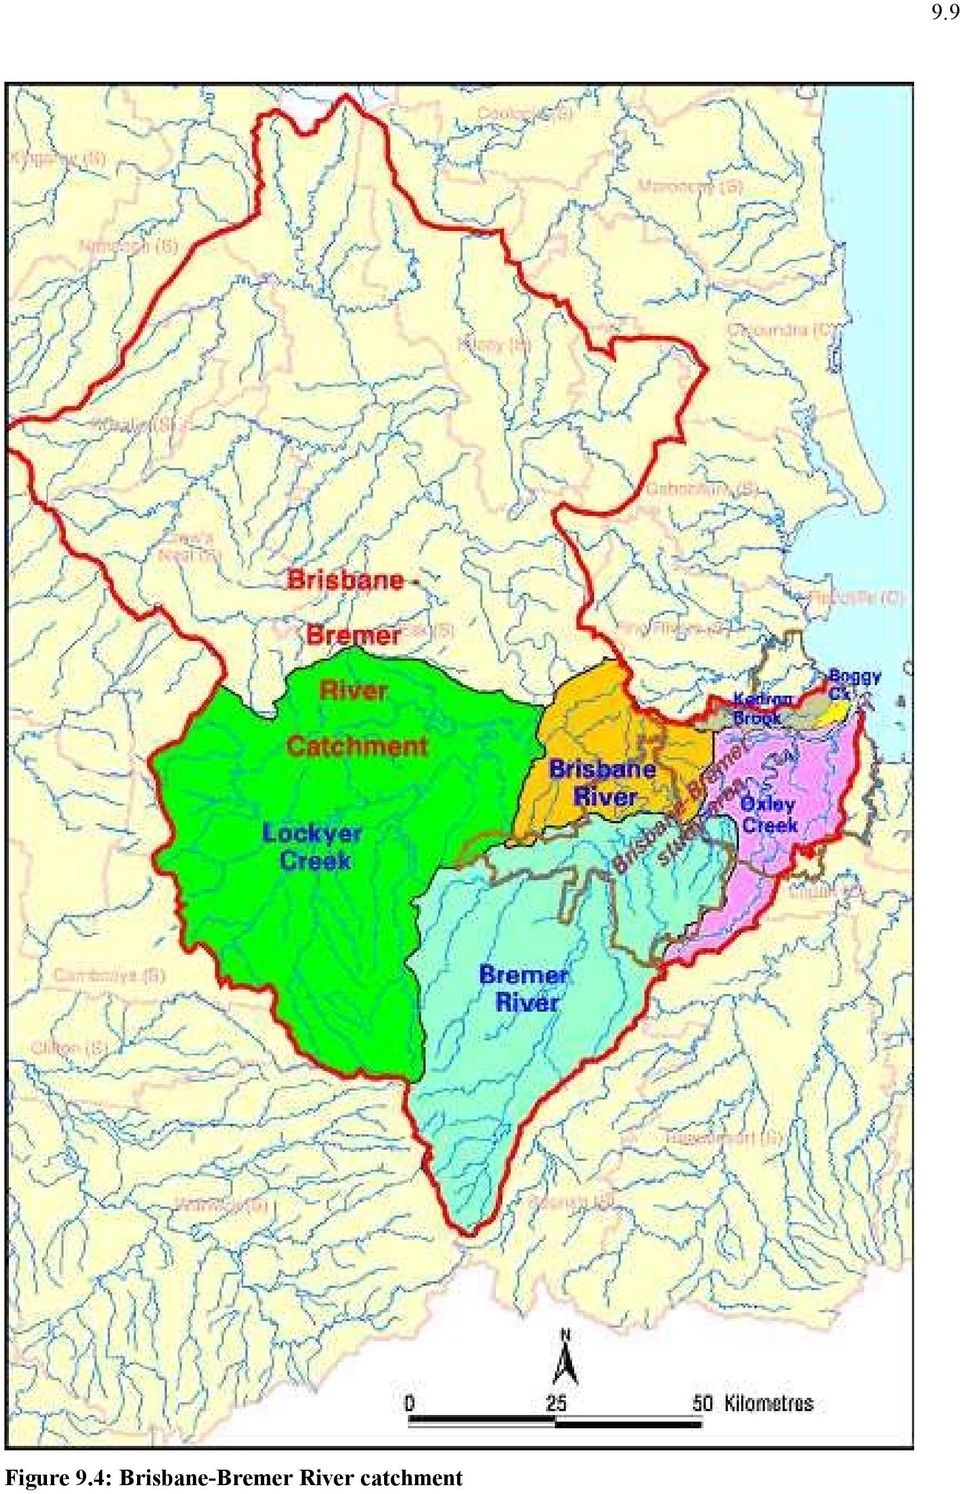
6 9.6 Figure 9. 3 Pine Rivers catchment Brisbane and Bremer River System The Brisbane River catchment (Figure 9.4) is the largest in the region and covers an area of square kilometres (BCC 1998). The catchment is bounded to the west by the Great Dividing Range and by a number of smaller coastal ranges to the east and north. Most of the catchment comprises of forest and grazing land, with the exception of the Brisbane Ipswich metropolitan regions and numerous small rural townships. The headwaters are at the northerly extent of the catchment bounded by the Brisbane Range. The overall length of the main stream is approximately 300 km. The major tributaries of the Brisbane River are best summarised in terms of its principal subcatchments, which include: Upper Brisbane This comprises Cooyar and Emu Creeks which have their headwaters in the Great Dividing Range to the northwest. This area has the lower average annual rainfall. Somerset This is formed by the Stanley River, which rises in the foothills of the Conondale and D Aguilar Ranges to the northeast. Somerset Dam, a major water supply and flood mitigation dam, is located just upstream of the junction of the Stanley and Brisbane Rivers. Wivenhoe

7 9.7 Consists of Cressbrook Creek, bounded by the Great Dividing Range to the west. This catchment is dominated by Wivenhoe Dam, the largest dam in the South-East, which when filled extends upstream to Somerset Dam. Lockyer The Lockyer Creek is bounded by the Great Dividing Range to the south and west and represents the largest of the sub-catchments of the Brisbane River. Other major tributaries include Laidley and Tenthill Creeks. The lower floodplains of the Lockyer Valley support intensive agriculture, including vegetables and small crops. Bremer The Bremer sub-catchment occupies 1500 square kilometres of the southernmost corner of the Brisbane River catchment (IRIT 2000) and is bounded by the Macpherson Ranges to the south. The Bremer River flows through the City of Ipswich and joins the Brisbane River near Moggill. Warrill Creek, the major tributary, accounts for almost two-thirds of the catchment area and joins the Bremer approximately ten kilometres upstream of Ipswich. Heavy rainfall in the Bremer-Warrill headwaters can cause major flooding of Ipswich as well as agricultural and rural areas throughout the catchment. Localised flooding in the Ipswich area can also be caused by the Bundamba and Woogaroo Creeks. During heavy rainfall, these small creeks rise very quickly and can cause significant flooding in urban areas. Flooding in the Ipswich area can also occur due to backwater flooding from the Brisbane River when it is in major flood. Tidal effects from Moreton Bay are still felt at Ipswich, some 80 km from the mouth of the Brisbane River. Lower Brisbane This covers the catchment from the confluence with the Bremer, through to the river s mouth into Moreton Bay. Much of this is within the metropolitan regions of the City of Brisbane. Flooding in the Brisbane City area can also be caused by local tributaries including Oxley and Bulimba Creeks on the southside, and Moggill and Enoggera Creeks in the western and northern suburbs. During intense rainfalls, the suburban creeks rise very quickly and can cause significant flooding of streets and houses. Major Brisbane Creeks Brisbane City is traversed by many creeks (Figure 9.5), some of which cause local flash flooding problems. Approximately six to twelve hours of rain in excess of 100 mm on an already wet catchment is typically needed to cause significant flooding. Some of the larger creeks are also subject to backwater effects from the Brisbane River. The following creeks flow through the northern suburbs of Brisbane into Moreton Bay: Kedron Brook The headwaters of Kedron Brook are in the Ferny Hills area but it is also fed from Cedar Creek which rises in the Upper Kedron area near Brisbane Forest Park. The creek flows through Keperra, Stafford, Enoggera, Grange and Toombul before entering Shultz Canal adjacent to the airport and flowing into Moreton Bay at Nudgee.

8 9.8 Cabbage Tree Creek This small creek has its headwaters near Arana Hills and flows eastwards through Bridgeman Downs, Carseldine and Zillmere, entering Moreton Bay near Shorncliffe. Little Cabbage Tree Creek rises in West Chermside and flows through Aspley, joining the main stream at Carseldine. Downfall Nundah Creek This small creek rises near McDowall and flows through Chermside and Virginia. It then becomes Nundah Creek at Zillman Waterholes and passes through the Boondall Wetlands to enter Moreton Bay at Shorncliffe, joining with Cabbage Tree Creek. The following creeks flow into the Brisbane River and are usually subject to backwater effects when the Brisbane River is in flood: Enoggera Creek The headwaters of Enoggera Creek are in the D'Aguilar Ranges near Mt Nebo. It flows through Brisbane Forest Park into the Enoggera Reservoir, then via The Gap, Bardon and Ashgrove. It is joined by Ithaca Creek at Kelvin Grove, which rises near Mt Cootha and passes through Bardon and Ashgrove. In the lower reaches Enoggera Creek becomes Breakfast Creek and continues on through Herston to enter the Brisbane River at Newstead. Moggill Creek The headwaters of Moggill Creek are on the southern side of Mt Cootha. The creek flows through Brookfield and Kenmore and enters the Brisbane River just upstream of Jindalee Bridge.

9 Figure 9.4: Brisbane-Bremer River catchment 9.9
10 Figure 9.5: Brisbane major creek catchments 9.10

11 9.11 Bulimba Creek The headwaters of Bulimba Creek are in the Eight Mile Plains area. It flows through the suburbs of Wishart and Carindale before entering the Brisbane River near Hemmant. Oxley Creek Oxley Creek is the largest of the metropolitan creeks and has a relatively long flood concentration time. It rises in the area south of Greenbank Military Training Area and flows through the suburbs of Forestdale, Acacia Ridge and Rocklea. The main flooding problems are in the lower reaches around Rocklea and Corinda. Logan - Albert River System The Logan-Albert River system has a total catchment area of 3875 square kilometres and lies in the southeast corner of Queensland. The catchment extends from the McPherson Ranges in the south on the Queensland-NSW border, north to the Logan City - Beenleigh area. The major tributaries are the Albert River and Teviot Brook. Smaller tributaries include Running, Christmas, Burnett and Canungra Creeks in the headwaters. Major flooding is experienced in both rural and urban areas of the catchment. Scrubby and Slacks Creeks in the lower reaches of the Logan River can be subject to flash flooding as well as backwater flooding during major river flood events. The Logan-Albert River system is shown in Figure 9.6. Pimpama, Coomera, Nerang, Tallebudgera and Currumbin catchments The Pimpama River catchment (Figure 9.7) is located to the south of the Logan River and has an area of about 130 square kilometres, with about 60% of the area to the east of the Pacific Highway (GCCC 1999a). West of the highway the catchment is bounded by the Albert River catchment. The catchment is relatively undeveloped. The Coomera River catchment is located immediately south of the Pimpama River (refer to Figure 9.7). It rises in the McPherson Ranges, passing around Canungra, Coomera and Oxenford and entering the northern Broadwater through Hope Island (GCCC 2000). There are a number of major tributaries and the lower reaches of the river are tidal, dividing into several channels forming islands on the lower floodplain. The land use distribution varies from rural in the upper reaches to large scale resort and residential along the lower floodplain tributaries. These include The Anabranch and Saltwater Creek. Coombabah Creek is another tributary which flows northwards into the Coomera from Coombabah Lake, an area of ecological importance. The Nerang River catchment is located in the southeast corner of Queensland and covers an area of 480 square kilometres (Figure 9.7). From its headwaters in the McPherson Ranges, the Nerang River flows in a northeasterly direction, through the Numinbah Valley, before entering Advancetown Lake created by the Hinze Dam where the Little Nerang River joins it. Downstream from the dam, it passes Nerang before turning eastwards to Benowa, Broadbeach Waters, Bundall and Surfers Paradise, entering the Pacific Ocean via The Broadwater and the Gold Coast Seaway. Mudgeeraba Creek drains a catchment of about 100 square kilometres extending south to Springbrook and enters the Nerang River only a few kilometres from its mouth. Mudgeeraba Creek is subject to flash flooding. Approximately two thirds of the catchment for the Nerang River is rural, mostly forested, open space with some grassland open space, such as golf courses and rural residential areas (GCCC 1997a & 1999b). The remainder of the catchment is urban, comprising residential, high density residential, commercial and industrial areas. The Nerang River floodplain system has an area of about 65 square kilometres,

12 9.12 much of which has been subject to development over many years and now consists of an extensive network of tidal canal estates. The only remaining undeveloped region is the Merrimac/Carrara floodplain comprising about 22 square kilometres between the Nerang River in the north and Mudgeeraba Creek in the south. Depending on the flood situation, the Hinze Dam, which commands about 42% of the total catchment area, reduces the severity of downstream flooding of the Nerang system, although a recurrence of rainfalls similar to, or higher than, those in the 1974 record flood would still cause significant flooding. In the southern Gold Coast area, Tallebudgera and Currumbin Creeks are adjacent catchments of 97 square kilometres and 63 square kilometres respectively. The headwaters are towards the southwest near Springbrook and flow essentially northeast to the sea. Both catchments are rural in the upper reaches but heavily developed in the lower reaches and floodplains with several lake/canal developments. Tallebudgera Creek is tidal for approximately 10 km upstream while Currumbin Creek is tidal downstream of a weir about 8 km from the mouth. Figure 9.6: Logan-Albert River system

13 Figure 9.7: Pimpama, Coomera, Nerang, Tallebudgera and Currumbin catchments 9.13

14 9.14 Major Dams There are 16 major dams and reservoirs throughout the South-East Queensland region which act either to provide water supply storage, irrigation, or to assist in flood mitigation. A summary of the dam characteristics are given in Table 9.1 and are derived from various sources (mainly R. Ash, 2000, personal communication, and DNR, 2000a). The effectiveness of their mitigation capacity is a function of the inflow rate to the reservoir and the regulatory controls (gates, valves etc) available, which varies significantly from dam to dam. Wivenhoe Dam (on the Brisbane River) is the principal flood mitigation control in the Brisbane River system, followed by Somerset Dam (located on the Stanley River immediately upstream of Wivenhoe). Jointly, these dams have a major impact on the hydrology of the system but their presence alone is not sufficient to prevent major flooding in some situations. Other than the Hinze Dam on the Nerang River, the remaining dams throughout the South-East region have, by comparison, only a minor flood mitigation capability and the majority have unregulated spillways. Dam break is an emergency response issue which cuts across LGA boundaries and is the responsibility of the Department of Natural Resources (DNR) or the South-East Queensland Water Board (SEQWB). A series of detailed operational plans are maintained by the dam operators that generally seek to optimise the design water supply level with regard to the expected inflow of flood waters. Controlled water releases are then made based on inflows and the flood mitigation capacity of the dam, but may also need to consider impacts on communities from other uncontrolled downstream tributaries. Table 9. 1 Dams in South-East Queensland Damsite River/Creek Type Completion (year) Full Supply Capacity (ML) Crest Capacity (ML) Wivenhoe Brisbane Rock fill Somerset Stanley Concrete gravity North Pine North Pine Earth and rock embankment Hinze Nerang Earth and rock embankment 1976 and Moogerah Reynolds Concrete arch Cressbrook Cressbrook n/a Maroon Burnett Earth and rock embankment Atkinson Buaraba n/a Perseverance Perseverance n/a Lake Cabbage Tree n/a Manchester Clarendon Lockyer n/a Lake Sideling n/a Kurwongbah Leslie Harrison Tingalpa Concrete n/a Little Nerang Little Nerang n/a Bill Gunn Laidley n/a Enoggera Enoggera n/a
 is the principal flood mitigation control in the Brisbane River system, followed by Somerset Dam (located on the Stanley River immediately upstream of Wivenhoe).")
15 9.15 The operation of all major dams is strictly controlled and is subject to regular detailed inspection and monitoring to ensure that the structural integrity of the dam is maintained at all times (SEQWB, 1998 a & b). The principal threat to any dam s integrity occurs when the inflow of floodwaters exceeds the combined storage and outflow available, and the dam is subjected to overtopping in an uncontrolled manner. In extreme situations, the priority of preventing overtopping will override the flood mitigation objectives at regulated dams and result in large controlled releases of flood waters. In these cases, procedures are in place to alert the relevant emergency authorities to ensure the public are adequately warned; flood-prone low level crossings are closed and if necessary, evacuations are undertaken. Normally, these impacts are relatively minor and there is more than adequate time available to issue warnings and make special arrangements. However, due to the need for extreme caution, not all of the ultimate capacity of the dams will normally be available for flood mitigation purposes. Somerset Dam is a concrete gravity structure and is presently rated to withstand overtopping at the estimated PMF. Wivenhoe Dam is a central core rockfill dam, which is not resistant to overtopping, and operational procedures are designed to ensure that water releases will be scheduled to enable the dam to pass the PMF without overtopping. If necessary, Somerset Dam will be allowed to be overtopped to assist in preserving the structural integrity of Wivenhoe Dam (SEQWB 1998b). North Pine dam has similar structural characteristics to Wivenhoe Dam but is principally designed for water supply needs. If overtopping or unexpected structural failure was to occur (e.g. extreme earthquake and/or undetected faults) then there exists a possibility that a dam will fail. The probability of this occurring is expected to be generally lower than the probability of a PMF occurring. The exact manner of the failure may vary widely and the consequences of the failure downstream will depend upon the floodplain characteristics and whether or not a flood is currently in progress. Contrary to the popular perception, flood waves from dam breaks travel relatively slowly - at only a few kilometres per hour - except in close proximity to the dam. In particularly steep catchments, such as below the Hinze Dam, the flood wave celerity may be quite high attenuating down to Nerang township, making it unlikely that residents would have plenty of warning in the event of dam failure. Emergency Action Plans are available for all the major damsites which document procedures to be followed in the unlikely event of a severely overtopped dam or a dam failure (e.g. DNR, 2000 b; SEQWB, 1993 a, b, c & d). These plans also identify critical hazard locations in the region and are used by emergency services under the coordination of State and Local Government officers. Studies have been undertaken for a number of dams in South-East Queensland which estimate the extent of possible downstream impact of a dam break flood wave and include the predicted depth of inundation and the time of arrival, which can be several hours after the dambreak. Table 9.2 summarises the estimated extent of impacts of dam break for the major South-East Queensland dams. For example, Wivenhoe Dam is predicted to be able to fully contain an unexpected breach of Somerset Dam under non-flood conditions. Under extreme flood conditions, it becomes more vulnerable to overtopping if a Somerset dambreak occurs and the operational procedures are designed to minimise that possibility. North Pine Dam is the only major dam immediately upstream of an urban area. Hinze Dam on the Nerang River is owned by Gold Coast City Council and is currently being reassessed for dam break impacts. Under the Queensland Water Act 2000, all authorities are now on notice and where dams fall into specified criteria, than a dam failure impact assessment must be undertaken and the dam licensed.

16 9.16 Table 9. 2 Approximate extent of the estimated impact of dambreaks Damsite Downstream Impacts Furthest Locality Affected Km hr Wivenhoe Brisbane Port Somerset Wivenhoe Dam North Pine Petrie Moogerah Harrisville Maroon Beaudesert The South-East Queensland flood experience Floods are classified by the Bureau of Meteorology (BoM, 1999b) depending on the local flood gauge height and the resulting level of local community impact as follows: 1. Minor flooding: This causes inconvenience such as closing of minor roads and the submergence of low level bridge. 2. Moderate flooding: This causes the inundation of low lying areas requiring the removal of stock and/or the evacuation of some houses. Main traffic bridges may be closed by floodwaters. 3. Major flooding: This causes inundation of large areas, isolating towns and cities. Major disruptions occur to road and rail links. Evacuation of many houses and business premises may be required. In rural areas widespread flooding of farmland is likely. This classification is a measure of a particular community s vulnerability to flooding and does not necessarily mean that a major flood has a low probability of occurrence (see the later section of this chapter, on flood prediction). Only those rivers which are a part of the Bureau of Meteorology warning system are subject to this standard classification. Many rivers which represent relatively lower flooding hazards are separately monitored by the respective LGAs. Figure 9.8 summarises the historical record of highest annual floods for a number of long term gauge sites on the major river systems in the southeast region, derived from Bureau of Meteorology and DNRs records. As Figure 9.8 shows, the record for Brisbane (159 yr) is the longest in the region, followed by Ipswich (107 yr), the Nerang (80 yr) and the Logan (53 yr). The records are, however, incomplete, with many sites having less than 30 years of recorded levels. In the last century, the Australia Day floods of 1974 were the worst period of flooding across the South-East Queensland region, although the 1931 flood was probably more severe locally in the Caboolture and Pine Rivers catchments. The floods of the mid to late 1800s recorded higher levels than the 1974 flood, however, a lower population, fewer buildings and less infrastructure in the region in the 1800s suggest that damage losses were much smaller despite a sparsity of information on the early events. Plates depict flooding in Melbourne St., South Brisbane in February 1893 and January The following discussion provides some further insight into historical flooding episodes in the southeast. (a) Caboolture River and Burpengary Creek Caboolture has always experienced nuisance flooding affecting properties along the Caboolture River, King John Creek and Lagoon Creek, as well as closing local roads (CSC 1994a) (Plate 9.3). Burpengary Creek at Burpengary has historically suffered reasonably consistent low-level

17 9.17 flooding problems in areas around Dale St, Henderson Rd, Springfield Dr and Mathew Crescent (Plate 9.4). Table 9.3 summarises selected flood levels in the Caboolture region. The 1931 flood event (Plates 9.5-6) was probably the most severe in the Caboolture catchment, followed by the 1972 flooding. The floods of December 1991 and January 1974 were also severe floods. A further flood in 1951 is remembered by some local residents. Beachmere is also subject to storm surge flooding. In addition to nuisance flooding affecting buildings, flooding has caused agricultural losses and disrupted transport and communication links in the region as indicated by The Brisbane Courier (7 February, 1931). Great losses in stock and farm produce have occurred in various parts of the district. The train services have again been restored. A rail motor arrived at 1.30 p.m. from Brisbane with passengers, mails and papers. The Gympie mail train departed for its destination shortly after the arrival of the rail motor. Table 9. 3 Selected flood levels in the Caboolture region (from CSC 1994a) River Burpengary Ck Height Station (m AHD) Feb 1931 Dec 1970 Feb 1972 Jan 1974 Apr 1988 Apr 1989 Dec 1991 Mar 1992 May 1996 Feb 1999 Rowley Rd Morayfield Rd Caboolture Litherland's X-ing Caboolture River s/g Morayfield Rd Dux St Beachmere Rd/Rv King John Ck McConachy Rd Bribe Is Rd ? Beachmere Rd Lagoon Ck Bruce Highway u/s Sheepstation Morayfield Rd Ck (b) Pine River System Anecdotal evidence suggests that the flood of February 1931 was the largest known flood also in the Pine River system, followed by the flood of February Unlike the 1931 flood, The Brisbane Courier (10 February, 1893) indicates that flood damage in 1893 was confined to the agricultural district of Pine though the bridge over Cash s Crossing was completely washed away. Of the floods recorded, only those of January 1974 and 1972 were smaller than the 1931 and 1893 floods. In the last two decades, the floods of December 1991 (Plate 9.7) and 1989 have been the largest. The relative magnitude of each flood however varies from creek catchment to catchment and from river reach to reach. Table 9.4 shows selected flood levels in the Pine Rivers region.

18 Figure 9.8: Historical floods in the South-East Queensland region 9.18

19 Figure 9.8: Historical floods in the South-East Queensland region (cont d) 9.19

20 9.20 A report of the 1931 flood from The Brisbane Courier (7 February, 1931) indicates flood damage to agriculture and buildings in Pine Rivers as well as disruptions caused by flooding, as follows: Petrie, February 6. Nearly 30 in. of rain has fallen since the early part of last week, over 19 in. being recorded in the 24 hours ending 9 a.m. today. The Pine River reached its highest during the early part of last night, when a height of 4 ft. above the 1893 level was touched. Cultivation paddocks have been ruined, whole flats being washed bare, while tons of sand and gravel have covered lucerne paddocks. Losses of stock have occurred, and fencing has been swept away. All the buildings of the Wembley Kiosk, on the River Reserve, have been swept away, even the bowser being destroyed. The flood waters on the north side rose so rapidly that the house of Mr W. Barber was surrounded before he and his family could escape, and it was only by firing a rifle that he was able to let neighbours know his plight. Boats had to be procured before they could be rescued. Other residents took refuge in the Show Hall. The kiosk at Cash s Crossing was destroyed, and practically every culvert in the district has been washed away. Milk suppliers have been held up, and all the traffic at Whiteside and Dayboro-road was washed away yesterday. Table 9.4 Selected flood levels in the Pine Rivers region Creek/River Conflagration Creek Freshwater Ck North Freshwater Ck Height Station (m AHD) Apr 1989 Apr 1988 Jan 1974 Feb 1972 Dec South Pine Rd Old Gympie Rd Goodfellows Rd Albany Ck Albany Ck Rd Sandy Ck Albany Ck Rd Colthards Ck Harvey St Saltwater Ck Anzac Ave 2.8 Yebri Ck Gympie Rd 8.9 One Mile Ck Yebri St 10.1 Todds Gully Todds Rd Four Mile Ck Samsonvale Rd Kedron Brook Dawson Pde North Pine R Gympie Rd bridge Petrie South Pine R Gympie Rd between Mott and Kremzow South Pine Rd (c) Brisbane Bremer River system

Plate 9.1: Brisbane, February 1893 Flooding in Melbourne St, South Brisbane (Plate: courtesy of John Oxley Library)
") 9.62 Plate 9.1: Brisbane, February 1893 Flooding in Melbourne St, South Brisbane (Plate: courtesy of John Oxley Library) Plate 9.2: Brisbane, January 1974 Aerial view of South Brisbane showing the southern
9.62 Plate 9.1: Brisbane, February 1893 Flooding in Melbourne St, South Brisbane (Plate: courtesy of John Oxley Library) Plate 9.2: Brisbane, January 1974 Aerial view of South Brisbane showing the southern
FLOOD INFORMATION SERVICE EXPLANATORY NOTES
 FLOOD INFORMATION SERVICE EXPLANATORY NOTES Part 1 About the flood maps Limitations of the mapping What the maps don t show Where to find more information Definitions of words used to describe flooding.
Standard Operating Procedures for Flood Preparation and Response
 Standard Operating Procedures for Flood Preparation and Response General Discussion Hurricanes, tropical storms and intense thunderstorms support a conclusion that more severe flooding conditions than
How To Recover From A Flood In Bundaberg
 BUNDABERG FLOODS NOW THE MUD HAS DRIED FLOOD RECOVERY AT MILLBANK Paper Presented by: Kym Kneebone Author: Kym Kneebone, Assistant Coastal Treatment Co-ordinator, Bundaberg Regional Council 37th Annual
Antecedent Conditions:
 Antecedent Conditions: Record to Near Record Heat occurred across Northeast & North Central Colorado September 2-8. A cold front moved across Northeast Colorado the morning of the 9 th, and deeper subtropical
Flood Facts 2F.1. Flood Facts
 Flood Facts 2F.1 Engage Flood Facts To introduce students to the causes and effects of flooding in Western Australia. Flooding occurs in the Australian environment as part of the natural water or hydrologic
Appendix 3. Historical records of flooding
 Appendix 3 Historical records of flooding Table A3-1. Historical records of flooding in Mid Devon Ref. Date Description Source 1 13 October 1625 A tremendous flood swept through the valley, causing great
General Insurance - Domestic Insurance - Home Contents Storm water damage policy exclusion flood damage
 Determination Case number: 227307 General Insurance - Domestic Insurance - Home Contents Storm water damage policy exclusion flood damage 4 April 2011 Background 1. The Applicants insured their home contents
Objective 4: Enhanced community education, flood awareness and preparedness
 Objective 4: Enhanced community education, flood awareness and preparedness Understanding the extent and full impacts of flooding is essential for planning for potential future pressures on the drainage
The 2011 Queensland Floods
 The 2011 Queensland Floods Bill Syme FMA Conference, San Diego September 2011 Why were Qld Floods Surprising? Different types Flash floods Long duration floods [The Chronicle] Repeat floods (Dalby 5 times!)
Flooding Fast Facts. flooding), seismic events (tsunami) or large landslides (sometime also called tsunami).
, seismic events (tsunami) or large landslides (sometime also called tsunami).") Flooding Fast Facts What is a flood? Flooding is the unusual presence of water on land to a depth which affects normal activities. Flooding can arise from: Overflowing rivers (river flooding), Heavy rainfall
Flooding Fast Facts What is a flood? Flooding is the unusual presence of water on land to a depth which affects normal activities. Flooding can arise from: Overflowing rivers (river flooding), Heavy rainfall
Lower Raritan Watershed Management Area Stormwater & Flooding Subcommittee Strategy Worksheet LRSW-S3C1
 Strategy Name: Reduce Existing Potential for Flood Damages LRSW-S3C1. Develop and implement a program to: Minimize flood damages through the use of structural measures. Minimize flood damages through the
Flash Flood Science. Chapter 2. What Is in This Chapter? Flash Flood Processes
 Chapter 2 Flash Flood Science A flash flood is generally defined as a rapid onset flood of short duration with a relatively high peak discharge (World Meteorological Organization). The American Meteorological
Flooding and Change on the Willamette River
 Flooding and Change on the Willamette River The Willamette River Like many rivers of the northwest the Willamette River once had a very different appearance. It was wild river and as it passed through
Planning for sea level rise. Assessing development in areas prone to tidal inundation from sea level rise in the Port Phillip and Westernport Region
 Planning for sea level rise Assessing development in areas prone to tidal inundation from sea level rise in the Port Phillip and Westernport Region Table of contents Introduction 1 New flood levels for
Contents. Figure Index. 1. Introduction 1. 2. Engineered solutions 4. 3. Conclusions 11
 Contents 1. Introduction 1 1.1 Background 1 1.2 Overview 1 1.3 Objective of this discussion paper 3 2. Engineered solutions 4 2.1 River barriers 4 2.2 Flood gates 5 2.3 Levees and flood walls 5 2.4 Backflow
Management of flooding downstream of dams
 Management of flooding downstream of dams Attachment to Victoria State Flood Emergency Plan Version 1.0 (6 February 2013) This plan is produced by the Victoria State Emergency Service and Department of
Melbourne Water Flood Risk Assessment: How flood impacts are assessed in the Port Phillip and Westernport region
 Melbourne Water Flood Risk Assessment: How flood impacts are assessed in the Port Phillip and Westernport region INTRODUCTION Melbourne Water is the regional drainage and floodplain management authority
Action plans for hotspot locations - Ash Study
 Appendix 9 Action plans for hotspot locations - Ash Study Ash Vale North 1. Local evidence indicates the culvert could not discharge during December 2013 because the outlet was blocked on the western side
Newbiggin House Farm,
 Newbiggin House Farm, Near Waberthwaite Flood Investigation Report 32 Flood Event 30/8/2012 Cumbria County Council Version Undertaken by Reviewed by Approved by Date Preliminary Colin Parkes Anthony Lane
Multi-Jurisdictional Hazard Mitigation Plan
 Flooding General Flooding is the leading cause of death among all types of natural disasters throughout the United States, with its ability to roll boulders the size of cars, tear out trees, and destroy
INFORMATION BULLETIN BUSINESS FLOOD PLANNING AND MITIGATION GUIDE ACE GLOBAL RISK ENGINEERING. Flood risk assessment. Introduction
 ACE GLOBAL RISK ENGINEERING INFORMATION BULLETIN BUSINESS FLOOD PLANNING AND MITIGATION GUIDE Introduction The most common cause of flooding is due to established water storage areas (natural and man-made)
Forecasts, warnings and information
 4 4 Forecasts, warnings and information 4.1 Flood warning systems A flood warning system is made up of at least the following elements: prediction of flooding, usually by reference to river height interpretation
Small Dam Hazard Assessment Inventory
 Small Dam Hazard Assessment Inventory What would happen if your dam were to fail? This is a question that most dam owners hope they will never have to answer. However it is a question you, as a responsible
The Boscastle Flood 2004
 The Boscastle Flood 2004 by Phil Bull Causes of the Flood Physical Causes The flood took Boscastle entirely by surprise - it was a flash flood event & the village is not prone to regular annual flooding
Victorian Floods 2011: Frequently Asked Questions
 Victorian Floods 2011: Frequently Asked Questions Prepared by DSE with contribution from relevant agencies. PLANNING FOR FLOODS Why did this flood happen? Floods are often seen as unexpected natural disasters,
Appendix 3: Glossary. Queensland Floods Commission of Inquiry Interim Report
 Appendix 3: Glossary ABC means the Australian Broadcasting Corporation. ACCESS forecast means a Bureau of Meteorology forecast obtained from the Australian Community Climate and Earth-System Simulator.
11.4 Voluntary Purchase. 11.5 House Raising and Flood Proofing
 11.4 Voluntary Purchase As mentioned in Section 10 in certain high hazard areas of the floodplain, it may be impractical or uneconomic to mitigate flood hazard to existing properties at risk, or flood
FLOOD FORECASTING PRACTICE IN NORTHERN CALIFORNIA
 FLOOD FORECASTING PRACTICE IN NORTHERN CALIFORNIA California Department of Water Resources Post Office Box 219000, Sacramento, California 95821 9000 USA By Maurice Roos, Chief Hydrologist ABSTRACT Although
Preparation. Preparation. Step 2 Prepare an emergency kit. Step 1 Prepare your emergency plan. Step 4 Tune into warnings
 This emergency toolkit provides you with steps to take before and during emergencies to protect you and your property. The Victoria State Emergency Service (SES) is a volunteer organisation dedicated to
Prattsville Berm Removal Project. 1.0 Project Location
 Prattsville Berm Removal Project 1.0 Project Location The project site is located between the New York State Route 23 Bridge over the Schoharie Creek and the Schoharie Reservoir. The restoration plan encompassed
Flood Emergency Response Planning: How to Protect Your Business from a Natural Disaster RIC005
 Flood Emergency Response Planning: How to Protect Your Business from a Natural Disaster RIC005 Speakers: Tom Chan, CEO, Global Risk Miyamoto Greg Bates, Principal, Global Risk Consultants Learning Objectives
London Borough of Merton Local Flood Risk Management Strategy
 Local Flood Risk Management Strategy Summary 2014-2020 Introduction In response to the severe flooding across large parts of England and Wales in summer 2007, the Government has recently enacted the Flood
Cooperative Research Centres Association 2011 Conference. An Electricity Supplier s Perspective Terry Effeney, CEO ENERGEX 19 May 2011
 Cooperative Research Centres Association 2011 Conference An Electricity Supplier s Perspective Terry Effeney, CEO ENERGEX 19 May 2011 Preparation for a Flood Event Flood Risk Management Plan developed
Landslides & Mudslides
 Landslides & Mudslides Landslides, also known as mudslides and debris flow, occur in all U.S. states and territories. In snowy mountainous areas winter snow landslides are called avalanches. Landslides
1 Introduction. 1.1 Key objective. 1.2 Why the South Esk
 1 Introduction 1.1 Key objective The aim of this study is to identify and assess possible options for improving the quality of the river channel and habitats in the River South Esk catchment whilst helping
Structural Damage Due to Floods
 Structural Damage Due to Floods By Craig D. Rogers, P.E. The Federal Emergency Management Agency (FEMA) reports that each year approximately 90 percent of all disaster-related property damage results from
TOWN OF HARRISBURG FIRE DEPARTMENT 6450 Morehead Road, Harrisburg North Carolina 28075 Phone: 704 455 3574 Fax 704 455 6391 www.harrisburgfd.
 FLOOD FACTS AND SAFETY TIPS Floods are one of the most common hazards in the United States. Flood effects can be local, impacting a neighborhood or community, or very large, affecting entire river basins
GEOTECHNICAL ISSUES OF LANDSLIDES CHARACTERISTICS MECHANISMS PREPARDNESS: BEFORE, DURING AND AFTER A LANDSLIDE QUESTIONS FOR DISCUSSIONS
 GEOTECHNICAL ISSUES OF LANDSLIDES CHARACTERISTICS MECHANISMS PREPARDNESS: BEFORE, DURING AND AFTER A LANDSLIDE QUESTIONS FOR DISCUSSIONS Huge landslide Leyte, Phillipines, 1998 2000 casulties Small debris
Essex County Council Flood Investigation Report
 Essex County Council Stock City of Chelmsford Rev Date Details Author Checked and Approved By 01 February 2015 Draft report for stakeholder consultation Ed Clarke Flood Investigation Engineer Lucy Shepherd
Weather Briefing for Southeast Texas October 24 th, 2015
 Weather Briefing for Southeast Texas October 24 th, 2015 Dangerous Flash Flood Event Saturday through Sunday 8:16 AM Overview Ongoing: record deep moisture in place, elevated seas, rip currents, high surf,
water ISSN 2073-4441 www.mdpi.com/journal/water
 Water 2011, 3, 1149-1173; doi:10.3390/w3041149 Article OPEN ACCESS water ISSN 2073-4441 www.mdpi.com/journal/water The 2011 Brisbane Floods: Causes, Impacts and Implications Robin C. van den Honert * and
FLOOD PROTECTION BENEFITS
 IV. (340 points) Flood Protection Benefits A. Existing and potential urban development in the floodplain (50) 1. Describe the existing and potential urban development at the site and the nature of the
Vital Earth Composting Facility Flood Risk and Drainage Statement
 Vital Earth Flood Risk and Drainage Statement Final December 2011 Prepared for Vital Earth Ltd Revision Schedule Flood Risk and Drainage Statement December 2011 Rev Date Details Prepared by Reviewed by
Landslides. Landslides-1. March 2007
 Landslides Learn if landslides, including debris flows, could occur in your area by contacting local officials, your state geological survey or department of natural resources, or the geology department
Background Information: The Mamquam River Floodplain Restoration Project
 Background Information: The Mamquam River Floodplain Restoration Project The Mamquam River Floodplain Restoration project is being undertaken in partnership with the Squamish River Watershed Society, Fisheries
Types of flood risk. What is flash flooding? 3/16/2010. GG22A: GEOSPHERE & HYDROSPHERE Hydrology. Main types of climatically influenced flooding:
 GG22A: GEOSPHERE & HYDROSPHERE Hydrology Types of flood risk Main types of climatically influenced flooding: 1. Flash (rapid-onset) 2. Lowland (slow-rise) 3. Coastal (not covered here) But! Causal factors
River Flood Assessment for northeast SC and southeast NC Saturday, October 17, 2015 1120 AM EDT
 River Flood Assessment for northeast SC and southeast NC Saturday, October 17, 2015 1120 AM EDT National Weather Service Wilmington NC http://weather.gov/ilm Prepared By: Rick Neuherz Richard.Neuherz@noaa.gov
Rural Flooding: The Potential Role of Forestry
 Rural Flooding: The Potential Role of Forestry Nadeem Shah, Tom Nisbet, & Huw Thomas Centre for Forestry and Climate Change Structure Background Woodland and Flood Alleviation The Theory. Studies on Woodland
Pennsylvania Flood Safety Awareness Week March 6-10th, 2015
 Pennsylvania Flood Safety Awareness Week March 6-10th, 2015 David J. Nicosia Warning Coordination Meteorologist National Weather Service Binghamton, NY Flooding is a coast to coast threat to the United
4.2 Buena Vista Creek Watershed
 Buena Vista Creek Watershed 4.2 Buena Vista Creek Watershed Watershed Overview The Buena Vista Creek Watershed is the fourth-largest system within the Carlsbad Hydrologic Unit. The watershed extends approximately
London Borough of Croydon Local Flood Risk Management Strategy
 London Borough of Croydon Local Flood Risk Management Strategy Summary 2014-2020 Introduction In response to the severe flooding across large parts of England and Wales in summer 2007, the Government has
Initial Assessment of Potential Flood Mitigation for Communities Downstream of Googong Dam
 Initial Assessment of Potential Flood Mitigation for Communities Downstream of Googong Dam ICON WATER AND QUEANBEYAN CITY COUNCIL Summary Report 8006314 25 June 2015 Initial Asssessment of Potential Flood
Community Outreach Kickoff Summaries. Boulder Creek and South Boulder Creek Meeting held Jan. 8, 2014, approximately 80 attendees
 Boulder Creek and South Boulder Creek Meeting held Jan. 8, 2014, approximately 80 attendees Key issues Discussed Roads & Access Damaged roads. The Oil & Gas company access roads acted like dams Public
California Floods: Be Aware, Be Prepared
 Flooding in California Do you live in California?Do you visit California? Do you know when it typically floods in California? Do you know that every county in California has been declared a federal flood
The River Ribble is one of the longest rivers in the North West of England
 River Ribble The River Ribble is one of the longest rivers in the North West of England Did you know? The tidal limit of the Ribble is 11 miles inland (above Preston); The River Ribble is home to a variety
History of flooding. 12 Flood Management and Drainage Strategy. Riverine flooding
 History of flooding Riverine flooding The original settlement of Melbourne was situated in a basin intersected by the paths of the Yarra and Maribyrnong Rivers. Many of the early recorded floods occurred
Sutton Harbour Holdings PLC. March 2007
 Sutton Harbour Holdings PLC March 2007 Contents!! " # # $ % % &'(&'' ) ) ( * + ', *!$ -,!'! #. / $$ #% 00& ' 00&1 $ Executive Summary!! " WSP Development and Transportation has been engaged by Sutton
Integrated Local Flood Management and Drainage Strategy OVERVIEW
 Integrated Local Flood Management and Drainage Strategy OVERVIEW Flooding is a natural phenomenon. In urban areas where drainage relies on pipe networks, open channels and creeks, flooding can cause infrastructure
ABSTRACT INTRODUCTION PURPOSE
 EVALUATION OF TSUNAMI DISASTER BY THE 2011 OFF THE PACIFIC COAST OF TOHOKU EARTHQUAKE IN JAPAN BY USING TIME SERIES SATELLITE IMAGES WITH MULTI RESOLUTION Hideki Hashiba Associate Professor Department
MAPPING THE ST. FRANCIS DAM OUTBURST FLOOD WITH GEOGRAPHIC INFORMATION SYSTEMS
 MAPPING THE ST. FRANCIS DAM OUTBURST FLOOD WITH GEOGRAPHIC INFORMATION SYSTEMS J. David Rogers Kevin James Department of Geological Engineering University of Missouri-Rolla St. Francis Dam was a 200-ft
How To Manage A Flood In Mozambique
 Flood Risk Management in Mozambique and Sub-regional Trans-boundary Issues UNFCCC regional expert meeting on loss and damage in Addis Ababa, Ethiopia from 13 to 15 June 2012 Ron Cadribo, UNISDR DRR Advisor,
WILLOCHRA BASIN GROUNDWATER STATUS REPORT 2009-10
 WILLOCHRA BASIN GROUNDWATER STATUS REPORT 2009-10 SUMMARY 2009-10 The Willochra Basin is situated in the southern Flinders Ranges in the Mid-North of South Australia, approximately 50 km east of Port Augusta
ECONOMIC ANALYSIS FLOOD DAMAGE REDUCTION. Lower Carmel River Floodplain Restoration and Enhancement Project
 ECONOMIC ANALYSIS FLOOD DAMAGE REDUCTION Lower Carmel River Floodplain Restoration and Enhancement Project I. Description of the Project and its Relationship to Other Projects in the Proposal The Lower
Local Flood Guide. Safe. Warragul. Flood information for Warragul. Warragul
 Warragul Safe Flood information for Warragul Warragul Local Flood Information The Warragul local area Your local emergency broadcasters are: Warragul is located east of Melbourne. The town s major waterways
Swannanoa River Flood Risk Management Study
 Swannanoa River Flood Risk Management Study Measures Evaluated to Reduce Future Flood Damages City of Asheville U.S. Army Corps of Engineers Flooding History Part of the 132 square mile Swannanoa River
Flooding in Brisbane
 Flooding in Brisbane A guide for residents photo provided by Conan Whitehouse Brisbane is a thriving, world-class city, enjoyed by residents and visitors. Like many cities around the world, Brisbane has
FLOOD RISK RECENT TRENDS AND POLICY RESPONSES
 FLOOD RISK RECENT TRENDS AND POLICY RESPONSES DEVELOPING WESTMINSTER S LOCAL PLAN Booklet No. 2 LDF Consultation - CMP Revision November 2013 INTRODUCTION CLLR ROBERT DAVIS Westminster is at risk of flooding
Tropical Storm Allison
 Tropical Storm Allison June 13, 2003, 2:41PM Two years after Allison, Houston has reached a watershed moment By KEVIN SHANLEY Houston is exploding with growth. But city building can be a messy business,
Challenges. Estimated Damages from 100-Year Flood
 Suffield Suffield is a rural community located along the Massachusetts border. It encompasses about 42.2 square miles and has a population of about 15,735. Suffield s terrain rises from an elevation of
Flood After Fire Fact Sheet
 FACT SHEET Flood After Fire Fact Sheet Risks and Protection Floods are the most common and costly natural hazard in the nation. Whether caused by heavy rain, thunderstorms, or the tropical storms, the
APT Petroleum Pipelines Limited. Queensland Floods
 APT Petroleum Pipelines Limited Queensland Floods Attachment 8.1 Attachment 8.1 Queensland Floods.doc Contents 1 Flood Impact 2010-2011 1 1.1 December 2010 Floods 1 1.2 January 2011 Floods 1 1.3 Impact
ADDING VALUE TO BOM FLOOD PREDICTIONS (WITHOUT MESSING AROUND WITH MODELS)
") ADDING VALUE TO BOM FLOOD PREDICTIONS (WITHOUT MESSING AROUND WITH MODELS) Mark Babister Steve Opper Peter Cinque Matthew Chadwick Belinda Davies Director, Webb McKeown & Associates Director, Emergency
ADDING VALUE TO BOM FLOOD PREDICTIONS (WITHOUT MESSING AROUND WITH MODELS) Mark Babister Steve Opper Peter Cinque Matthew Chadwick Belinda Davies Director, Webb McKeown & Associates Director, Emergency
AN INITIATIVE TO IMPROVE
 L OW E R C A R M E L R I V E R A N D L AG O O N F L O O D P L A I N R E S TO R AT I O N A N D E N H A N C E M E N T P R O J E C T AN INITIATIVE TO IMPROVE FLOOD PROTECTION RESTORE AND PROTECT RIPARIAN
The site is Lot 1 DP 837271. Survey of this lot and Willarong Road and Koonya Circuit is given in Figure 2.
 Our Ref : NA49913151-019-L02:BCP/bcp Contact: Dr Brett C. Phillips 8 th May 2015 Cardno (NSW/ACT) Pty Ltd ABN 95 001 145 035 The Manager Bunnings Group Limited, c/- C&M Consulting Engineers 1/142 James
Landslides & Mudflows
 1 2 - What is a Landslide? - Geologic hazard Common to almost all 50 states Annual global Billions in losses Thousands of deaths and injuries 3 1 - What is a Landslide? - Gravity is driving force Some
Your responsibilities...
 Your responsibilities... Identify if you are living in a flood risk area: visit www.environment-agency.gov.uk/floodline or call Floodline on 0845 9881188. Protect your home or property. Provide your own
Burnt River Black River and Gull River Flood Contingency Plan
 Burnt River Black River and Gull River Flood Contingency Plan Objective: The objective of this plan is to preplan and prepare for flooding events in the Burnt River, Black River and Gull River area of
OURIMBAH FLOOD RESPONSE PLAN
 OURIMBAH FLOOD RESPONSE PLAN February 2014 2 EMERGENCY CONTACT DETAILS Security Services for all Emergencies (24 Hours) Ourimbah 4348 4222 If not able to be reached please call Newcastle on Newcastle 4921
Queensland Election Brief
 Queensland Election Brief January 2012 Table of Contents Introduction... 3 Political and Parliamentary Outline... 4 1. General Election Facts... 4 2. Elections 1998-2009... 4 3. Current State of Parliament...
River Management 2013 Colorado Flood
 River Management 2013 Colorado Flood Damages, Countermeasures, Socio-Economic Impacts Miles Blair, Allen Chestnut, Hwayoung Kim, & Caroline Ubing CIVE 717 Spring 2014 Flood Statistics Sept 9 th 16 th,
Tookany Creek Flood Damage Reduction Feasibility Study Section 205 Continuing Authorities Program
 Tookany Creek Flood Damage Reduction Feasibility Study Section 205 Continuing Authorities Program Field Inspection Notes 27 29 September 2012 Introduction The U.S. Army Corps of Engineers (Corps), in
Preliminary Environmental Information Report: Appendix 16.C. Flood Warning and Evacuation Plan
 Preliminary Environmental Information Report: Appendix 16.C Flood Warning and Evacuation Plan THIS PAGE IS LEFT INTENTIONALLY BLANK Page 2 of 30 Contents SUMMARY 1. INTRODUCTION... 9 1.1 Background...
ROSE CREEK WATERSHED HYDROLOGIC, HYDRAULIC, SEDIMENT TRANSPORT, AND GEOMORPHIC ANALYSES TASK 1 EXISTING DATA AND INFORMATION SUMMARY REPORT BACKGROUND
 ROSE CREEK WATERSHED HYDROLOGIC, HYDRAULIC, SEDIMENT TRANSPORT, AND GEOMORPHIC ANALYSES TASK 1 EXISTING DATA AND INFORMATION SUMMARY REPORT BACKGROUND The Rose Creek Watershed (RCW) consists of three planning
Vermont Economic Resiliency Initiative (VERI) Community Forum Barre City & Barre Town
 Community Forum Barre City & Barre Town") Vermont Economic Resiliency Initiative (VERI) Community Forum Barre City & Barre Town MEETING NOTES April 16, 2015 6:00 8:00 PM VERI Project Overview With funding from the US Economic Development Administration
Vermont Economic Resiliency Initiative (VERI) Community Forum Barre City & Barre Town MEETING NOTES April 16, 2015 6:00 8:00 PM VERI Project Overview With funding from the US Economic Development Administration
Where the city turns to gold
 Where the city turns to gold Relaxed country living with city convenience A show at South Bank, a surf at Burleigh, the lifestyle this convenient location offers is unmatchable. Just minutes by or a quaint
London Borough of Waltham Forest LOCAL FLOOD RISK MANAGEMENT STRATEGY. Summary Document
 LOCAL FLOOD RISK MANAGEMENT STRATEGY Summary Document October 2013 Local Flood Risk Management Strategy Summary 1 Introduction 2 Partner responsibilities 3 What do we know about flooding in the borough?
KNOWING WHEN TO GET THEM OUT - IMPROVING FLOOD EVACUATION PLANNING THROUGH FLOOD MODELLING AND STAKEHOLDER INVOLVEMENT
 KNOWING WHEN TO GET THEM OUT - IMPROVING FLOOD EVACUATION PLANNING THROUGH FLOOD MODELLING AND STAKEHOLDER INVOLVEMENT K McAndrew 1, M Stubbs 2, T Anderson 1 1 Clarence Valley Council, NSW 2 State Emergency
Fluvial non-tidal Fluvial tidal Coastal
 Location: Castleconnell, Co. Limerick Unique ID: 252889 (from PFRA database) Initial OPW Designation APSR AFRR IRR Co-ordinates Easting: 166,390 Northing: 162,679 River / Catchment / Sub-catchment River
The Hydrologic Cycle. precipitation evaporation condensation transpiration infiltration surface runoff transport groundwater water table.
 The Hydrologic Cycle Page 1 of 1 Name Directions: The hydrologic cycle consists of the processes that change and move water through the earth s system. Use the terms below to label the hydrologic cycle.
Station Access Guide. Effective June 2015. queenslandrail.com.au. For further information Phone: 13 16 17 TTY: (07) 3606 5800. Text only: 0428 774 636
 3606 5800. Text only: 0428 774 636") queenslandrail.com.au TTY: (07) 3606 5800 Guide Text only: 0428 774 636 Effective June 2015 For further information Phone: 13 16 17 Queensland Rail Limited ABN 71 132 181 090 QR3672.13_0213 ing City network
queenslandrail.com.au TTY: (07) 3606 5800 Guide Text only: 0428 774 636 Effective June 2015 For further information Phone: 13 16 17 Queensland Rail Limited ABN 71 132 181 090 QR3672.13_0213 ing City network
The Alternatives of Flood Mitigation in The Downstream Area of Mun River Basin
 The Alternatives of Flood Mitigation in The Downstream Area of Mun River Basin Dr.Phattaporn Mekpruksawong 1, Thana Suwattana 2 and Narong Meepayoong 3 1 Senior Civil Engineer, Office of Project Management,
Siting and settlement: The most important way to protect shelter from floods is to build in a place that is unlikely to be flooded.
 Siting and settlement: The most important way to protect shelter from floods is to build in a place that is unlikely to be flooded. Key Messages Shelters and settlements should be sited above the highest
5.0 OVERVIEW OF FLOOD DAMAGE REDUCTION MEASURES
 5.0 OVERVIEW OF FLOOD DAMAGE REDUCTION MEASURES Flood damage reduction consists of two basic techniques structural and non-structural. Structural methods modify the flood and take the flood away from people
Post-Flood Assessment
 Page 1 of 7 Post-Flood Assessment CHAPTER 4 AGENCY COORDINATION Agency coordination is an essential element for the operation of the flood management systems in the Central Valley. Due to the nature of
Martine Jak 1 and Matthijs Kok 2
 A DATABASE OF HISTORICAL FLOOD EVENTS IN THE NETHERLANDS Martine Jak 1 and Matthijs Kok 2 1 Department of Transport, Public works and Water Management Road and Hydraulic Engineering Division P.O. Box 5044
Flooding Hazards, Prediction & Human Intervention
 Page 1 of 10 EENS 3050 Tulane University Natural Disasters Prof. Stephen A. Nelson Flooding Hazards, Prediction & Human Intervention This page last updated on 19-Oct-2015 Hazards Associated with Flooding
Floods are too much water on normally dry land. Rivers can flood after heavy rain has fallen over a long period of time. River flooding can last
 Floods are too much water on normally dry land. Rivers can flood after heavy rain has fallen over a long period of time. River flooding can last weeks or longer. River floods usually occur slowly enough
Flood Warning & Evacuation Plan
 1.00 Planning and Procedures for Staff / Management This Evacuation Plan records the contingency measures that have been drawn up to provide maximum safety to the management and staff using Esperanto Way
4. Environmental Impacts Assessment and Remediation Targets
 4. Environmental Impacts Assessment and Remediation Targets 4.1 Environmental Impacts Significant additional development in the Alder Creek watershed is not anticipated at this time; however, there are