KENNETH WOODS PORTFOLIO MANAGEMENT PROGRAM
|
|
|
- Samantha Warner
- 7 years ago
- Views:
Transcription
 is the largest fertilizer producer in the world by capacity giving investors exposure to all 3")
1 KENNETH WOODS PORTFOLIO MANAGEMENT PROGRAM Potash Corp. Saskatchewan (POT) Buy Report Current Price: CAD $41.94 Estevan Carvajal Fund Manager, Technology and Media September 12, 2012 Highest Potash Leverage & diversified Portfolio: PotashCorp (Ticker: POT) is the largest fertilizer producer in the world by capacity giving investors exposure to all 3 fertilizer nutrients driven by top-tier assets, greatest barriers to entry and pricing power. More importantly, POT is the largest low-cost producer of Potash with 50% of the worlds deposits located in its backyard which supplies 20% of global demand while sustaining an industry leading Potash margin of 64%. POT also owns substantial investments in major global fertilizer companies (Sociedad Quimica y Minera de Chile, Israel Chemicals Ltd, Arab Potash Company Ltd, and Sinofert) which help participate in strategic global demand for fertilizer ($7.9B unrealized gain and $0.4B in dividends & equity income in 2011). High Walled Barriers to Entry with Potash Expansion Nearly Complete; Well Ahead of Peers POT controls 50% of potential industry Potash expansion at lowest capital cost as its $8.1B Brownfield expansion will be 95% spent by the end of 2012 which positions Pot well for future demand growth even if prices weaken. As a result, Pot has an advantage over its peers that have yet to surpass steep barriers to entry as capital costs may increase (+$8.1B) and long lead times for development (over 7 years) may coincide with market corrections that may make large capital spending unattractive. Solid Strategy allows POT to also be 3 rd largest producer of Nitrogen & Phosphate: Pot has developed a strategy for each of its segments: Potash - disciplined production coupled with growth; Phosphate improve earnings stability; Nitrogen - maintain low cost position to maximize margins. As a result, POT is also the 3 rd largest Nitrogen producer & fully integrated Phosphate producer with 93% of high quality rock produced in its Aurora and White Springs mines coupled with a diversified product mix. Low Costs and Capex should help weather a downturn: Pot s operating costs are very low, especially for its potash mines with 65% variable costs and a sustaining Capex of $0.5B which provides POT with a healthy cushion as demonstrated in 2009 when POT suffered from depressed fertilizer prices and a significant reduction of its operating capacity at its potash mines. Despite these headwinds, POT managed to generate $925MM in cash flow from its operations vs. losses sustained by POTs peers. Going forward, this strength coupled with a significantly lower capex post-2012, (accelerating FCF +2x) positions Pot as most preferable vs. other industry peers in the event of a global downturn. Potash Corp. NYSE: POT Market Cap $37.09B Shares Out M Last Closing Price $ Week High $ Week Low $36.73 Current P/E 13.01x EV/EBITDA 8.00x Source: Bloomberg Phosphate Producers by Nutrient Capacity (nm metric tons), 2011 Potash Gross Margin by Company, f Theme of oversupply created by rapid potash expansions by 2015 One of the concerns of the market regarding potash is the line up of huge capacity expansion in next 5-7 years. This will pressurise utilisation rates and then pricing as the capacity build up in next 5-7 years will lead to a fall in utilisation rates to 70% on average from historical average of 80% ( ex 2009). However given the low cost of these mines, the utilization rate is expected to not have a significant effect on the operating margins. It also important to note that this new capacity will be driven by an oligopoly market with few existing major players which would not materially impact the "supply flexibility" for POT. Thus, new players will act as marginal suppliers in the potash trade market and thus will be price takers rather than price makers. Valuation Currently cheap: POT is an attractive value play with a current P/E of trading at the lower end of its 7 Yr. avg. and between 3x to 27x over the past 5 years with an average of 16x. As a result, by applying a discounted 15x PE multiple to our 2013EPS estimate of $3.50, we derive a target price of $52.5 warranted by Pots industry leading potash margins, low-cost potash business, oligopoly production capacity growth, and accelerated FCF (expected to double from 2012 to 2014) opening the window for a share Buyback program. Furthermore, the low valuation is not justified given strong growth outlook for the industry. 1
2 Table of Contents Industry Thesis Approach...3 Industry Macro Graphs Overview...4 Nutrient Overview...5 Company Description...6 Corporate Overview & Management...7 PotashCorp Assets...8 Potash Segment...8 Phosphate Assets Integrated Producer Nitrogen Assets Catalysts for the Stock Further Positive Factors for the Stock Risk Overview Effect of Extra Potash Supply Online Post Valuation Investment Case Appendix *Please See Appendix to Grasp Fertilizer Overview Prior to Reading Report 2
3 Industry Thesis Approach Looking into structural growth Fertilizer shares are usually traded on short-term demand and longterm supply estimates giving the opportunity to buy structural growth at an inexpensive valuation as 1) demand should rise progressively from 2013; 2) supply looks likely to remain rational in the mid term; 3) Imports in key markets have been deferred; and 4) valuations are very cheap. Global NPK Fertilizer Consumption (million metric tonnes) Growing Appetite for Demand - Acreage expansion opportunities are limited so rising food demand has to be met by yield improvement. Increasing population and rising protein demand coupled with a grain stocks to use ratio well below needed minimum levels stress the need for optimal application of fertilizers, providing the bull case for K and P. Supportive Fundamentals Elevated grain prices have led to record profitability levels for farmers which provide strong incentive to increase productivity facilitating optimal use of all fertilizers. The current drought has also decimated corn crops to record levels which means a robust planting season will make 2013 very strong in order for crop planters to satisfy unmet demand which will support corn prices at +$6.50 until at least midterm. Supply is expected to remain rational Attractive return in fertilizers business has led company s to think about capacity expansion. However, Greenfield expansion is extremely expensive and although majority of projects will go ahead, the market is controlled by few players who will balance the demand/supply equation in the medium term. Indian Imports heavy reliance on foreign production (000 t/y) Imports are deferred not vanished: India and China have limited resource bases for K and P, while India is structurally short on N as well. Both countries are already facing significant food inflation; as such they can ill-afford to delay fertilizer demand for long unless it is at the expense of local agro economics. Brazil is a key agriculture powerhouse, which is on a rising import trend, especially for K and P, driven by its agriculture boom which is very positive for the fertilizer trade. While the industry s valuation multiples are off their recent lows. They remain well below their peaks during times of expansion 3
")
4 Industry Macro Graphs Overview (Sources: USDA, FAO, UN, Ferticon, CitiReasearch) 4

5 Nutrient Overview 5


6 Company Description A Diversified Giant with a Fortified Moat Canadian based (PotashCorp) is one of the world s largest fertilizer manufacturing enterprises involved in the production of all 3 fertilizers nutrients with nitrogen, phosphate, and potash producing assets in Canada, the United States, and Trinidad. Out of the 12 largest producers, it is the world s largest manufacturer of potash fertilizers with 20% global capacity, with 5 large, low-cost mines in Saskatchewan and one in New Brunswick. POT is also the world s 3rd largest producer of both nitrogen and phosphate. The company sells its products in more than 50 countries, with half of its fertilizer sales volumes (predominantly potash and phosphate) sold internationally. Over the past two decades, PotashCorp has undertaken a number of acquisitions, boosting its size and scale. These acquisitions have included purchases in Chile, Jordan, Israel and China in line with its projection that much of the anticipated potash growth will occur in emerging offshore markets. With regard to US manufacturing facilities, the company has plants in Florida, Georgia, Louisiana, North Carolina and Ohio. The company s headquarters are in Saskatoon, Saskatchewan, and it has about 5,486 employees. Source: Company Filings 6

7 Corporate Overview & Management Potash Strategy: Match production to market demand POT has a two part strategy in its potash business segment. The 1st is to match its potash production to market demand in order to minimize downside risk and conserve the long-term value of its resources. Approx.70% of the company s potash operating costs are variable, which provides production flexibility during periods of lower demand. The 2nd strategy is to build on its position as the world s largest potash producer by completing Brownfield expansions and debottlenecking projects at its existing mines and investing in other global potash-related companies. Source: PotashCorp Phosphate Strategy: Increase earnings stability PotashCorp s phosphate strategy is to produce a diversified mix of phosphate products in order to maximize returns and increase earnings stability. The company has enhanced its position in the phosphate feed and industrial businesses, which have historically been more stable as there are fewer global producers vs. the fertilizer segment. Source: PotashCorp Nitrogen Strategy: Low cost producer PotashCorp s nitrogen strategy is to maximize gross margins and earnings stability by being a low-cost nitrogen producer to the US nitrogen market. This is supplemented with an emphasis on sales to industrial customers who value long-term, secure supply. Source: PotashCorp 7


8 PotashCorp Assets POT produces 3 primary crop nutrients: potash, phosphate, and nitrogen. The company s focus is on its potash assets located in Saskatchewan and New Brunswick, as well as strategic offshore investments in potash-producing companies in Chile, Israel, Jordan, and China. POT is the world s largest potash producer with almost 20% of global capacity. In 2011, potash accounted for approx. 64% of the company s gross margin, compared to 15% for phosphate and 21% for nitrogen. As seen below, the time period of showed a very quick reversal for Potash Corp where revenues fell by nearly 60% y/y, gross margin by nearly 80%, and EBITDA by nearly 70%. Yet in contrast to so many other companies in the commodities/materials sector during that time, POT remained profitable the company earned $1.08 per diluted share for Potash Corp. Financial Summary As a result, Potash has been the primary contributor to the company s financial results with leading gross margins over the other 3 nutrient as illustrated in the graphs below. POT Gross Margin by Nutrient ($billions) POT Sales by Nutrient ($ billions) Source: Company Filings, Barclays Potash Segment Lion s Share of World Potash Reserves in POT S Backyard Potash is a strategic asset with highly concentrated production. Commercial operations are currently located in 12 countries with approximately 90% of the global potash reserves located in Canada, Russia, and Belarus. The Canadian province of Saskatchewan has almost half of world reserves and 35% of global capacity. 8


9 As a result, the major offshore consuming markets in Asia and Latin America which have little or no indigenous production capability rely primarily on imports to meet their needs. This is an important difference between the potash business and the other major crop nutrients. Trade typically accounts for approximately 80% of demand for potash, which ensures a globally diversified marketplace. The large producing regions of Canada and the former Soviet Union have small domestic requirements and therefore are significant exporters. Worlds Largest Producer in an Oligopoly Market As a result of Potash reserves being highly concentrated among few nations, POT is the worlds largest producer with capacity highly consolidated among six big market players: PotashCorp (18%), Uralkali (18%), Mosaic (13%), Belaruskali (12%), ICL (9%) and K+S (8%), together holding around 78% of world capacity. World Potash Producer Profile Few Players: 2012 Plant Capacity In addition, exports are even more consolidated with BPC (owned by two of the main players in the FSU, Belaruskali and Uralkali) and Canpotex (Canadian marketing firm owned by three main producers of Canada PotashCorp, Mosaic and Agrium) controlling around 70% world s traded potash. On the other hand, consumers (farmers) are highly fragmented, so pricing power lies with the suppliers. As such, these major players are able to keep prices artificially high and demand plays a more important role than supply conditions. These characteristics define 2008 price run despite abundant supply at that time. Supply is responsive to demand and while capacity expansions are underway market supply will still be driven by major players. Canpotex: International Offshore Potash Marketing Partnership Potash from POT s Saskatchewan mines that is shipped to customers outside of North America (66%) is sold through Canpotex, the marketing organization jointly owned by POT, MOS, and AGU. Potash Corp., as the largest Saskatchewan producer by capacity, supplies the largest share of Canpotex sales (53.6% of the total in 2011). POT Sales Volume by Region In 2011, Canpotex s annual potash sales were 8.2 million tonnes, sold mainly to the company s top five markets: China, India, Brazil, Indonesia, and Malaysia. In 2011, China began purchasing potash under six-month pricing contracts with minimum annual volume commitments, a change from its historical annual pricing contracts. In India, potash is typically purchased through annual volume and price contracts. Latin American customers tend to purchase potash on the spot market. 9

10 Canpotex Sales (2005 to 2011E) Canpotex oversees a specialized fleet of 5,400 railcars, terminal facilities in Vancouver and Portland and a fleet of four ocean vessels. In preparation for the Saskatchewan potash capacity expansions underway, Canpotex is investing in 11 additional ocean vessels between 2011 and 2014 and a potential third terminal in Price Rupert, BC on Canada s West Coast, which is expected to add 11 million tonnes to its current annual export capacity of 14MM tonnes. Enormous Potash Mines & Still Growing POT operates 6 potash mines in Canada: four conventional underground mines and one solution mine (Patience Lake) in Saskatchewan and one underground mine in New Brunswick. Total nameplate or peak capacity was 13.3 MM tonnes as of the end of 2011, with estimated actual operational capacity of 11.3MM tonnes representing ~20% of total global potash capacity. Potash Mine Capacity Total potash Volumes Shipped (K tonnes), f Source: Company Reports The company s potash reserves at the mines are vast, totalling 1.69 billion tons of recoverable ore as of the end of 2011 enough for 75 years of remaining operational life at its shortest-lived mine, Lanigan. Cory and New Brunswick are both estimated to have over 100 years of mine life remaining. Well Positioned to Significantly Grow Sales Volumes with Majority of Capex Behind New potash supply will be required in coming years to keep pace with rising demand. In 2003, POT began a CDN $8.2 billion Brownfield Potash expansion program designed to raise annual operational capability at existing mines to 17.1 million tonnes by By mid 2011, 2/3 of the capex was already spent and five parts of a nine-project program were completed, which significantly reduces capex risk for the company and leaves PotashCorp well positioned compared to its competitors that have significant expenditures ahead and face the risk of cost increases and timeline. In addition, capex will be winding down from as the project nears completion allowing FCF to double. Source: Company Reports 10

11 The $8.1B Brownfield Potash Expansion is made up of the following initiatives: Allan Potash Expansion: The first of two expansion projects at the Allan facility was completed in 2007 and brought an additional 400k tonnes of previously idled potash operational capacity back online. The second expansion project, which will increase operational capacity by another 1MM tonnes, is set to conclude in late 2012 with a ramp up to full production by It is currently forecasted to cost approximately $980MM. Cory Potash Expansion: The Cory facility is also undergoing a two-phase expansion, with the second phase anticipated to finish by the end of The second phase encompasses the construction of a new mill that will allow for an incremental 677,000 tonnes of operational capacity and require an anticipated total cost of $1.6B. Rocanville Potash Expansion: The Rocanville mine expansion is also in its second phase and is one of the largest growth initiatives. The second project will cost approximately $2.8B and involves the construction of a new mill, a personnel and materials shaft, and a 500k tonne storage warehouse. Upon completion in 2014 and a ramp up in 2015, approximately 2.7MM additional tonnes of operational capacity are anticipated. New Brunswick Expansion: POT is developing a new mine (complete with two new shafts) together with a new mill with greater compaction capacity, expansion of the existing mill, a new brine pipeline and other new structures (resembles a Greenfield project). Completion is targeted for 2013, reaching 1.8MM tonnes of operating capacity (up from 0.8MM today) by Total cost is expected at ~$2.2B, recently revised up from $1.7B. Repercussion of lowered Capex = Increased Dividends & Share Buy Back Opportunity With capex lowering down, POT announced, on September 13, 2012, a $0.07/share increase in its quarterly dividend; which will now be $0.21/share ($0.84 annual), an increase of 50%, from $0.14/share previously. At its current price of US$41.94 per share this equates to a yield of approximately 2.0%. The increase will raise PotashCorp s annual dividend payments by $241 million to $722 million with an estimated payout ratio for 2013 to rise to 22.2%, from 14.8% previously. POT has raised its dividend twice in the last two years with the most recent increase highlighting PotashCorp s strong cash flow generation and the board's comfort with its financial outlook. Source: Company Reports 11

12 Potash-Related Investments Provide Increased Financial Value The value of Potash Corp extends beyond individual operations and growth opportunities providing significant financial and strategic value that may be overlooked in the current stock price. POT holds significant equity investments in some of its global competitors: 28% of Arab Potash Company (APC), 32% of SQM of Chile, and 14% of Israeli Chemicals Ltd (ICL) that together, on a proportional basis, represent 2.1MM tonnes of capacity (Note POT reports income from these investments under the equity method). Like PotashCorp, it is expected that these strategic investments in producers like APC, ICL and SQM are preparing to participate in future demand growth by expanding their existing operations. In addition, Sinofert, China s largest potash distributor is expected to profit from increasing demand. As earnings in these companies grow, POT can benefit through higher dividends (ICL, Sinofert) and greater equity earnings (APC, SQM). As of the most recent market close, the total market value of POT investments are $8.9B, or $10 per POT share. All together, these investments brought in $133MM in equity income and dividends in 2Q12 (and $396MM in FY2011). PotashCorps Offshore Investments provide additional Potash Leverage 23% 12


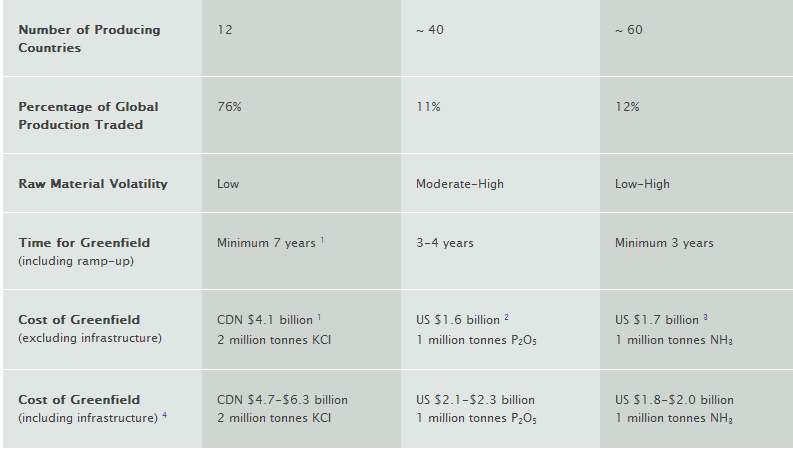
13 Steep Barriers to Entry - Requires Significant Investment & Time Entry into the potash business carries substantial risk because of the significant cost to build new supply while the development timeline can take up to 8 years. Developing the necessary infrastructure outside the plant gate (including rail capabilities, utility system and port facilities) and the potential purchase of a deposit could push the total cost of developing a conventional 2-million-tonne Greenfield mine in Saskatchewan above CDN $6 billion. As a result, the very high capital cost to develop Greenfield potash mines and mills will prevent smaller exploration companies from transitioning into producers which will inevitably help maintain the tight market structure and the pricing power enjoyed by the largest producers. Estimated Greenfield Potash Capital Costs Greenfield Development Timeline Capex for Greenfield vs. Existing Brownfield Expansion Similarly, PotashCorp highlights the high level of capex requirement for new Greenfield projects is 2.5 times higher than a POT Brownfield expansion. In addition, new mines available to new players are further below ground, driving both capex and opex costs significantly above current production costs of major players. Production Strategy: Swing Producer - Operate mines to meet demand PotashCorp and its Canpotex partners are viewed globally as swing producers, whereas other producers generally try to maintain full operational capacity. As a result, POT s production strategy for its potash assets is to match market demand in an effort to minimize downside price risk and conserve the long-term value of its potash resources. As a result, capacity utilization rates have historically ranged between 50% and 80%. In 2009, as a result of the global economic crisis, the company s capacity utilization rate dipped as low as 26%, before rebounding in 2010 to 60% utilization. Potash Capacity vs. Est. Operating Rate Total Free Cash Flow, f ($billions) Source: Company Reports, Barclays 13
, a relatively high variable cost ratio (60-65% by the company s estimates), and influence over the majority of the world s traded supply, the")
14 Pots large percentage of total global capacity (~20%) is also compounded when considered in context of Canpotex, which currently controls around 40% of the global seaborne traded potash market. With low production costs (approximately $148/tonne), a relatively high variable cost ratio (60-65% by the company s estimates), and influence over the majority of the world s traded supply, the company is able to slow or curtail production, take a slight hit on per-tonne costs, sell fewer shipments, but still hold the line on pricing and maintain profitability even in highly challenging times. An increase in capacity would not undermine POT's flexibility to adjust supply One of the concerns of the market regarding potash is the line up of huge capacity expansion in next 5-7 years. This will pressurise utilisation rates and then pricing as the capacity build up in next 5-7 years will lead to a fall in utilisation rates to 70% on average from historical average of 80% ( ex 2009). Major Capacity addition will come from major 6 players (Source: Fertecon, Citi) However, most of this new capacity will be driven by existing major players and this additional capacity would not materially impact the "supply flexibility" of these players including POT. As mentioned before 65% of additional capacity is set to come from Major 6 players with POT contributing the most, 18% from China (from various small players) and only 11% from other players. Of these other players, EuroChem Kotelnikovo's project accounts for 45% of addition followed by Dekhanabad potash fertilizer facility expansion by Uzbekistan government. (Thus, these new players will act as marginal suppliers in the potash trade market and thus will be price takers rather than price makers. Global Production Capacity (000 t/y) e Top Tier Gross Margin While POT has long enjoyed a gross margin toward the top of the industry tables, Potash s stated strategy for years has been that the company has been positioning itself for the long term, expanding its operating capacity even though it has been running below its maximum capability. As a result, management believes that demand growth trends for potash fertilizers will lead to the eventual need for additional supply supply that POT will already have in place, ready to bring to market. Total Potash Volumes by Company, f (mn tonnes) Realized Potash Gross Margins by Company, f Source: Company Reports, Barclays 14
15 As a result, POT has the flexibility, and the margin space to absorb fluctuations in operating rates where the potash division has run at capacity utilization as low as 32% in 2009 and as high as 82% in Although there is the question to whether this will continue to be as effective as it has been in the past if potash demand growth remains moderate and the incremental production capacity that has been in process for nearly a decade becomes available over the next several years, POT is expected to continue as it has historically increasing production moderately but maintaining a level of supply supportive of prices (via a lower operating rate) while absorbing slightly higher fixed costs on an absolute basis. India s Role for Potash India, the 2nd largest potash user in the world presents itself as a challenge and an opportunity for the fertilizer industry. The cut in government subsidies alongside this year s slow monsoon rain has worked against India s growing population and demand for food. The Indian government Top World Potash Users 000mT of Potash tries to walk the line between ensuring low cost food is produced (by controlling rice prices, for example) while seeking to increase food production by agronomic education programmes and subsidizing fertilizer costs to encourage its use. However, as part of its budget deficit reduction targets, it has changed its fertilizer subsidy regime such that the price to farmers has almost doubled for K and P this year. In addition, according to the FAO: The use of plant nutrients per hectare is relatively low and imbalanced, and this is one of the major reasons for low crop yields in India. Corn: Correlation between Fertilizer Application Rate & Yield India s Growing Use of Fertilizer Government Subsidies The fall in the rupee and the worsening economic situation led India to cut its fertilizer subsidy this year, destroying demand by 25%, according to the FAI. Indian Imports heavy reliance on foreign production Its subsidy cutbacks will have an impact on the global market given 45% of DAP trade and 15% of all potash trade in 2011 were sales to India. This has led to a period of price weakness for phosphate and relative stability for potash. Higher prices and a falling rupee in the world currency markets have seen DAP prices in India rise by over 180% and MOP by over 100%, since the scheme started this year versus the average price to farmers in

16 The key issue is that India plays a major role in global fertilizer markets and the way its agricultural industry is regulated and subsidized is unhelpful to stability of markets and the future of Indian agriculture. It needs to substantially improve its use of fertilizers in order to boost grain output. India should be one of the key drivers of global volume growth but its demand will decline this year. Indian fertilizer demand is set to rise; it needs to increase in order to feed its growing population. Indian agriculture is part of the solution to improving food production and is likely to be a key growth market. But these needed trends are not going to be visible in 2012 although many expect a strong volume recovery in 2013 as the effects of the changes to the fertilizer subsidies work through the system Demand Outlook Positive A reduction in global demand for Potash this year is expected to be about 52m tonnes of KCl equivalent from about 56m tonnes in However, a strong recovery in 2013 is expected. Grain yields will be significantly impacted after 2 yeas of no use of Potash Indian fertilizer holiday for potash can last one to two years at most before all must be replenished The major factors to the demand weakness, despite the high level of farm profitability in most regions, are Indian subsidy changes and destocking in Europe as a result of the financial crisis. As a result, it is believed that the market has already factored in low level of demand from India in 2012 and the current focus of the market is potash demand from Brazil, China and the US. Farming is very profitable in geographies that represent 75% of global import potash demand (that is just about everywhere except India). Even Potash at US$ /tonne CFR would only slightly dent profitability, which would still be at record levels versus history. As such, a balanced market is expected in 2012 and therefore no softening in potash prices is expected. India potash demand can hold until 2012 POT believes contracts in India will not be settled until late 3Q12 and that they will be at the lower end of previously estimated m tonnes. BPC (potash alliance of Russia and Belarus accounting for 35% of global supply) expects all potash producers will be able to achieve a US$550/tonne CFR price by August in Brazil. Estimates for year end price of $510/tonne looks conservative but from 2013 onwards, it will be difficult for India to contain its potash demand unless it is at the expense of yield. It is expected that 4.5% growth in potash volumes for the next 3-4 years (2013+) will prevail while estimates are being conservative side. Potash Prices holding Up despite all time high Potash inventories Delays in Indian and Chinese contracts meant a historical build up in North American inventories this year. At the beginning of the year, inventories were 32% higher than the 5 year average. Inventories kept on piling until March and were seen 50% higher that 5 year levels. To tackle these conditions, several potash producers curtailed their production. Planned shutdowns were brought forward, such as POT which announced that it will take down the Lanigan mine for another month and will not restart the mine until mid-october. As such, North America producer inventories dropped 462k mt during July to ~2.5mmt. However, stocks have remained flat or increased in the past 16


17 three months in SE Asia, Brazil, China and India (accounting for 40% of global potash demand). Stock builds and demand destruction is being caused by buyer caution and currency depreciation in major importing markets. North American Producers Potash Ending Inventory Std. Vancouver Price vs. North American Producers Inventory Interesting to consider in light of these conditions is potash price movement. Prices are up 14% YoY despite 51% build up in inventories over the same period. Part of the potash strength is attributable towards strong farming conditions in 2011 and then the run up in commodity prices indicating strong demand elsewhere even in the absence of Asian buying. Indian demand is still elusive despite the pick up in monsoons, which are hurting current sentiments. Prices are still below the 5-year average potash prices of $522/MT while operating costs have picked up due to expensive labour and energy costs. In summary, it is believed prices will remain stable at the current levels for the rest of the year and can rise further in 2013 as demand picks up on strong fundamentals. Phosphate Assets Integrated Producer Phosphate Segment Facilities PotashCorp is the 3rd largest phosphate producer in the world with about 5% of global capacity. The company is an integrated phosphate producer with phosphate rock mines (9.6 million tonnes capacity) and liquid/solid phosphate production facilities (8.0 million tonnes capacity) in North Carolina, Florida, and Louisiana. This creates a competitive advantage for PotashCorp given its lower-cost, high-quality phosphate rock that is used in producing feed and industrial grade phosphates along with solid phosphates (MAP and DAP) and liquid phosphates (Merchant Grade Acid (MGA) and Super Phosphoric Acid (SPA). Source: Company Reports 17

18 Vertically Integrated Rock Supply Provides Lower-Cost Position Prices for phosphate rock, sulfur and ammonia, the primary inputs for the production of solid phosphate fertilizers, have increased significantly over the past 5 years. Rock prices have more than tripled since 2005, which has resulted in higher production costs for the approx. 30% of global producers that rely on purchased rock. Acess to lower-cost phosphate rock is the basis for success in the phosphate business and provides a significant margin opportunity for producers like POT with their own supply of rock. Potash Corps integrated operations at Aurora and White Springs produce 93 percent of their total phosphate rock requirements. Integrated vs. Non-Integrated Cost of DAP Production Phosphate Rock Price, Morrocco (US$tonne) Source: Company Report, Barclays PotashCorp. Phosphate Facility Capacities (as of year end 2011) The Aurora complex, located just off the Atlantic coast of North Carolina 130 miles east of Raleigh, is the largest combined phosphate mine/fertilizer processing facility in the world, with a 6MM tonne (capacity)/year rock mine, 4 phosphoric acid plants, and granulation plants for the production of DAP/MAP. POT s White Springs complex, located roughly 70 miles west of Jacksonville just south of the Georgia state border comprises a 3.6 MM tonne (capacity)/year rock mine as well as 2 production centers with phosphoric acid, and sulfuric acid. A Consistently Profitable Phosphate Franchise POTs phosphate sales have been an important component historically, and one that is expected to remain relatively constant going forward. With gross margin percentages continuing to average in the low 20s and total shipments running just below 4 million tonnes, this segment should continue to contribute $ million in gross margin per year given expectations for a modest increase in DAP/MAP pricing over the near/medium term. Phosphate Segment Sales/Gross Margin, ($billions) Phosphate Product Volumes (k tonnes) vs. Avg Realized Price Source: Company Reports, Barclays 18
19 Compared to other phosphate producers Potash Corp. s operations measure up reasonably well. While volumes are substantially less than that of Mosaic, POTs gross margins have been consistently higher; in contrast, the company sells more phosphate volumes than either Agrium or CF Industries but at a slightly lower realized margin here Agrium leads the sector with its geographically advantaged pricing and low-cost sulfur supply. Total Phosphate volumes by Company, f (mn tonnes) Realized Phosphate Gross Margins by Company, f Source: Company Reports, Barclays 2012 Demand Mixed Bag Prices Flat Corn to DAP prices ratio DAP derated vs. grain Phosphate pricing has been pretty much stable, but weak over the last 18 months. It is predicted that the market will pick up in the second half of the year as buyers think that the market has reached a low point and in the medium term, prices will rise as supplies become tighter. DAP is used by a large number of crops and is around 42% above its trough of January It has also historically displayed the strongest correlation with the price of corn (R² 0.899), which should mean prices will rise higher. However, DAP prices have derated versus grain prices recently. Specifically, the price of DAP is trading at a ~25% discount to its implied price based on its historical relationship to corn. This is due to 1) soft Indian demand and 2) off-peak demand in NA. Therefore prices should remain weak for the rest of the year. The change in Indian subsidies has destroyed demand at home and is the biggest threat to demand and price over the next two years. DAP imports to India could be as little as 2.5 mn tonnes vs. (2011: 6.83 mn). So far, India has remained out of the market, using its inventories of 1.5mT DAP to shield it from the rising costs of imports (from lower rupee) but it will need to buy eventually. If there are no further contracts to India at all this year, this will push down prices, especially in the US, which accounts for 30% of exports to India. As a result, prices should continue to be weak this year with Indian subsidies and the global economic situation depressing demand. Fertecon believes MAP will peak this year at $535/st (2011 peak: $635), this suggests a 3% upside on the current price. 19


20 Outlook More Bullish Brazil is to be a major driver of world growth for DAP and MAP, with 6.07% and 5% growth YoY in each, respectively. Demand should also come from China where, despite capacity increases of 1.36% to 2015, demand is increasing faster than production. In the long term, global demand is set to rise 2.8%, outstripping production increases 2.27%, this should favour price increases to Application Rates (Drought Years in dotted boxes Further, demand is likely to increase in the US, following historical trends in the year after droughts. Looking at two previous drought years, 1983 and 1988, helps frame how the moving parts of nutrient use, application rates, and acres impacts fertilizer shipments. North American phosphate demand actually increased in both 1984 and 1989 (the year after each drought), by an avg. of 8%. Nitrogen Assets Integrated Producer Lower-Cost Supplier of Nitrogen to the US Market PotashCorp is the 3rd largest nitrogen fertilizer producer in the world with about 2% of global capacity. Nitrogen markets have typically been more volatile than potash and phosphate and it is a very fragmented market, with the top five private sector companies (Yara, CF Industries, PotashCorp, Agrium, Koch) controlling only 10% of the global ammonia capacity, compared to potash where the top five companies (PotashCorp, Uralkali, Mosaic, Belaruskali, K+S) control 75% of the global potash capacity, and compared to phosphate where the top four companies (Mosaic, PotashCorp, Yuntianhua, OCP) control 37% of the global phosphoric acid capacity. POT Nitrogen Facility Capacities (as of year end 2011) Nitrogen is largely a regional business with the US importing more than 50% of its nitrogen based fertilizer. As a result, accessibility to lower-cost natural gas and proximity to markets are critical factors for success in the nitrogen business. POT contains 3 facilities in the US and 1 in Trinidad which are well located to serve the large US market with a total annual ammonia capacity of just over 3.5 MM tonnes. In addition, US plants are located in regions geographically insulated from the highly competitive US Gulf, which allows to better serve local agricultural markets and industrial buyers for which quality &security of supply are key. 20

21 Gas Prices Still Relatively Cheap Because of the ramifications of the shale gas revolution the global cost curve has flipped with North American gas prices now toward the low end. With natural gas making up between 70-90% of a nitrogen producer s cost structure, the price of products such as ammonia and urea tend to track natural gas prices fairly closely. Source: Company Reports POT also has long term natural gas supply contracts in Trinidad for the majority of its feedstock needs which are indexed to the spot price of ammonia in Tampa (a common practice), which acts as a stabilizer to profitability when those prices rise and helping protect margins if they fall. As a result, Pot has a long-term advantage with more than 80% of their average Trinidad natural gas volumes locked in through 2012, and more than 60 percent secured through As a result, by having four modern, highly efficient ammonia plants including one in Trinidad with a short sailing distance to the US, PotashCorp is a lower-cost exporter to this market and with the rapid development of shale gas provides a significant cost advantage compared to nitrogen producers in Ukraine and Western Europe. The company is expected to further leverage this position by investing $158 million to resume approximately 500,000 tonnes of ammonia production at Geismar, Louisiana in the third quarter of Nitrogen Focused to cater to the Industrial Market Like PotashCorps phosphate business, the company s nitrogen segment is smaller but it remains a major piece of the overall business important enough that the company is investing $158 million to restart ammonia production at its Geismar facility, adding 500,000 tonnes of capacity (an increase of 14%). As mentioned above, Potash Corp purposely aims its nitrogen sales at industrial customers in preference over agricultural (fertilizer) sales, intending to maximize the stability of shipments and margins. As shown below, this strategy has worked as intended volumes have remained fairly constant across all nitrogen products and sales, while still below the peak of $2.5 billion reached in 2008, have driven higher gross margins each year since the downturn. Nitrogen Segment sales/gross Margin ($ billions) Nitrogen Sales by Product (k tonnes) Source: Company Reports, Barclays 21

22 Compared to the other major nitrogen producers, POT is behind CF Industries, the market leader, in terms of volumes shipped, but the company s ability to maintain a competitive margin even while supplying a more industrial customer base is impressive. With the Geismar restart, a moderate increase is ex. in nitrogen shipments. Total Nitrogen Product Volumes by Company (k tonnes) f Nitrogen Segment Gross Margin % by Company Source: Company Reports, Barclays Urea & Ammonia Pricing Urea: Global Prices ($/st) US urea is up 15% since the beginning of the year and almost 20% since January 2011 to $455/st, pushing margins above Middle East to over $200/st. Black Sea prices are up 5% to $375/st, while Canadian prices are slightly down (2%) to $575/st and Middle East Prices have been more or less flat since Bullish demand at the start of the year from good weather, an early planting season and a tight market pushed prices up to the levels near the 2008 peak. Urea: Gulf Ammonia In the near term, Chinese production and cheap US gas could push prices down to lower margins. However, margins are at their highest levels since 2008 because gas costs have come down 50% since 2010 in the US and this makes nitrogen still very attractive. 22
23 Recent Conference Highlights China & India Deals On September 17th, Commentary at the Fertilizer Institute (TFI) Boston conference suggests further delays in a Chinese potash contract settlement. Trade commentary suggested that China may not settle a new potash contract for the balance of 2012 with prospects for a settlement with key producers unlikely before mid Q412. Local Chinese producer Qinghai Salt Lake cut domestic prices for the second straight week to $445/mt, down from ~$490/mt two weeks prior. Strong domestic production form Chinese producers, combined with inventories from 2Q12 imports, may also be pressuring the Chinese supply/demand balance. India continues to remain a point of concern with a demand recovery in the coming months unlikely without a change in subsidy policy, for which visibility remains poor. Last week Russian producer Uralkali cited China, India and other global market uncertainties as the rationale for its 2012 global potash shipment forecast cut to 49M-50M from 51-53M in its prior forecast. Brazil prices fall for second week; spot business below $500/mt CFR. For the second straight week Brazilian prices were under pressure, with transactions reported at $490/mt CFR, down from $510/mt CFR in the prior week and $525/mt two weeks earlier. Strong competition between producers for September business following a sharp seasonal fall-off in demand was cited as the main reason for the decline. Brazilian potash imports in July and August were at record levels, likely at or above 1MM tonnes in both months. Some potash sentiment improvement noted in U.S. Midwest. Midwest spot prices remained at $478/t CFR last week, below producer postings of $500/t-$510/t. However, recent rains, which have somewhat improved soil conditions, combined with high crop prices, have reportedly improved retailer sentiment. Although trade commentary did not indicate a rush of product purchases, retailers are now reportedly more focused on having ample product available for the fall application season and less concerned about holding high cost inventory. Nitrogen: The outlook for the ammonia fall application season continues to improve in light of recent Corn Belt rains. Spring 2013 prepay also continues to look very strong with product offered at $810-$815/t vs. ~$740/t in the 2012 Spring period. Trade commentary suggests that tight global conditions should support global ammonia prices at or above current levels until at least December. US Midwest spot urea prices were quoted in the $495-$500/t range with trade commentary suggesting spring prepay business also quoted at that level. Ammonia, Tampa (US$/tonne 23
24 Phosphate: The coming fall application season appears to be providing support to the U.S. market, although there is less optimism regarding the global market outlook. New Orleans DAP barges continued to move higher throughout the week, moving $15/t higher throughout the week and averaging $533/t. However, globally the phosphate market appears to be on a bit softer footing: 1) Brazilian demand is now slowing seasonally with a pickup not likely until late Q4; 2) Indian demand has declined, as evidenced by some recent Indian cancellations of Chinese contract DAP purchases; 3) Moroccan producer OCP will reportedly reduce utilization to 80% of capacity, for the balance of the year, likely in response to a more tepid forward demand outlook. Conclusion: Fertilizer prices have been on a general trend upward for the better part of the last twelve years, rising along with the commodity complex and accelerating into 2007, peaking in mid and then rapidly declining during the downturn. Most spot prices are now well below the peak but still substantially above levels during the early part of the last decade, supported by crop prices that have also been persistently elevated. Catalysts for the Stock Potash Intensive Crops Driving Long Term Demand Plants need potash at different rates and, as a result, some plants need more fertilizer applied to them. This has importance for different countries such that Brazil and South Europe are the largest fruit producers and Brazil is the world s largest producer of sugar and soybean. Similarly, Chinese and Indian potash demand is driven by an increase in the production of Fruits & Vegetables (50% and 22% of China s and India s potash consumption respectively). Crop Nutrient Uptake by Crops Potash Fertilizer Application by Crop Acreage of potash intensive crops such as F&V, corn, Rice, Oil crops and Sugarcane has increased worldwide and the trend will continue as forecasts illustrate 3.6% growth (11-20e), well above the historical growth of potash demand (2.8% for ) fuelled by growth in grain production and growth of potash intensive crops for higher calorie diets of growing middle class. Area Harvested (GAGR ) Production of Grains & Consumption of Potash (K20) 24
 they encourage farmers to apply fertilizer at a relatively high optimal level in order to maximize their yield the amount of crop")
25 Continued Strength in Crop prices would be stock-supportive Strong prices for crops tend to create two compounded affects: 1) they encourage farmers to maximize the amount of acreage planted to increase their total revenues, thus requiring more fertilizer; and 2) they encourage farmers to apply fertilizer at a relatively high optimal level in order to maximize their yield the amount of crop produced per acre of land. The king of crop prices is the corn price; as corn (the most widely grown crop by volume in the world) is a heavy consumer of fertilizers, the fertilizer stocks tend to follow accordingly. As a result, crop prices are a major driver for POT s stock, with an R-squared of 0.84 since 1989 (higher for corn). POTs share Price tracks Crop Prices very Closely Spot Corn Prices vs. Composite of N.A Fertilizer Companies Source: Company Reports, Barclays Explosive Growth in U.S Corn Crop Prices Current crop conditions in the U.S are at historical lows while the crops demand for nitrogen is relentless, even in a highly uncertain world. Unlike other fertilizers, nitrogen must be applied every season or farmers risk substantial yield declines. With season ending global and U.S. corn inventories projected to be down 19% and 65%, respectively, from forecasts in May, it is expected that persistently elevated prices will provide farmers with heavy incentives to plant more acres and fertilize aggressively. CRB Grain (1991=Grain) Corn ($/bu) 25

26 With the USDA again aggressively cutting yield estimates in the Aug. wasde report, extreme variability in crop conditions, may introduce further downside risk in the form of elevated harvest losses which will likely be accounted for in the Nov and Jan reports. As a result, corn prices trade sideways in August, and is expected at the minimum to remain sideways for some time while prices may move even higher as the US harvest shows the final weak numbers. Crop Price Forecast The consensus view of industry grain commodities analysts ( Commodities Research Rankings: Getting more cautious on Ags, August 3, 2012 ) expects that large positive moves from current records are unlikely expect for corn prices. However, persistence of elevated crop prices over the next planting/harvest cycle, supported by low global stocks-to-use ratios, should lead market expectations for fertilizer demand/pricing higher and provide additional tailwinds for POT. In addition, the global crop supply-demand balance supports continued high crop prices relative to historical levels for wheat and corn. As a result current high crop prices should encourage global acreage and input maximization for the upcoming fall and spring application seasons, clearly positive for POT. This strength extends beyond the traditional grains and oilseeds, as key fertilizer-consuming crops such as sugar, cotton and coffee also have significantly higher prices. Wheat ($/bu) Soybean ($/bu) Cotton ($/bu) Sugar ($/bu) Less US Supply as seen in Soybean Price Rally 26

27 As seen in the last year Soybean prices have rallied due to tight supply and the now destructive drought. As a result, the soybean market is rapidly coming to the realization that prices don t just have to ration demand in the front of the curve to defer demand until the US harvest, but rather to encourage incremental planted acres in South America. Consequently, Brazilian and Argentine aggregate soybean acreage is needed to expand by at least 3.78 mln ha (9%) YoY, just to keep S/U in those 2 countries from falling below record-tight levels. Fertilizers Pricing a Lagging Indicator Interestingly fertilizer pricing, though arguably of more direct importance to the earnings and cash flow performance of PotashCorp than crop prices, is much less correlated to the industry s stock price movements and POTs stock price. The R-squared of PotashCorp s stock price to potash prices is only 0.47, and shows a lagged relationship between the two, most likely due to the structure of the company s potash sales contracts. Potash prices are expected to remain flattish for the near short term. PotashCorp. Stock price has a lagged relationship to potash prices Potash Prices vs. N.A. Fertilizer Companies Strong Farmer Economics Fertilizer Cost below Historical Levels One of the largest annual costs for farmers is fertilizer, representing approx. 22% of total US corn production costs. In , when fertilizer prices spiked, corn farmer production costs increased by 20%. Although one of the largest annual cost for farmers is fertilizer, analysis indicates that farmers are more sensitive to changes in crop prices than to changes in fertilizer prices. However strong prices for a number of crops grown globally have driven down the cost of fertilizer as a percentage of revenue. Based on current prices for corn and fertilizer, the cost of nutrients as a percentage of crop revenue is expected to remain well below the historical average for the 2012 crop year. 27
, the next year s nutrient consumption (2004 and 2007) has risen for potash and nitrogen by 3-5%.")

28 Fertilizer Cost Percentage of US Corn Revenue Breakdown of US Farmer Costs Insured Farmer Incomes Mitigate Extreme Weather Events The current US drought is one of the worst on record impacting crop yields in the US by 65% the following the repercussions of the dry land. However over the last decade, in the two years when the drought index in the U.S. Midwest has spiked up yr/yr due to dry conditions (2003 and 2006), the next year s nutrient consumption (2004 and 2007) has risen for potash and nitrogen by 3-5%. Both 2004 and 2007 also ended up scoring high on the drought monitor as it took time for moisture levels to recover. Record Farmers Incomes & Cashflow U.S. Farm Sector D/E ratios and Net Incomes (Source: USDA) % of Plant Acres Insured (Source: USDA) Excessive dryness with this year s crop could reduce U.S. Farmer incomes and cash flow could be restrained this year because of production shortfalls; however, this year is different than 1988 widely used as the best comp for this year s drought-like conditions) as the average farmer is far more protected from crop insurance than 1988 and farmer balance sheets are far stronger. More than 70% of U.S. planted acres are protected (90%+ in the corn belt). Despite shrinking corn and soybean yields due to the drought in the Midwest this year, the USDA now expects that US farmers will take in record net income this year. Overall farm income is expected to increase 3.7% to $122.2B (compared to a $91.7B estimate in February 2012), due to higher grain prices and the support of crop insurance payments. 28
 Approximately 85% of corn, cotton, soybeans and wheat acres are insured and; 2) DAP and potash are still affordable on a historical basis; and 3) After several years of")
29 Farmers Will Have Ample Financial Flexibility for 2013 Growing Season The ongoing US drought is poised to meaningfully reduce corn and soybean production across the Midwest, giving farmers ample financial flexibility: 1) Approximately 85% of corn, cotton, soybeans and wheat acres are insured and; 2) DAP and potash are still affordable on a historical basis; and 3) After several years of robust high net income, farmer balance sheets are extremely strong and lending conditions are among the most favourable since the late 1980s. USDA Farmer Net Income, $ bil Agricultural Lending Conditions index Further Positive factors for the Stock Better-than-expected outcome from 2H12 Indian or Chinese potash importers Near-term, any better-than-expected outcome from 2H12 Indian or Chinese potash importers will likely be constructive for the stock price. Currently the market expects 2H12 contracts for China to be signed in late September, with many in the industry expecting, at best, a rollover of 1H12 prices at $470/tonne CFR. India is not expected to enter negotiations until well into the fall. China continues to stockpile foreign agricultural commodities. Despite signs that growth is slowing, Chinese purchases of many major agricultural commodities continue to run at record seasonal highs. Corn imports remained strong in July, at 721K MT, as China continued to ship corn contracted earlier this summer. Many expect this volume to decline in the coming months, however, as rising US corn prices have caused China to sell back some cargoes contracted previously for MY 12/13. Sugar imports set new seasonal highs in July, prolonging a trend which started in the early spring. However, with local production margins now reportedly at or below breakeven and stockpiles high, the prospects for imports in the coming months are less rosy. 29
30 Confirmation of forecasts by Potash Corp Confirmation of forecasts by Potash Corp (and other potash producers) that 2H12 will see record levels of global shipments to re-stock the global distribution system should lift POT stock, especially as demonstrated via declining producer inventories (North American levels reported every month, mid-month by TFI/Potash Corp). Cancellations, delays of other Potash Producer Expansions Cancellations, delays, reports of cost overruns from Greenfield or Brownfield potash expansions, particularly from ex- Canpotex member companies (BHP, K+S) should have a positive lateral impact on POT. Accelerated use of ample free cash flow Accelerated use of ample free cash flow on share repurchases or dividends as PotashCorp. completes the major spending on its eight year potash expansion program should also be a positive factor for the stock. Risk Overview Macroeconomic Uncertainty Current US Drought Macroeconomic uncertainty in NA and worldwide, combined with poor growing sentiment coming out of the current U.S. drought may lead to domestic growers/farmers delaying application of fertilizers until well after the weather improves, leaving fertilizer producers facing weaker prices and the need for production curtailments in the meantime. India s Withdrawal from the Market In India, the slowing economy, weaker rupee, lack of clarity on government fertilizer subsidies, and the fallout from a weak monsoon on the agricultural sector may limit the country s ability, if not willingness, to bounce back into the global market and renew sizable imports. With India set to consume million tonnes of potash this year (below trend of 6 7 million tonnes for two years in a row now), the country is currently the main impediment to global potash demand growing as a result of both higher prices and a weakening Rupee. Because of PotashCorp s smaller % of sales and EBITDA stemming from India compared to peers, the company seems to be well positioned to suffer less from the reduced demand in India as a result of sustaining a diversified portfolio. Recent Antitrust Ruling The recent antitrust ruling by the 7th District Court of Appeals on North American potash producers market structure (claiming inflated prices paid due to the companies market power) could potentially lead to some kind of weakening of the current (advantageous) oligopoly/cooperative pricing and contracting structure. Production Surplus New capacity expansions in Saskatchewan could cause a production surplus. Currently there are 24.0 million tonnes of potash capacity expansion projects announced in Saskatchewan that are expected to come on line by If all of the expansions proceed and begin production as planned, this may create excess supply in the global potash market that could lead to lower potash prices or lower than expected capacity utilization. POT is highly sensitive to changes in the potash price since almost 70% of the company s gross margin was derived from its potash business segment. US phosphate rock permitting becoming a challenge The mining of phosphate rock in the US is becoming more challenging due to environmental complaints that surface during the permitting process. POT has significant phosphate reserves in Aurora, North Carolina that require a permit from the US Army Corps of Engineers (Corps). However, as seen in the case of Mosaic currently defending a lawsuit for its phosphate rock permits these permits can be contested by environmental groups. POT notes that it has permits for its 33-year reserve life at Aurora (current production levels) and a life of mine permit at White Springs (17 years). As a result, these permits should minimize the risks to POT shareholders. 30

31 Effect of Extra Potash Supply online Post 2015 Supply/Demand for all 3 Nutrients The important element that stands out from the tables below is that none of the fertilizers should be in short supply there is ample aggregate nameplate capacity that even when adjusted downward to a more realistic operational capacity global availability for N/P/K each appears sufficient to meet current demand. Total nitrogen Figure 1: Implied N/P/K Balanced Operating rates, supply appears to have run at an effective rate of around 90%, with phosphoric acid and potash supply at roughly 80% of capacity. Figure 2: IFA Projections, N/P/K Capacity Outlook, f With excess supply, an observer might question how the industry could sustain a price level so clearly well above cost. This same question could be asked when analyzing the projections of additional capacity that are anticipated across the sector. For example, taking the forecast demand/capacity outlook from the IFDC, a theme arises that instead of a market getting tighter (as would be most attractive to an investor), the level of excess supply appears to be expanding the IFDC anticipates that potash, arguably the fertilizer market with the best profitability and the highest valuation multiples, faces greater than 25% excess supply by More Supply Tightness than Meets the Eye In reality, there are a number of important factors that offset the bearish elements implied by a first read of supply/ demand. 1) POT is largely weighted toward a variable cost structure as the costs of potash mining are significantly weighted toward energy, materials, and other inputs. This enables the POT and other fertilizer companies to run profitably at lower operating rates rates that would put profitability pressure on more fixedcost/high-operating-leverage operations (i.e., integrated steel mills). 2) The supply/demand for all nutrient in the aggregate may imply a soft market, but under real-world, quickly shifting market conditions (weather patterns or a temporary closure of a key regional plant, both of which have happened in 2012) fertilizer products may find their supply tight and supportive of higher prices. 3) Finally, as mentioned before the giant trade marketing consortiums for potash (Canpotex and Belarusian Potash Corporation/BPC) exert large amounts of market power in their negotiations with the major fertilizer importers within Brazil, China, and India and, particularly for the potash side provide a useful mechanism for matching global supply with demand in the interest of supporting prices. Which is why one of the key reasons that Potash Corp in particular, as the largest member of Canpotex, has enjoyed a premium valuation multiple to the rest of the group. 31

32 Figure 3: Barclays Forecasts Global Potash Supply & Demand, E (mn tonnes) Conclusion: The potash market in every way has attractive elements that are crucial in a commodity market as attractive reserves are fairly well concentrated in the hands of relatively few countries, market pricing and operational capacity utilization discipline is heavily influenced by the coordination of Canpotex and BPC, and barriers to entry are very steep with high capital costs (Greenfield Saskatchewan mine costs $8.1B) and long lead times for development (over 7years). However as capacity expansions are ramping up among the existing producers it is important to note that the majority of this new capacity is expected to be under the control of companies who are currently aligned via the major marketing organizations of Canpotex/BPR. As they already benefit collectively from a managed level of supply tightness, they have little incentive to disrupt the current market via actions that could take prices down (i.e., by undermining operating discipline and rapidly bringing product from newly built capacity to market, regardless of demand). Therefore the prospects for POTS stock outperformance is tied to some degree to how well external supply constraints (permitting delays, government barriers) combined with internal management discipline (keeping any expansions realistic and targeted, resisting the temptation to accelerate development) will keep actual operating capacity in check over the next several years. Although the supply of nitrogen is expected to be tighter in the long term the market consensus for potash supply is expected to gradually loosen. 32

33 Valuation Fertilizer Industry POT is an attractive value play with a current P/E of 13.16x trading at the lower end of its 7 Yr. avg. and below historical multiples. Pot has traded in a range of 3x to 27x over the past five years with an average of 16x. POT shares receive a P/E multiple near the top end of the NA Fertilizer Peers (Agu, CF, MOS) and an EV/EBITDA of multiple of 8 nearly turns over the same peers. However, POT leads the pack with the highest ROE of 42.4% and ROC of 26%. Pot also commands the highest GM of 49.2% across the industry and a stellar 50% EBITDA margin. Company Name GM 3yr Avg.% Op Op. Margin Margin% 3yr Avg. Div. Yield % 5yr Avg. Sales Growth% EV/ EBITDA Net Debt/ EBITDA CAPEX $(B) EBITDA Margin % Total BUYS Total SELLS % Buys Agu Agrium 24,2 15,0 11,1 0,7 30,9 6,4 0, , % Cf CF Industries 36,5 45,0 31,3 0,7 17,6 5,1 0, , % MOS Mosaic 28,1 23,5 23,0 0,5 24,2 6,1-0, , % POT PotashCorp 38,6 44,9 33,2 1,0 31,8 8,0 0, , % CMP Compass Minerals 31,4 19,5 22,9 2,5 7,5 8,8 1, , % HF Hanfeng Evergreen NA 7,7 NA 0,0 32,2 3,2-2,2-3 10, % IPI Intrepid 37,3 34,9 29,0 0,0 NA 6,5-0, , % MBC MBAC 14,0-233,9-515,2 0,0 NA 10,8 NA , % MGO Migao 20,2 7,2 12,9 0,0 37,5 6,1 2,0-48 9, % WPX Western Potash NA NA NA 0,0 NA NA NA -18 NA % UAN CVR Partners 37,7 45,0 26,6 0,0 NA 12,7-0, , % Fertilizer Industry 28,8-4,0-44,0 0,5 26,0 6,8 0, ,6 14,0-233,9-515,2 0,0 7,5 3,2-2, ,2 38,6 45,0 33,2 2,5 37,5 10,8 2,0-3 51,8 29,7 19,5 23,0 0,3 30,9 6,4 0, ,3 Company Name Last Price Best Target Price Market Cap ($B) P/E B. Est P/E 5 yr Avg. P/E FCF/ Share FCF Yield (%) P/ FCF ROE % ROC % GM % Agu Agrium 103,53 116, ,7 10,0 15,5 4,35 9,0 23,8 26,3 17,8 28,0 Cf CF Industries 222,82 233, ,3 8,3 11,0 26,17 12,7 8,5 38,0 28,7 47,5 MOS Mosaic 59,91 67, ,4 11,8 18,1 2,44 4,1 24,5 16,6 15,1 27,8 POT PotashCorp 43,55 53, ,9 13,1 25,0 1,49 3,0 29,2 42,4 26,0 49,2 CMP Compass Minerals 74,28 75, ,6 22,1 15,8 4,40 1,9 16,9 39,8 18,7 28,0 HF Hanfeng Evergreen 1,76 2, ,4 6,9 NA 0,19-20,7 9,4 5,6 4,3 11,5 IPI Intrepid 22,99 26, ,7 18,9 NA 0,49 1,9 47,1 11,4 13,5 42,0 MBC MBAC 3,32 5, NA NA NA -0,40-35,8-8,4-1,1 NA 25,3 MGO Migao 2,94 2, ,6 25,8 NA -0,35-3,1-8,4 6,0 4,8 14,8 WPX Western Potash 0,47 1,40 75 NA NA NA -0,18-29,5-2,6-21,6 NA NA UAN CVR Partners 26,56 26, ,6 17,3 NA 1,65 6,0 16,1 29,7 26,8 51,2 Average ,8 14,6 17,1 3,86-5,7 14,0 16,3 16,1 30,5 Min 75 8,3 6,9 11,0-0,40-35,8-8,4-21,6 4,3 11,5 Max ,7 25,8 25,0 26,17 12,7 47,1 42,4 28,7 49,2 Median ,7 12,4 15,8 0,99 1,9 13,1 14,0 16,5 28,0 Investment Case Conservative Est. at Lower End of Consensus 33

34 FY12/13 Estimates vs. Consensus/Guidance 2011 Actual Revised Guidance Change Y/Y Previous Guidance Est. Cons. Est. Cons EPS $3.51 $3.20-$3.60 $3.20-$3.60 $3.34 $3.41 $3.50 $3.70-5% 5% Potash Sales volume M tonnes % 9% Potash Gross margin $B $2.7 $2.6-$2.8 $2.6-$2.9 $2.6 $2.6 $3.0 $3.4-4% 15% Global Potash Shipments Phosphate & Nitrogen Gross margin $B $1.57 $1.4-$1.6 $1.3-$1.5 $1.4 $1.5 $1.2 $1.3-11% -15% Capex $1.9 $2.2 $2.1 $2.2 $2.2 $1.4 $1.4 16% -36% F2012 EPS est. is $3.34 which is toward the lower end of management s guidance range of $3.20-$3.60 and consensus of $ potash gross margin est. is $2.59B which is slightly below revised guidance of $2.6B-$2.8B while total potash volume expectation is 8.80M toward the lower end guidance of 8.8M-9.2M which reflects the notion that the Indian market does not pick up. However, the low end of volume guidance could be hard to achieve absent a 4Q12 inventory build for the 2013 spring season. The low end of guidance calls for volumes of 4.945MM tonnes in 2H12 which would be 523k tonnes higher than any 2H on record (2H07 volumes were 4.422M tonnes while 2H10 volumes were 4.276M tonnes). However, as discussed before, this year s record destructive crop yield regarding corn & soybeans is laying foundation for 2013 to be the strongest crop season in history which may be well above our conservative 9% growth in potash volumes for 2013 vs. 2012s already weak volume discounting an absent Indian market. Furthermore, 2013 will mark an important year for India which has faced 2 years of reduced potash fertilizer application reducing yields by 29%. In addition, the 2012 average North American potash price estimate is $434/mt. which is very conservative despite being well below the 5 yr. avg. of $522 while Midwest spot prices remained at $478/t last week, below producer postings of $500/t-$510/t. Currently the market expects 2H12 contracts for China to be signed in late September, with many in the industry expecting, at best, a rollover of 1H12 prices at $470/tonne well above our avg. estimated price nitrogen gross profit estimate is $1.02B even though avg. nitrogen prices are likely to come in higher than expectations given continued strong market trends and the 2013 expected record planting season. With current Midwest spot urea prices quoted in the $495-$500/t range and trade commentary suggesting spring prepay business also quoted at that level, our avg. nitrogen price of $428, $388, and $375 for the following period 34

35 respectively is considered very conservative offset by higher than expected natural gas costs even though margins are at their highest levels since 2008 as gas costs have come down 50% since phosphate gross profit is $468MM due to modestly lower volume expectations as Brazilian demand is now slowing seasonally with a pickup not likely until late Q4 while Indian demand has declined. Conclusion: The potash market in every way has attractive elements that are crucial in a commodity market as large reserves are fairly well concentrated in the hands of relatively few countries, market pricing and operational capacity utilization discipline is heavily influenced by the coordination of Canpotex and BPC, and barriers to entry are very steep with high capital costs (Greenfield Saskatchewan mine costs $8.1B) and long lead times for development (over 7years). By applying a discounted 15x PE multiple to our 2013EPS estimate of $3.50 vs. POTs avg. historical PE of 16x, we derive a price target of $52.5 implying a 19% return vs. Sept 20 th closing price of $44.08 which had already appreciated 3% following a press release that Canpotex concluded four five year potash agreements with Indonesia coupled with William Doyle s assuring stance that Indian demand will escalate in As a result, the target price is warranted by Pots industry leading potash margins, low-cost potash business, oligopoly production capacity growth, and accelerated FCF opening the window for a share Buyback program. Potash Strengths Largest low-cost producer of the highest potash margin with the greatest barriers to entry, demand and pricing potential. Controls 50% of potential industry potash expansion at lowest capital cost (i.e., Brownfield) and on the shortest timeline. 3rd largest N producer 3rd largest fully integrated Phosphate producer with high quality rock and a diversified product mix. 20+ year management track record of rational competitive behaviour. Catalysts $50 per tonne increase in potash = $0.40 of EPS. Phosphate rock cost increases for non-integrated producers. An end to India s Potash Holiday Dealer re-stocking throughout the balance of 2012/2013 Brazil, Southeast Asia, India and China potash demand. Corn and soybean prices persisted at elevated prices. M&A. Accelerated FCF Generation Share Buy Back with accumulated cash 52 week Low High Price :
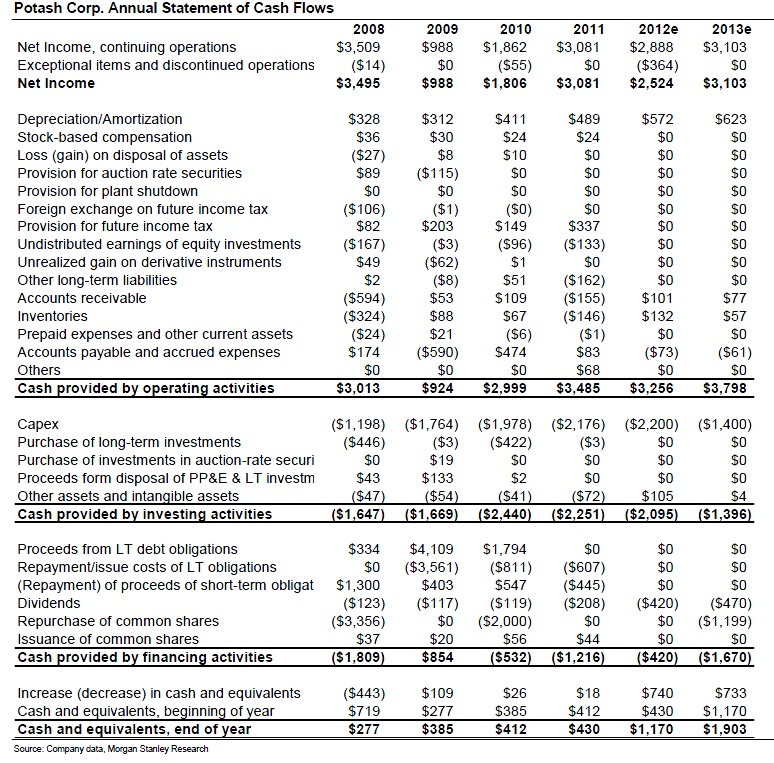
36 APPENDIX: Forecast Summary 36
37 37
38 38
, phosphorous (P), or potassium (K) - can be considered a fertilizer.")
39 Fertilizer Introduction Back to the Basics What is fertilizer? Any natural or manufactured material that contains at least 5% of one or more of the three primary nutrients - nitrogen (N), phosphorous (P), or potassium (K) - can be considered a fertilizer. Industrially manufactured fertilizers are also referred to as "mineral" fertilizers. As a result, the two most important sources of plant nutrients are organic manure and mineral fertilizers. Since manure and crop residues do not contain a sufficient dose of all 3 nutrients, mineral fertilizers supply the outstanding nutrient balance needed for strong crop yields. In simple terms, Nitrogen is a key element in protein and like the human body, plants need it to grow. On the other hand, phosphorus is the plant world s equivalent of carbohydrates it provides the energy for plants to thrive while Potassium is a mineral that helps plants grow strong stalks, in the same way that calcium gives people strong bones. As a result, fertilizer production consists of gathering these 3 raw materials from nature; treating them in order to purify them or increase their concentration; converting them into plant-available forms; and often combining them into products that contain more than one nutrient. Are farmers highly dependent on commercial fertilizers? Every season, plants draw from the soil the nutrients they need to grow. When a crop goes to market, so too does the potassium, phosphorus, and nitrogen it has absorbed and used throughout the growing season. When farmers fertilize, they put back into the soil the nutrients their next crop will require. Unfortunately, soils do not naturally contain all the nutrients that crops need. And while some of the same nutrients in fertilizer are found in soil, they are not present in a sufficient supply for today s high-yield farming which makes farmers highly dependent on commercial fertilizers since it can take 5-20 years for nutrients to build up in the levels necessary to nurture a good crop while a single season can wipe out many years worth of naturally produced nutrients. Breakdown of 3 Components of Fertilizer 1) Nitrogen Nitrogen (N) is an element essential for plant growth. Nitrogen consists of approximately 78% of the air we breathe and the earth s atmosphere. Since it is inert and insoluble, plants cannot utilize it. As a result, fertilizer makers take nitrogen out of the air and combine it with hydrogen from natural gas to make ammonia. Ammonia is used in two ways: it is applied directly to crops as a nitrogen fertilizer, or it is used as a building block to make other nitrogen fertilizer products, including urea, ammonium nitrate, ammonium sulfate or water-based, liquid fertilizers. Urea is the most commonly used nitrogen fertilizer product and is also the feedstock for industrial products such as plastics, resins and adhesives. All of these different nitrogen products have different properties and levels of nitrogen that can be used in the various climates and cropping patterns found around the world. 39

 Potassium Potassium (K) used in fertilizers is found in a salt form called potash. Potash deposits are derived from evaporated sea water.")
40 2) Phosphorous Phosphorus (P) in the form of phosphate (a salt of phosphoric acid) is mined from naturally occurring mineral deposits (phosphate rock) that were once sediments at the bottom of ancient seas or the earths crust. The largest deposits occur in the United States, North Africa and China. Phosphate rock processing consists in the separation of phosphate from the mix of sand, clay and phosphate that makes up the matrix layer. 3) Potassium Potassium (K) used in fertilizers is found in a salt form called potash. Potash deposits are derived from evaporated sea water. They occur in beds of sediment at only a few places in the world. The largest deposit, in Saskatchewan, Canada is 2.7 to 23.5 meters (9 to 77.6 feet) thick and found at depths of 1000 to 10, 000 meters (3,200 to 10,000 feet). Solution mining methods are used to extract potash at greater depths. Conventional underground dry-shaft mining methods are used in mines as great as 1100 meters (3500 feet.). The ore is extracted from potash deposits by electrically operated mining machines and conveyed to the surface, where it is crushed. Using a flotation process, salt and clay particles are removed, the brine solution is dried, and the potash is sized by screening. The resultant coarse grade product is then ready for distribution. Fine particles remaining from the screening process are compacted into sheets that are crushed and screened to particle sizes suitable for blending. 40

 Nitrogen (K)")
41 Industry Export/Import Profile Overview (Sources: Company Filings) Nitrogen (K) Phosphorous (P) 41
 (K)")

42 Potassium (Potash) (K) Crop Profiles (Sources: Company Filings) 42

43 Planting Season Schedule 43

44 Potash Corps Planting Season Schedule 44
Section Potash first WORLD S TEN LARGEST FERTILIZER COMPANIES POTASHCORP GROSS MARGIN CONTRIBUTIONS. PotashCorp Is the Largest Producer by Capacity
 FOR MORE GROWTH Fertilizer is for the future the future of the world and its growing population, the future of our company. Our focus on the needs of tomorrow has encouraged us to put Potash First, and
Short-Term Fertilizer Outlook 2014 2015
 A/14/140b November 2014 IFA Strategic Forum Marrakech (Morocco), 19-20 November 2014 Short-Term Fertilizer Outlook 2014 2015 Patrick Heffer and Michel Prud homme International Fertilizer Industry Association
First Quarter 2015 Earnings Conference Call. 20 February 2015
 First Quarter 2015 Earnings Conference Call 20 February 2015 Safe Harbor Statement & Disclosures The earnings call and accompanying material include forward-looking comments and information concerning
Yara International ASA Fourth quarter results 2011. 7 February 2012
 Yara International ASA Fourth quarter results 211 7 February 212 1 Summary fourth quarter Strong quarter and best full-year results so far Good farm profitability drove improved margins, more than offsetting
Yara International ASA Second quarter results 2014
 Yara International ASA Second quarter results 214 18 July 214 1 Summary second quarter Strong result Lower nitrate deliveries amid early end to season in Europe Continued strong NPK deliveries and value-added
Yara International ASA Third Quarter results 2012
 Yara International ASA Third Quarter results 212 19 October 212 1 Summary third quarter Strong results and cash flow Yara-produced NPK deliveries up 1% Strong production increase Cautious start to European
FERTILIZER OUTLOOK. Knowledge would often confuse them. Barrie Bain Director of Fertilizer Intelligence FERTECON Limited
 FERTILIZER OUTLOOK Knowledge would often confuse them by Barrie Bain Director of Fertilizer Intelligence FERTECON Limited Nomura Global Chemical Industry Leaders Conference, Venice, 21 March 2013 FERTECON/
Third Quarter 2014 Earnings Conference Call. 13 August 2014
 Third Quarter 2014 Earnings Conference Call 13 August 2014 Safe Harbor Statement & Disclosures The earnings call and accompanying material include forward-looking comments and information concerning the
Third Quarter 2015 Earnings Conference Call. 21 August 2015
 Third Quarter 2015 Earnings Conference Call 21 August 2015 Safe Harbor Statement & Disclosures The earnings call and accompanying material include forward-looking comments and information concerning the
Fertilizer is a world market commodity, which means that supply
 Supply & demand, Energy Drive Global fertilizer prices The Fertilizer Institute Nourish, Replenish, Grow Fertilizer is a world market commodity necessary for the production of food, feed, fuel fiber. &
82 nd IFA Annual Conference Sydney (Australia), 26-28 May 2014
, 26-28 May 2014") A/14/65b June 2014 Final Version 82 nd IFA Annual Conference Sydney (Australia), 26-28 May 2014 Fertilizer Outlook 2014-2018 Patrick Heffer and Michel Prud homme International Fertilizer Industry Association
A/14/65b June 2014 Final Version 82 nd IFA Annual Conference Sydney (Australia), 26-28 May 2014 Fertilizer Outlook 2014-2018 Patrick Heffer and Michel Prud homme International Fertilizer Industry Association
Market Monitor Number 3 November 2012
 Market Monitor Number 3 November 2012 AMIS Crops: World Supply-Demand Balances in 2012/13 World supply and demand situation continues to tighten for wheat and maize but rice and soybeans have eased. In
3rd Quarter 2011 Results Investor and Analyst Conference Call
 3rd Quarter 2011 Results Investor and Analyst Conference Call 10 November 2011, 3:00 p.m. CET Experience growth. 10 November 2011 K+S Group 0 Content A. Key Figures B. Core Business Sector Fertilizers
THE FINANCIAL CRISIS: Is This a REPEAT OF THE 80 S FOR AGRICULTURE? Mike Boehlje and Chris Hurt, Department of Agricultural Economics
 THE FINANCIAL CRISIS: Is This a REPEAT OF THE 80 S FOR AGRICULTURE? Mike Boehlje and Chris Hurt, Department of Agricultural Economics The current financial crisis in the capital markets combined with recession
Not Your Father s Potash Oligopoly Structural Shift Points to Lower EPS & P/E Multiples, Spurs Target Price Cuts
 July 30, 2013 The NBF Daily Bulletin Industry Comment Agriculture Not Your Father s Potash Oligopoly Structural Shift Points to Lower EPS & P/E Multiples, Spurs Target Price Cuts Industry Rating (Agriculture):
PotashCorp Reports First-Quarter Earnings of $0.09 per Share
 For Immediate Release April 28, 2016 Listed: TSX, NYSE Symbol: POT Key Highlights PotashCorp Reports First-Quarter Earnings of $0.09 per Share First-quarter earnings of $0.09 per share 1, including: Notable
Price instability and competition law: the case of the potash cartel
 Price instability and competition law: the case of the potash cartel Frederic Jenny Professor of economics, ESSEC Business School OECD Global Forum on Trade and Competition 2012 1) This presentation is
Consumption Patterns and Competition in the World Fertilizer Markets
 Consumption Patterns and Competition in the World Fertilizer Markets Kyösti Arovuori and Hanna Karikallio Pellervo Economic Research Institute, Eerikinkatu 28 A FIN-00180 Helsinki, Finland. tel. +358-9-
PotashCorp Reports 2015 Third-Quarter Earnings of $0.34 per Share
 PotashCorp Reports 2015 Third-Quarter Earnings of $0.34 per Share Symbol: POT Listed: TSX, NYSE Key Highlights Third-quarter earnings of $0.34 per share 1, including $0.03 per share related to notable
Supply & demand outlook for the canola industry
 Supply & demand outlook for the canola industry J.P. Gervais Chief Ag Economist March 2015 @jpgervais Canola Canola is one component of the environment for oil producing crops Growth in demand has supported
3.3 Real Returns Above Variable Costs
 3.3 Real Returns Above Variable Costs Several factors can impact the returns above variable costs for crop producers. Over a long period of time, sustained increases in the growth rate for purchased inputs
$350. only have picked up the knives, but they have $250. started a few fights. as they compete to. upcoming application season.
 Market Mosaic February 2014 Picking Up the Knife Market Mosaic is a newsletter published for our customers, suppliers and stakeholders by the Market and Strategic Analysis group of The Mosaic Company.
U.S. Agriculture and International Trade
 Curriculum Guide I. Goals and Objectives A. Understand the importance of exports and imports to agriculture and how risk management is affected. B. Understand factors causing exports to change. C. Understand
Financial Translation. Pierre Courduroux Senior Vice President and Chief Financial Officer
 Financial Translation Pierre Courduroux Senior Vice President and Chief Financial Officer Forward-Looking Statements Certain statements contained in this presentation are forward-looking statements, such
ACADIAN TIMBER CORP. REPORTS FOURTH QUARTER AND YEAR-END RESULTS
 News Release Investors, analysts and other interested parties can access Acadian Timber Corp. s 2015 Fourth Quarter Results conference call via webcast on Thursday, February 11, 2016 at 1:00 p.m. ET at
Dr. Burkhard Lohr, CFO
 Experience growth. K+S Group Q2/15 Results 13 August 2015 Dr. Burkhard Lohr, CFO K+S Group Highlights Rejection of Potash Corp s unsolicited proposal The proposed transaction does not reflect the fundamental
Wheat Import Projections Towards 2050. Chad Weigand Market Analyst
 Wheat Import Projections Towards 2050 Chad Weigand Market Analyst January 2011 Wheat Import Projections Towards 2050 Analysis Prepared by Chad Weigand, Market Analyst January 2011 Purpose The United Nations
NEWS RELEASE. Highlights
 NEWS RELEASE WILMAR REPORTS 4Q2015 CORE EARNINGS OF US$350 MILLION AND FY2015 CORE EARNINGS OF US$1.17 BILLION - FY2015 core net profit down marginally by 4% due mainly to translation losses of regional
Market will worry about demand later Weekly Corn Review for May 11, 2016 By Bryce Knorr
 Market will worry about demand later Weekly Corn Review for May 11, 2016 By Bryce Knorr USDA didn t do much to help the corn market in its May 10 reports other than give soybeans a big lift. That could
Q2-14 Financial Results. July 30, 2014
 Q2-14 Financial Results July 30, 2014 Forward-looking Statements & Non-GAAP Measures Information contained in these materials or presented orally on the earnings conference call, either in prepared remarks
Q3 2015 Results. Mr. Stefan Borgas President & CEO. November 12, 2015
 Q3 2015 Results Mr. Stefan Borgas President & CEO November 12, 2015 Important Legal Notes The information delivered or to be delivered to you does not constitute an offer or a recommendation to do any
CIF Stock Recommendation Report (Spring 2013)
") Date: February Analyst Name: Mallary Dana CIF Stock Recommendation Report (Spring 2013) Company Name and Ticker: BEAM Section (A) Summary Recommendation Buy: Yes No Target Price: Stop Loss Price: Sector:
Date: February Analyst Name: Mallary Dana CIF Stock Recommendation Report (Spring 2013) Company Name and Ticker: BEAM Section (A) Summary Recommendation Buy: Yes No Target Price: Stop Loss Price: Sector:
Research Commodities El Niño returns grains and soft commodities at risk
 Investment Research General Market Conditions 20 May 2015 Research Commodities El Niño returns grains and soft commodities at risk Meteorologists now agree that El Niño has arrived and project that it
DSIP List (Diversified Stock Income Plan)
") Kent A. Newcomb, CFA, Equity Sector Analyst Joseph E. Buffa, Equity Sector Analyst DSIP List (Diversified Stock Income Plan) Commentary from ASG's Equity Sector Analysts January 2014 Concept Review The
Kent A. Newcomb, CFA, Equity Sector Analyst Joseph E. Buffa, Equity Sector Analyst DSIP List (Diversified Stock Income Plan) Commentary from ASG's Equity Sector Analysts January 2014 Concept Review The
Financial Information
 Financial Information Solid results with in all key financial metrics of 23.6 bn, up 0.4% like-for like Adjusted EBITA margin up 0.3 pt on organic basis Net profit up +4% to 1.9 bn Record Free Cash Flow
The case for high yield
 The case for high yield Jennifer Ponce de Leon, Vice President, Senior Sector Leader Wendy Price, Director, Institutional Product Management We believe high yield is a compelling relative investment opportunity
Thailand s Great Undeveloped Resource
 Thailand s Great Undeveloped Resource INVESTMENT STRATEGY The primary goal of is to aggregate a significant land package targeting potash, at a very low cost of entry, 6 claims for a total of 96 sq. km.
FCStone Grain Recap October 1, 2015
 CORN: A choppy but firm market today. Today starts the march of the private crop estimates led off with FCStone s number this afternoon. Export sales reported today showed net bookings of 748.2 tmt as
Buy Pitch. Financial Institutions Group (FIG) Darly Bendo, Lynn Hu, Chris Martone, Ray Yang Wednesday, October 30 th, 2013
 Darly Bendo, Lynn Hu, Chris Martone, Ray Yang Wednesday, October 30 th, 2013") Buy Pitch Financial Institutions Group (FIG) Darly Bendo, Lynn Hu, Chris Martone, Ray Yang Wednesday, October 30 th, 2013 Disclaimer The analyses and conclusions of the Western Investment Club ( WIC")
Buy Pitch Financial Institutions Group (FIG) Darly Bendo, Lynn Hu, Chris Martone, Ray Yang Wednesday, October 30 th, 2013 Disclaimer The analyses and conclusions of the Western Investment Club ( WIC")
ADAMA DELIVERS ROBUST VOLUME GROWTH DESPITE DIFFICULT MARKET AND CURRENCY CONDITIONS
 ADAMA DELIVERS ROBUST VOLUME GROWTH DESPITE DIFFICULT MARKET AND CURRENCY CONDITIONS Revenues in constant currencies up estimated 9.5% in the third quarter and 6% year-to-date Strong volume growth in all
Soybean Supply and Demand Forecast
 Soybean Supply and Demand Forecast U.S. soybean planted acreage is expected to increase 11.5 million acres over the forecast period. U.S. soybean yields are expected to increase 7 bushels per acre or an
Yara International ASA First quarter results 2009. 28 April 2009
 Yara International ASA First quarter results 29 28 April 29 1 Summary first quarter 29 Strong cash flow Significant on-going operating capital release Reduced margins despite lower energy costs Sales volumes
PROVIDING SOLUTIONS. 3 rd Quarter 2013 Results Investor and Analyst Conference Call 14 November 2013, 2:00 p.m. CET. Experience growth.
 PROVIDING SOLUTIONS 3 rd Quarter 2013 Results Investor and Analyst Conference Call 14 November 2013, 2:00 p.m. CET Experience growth. Highlights EBIT I in the first 9 months 556m (-11%) Fit for the future
Technology + Innovation = Sustainability
 Technology + Innovation = Sustainability David Woolley (CEO) & David Bessant (CFO) Q3 2012 Interim Report 1 Agenda Q3-12 Highlights DW Summary of financial results DB Economic head wind and de-stocking
Investor and analyst factsheet
 Investor and analyst factsheet 2015 2014 1 Variation 4Q 15 4Q 14 1 Variation in m in m in m in m Sales 7,683 5,952 +29.1% 1,760 1,431 +23.0% Prices (4.7)% (8.5)% Volumes +0.2% +2.1% FX +7.8% +5.1% Portfolio
Utilizing Utilities in Shareholder Yield
 MARCH 215 Utilizing Utilities in Shareholder Yield FROM THE EPOCH SHAREHOLDER YIELD TEAM Utilities stocks have historically fit the profile of shareholder yield companies and have remained a significant
LNG Poised to Significantly Increase its Share of Global Gas Market David Wood February 2004 Petroleum Review p.38-39
 LNG Poised to Significantly Increase its Share of Global Gas Market David Wood February 2004 Petroleum Review p.38-39 For the past few years LNG has experienced high levels of activity and investment in
Future drivers and trends in dairy and food markets
 Future drivers and trends in dairy and food markets IAL 2011 August 2011 Michael Harvey, Senior Analyst Road map Topic 1 Future drivers and trends in dairy and food markets Topic 2 Where is the dairy sector
TRENDS IN BULK BLENDING WORLD WIDE
 TRENDS IN BULK BLENDING WORLD WIDE CHARLES FORMISANI Project Engineer A. J. Sackett & Sons Company Baltimore, Maryland USA 410-276-4466 www.ajsackett.com Assuming that the goal of any fertilization program
AGRICULTURAL SCIENCES Vol. II - Crop Production Capacity In North America - G.K. Pompelli CROP PRODUCTION CAPACITY IN NORTH AMERICA
 CROP PRODUCTION CAPACITY IN NORTH AMERICA G.K. Pompelli Economic Research Service, U. S. Department of Agriculture, USA Keywords: Supply, policy, yields. Contents 1. Introduction 2. Past Trends in Demand
TD is currently among an exclusive group of 77 stocks awarded our highest average score of 10. SAMPLE. Peers BMO 9 RY 9 BNS 9 CM 8
 Updated April 16, 2012 TORONTO-DOMINION BANK (THE) (-T) Banking & Investment Svcs. / Banking Services / Banks Description The Average Score combines the quantitative analysis of five widely-used investment
FCC Ag Economics: Farm Sector Health Drives Farm Equipment Sales
 FCC Ag Economics: Farm Sector Health Drives Farm Equipment Sales Fall 2015 FCC Ag Economics: Farm Sector Health Drives Farm Equipment Sales 1 Introduction Agriculture is always evolving. Average farm sizes
Food, Feed & Fuel - Farmland Investing Explained. Enquirica Research
 Food, Feed & Fuel - Farmland Investing Explained Enquirica Research Investing in Canadian Farmland Canadian farmland continues to receive favorable attention from alternative investors. We believe it stems
Key global markets and suppliers impacting U.S. grain exports BRICs
 Key global markets and suppliers impacting U.S. grain exports BRICs Levin Flake Senior Agricultural Economist, Global Policy Analysis Division, OGA/FAS/USDA TEGMA Annual Meeting January 23 rd, 2015 U.S.
Missouri Soybean Economic Impact Report
 Missouri Soybean Economic Report State Analysis March 2014 The following soybean economic impact values were estimated by Value Ag, LLC, as part of a Missouri Soybean Merchandising Council funded project.
Investing in a 3-D World
 Investing in a 3-D World February 10, 2016 by Bill Nasgovitz of Heartland Advisors Executive Summary Slowing growth and swelling corporate debt are expected to result in challenges in the coming quarters.
ACADIAN TIMBER CORP. REPORTS FIRST QUARTER RESULTS
 News Release Investors, analysts and other interested parties can access Acadian Timber Corp. s 2012 First Quarter Results conference call via webcast on Wednesday, May 2, 2012 at 1:00 p.m. ET at www.acadiantimber.com
Ludwigshafen, February 25, 2014
 Ludwigshafen, February 25, 2014 Analyst Conference FY2013 Cautionary note regarding forward-looking statements This presentation may contain forward-looking statements that are subject to risks and uncertainties,
MEDIA RELEASE SIKA WITH STRONG GROWTH IN EMERGING MARKETS
 DATUM 1 / 6 Zugerstrasse 50 6341 Baar, Switzerland www.sika.com CONTACT TELEPHONE E MAIL Dominik Slappnig Corporate Communications & Investor Relations +41 58 436 68 21 slappnig.dominik@ch.sika.com SIKA
A Business Newsletter for Agriculture. Vol. 12, No. 1 www.extension.iastate.edu/agdm. Energy agriculture - where s the nitrogen?
 A Business Newsletter for Agriculture Vol. 12, No. 1 www.extension.iastate.edu/agdm November 2007 Energy agriculture - where s the nitrogen? by Don Hofstrand, value-added agriculture specialist, co-director
Interim Results 2015 12 March 2015
 Interim Results 2015 12 March 2015 2015 Interim Highlights Adjusted diluted EPS of 5.80c underlying increase of 7.1% Group Revenue Agri-Services Operating Profit Share of Profit of Associates and JV Adjusted
LABRADOR IRON MINES REPORTS QUARTERLY RESULTS
 LABRADOR IRON MINES REPORTS QUARTERLY RESULTS Toronto, Ontario, August 28, 2015. Labrador Iron Mines Holdings Limited ( LIM or the Company ) today reports its operating and financial results for its first
Chapter Five: Risk Management and Commodity Markets
 Chapter Five: Risk Management and Commodity Markets All business firms face risk; agricultural businesses more than most. Temperature and precipitation are largely beyond anyone s control, yet these factors
Statement to Parliamentary Committee
 Statement to Parliamentary Committee Opening Remarks by Mr Glenn Stevens, Governor, in testimony to the House of Representatives Standing Committee on Economics, Sydney, 14 August 2009. The Bank s Statement
4Q and FYE 2014 Results Conference Call
 A global environmental technology company focused on air pollution control, energy, fluid handling and filtration industries 4Q and FYE 2014 Results Conference Call March 5, 2015 1 Safe Harbor Statement
Grain Futures Markets & National Cash Indices Review & Observations thru July 27, 2012 PHI Market Analysis Manager Virg Robinson
 Grain Futures Markets & National Cash Indices Review & Observations thru July 27, 2012 PHI Market Analysis Manager Virg Robinson S&P 500 FUTURES NEAR BULLISH BREAKOUT The S&P 500 futures monthly continuation
X. INTERNATIONAL ECONOMIC DEVELOPMENT 1/
 1/ X. INTERNATIONAL ECONOMIC DEVELOPMENT 1/ 10.1 Overview of World Economy Latest indicators are increasingly suggesting that the significant contraction in economic activity has come to an end, notably
K+S Group FY/Q4 2014 Analyst conference. 12 March 2015, Frankfurt am Main. Norbert Steiner, CEO Dr. Burkhard Lohr, CFO
 Experience growth. FY/Q4 2014 Analyst conference 12 March 2015, Frankfurt am Main Norbert Steiner, CEO Dr. Burkhard Lohr, CFO Agenda A. FY 2014 Financials B. Projects and initiatives C. Q4 Financials D.
FCStone Grain Recap January 6, 2016
 CORN: CH16 made new contract lows but were unable to hold below unchanged into the close. Weekly ethanol production marginally higher this week, up 4 thbpd to 996. Ethanol stocks built again reaching 21099
For personal use only GALE PACIFIC LIMITED
 GALE PACIFIC LIMITED RESULTS FOR YEAR ENDED 30 JUNE 2013 FY13 Review FY13 FY12 FY11 A$M S A$M S % Variance A$M S Sales 120.0 110.5 9% 95.6 EBITDA 18.0 18.0 0% 15.8 EBIT 12.9 12.5 4% 9.9 NPAT 9.1 8.5 7%
HOLD. Ticker: MCD Sector: Consumer Services Industry: Restaurants and Bars. Recommendation:
 Ticker: MCD Sector: Consumer Services Industry: Restaurants and Bars Recommendation: HOLD Data: Price 52-wk high 52-wk low $54.23 (14-Sept-09) $65.47 (19-Sept-08) $45.79 (10-Oct-08) Market cap $59.18B
Oil & Gas Market Outlook. 6 th Norwegian Finance Day Marianne Kah, Chief Economist March 2, 2016
 Oil & Gas Market Outlook 6 th Norwegian Finance Day Marianne Kah, Chief Economist March 2, 2016 Challenging Market Environment Concerns that global economic growth will slow and reduce global oil and natural
North American Steel Industry: Recent Market Developments and Key Challenges Going Forward
 North American Steel Industry: Recent Market Developments and Key Challenges Going Forward OECD Steel Committee May 6-7, 21 Paris, France * American Iron and Steel Institute (AISI) Steel Manufacturers
Wheat Transportation Profile
 Wheat Transportation Profile Agricultural Marketing Service / Transportation and Marketing Programs November 2014 Marina R. Denicoff Marvin E. Prater Pierre Bahizi Executive Summary America s farmers depend
FOR IMMEDIATE RELEASE
 FOR IMMEDIATE RELEASE O-I REPORTS FULL YEAR AND FOURTH QUARTER 2014 RESULTS O-I generates second highest free cash flow in the Company s history PERRYSBURG, Ohio (February 2, 2015) Owens-Illinois, Inc.
Natural Gas and the U.S. Fertilizer Industry
 Natural Gas and the U.S. Fertilizer Industry Harry Vroomen Vice President, Economic Services The Fertilizer Institute July 15, 2010 www.tfi.org Outline of Presentation Brief Intro on Fertilizer Focus on
2 nd Quarter 2014 Financial Results Celulosa Arauco y Constitución S.A.
 Conference Call Presentation 2 nd Quarter 2014 Financial Results Celulosa Arauco y Constitución S.A. Gianfranco Truffello, C.F.O. Santiago, August 28 th, 2014 Disclaimer Forward-looking statements are
Supplying a Growing America. Investor Presentation May 2013
 Supplying a Growing America Investor Presentation May 2013 Cautionary Statements Regarding Forward Looking Information Certain statements in this presentation, and other written or oral statements made
FCStone Grain Recap July 9, 2015
 CORN: Values higher throughout the day on heavy volume as traders anticipate USDA s Friday S&D update and speculate on US crop problems. Weekly export sales of 535,000 tons vs 363,000 tons of old crop
2013 Half Year Results
 2013 Half Year Results Erwin Stoller, Executive Chairman Joris Gröflin, Chief Financial Officer Agenda 1. Introduction and summary of first half year 2013 2. Financial results first half year 2013 3. Outlook
INFORMATION ON THE PUBLIC JOINT-STOCK COMPANY INVL BALTIC FARMLAND FORMED IN THE SPLIT OFF
 INFORMATION ON THE PUBLIC JOINT-STOCK COMPANY INVL BALTIC FARMLAND FORMED IN THE SPLIT OFF On the basis of those Terms, 47.95 percent of the total assets, equity and liabilities of the public joint-stock
Indian Agrochemical Industry
 Indian Agrochemical Industry Introduction. India is the fourth largest producer of agrochemicals globally, after United States, Japan and China. The agrochemicals industry is a significant industry for
2012 Japan Broiler Market Situation Update and 2013 Outlook
 THIS REPORT CONTAINS ASSESSMENTS OF COMMODITY AND TRADE ISSUES MADE BY USDA STAFF AND NOT NECESSARILY STATEMENTS OF OFFICIAL U.S. GOVERNMENT POLICY Required Report - public distribution Date: GAIN Report
FY2011 Third Quarter Consolidated Financial Results (Prepared in accordance with U.S. GAAP) (Period ended December 31, 2011) (Unaudited)
 (Period ended December 31, 2011) (Unaudited)") FY2011 Third Quarter Consolidated Financial Results (Prepared in accordance with U.S. GAAP) (Period ended December 31, 2011) (Unaudited) Advantest Corporation (FY2011 Q3) January 27, 2012 Company name
FY2011 Third Quarter Consolidated Financial Results (Prepared in accordance with U.S. GAAP) (Period ended December 31, 2011) (Unaudited) Advantest Corporation (FY2011 Q3) January 27, 2012 Company name
Advanta Limited Q1 CY 2015 Earnings Results Conference Call. April 24, 2015
 Advanta Limited Q1 CY 2015 Earnings Results Conference Call ANALYST: MR. VIJAYARAGHAVAN RESEARCH ANALYST-IDFC SECURITIES MANAGEMENT: MR. CLAUDIO TORRES- GLOBAL CHIEF EXECUTIVE OFFICER- ADVANTA LIMITED
UNIFE World Rail Market Study
 UNIFE World Rail Market Study Status quo and outlook 2020 Commissioned by UNIFE, the European Rail Industry And conducted by The Boston Consulting Group 2 1 Executive Summary This is the third "World Rail
Chapter 12: Gross Domestic Product and Growth Section 1
 Chapter 12: Gross Domestic Product and Growth Section 1 Key Terms national income accounting: a system economists use to collect and organize macroeconomic statistics on production, income, investment,
Press Release. Vallourec reports Q4 and Full Year 2012 results
 Press Release Vallourec reports Q4 and Full Year 2012 results Boulogne-Billancourt, 20 February 2013 - Vallourec, world leader in premium tubular solutions, today announced its results for the fourth quarter
Grain marketing in the real world
 2009 GRDC FOR IRRIGATION CROPPERS Grain marketing in the real world Paper prepared by Ron Storey Australian Crop Forecaster Email: ron@cropforecasters.com.au IREC C/- CSIRO Land and Water, Griffith Private
THE RETURN OF CAPITAL EXPENDITURE OR CAPEX CYCLE IN MALAYSIA
 PUBLIC BANK BERHAD ECONOMICS DIVISION MENARA PUBLIC BANK 146 JALAN AMPANG 50450 KUALA LUMPUR TEL : 03 2176 6000/666 FAX : 03 2163 9929 Public Bank Economic Review is published bi monthly by Economics Division,
Natural Gas Markets in 2006
 Order Code RL33714 Natural Gas Markets in 2006 Updated December 12, 2006 Robert Pirog Specialist in Energy Economics and Policy Resources, Science, and Industry Division Natural Gas Markets in 2006 Summary
Overview on milk prices and production costs world wide
 Overview on milk prices and production costs world wide This article summarises the key findings of the IFCN work in 2013 and the recently published IFCN Dairy Report 2013 Authors: Torsten Hemme and dairy
Strawberry Industry Overview and Outlook. Feng Wu Research Associate Gulf Coast Research and Education Center University of Florida fengwu@ufl.
 Strawberry Industry Overview and Outlook Feng Wu Research Associate Gulf Coast Research and Education Center University of Florida fengwu@ufl.edu Zhengfei Guan Assistant Professor Gulf Coast Research and
Brunswick Earnings Conference Call Q3, 2015
 Brunswick Earnings Conference Call Q3, 2015 Helping Active People Live Active Lives Forward-Looking Statements Certain statements in this presentation are forward-looking as defined in the Private Securities
HEDGING IN THEORY AND PRACTICE
 HEDGING IN THEORY AND PRACTICE Ann Berg Senior Commodity Markets Development Expert USAID/FINREP-ІІ Kyiv, 2013 July 11 Maize contract (CME) 320 310 307.58 $ 11 April 308.07 $ 13 June 300 291.44 $ 1 March
Listings Officer Company Announcements ASX Limited, Melbourne
 ASX Release 09 September 2015 Listings Officer Company Announcements ASX Limited, Melbourne UPDATED PRELIMINARY FEASIBILITY ECONOMIC EVALUATION AMMAROO PHOSPHATE PROJECT ASX ANNOUNCEMENT ASX CODE: RUM
Commodities not finding much traction despite USD weakness
 Commodities not finding much traction despite USD weakness Commodities continued to show weakness into the second week of 2013 despite rising stock markets and a falling US dollar. Investors are generally
Second Quarter Results of Operations
 PRESS RELEASE Besi Posts Strong Q2 and H1-15 Results. Significant Expansion of Net Cash Position vs. 14 Duiven, the Netherlands, July 23, - BE Semiconductor Industries N.V. (the Company" or "Besi") (Euronext
Renminbi Depreciation and the Hong Kong Economy
 Thomas Shik Acting Chief Economist thomasshik@hangseng.com Renminbi Depreciation and the Hong Kong Economy If the recent weakness of the renminbi persists, it is likely to have a positive direct impact
Issue. September 2012
 September 2012 Issue In a future world of 8.5 billion people in 2035, the Energy Information Administration s (EIA) projected 50% increase in energy consumption will require true all of the above energy