Spatial Analysis of Urban Poverty In Manila, Philippines
|
|
|
- Baldwin Baldwin
- 7 years ago
- Views:
Transcription

1 Spatial Analysis of Urban Poverty In Manila, Philippines CRP5080 Introduction to Geographic Information Systems May, 2009 Shohei Nakamura
2 Table of Contents Table of Contents Maps, Figures, and Tables Abstracts Introduction 1. Background 2. Methodology Part 1: Spatial Analysis of Urbanizatin, Poverty, and Informal Settlements 1. Administrative System 2. Population 3. Poverty 4. Informal Settlements 5. Summary Part 2: Spatial Analysis of Accessibility to Transportation and Social Services 1. Transportations 2. Social Services 3. Overlay Analysis 4. Summary Conclusion References Appendices
3 Maps, Figures, and Tables Maps Map 1: Philippines Administrative Boundaries Map 2: 2003 Population and Annual Population Growth, Metro Manila Map 3: 2003 Population and Density, City of Manila Map 4: 2003 Poverty Incidence and Poverty Gap, Metro Manila Map 5: 2003 Poverty Incidence and Poverty Gap, City of Manila Map 6: 2002 Percentage and Number of Informal Settlements, Metro Manila Map 7: Informal Settlements, City of Manila Map 8: Railway Network in the Center of Metro Manila Map 9: Railway Service Areas with Hospitals in the Center of Metro Manila Map 10: Railway Service Areas with Municipality Boundaries in the Center of Metro Manila Map 11: Hospital Service Areas with Railways in the Center of Metro Manila Map 12: Hospita Service Areas with Municipal Boundaries in the Center of Manila Map 13: Accessibility Analysis with Railways and Hospitals in the Center of Metro Manila Map 14: Accessibility Analysis with Municipality Boundaries in the Center of Metro Manila Figures Figure 1 & 2: City of Makati Figure 3 & 4: Informal Settlements in Manila Figure 5: Informal Settlements in Pasay City Figure 6, 7 & 8: Typical Locations of Informal Settlements in Manila Figure 9, 10 & 11: Informal Settlements in Tondo Figure 12: Jeepney Tables Table 1: Comparison of Percentage of Infromal Settlements and Total Population Table 2: Comparison of Percentage of Infromal Settlements and Population Growth Table 3: Comparison of Percentage of Infromal Settlements and Poverty Incidence Table 4: Monthly Expenditure of Urban Poor Households
4 Abstracts By presenting a number of maps created by using a GIS tool, this paper analyzes the spatial patterns of urban poverty in the City of Manila and Metro Manila, the Philippines. In the first part, the spatial pattern of the urban development in Manila is analyzed in light of population, poverty, and informal settlements. In the second part, using railways and hospitals as examples, the accessibility to transportation and social services in the central part of Metro Manila is analyzed. The following are the findings identified by the analyses: Population has been increasing mainly in the suburbs of Metro Manila. Poverty is concentrated in the areas facing Manila Bay. While the spatial pattern of poverty does not correspond to that of informal settlements, a couple of huge agglomerations of informal settlements are observed in the poverty area in the City of Manila. While transportation and social services are mostly available anywhere in the center of Metro Manila, their service areas do not cover the poverty area. These findings suggest that while the population is sprawling, urban policies for poverty alleviation, particularly in informal settlements, are still needed. 3
5 Introduction 1. Background At an unprecedented pace, urbanization has been accelerating in Asia. According to the Asian Development Bank, 38 percent of the total population in Asia (1.36 billion) now live in urban areas, and this number is predicted to double (2.64 billion) by In the Philippines in the year 2000, the urban population comprised of 48 percent of its national population, amounting to 36.7 million. 2 While contributing to the economic growth, urbanization also has widened inequality between those who live in rural and urban areas and among urban populations. The world s 700 million people now live with less than one US dollar a day, and 400 million of them live in urban areas. Considering an ongoing and future rapid increase in the urban population, tackling urban poverty is an imminent issue in order to achieve a well-balanced sustainable urban development. Urban poverty is a multi-dimensional phenomenon, ranging from income to the access of social services and political power, and slums are the place in which those varieties of poverty become visible. One third of the world s population now lives in slums, and 60 percent of them, 554 million, live in Asia. 3 In Southeast Asia, the urban population accounts for 38 percent of the total population in the region, and 28 percent are forced to live in slums. People living in slums have been excluded from the benefits of urban development, resulting in persistent urban poverty in developing countries. While international development experts have focused on slums as the way to eradicate urban poverty, the relationship between poverty and slums is not necessarily clear. If slums are not a primary cause of urban poverty, it would be inefficient to allocate limited resources into policies for upgrading slums. This paper offers insight into the link between urban poverty and slums. 2. Methodology This paper conducts spatial analysis by using several maps that are created by the author, using ArcGIS software. In part 1, the spatial patterns of population, poverty, and informal settlements in Manila are analyzed by comparing several thematic maps on both the metropolitan and the city level. In part 2, the networks of the service areas of railways and hospitals in the central part of Manila are analyzed by combining two rasterized maps into an overlay map. The basic data of GIS layers are obtained from OpenStreetMap, courtesy of Cloudmade. 4 Other thematic data, such as population, poverty, and informal settlements, are obtained from different sources, such as the Philippines national census, the unpublished report of the Housing and Urban Development Co-ordinating Council (HUDCC), and the 2003 City and Municipal Level Poverty Estimates (referred to as the Poverty Report, hereinafter), published by the National Statistical Coordination Board. Some of these data are modified by the author to correspond to each other for the purpose of comparison. In addition to these quantitative data, several pictures taken by the author in 2007 are presented as qualitative data. The possibility of inaccuracy due to the limitation of data availability should be noted here. In part 2, the list of hospitals in Metro Manila is obtained from unreliable and possibly incomprehensive data. In addition, those hospitals are plotted on the map by the author by looking at Google Maps. 1 Asian Development Bank (2004). 2 National Statistic Office (2003),. 3 UN-Habitat, Global Urban Observatory. 4 Cloudmade. 4

6 Part 1: Spatial Analysis of Urbanization, Poverty, and Informal Settlements This part analyzes the spatial patterns of population, poverty, and informal settlements in Metro Manila and the City of Manila by using several GIS maps. In terms of population, the occurrence of urban sprawl is observed. Presented maps also indicate no distinct linkage between poverty and informal settlements in the metropolitan level, but some huge agglomerations of slums relate to poverty in the City of Manila. 1. Administrative System The Philippines primary metropolitan area including its capital city, Metro Manila is located in Luzon, the largest island in the Philippines, and is bounded by Manila Bay to the west and Laguna de Bay to the southeast (Map 1). Due to its political importance, Metro Manila is specially administered as the National Capital Region (NCR), but it does not have any specific administrative organization representing the whole area. Metro Manila consists of 16 cities and one municipality and is divided into four districts. The first district is the City of Manila, the capital city of the Philippines, which is furthermore divided into 16 districts. However, this paper follows the way of subdivision adopted by the Poverty Report, which divides the City into 14 districts as shown on the left-hand side of the map. 2. Population In this section, the population pattern in Metro Manila and the City of Manila is examined. GIS maps identify the occurrence of urban sprawl in Metro Manila and the extremely large population and high density of Tondo in the City of Manila. 5
7 Metro Manila With its 11,553,427 citizens according to the 2007 national census, Metro Manila ranks as the 20th largest urban area in the world. 5 While the population of Metro Manila accounts for 13 percent of the total population in the Philippines, its area is 617 km 2, accounting for only 0.2 percent of the national area. Map 2 illustrates the population in 2003 and the annual population growth rate between 2000 and 2007 in each city in Metro Manila. Population data is based on the Poverty Report to make it correspond to its 2003 poverty data, which is discussed later in the next section. The data of annual population growth rate is obtained from the 2007 national census. On this map, the areas with larger circles have larger populations. Quezon City has the largest population with 2,597,690, and the City of Manila and Kalookan City (or Caloocan City) follow with 1,772,612 and 1,263,236, respectively. On the other hand, the areas colored in red have high population growth rates: Taguig and Quezon City have a high growth rate of 3.82% and 2.92%. Following them are the City of Paranaque (2.88%) and the City of Pasig (2.80%). In contrast, the population growth rate in the City of Manila and its adjacent cities remains low. It is observed that the cities surrounding the City of Manila have high population growth rates, which clearly indicates the occurrence of urban sprawl. City of Manila Located at the mouth of Pasig River, the City of Manila has a population of 1,772,612, which is the seventh largest among the world cities. 6 With an area of km 2, the population density of the City amounted to 43,079/km 2 in Map 3 shows each district s population and population density in 2003 in the City of Manila. As their smaller circles illustrate, the central districts, such as Binondo, Quiapo, San Miguel, Intramuros, and Ermita, have fewer populations, while the surrounding districts have larger populations. In particular, Tondo and Sampaloc have quite large populations: 673,105 and 378,394, respectively. 5 City Mayors. The world s largest cities and urban areas in City Mayors. The largest cities in the world by land area, population and density. 6

8 Density has a similar pattern, as shown in the color scale with light green being the lowest and dark blue being the highest. The districts surrounding the central area have higher densities, among which are Tondo and Santa Ana with the highest densities: 77,804/km 2 and 56,549/ km 2, respectively. Thus, Tondo has both the largest population and highest density, resulting from a great number of informal settlements, which is discussed later in this paper. 3. Poverty This paper then analyzes the spatial patterns of poverty in Metro Manila and the City of Manila. Based on the data from the Poverty Report, several maps were created by the author, which indicate the concentration of poverty in the area facing Manila Bay. Definition 2003 City and Municipal Level Poverty Estimates (the Poverty Report, in this paper), published by the National Statistical Coordination Board in cooperation with the World Bank, offers insightful findings by their comprehensive research about Philippines poverty incidences and the poverty gap in 2003 in the city and municipal level. The Poverty Report measures the poverty by two kinds of standards: poverty incidence and poverty gap. Simply speaking, the former indicates the spread of poverty and the latter indicates the intensity of poverty. Poverty incidence is an indicator of the percentage of families/ individuals whose incomes are below the poverty threshold, the minimum income to meet the basic food and non-food requirements. The 2003 annual per capita poverty threshold in Metro Manila is estimated to be 16,737 Philippine Pesos (309 USD), while nominal per capita income is 58,772 Philippine Pesos (1,084 USD). 7 On the other hand, the poverty gap indicates the percentage of the amount of the shortfall of the incomes of the families/individuals to the poverty 7 7 National Statistical Coordination Board, On poverty thresholds and income. ForTheRecord/04Apr07_se_povertygap.asp

, Taguig (5.23%), Kalookan City (5.")
9 threshold. The limitation of the Poverty Report lies in the fact that it measures poverty only by economic standards. To complement this, other aspects of poverty such as the lack of accessibility to transportation and social services are analyzed later in this paper. Metro Manila Map 4 illustrates the poverty incidence and poverty gap in Metro Manila in 2003 based on the data from the Poverty Report. Poverty incidence on the map changes from light blue to dark purple as the value goes up. The cities with higher poverty incidences are Navotas (7.41%), Taguig (5.23%), Kalookan City (5.16%), Malabon (5.10%), and the City of Manila (4.86%), all of which are located in relatively urbanized areas. In addition to the City of Manila, Taguig is the city where the many educational institutions and businesses are located. This indicates that the percentage of poor families is higher in such urban centers. In contrast, the cities with the lowest poverty incidences are San Juan (1.5%) and the City of Makati (1.86%), which are the newly developed financial centers of the Philippines with a large amount of gentrified residential buildings and skyscrapers (Figure 1 and 2). In addition to poverty incidences, the map shows the poverty gap in each city. The data of the City of Manila is not shown on the map due to the availability. The larger orange circle indicates the larger poverty gap. The areas with a high poverty gap exactly correspond to the areas with high poverty incidence: i.e., Navotas (1.37%), Taguig (0.95%), Kalookan City (0.91%), and Malabon (0.90%). Therefore, it is found that the percentage of poor families is higher in the urban centers and the scarcity of income of each family is also larger there. However, as the Poverty Report clarifies, the poverty incidences in any of the cities in Metro Manila are quite lower than the national average: 37.5%. This is the reason why Metro Manila has been attracting people from other areas. Figure 1 & 2: City of Makati Taken by S. Nakamura commons/c/c4/makatiskyline.jpg 8
10 City of Manila Map 5 shows the poverty incidence and poverty gap in each district in the City of Manila. One can find that the districts with high poverty incidences are mainly located in the northwest area, such as Port Area (13.17%), San Nicolas (8.93%), Intramuros (7.97%), and Tondo (6.73%). In contrast, Binondo and Sampaloc have a quite low percentage: 1.14% and 1.93%, respectively. With a number of Chinese merchants, Binondo is the area that had long been the financial center of Manila until Makati developed as a new financial hub. Sampaloc is the residence area for wealthier people where the president s palace is also located. As well as in metropolitan level, the poverty incidence and poverty gap correspond to each other in the City of Manila. The districts with high poverty incidences also have a high poverty gap: Port Area (2.71%), San Nicolas (1.71%), Intramuros (1.47%), and Tondo (1.25%). In conclusion, Map 4 and 5 clarify that poverty exists mainly in the Manila Bay area, and, in particular, Port Area has both the highest poverty incidence and poverty gap. 4. Informal Settlements This section presents the examination of the spatial pattern of informal settlements in Metro Manila and the City of Manila with the analysis of the relationship between the pattern of informal settlements and poverty, which is identified in the previous section. Based on the data derived from the report of the Housing and Urban Development Co-ordinating Council (HUD- CC), this paper presents a couple of maps created by the author in addition to the several pictures taken by the author in

11 Definition Informal settlements (Figure 3 and 4), sometimes called slums, are defined by the Philippine government as buildings or areas that are deteriorated, hazardous, unsanitary or lacking in standard conveniences. 8 Figure 3 & 4: Informal Settlements in Manila Taken by S. Nakamura Taken by S. Nakamura Metro Manila Map 6 illustrates the percentage and number of informal settlements in Metro Manila in The areas in darker green have a higher percentage of the informal settlements, calculated by dividing the number of the households living in informal settlements by the total number of households in the area. When it comes to the ratio, there seems to be no distinct spatial pattern. The cities with the highest percentages are Pasay City (73.5%), City of Muntinlupa (51.9%), and Mandaluyong City (42.5%), while the average percentage in Metro Manila is 33.4% with 701,753 informal settlements. Almost three-fourths of the households in Pasay City are estimated to live in informal settlements (Figure 5). As reasonably inferred, the numbers of informal settlements are larger in the cities with large populations, such as Quezon City (69,490), the City of Manila (99,548), and Kalookan City (67,292). Figure 5: Informal Settlements in Pasay City 8 Ragragio (2003). 10
12 Table 1 shows the correlations between the percentage of informal settlements and total population. As the table clearly indicates, the cities with smaller populations have higher percentages of informal settlements. Table 1: Comparison of Percentage of Informal Settlements and Total Population 2002 Percentage of Informal Settlements (Map 6) 2003 Total Population (Map 2) 1 Pasay City Quezon City 2,597,690 2 City of Muntinlupa City of Manila 1,772,612 3 Mandaluyong City Kalookan City 1,263,236 4 Navotas City of Pasig 578,122 5 City of Las Pinas Taguig 519,101 7 Quezon City City of Las Pinas 441, City of Manila Pasay City 403, Kalookan City City of Muntinlupa 388, City of Pasig Mandaluyong City 306, Taguig Navotas 235,951 Similarly, Table 2 shows the correlations between the percentage of informal settlements and annual population growth rates. The cities with lower population growth rates by and large have high percentages of informal settlements. This finding is interesting in that it is against the typical explanation of the expansion of informal settlements. Generally, an increase in informal settlements occurs where the housing supply fails to meet rapidly increasing demand due to the population growth in urban areas. However, it turns out that many informal settlements exist in the areas with lower population growth in Manila, as indicated in Table 2. Thus, it can be inferred that the existence of informal settlements has become a persistent and stable phenomenon in Metro Manila. Table 2: Comparison of Percentage of Informal Settlements and Population Growth 2002 Percentage of Informal Settlements (Map 6) Population Growth (Map 2) 1 Pasay City Taguig City of Muntinlupa Quezon City Mandaluyong City City of Paranaque Navotas City of Pasig City of Las Pinas City of Muntinlupa Quezon City Pasay City City of Paranaque City of Las Pinas City of Pasig Mandaluyong City Taguig Navotas
13 Finally, the data of the percentage of informal settlements and poverty incidence does not support the general assumption about their linkage (Table 3). Except for Navotas, none of the cities with high poverty incidences has a high percentage of informal settlements. As long as economic status is concerned, the living conditions of people living in slums turn out to be not as bad as expected. However, because poverty is a multi-dimensional phenomenon, other aspects of their living conditions need to be examined to conclude that they are better off. Part 2 in this paper analyzes those aspects. Table 3: Comparison of Percentage of Informal Settlements and Poverty Incidence 2002 Percentage of Informal Settlements (Map 6) 2003 Poverty Incidence (Map 4) 1 Pasay City Navotas City of Muntinlupa Taguig Mandaluyong City Kalookan City Navotas Malabon City of Las Pinas City of Manila City of Muntinlupa City of Manila 13 Kalookan City Pasay City 15 Taguig City of Las Pinas 16 Malabon Mandaluyong City City of Manila Although the district-level data of the number and location of informal settlements in the City of Manila is not available, it is assumed that they spread over the entire city.9 The typical locations are factories, under bridges, and in other public spaces, such as ports and railways (Figure 6, 7, and 8). These informal settlements are blended in the city s fabric, but the contrast between the rich and poor living in the same proximity represents well the characteristic of urban poverty. 9 Ragragio (2003). 12
14 While spreading over the entire city, informal settlements concentrate on the areas facing the Manila Bay in the City of Manila. Among those areas, Tondo and Port Area are notorious for their tremendous living conditions (Map 7). The aerial pictures show a huge number of informal settlements that illegally occupy the public open spaces. As identified in the previous section, these areas have high poverty incidences and poverty gaps (Map 5). Tondo used to be famous for its huge agglomeration of slums within and around the waste disposal place on the landfill: the Smoky Mountain, named after its unique appearance always generating smoke due to the chemical reaction caused by strong sun light and garbage. Although the Smokey Mountain and informal settlers have already been relocated by the government, people soon began to settle in the new waste disposal site near the original location (Figure 9 and 10). Called as Scavengers, they make a living by collecting and selling garbage. They are always fearful of eviction due to lack of tenure (Figure 11). Figure 6, 7 & 8: Typical Locations of Informal Settlements in Manila Taken by S. Nakamura Figure 9, 10 & 11: Informal Settlements in Tondo Taken by S. Nakamura 5. Summary In Part 1, the spatial patterns of population, poverty, and informal settlements in Metro Manila and the City of Manila are analyzed with several GIS maps. In overall Metro Manila, the occurrence of urban sprawl is observed. While poverty is concentrated in the City of Manila and its adjacent cities facing Manila Bay, there is no distinct characteristic of the spread of informal settlements. In the City of Manila, population and density is higher in the outer districts. Poverty is concentrated in the bay area districts, such as Tondo and Port Area, which also have a huge number of informal settlements. In conclusion, while there is no distinct correlation between poverty and informal settlements at the macro level (metropolitan level), extremely overcrowded informal settlements still relate to severe poverty at the micro level (city level). Although this part measures poverty only by the income standard, urban poverty is a multi-dimensional problem, which requires a comprehensive approach. Thus, the next part analyzes other aspects of poverty: lack of access to transportation and social services. 13

15 Part 2: Spatial Analysis of Accessibility to Transportations and Social Services To include other aspects of poverty in addition to income, this part analyzes the accessibility of the citizens in the central part of Metro Manila to transportation and social services. Taking railways and hospitals as examples, the analysis shows how access to those services is distributed and poor people are deprived of them. 1. Transportation Background People residing in and commuting to central Manila have multiple modal choices: cars, motorbikes, bicycles, buses, jeepney (Figure 12), railways, and, the most popular way, by foot. Aside from walking, poor people mostly rely on jeepney, which is the cheapest transportation in Manila. Jeepney runs through every road in Manila and picks you up anywhere and takes you to anywhere for only 7.5 Peso (approximately 15 US cents) for the first four kilometers. Although the fee is relatively expensive, railway is becoming a popular mode of transportation among local people with its extensive network and comfort (Map 8). In the central part of Metro Manila, four types of railways are operated: Light Rail Transit 1 (LRT 1), LRT 2, Metro Rail Transit 3 (MRT 3), and Philippine National Railways (PNR). The fee is 12 Peso (25 cents) for the first four stations, and 15 Peso for more than five stations. Figure 12: Jeepney gallery/albums/trips_asia/jeepney.jpg 14
16 Transportation cost is a heavy burden for the urban poor in Manila. Among the monthly expenditure of urban poor households in Metro Manila, transportation is the second largest with 3 USD, accounting for 13.6% of the total expenditure (Table 4). Although further study is needed to identify what transportation the urban poor in Metro Manila usually use for commuting and for other purposes, this paper focuses on railways to examine how accessible transportation is in the metropolitan areas, including the high poverty areas identified in the previous part with thousands of informal settlements. Table 4: Monthly Expenditure of Urban Poor House Expenditure in USD Percentage Food % Transportation % Electricity 1 4.4% Schooling % Water % Fuel % Health % Clothing % Rent % Others % Total % Source: A Place To Call Home by Michael Alba, 1996 GIS Analysis Maps 9 and 10 show the railway network and service areas in the central part of Manila. A two kilometer radius of a railway station is considered to be its service area in this analysis. On the map, the area in darker green is the place where the larger number of service areas overlap. The most intensely covered area is the center of the City of Manila, which has 13 stations within two kilometers at most. The area near the border between the City of Makati and Pasay City also has a larger number of stations. On the other hand, the southwest area of Quezon City is not covered at all. Tondo and Port Area are barely covered except for PNR Tutuban Station. In addition, comparing this map with Map 2 in the previous part, one can find that the population increase mainly takes place outside railway-covered areas. 15
17 2. Social Services Background Metro Manila offers a wide variety of amenities and social services operated by both the public and private. Those facilities include hospitals, schools, libraries, and police and fire stations, which can be accessed through one of or a combination of the transportations mentioned above. Although these services should be offered to all citizens regardless of their income and addresses, certain people, particularly the poor, are sometimes excluded from access to the services. Among a number of amenities and social services, the most important are hospitals. According to the available data, 78 hospitals exist in the center of Metro Manila. 10, 11 This paper focuses on these hospitals to analyze their service area network by using a GIS tool. GIS Analysis In the same way as the transportation analysis, the maps below (Map 11 and 12) illustrate how the service areas of hospitals cover the central part of Manila. The central districts of the City of Manila and Quezon City are painted in darker yellow, which indicates the concentration of hospitals. These areas have 20 hospitals within two kilometers at most. It is noted that the northwest of Tondo and Navotas are not covered while virtually all other areas in the central of Metro Manila are covered by at least one hospital. 10 Wikipedia, List of hospitals in the Philippines. Philippines#Metro_Manila 11 moveandstay.com, Manila hospitals. 16
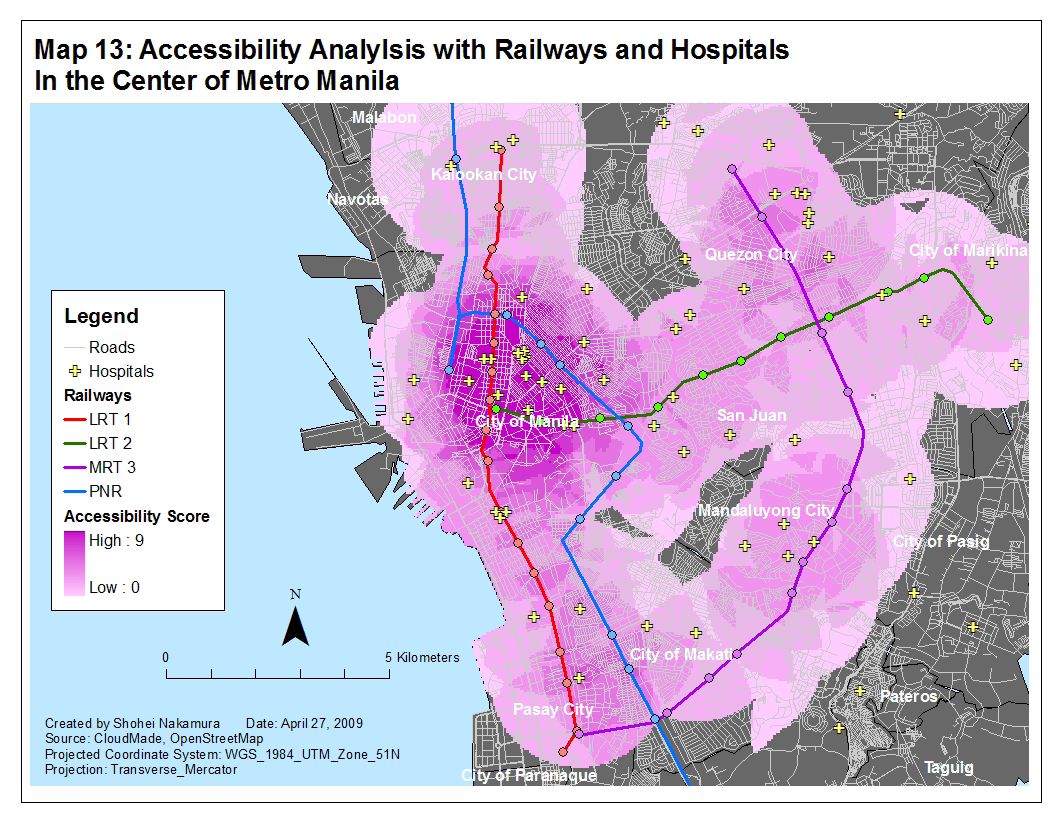
18 3. Overlay Analysis Based on the maps presented above, overlay maps are created to show how the service areas of railways and hospitals are overlapping in the central of Metro Manila (Map 13 and 14). These maps are created by adjusting the values of the railway-map and hospital-map into 0-10 scales and adding those values with equal weight. The areas with higher scores, which are the places in which people have good access to both railways and hospitals, are colored in darker red. The results clearly show that the following areas have better access: the central districts of the City of Manila, the southwest of Quezon City, the area near the border between Makati City and Pasay City, San Juan, and Mandaluyong City. Most of these areas correspond to the less poor areas indicated by Maps 4 and 5. In contrast, poverty concentrated areas such as Port Area and Navotas relatively lack the access to transportation and hospitals. Although the area closer to the center of the City of Manila is fairly covered, Tondo has an uncovered area in the northwest where numbers of informal settlements exist. 4. Summary In Part 2, the service area networks of railways and hospitals are analyzed to examine how local people, in particular those who live in informal settlements, are given or are deprived of the access to transportation and social services. The results of spatial analysis indicate that while most of the City of Manila is extensively covered by both the railway and hospital services areas, the northwest Tondo and Navotas are excluded from those services. Although this fact only indicates the correlation between the formation of informal settlements and the lack of infrastructures, it is assumed that the agglomeration of informal settlements makes it more difficult to build infrastructures, thereby leading to further widening their isolation and exacerbating their living conditions. 17
19 Conclusion The spatial analyses of urbanization, poverty, and informal settlements in the City of Manila and Metro Manila (Part 1) and the accessibility to transportation and social services in the central part of Metro Manila (Part 2) identifies the following findings: Population has been increasing mainly in the suburbs of Metro Manila. Poverty is concentrated in the areas facing Manila Bay. While the spatial pattern of poverty does not correspond to that of informal settlements, a couple of huge agglomerations of informal settlements are observed in the poverty area in the City of Manila. While transportation and social services are mostly available anywhere in the center of Metro Manila, their service areas do not cover the poverty area. These findings suggest that while the area is sprawling, urban policies for poverty alleviation, particularly in informal settlements, are still needed. 18
20 References Asian Development Bank, 2004, City development strategy to reduce poverty. National Statistical Coordination Board, 2009, 2003 City and Municipal Level Poverty Estimates. Ragragio, Junio M., 2003, Urban Slums Report: The Case of Metro-Manila, Understanding Slums: Case Studies for the Global Report on Human Settlement
21 Appendices Summary Data Table Map 1: Philippines Administrative Boundaries Map 2: 2003 Population and Annual Population Growth, Metro Manila Map 3: 2003 Population and Density, City of Manila Map 4: 2003 Poverty Incidence and Poverty Gap, Metro Manila Map 5: 2003 Poverty Incidence and Poverty Gap, City of Manila Map 6: 2002 Percentage and Number of Informal Settlements, Metro Manila Map 7: Informal Settlements, City of Manila Map 8: Railway Network in the Center of Metro Manila Map 9: Railway Service Areas with Hospitals in the Center of Metro Manila Map 10: Railway Service Areas with Municipality Boundaries in the Center of Metro Manila Map 11: Hospital Service Areas with Railways in the Center of Metro Manila Map 12: Hospita Service Areas with Municipal Boundaries in the Center of Metro Manila Map 13: Accessibility Analysis with Railways and Hospitals in the Center of Metro Manila Map 14: Accessibility Analysis with Municipality Boundaries in the Center of Metro Manila
22 Summary Data Table 2007 Census 2003 SAE of Poverty Report 2002 HUDCC Report Area (has) Area (sq.km) Population Density (per sq.km) Population Growth Rate Total Population (Original) Total Population (Modified) Total Population Poverty Incidence (%) Poor Population Poverty Gap Area (sq.km) Population Density (per sq.km) Total Households Informal Settelers (Households) Percentage (%) NCR 1st District (City of Manila) Tondo , , , , , ,804 Binondo ,303 12,100 12,100 12, ,505 Quiapo ,321 23,138 23,138 24, , ,152 San Nicolas ,381 43,225 43,225 46, , ,158 Santa Cruz , , , , , ,027 Sampaloc , , , , , ,843 San Miguel ,637 16,115 16,115 17, ,834 Ermita ,905 6,205 6,205 6, ,169 Intramuros ,456 5,015 5,015 5, ,965 Malate ,099 78,132 78,132 83, , ,133 Paco ,866 69,300 69,300 73, , ,543 Pandacan ,864 76,134 76,134 81, , ,950 Port Area ,442 48,684 48,684 51, , ,483 Santa Ana ,704 62, , , , ,549 Sub Total 3, ,186 1,445,228 1,660,714 1,772, , ,982 San Andres , ,585 Santa Mesa ,892 98,901 Total 3, , ,660, ,547 99, NCR 2nd District Mandaluyong City , , , , ,222 59,682 25, City of Marikina , , , , ,610 80,160 28, City of Pasig 31 19, , , , , ,835 27, Quezon City , ,679,450 2,597, , , , , San Juan , , , , ,716 NCR 3rd District Kalookan City , ,378,856 1,263, , , ,567 67, Malabon , , , , ,866 74,137 12, Navotas , , , , ,908 49,450 19, City of Valenzuela , , , , , ,382 36, NCR 4th District City of Las Pinas , , , , ,628 97,962 36, City of Makati , , , , ,900 98,225 27, City of Muntinlupa , , , , ,310 78,016 40, City of Paranaque , , , , ,681 94,106 29, Pasay City 19 21, , , , ,260 78,180 57, Pateros , ,940 62, , ,794 12,029 3, Taguig , , , , , ,723 21, Total , ,553,427 10,985, , ,804 2,102, ,
23 22
24 23
25 24

26 25
27 26

28 27

29 28
30 29

31 30
32 31

33 32
34 33
35 34
36 35
METRO MANILA: A Case Study in Metropolitan Planning and Governance
 METRO MANILA: A Case Study in Metropolitan Planning and Governance NATHANIEL VON EINSIEDEL (Former Commissioner for Planning of The Metro Manila Commission) February 2009 INTRODUCTION Location of Metro
Mega Manila: Partnership in Action
 Domestic WastewaterManagement in Mega Manila: Partnership in Action Leonor C. Cleofas Deputy Administrator Metropolitan Waterworks and Sewerage System Securing the Future Today The MWSS Privatization On
Downtown Vancouver Full Block For Sale 1.03 Acre Redevelopment Opportunity
 FOR SALE E Mill Plain & E Main Street, Vancouver, WA E 16th St Main St Columbia St Washington St E 15th St E Mill Plain Blvd Downtown Vancouver Full Block For Sale 1.03 Acre Redevelopment Opportunity $2,00,000
NGOs ROLE IN THE PASIG RIVER REHABILITATION PROGRAM
 NGOs ROLE IN THE PASIG RIVER REHABILITATION PROGRAM FORUM Network for Urban Futures in Southeast Asia SUMMER SCHOOL 2009: CIVIL SOCIETY Cologne, Germany Imelda Baleta Outline Context The Pasig River The
REPUBLIC ACT NO. 7924
 Republic of the Philippines Congress of the Philippines Metro, Manila Third Regular Session Begun and held in Metro, Manila, on Monday, the twenty- fifth day of July, nineteen hundred and ninety four.
Sustainable city development through smart urban planning
 Sustainable city development through smart urban planning Agenda Summary Points Urban Planning Overview Urbanization in India Objectives of Smart Urban planning Key Focus Areas in Smart Urban Planning
Republic of the Philippines PHILIPPINE ECONOMIC ZONE AUTHORITY Roxas Boulevard corner San Luis Street Pasay City CERTIFICATE OF BOARD RESOLUTION
 Republic of the Philippines PHILIPPINE ECONOMIC ZONE AUTHORITY Roxas Boulevard corner San Luis Street Pasay City CERTIFICATE OF BOARD RESOLUTION This is to certify that at the Board Meeting of the Philippine
Outsourcing in the Philippines:
 Outsourcing in the Philippines: The National Capital Region December 2008 The emergence of the Philippines as an outsourcing destination rests largely on the continued development of the country s national
TABLE OF CONTENTS. Title Page Table of Contents 1 List of Tables and Charts 2 Executive Summary 3. I. Introduction 4
 TABLE OF CONTENTS Title Page Table of Contents 1 List of Tables and Charts 2 Executive Summary 3 I. Introduction 4 a. Objectives 4-5 b. Scope and Limitations of the Study 6-6 II. Review of Relevant Literature
Basic Education Information System (BEIS) by Lilia Z. Roces and Deogracias B. Genito, Jr.
 by Lilia Z. Roces and Deogracias B. Genito, Jr.") 9 th National Convention on Statistics (NCS) EDSA Shangri-La Hotel October 4-5, 2004 Basic Education Information System (BEIS) by Lilia Z. Roces and Deogracias B. Genito, Jr. For additional information,
9 th National Convention on Statistics (NCS) EDSA Shangri-La Hotel October 4-5, 2004 Basic Education Information System (BEIS) by Lilia Z. Roces and Deogracias B. Genito, Jr. For additional information,
Geographical Information Systems (GIS) and Economics 1
 and Economics 1") Geographical Information Systems (GIS) and Economics 1 Henry G. Overman (London School of Economics) 5 th January 2006 Abstract: Geographical Information Systems (GIS) are used for inputting, storing,
Geographical Information Systems (GIS) and Economics 1 Henry G. Overman (London School of Economics) 5 th January 2006 Abstract: Geographical Information Systems (GIS) are used for inputting, storing,
The Mobility Opportunity Improving urban transport to drive economic growth
 , CEO Infrastructure & Cities Sector, Siemens The Mobility Opportunity Improving urban transport to drive economic growth Answers for infrastructure and cities. We are in the "urban millennium" Population
Cities for Mobility. World Congress 2008 City of Stuttgart June 1-4, 2008. The Transport System in the City of Yaoundé, Cameroon.
 Cities for Mobility World Congress 2008 City of Stuttgart June 1-4, 2008 The Transport System in the City of Yaoundé, Cameroon Presented by Mr Gilbert Tsimi Evouna Dear Mayors, dear participants, I am
Meeting Urban Development Challenges
 Discussion Draft Meeting Urban Development Challenges Its importance for both growth and poverty calls for a coherent national framework toward urbanization. The objective of such a framework should be
CITY CLIMATE LEADERSHIP AWARDS
 CITY CLIMATE LEADERSHIP AWARDS Mexico City Climate Close-Up Fast Facts Population Projections Mexico s GDP per capita was US$15,195 dollars in 2010 (estimate). By 2050, Mexico s population is estimated
Latin American Green City Index
 Latin American Green City Index World Mayors Summit on Climate Mexico City Leo Abruzzese Global Forecasting Director Economist Intelligence Unit Overview The Latin American Green City Index A unique Index
DECISION SUPPORT SYSTEM FOR THE PLANNING AND DEVELOPMENT OF INTEGRATED FACILITY NODES
 DECISION SUPPORT SYSTEM FOR THE PLANNING AND DEVELOPMENT OF INTEGRATED FACILITY NODES N I MOROJELE 1, C A GREEN 1 and V RAMDUNY 2 1 CSIR Transportek, P O Box 320, Stellenbosch 7599 2 Urban Strategy, ethekwini
Metro Manila, Philippines
 The case of Metro Manila, Philippines by Junio M Ragragio Contact: Junio M Ragragio No. 80 Boston Street, Cubao, Quezon City, Philipines Phone: +632 721-8370; +632 411-5988 Fax. +632 721-8370 E-mail: dpem@info.com.ph
Need of Rural Development in India for Nation Building
 Need of Rural Development in India for Nation Building Abhishek Chauhan Abstract There are no universally accepted approaches to rural development. It is a choice influenced by time, space and culture.
How To Improve The Quality Of Life In Lusaka
 Lusaka, from Garden City to Metropolitan: Toward Sustainable African City Regions Norihisa SHIMA (The University of Tokyo) 1. Urbanization in Africa 2. The Case of Lusaka 1. Urbanization and Planning
Practical decisions facing urban planners
 Module : Practical decisions facing urban planners Alain Bertaud Urbanist Summary 1. Should densities be controlled? 2. Should planners favor monocentric or polycentric cities? 3. Side effects of green
5. URBAN AND SOCIOECONOMIC CHARACTERISTICS OF CHICAGO AND BARCELONA
 5. URBAN AND SOCIOECONOMIC CHARACTERISTICS OF CHICAGO AND BARCELONA The first step to understand and analyze a city s public transportation needs is to study its social, historical, and economical characteristics.
6 REGIONAL COMMUTE PATTERNS
 6 REGIONAL COMMUTE PATTERNS INTRODUCTION One of the challenges for this study, which has a primary goal of looking at commute opportunities in MnDOT District 3, is that in some portions of the study area,
I. INTRODUCTION B. A. PURPOSE
 System Plan Introduction A. The Mission of the San Antonio Parks and Recreation Department is to develop and maintain a balanced, safe, and easily accessible system of exceptional parks, recreational facilities
A Study of Metro Manila s Public Transportation Sector By Implementing A Multimodal Public Transportation Route Planner
 A Study of Metro Manila s Public Transportation Sector By Implementing A Multimodal Public Transportation Route Planner Chelcie NARBONETA a, Kardi TEKNOMO b a,b Department of Information Systems and Computer
Article. Commuting to work: Results of the 2010 General Social Survey. by Martin Turcotte
 Component of Statistics Canada Catalogue no. 11-008-X Canadian Social Trends Article Commuting to work: Results of the 2010 General Social Survey by Martin Turcotte August 24, 2011 CST Standard symbols
Integrated Public Transport. Planning. National workshop on promoting sustainable transport solutions for East Africa
 Integrated Public Transport National workshop on promoting sustainable transport solutions for East Africa Carly Koinange, GEF Sustran Consultant UN-HABITAT Urban Mobility Unit Urban Basic Services Branch
The space occupied by motor vehicles in Sydney: a possible public health advocacy tool
 The space occupied by motor vehicles in Sydney: a possible public health advocacy tool Physicians Conference May 2009 Stephen Conaty Sydney South West Area Health Service Public Health Unit Assumptions
2015 IBB Housing Market Report
 2015 IBB Housing Market Report Summary www.ibb.de Foreword 1 Foreword Berlin s housing market still has enormous challenges to face. Demographic change has a strong hold on the market. As migration continues
Planning for the future. building a great city, great neighbourhoods
 Planning for the future building a great city, great neighbourhoods Table of contents 1 Looking ahead 2.4 million Calgarians 2 Goals 3 Building a sustainable, connected city of great neighbourhoods 4 Finding
Implementation of Multimodal Public Transportation Route Planner for Metro Manila
 Implementation of Multimodal Public Transportation Route Planner for Metro Manila ABSTRACT Narboneta, Chelcie* and Teknomo, Kardi M. ** The transportation network is continuously being congested. One way
Florida Avenue Multimodal Transportation Study. June 19, 2013
 Florida Avenue Multimodal Transportation Study June 19, 2013 Today s Agenda Team & project introduction Project Timeline What you said Tools we use Mapped data and what clues it can provide Highlights
Description of Simandou Archaeological Potential Model. 13A.1 Overview
 13A Description of Simandou Archaeological Potential Model 13A.1 Overview The most accurate and reliable way of establishing archaeological baseline conditions in an area is by conventional methods of
Primer on Transportation Funding and Governance in Canada s Large Metropolitan Areas
 Transportation Association of Canada Primer on Transportation Funding and Governance in Canada s Large Metropolitan Areas The transportation funding and governance frameworks of Canada s metropolitan regions
Multi-Zone Adjustment
 Written by Jonathan Sachs Copyright 2008 Digital Light & Color Introduction Picture Window s 2-Zone Adjustment and3-zone Adjustment transformations are powerful image enhancement tools designed for images
Fiscal impact analysis of three development scenarios in Nashville-Davidson County, TN
 Fiscal impact analysis of three development scenarios in Nashville-Davidson County, TN April 2013 Prepared by 1 SUMMARY BY SMART GROWTH AMERICA Summary This study examines the relative fiscal costs and
Wilmington Urban Area Metropolitan Planning Organization Surface Transportation Program Direct Attributable Project Submittal Guide Fiscal Year 2016
 Wilmington Urban Area Metropolitan Planning Organization Surface Transportation Program Direct Attributable Project Submittal Guide Fiscal Year 2016 Date of Release: September 14, 2015 Pre application
Development of Shanghai Integrated Transport (2010-2015) XIAO Hui and GU Yu
 XIAO Hui and GU Yu") Development of Shanghai Integrated Transport (2010-2015) XIAO Hui and GU Yu Abstract This article summarises the general situation of Shanghai s integrated transport system and then determines the trends
Development of Shanghai Integrated Transport (2010-2015) XIAO Hui and GU Yu Abstract This article summarises the general situation of Shanghai s integrated transport system and then determines the trends
CHAPTER ONE: DEMOGRAPHIC ELEMENT
 CHAPTER ONE: DEMOGRAPHIC ELEMENT INTRODUCTION One of the basic elements of this comprehensive plan is an analysis of the City of Beaufort s (the City) current and projected demographic makeup. The purpose
Rental Housing for Urban Low-Income Households in the Philippines
 Philippine Institute for Development Studies Surian sa mga Pag-aaral Pangkaunlaran ng Pilipinas Rental Housing for Urban Low-Income Households in the Philippines Marife M. Ballesteros DISCUSSION PAPER
Lake County. Government Finance Study. Supplemental Material by Geography. Prepared by the Indiana Business Research Center
 County Government Finance Study Supplemental Material by Geography Prepared by the Indiana Business Research www.ibrc.indiana.edu for Sustainable Regional Vitality www.iun.edu/~csrv/index.shtml west Indiana
APPENDIX B: THE PORTLAND METROPOLITAN REGION S CASE FOR ACTIVE TRANSPORTATION
 APPENDIX B: THE PORTLAND METROPOLITAN REGION S CASE FOR ACTIVE TRANSPORTATION Prepared by Alta Planning & Design May 2009 Call for Active transportation demonstration projects Metro invites partners to
Comprehensive Plan Amendment
 Staff Report CP-2-16 Comprehensive Plan Amendment Staff recommends four changes to the Economic Development element of the 2030 Comprehensive Plan to reflect a new Economic Development Toolkit and new
PERIMETER: How Transit Helped Mold a Market from Farmland to Fortune 500
 PERIMETER: How Transit Helped Mold a Market from Farmland to Fortune 500 PCIDs Standard Template; Updated: December 06, 2011 EVOLUTION OF THE MARKET Livable Center Live Work Play Sustainable Mall/Office/Commercial
KEYPORT COMMUNITY PLAN
 PLANNING COMMISSION TASKS Collect Public Comments on Draft Plan. Provide Clear Direction for: Preferred LAMIRD Boundary Lot Clustering Provision View Protection Recommendation to Board of County Commissioners.
Poverty Indicators Household Income and Expenditure Survey - 2006/07 Department of Census and Statistics Ministry of Finance and Planning Sri Lanka
 ISSN 1391-4695 March 2008 Poverty Indicators Household Income and Expenditure Survey - 2006/07 Department of Census and Statistics Ministry of Finance and Planning Sri Lanka Introduction The Household
Philadelphia County. Land Use and Growth Management Profile
 Philadelphia County is located in the southeastern corner of Pennsylvania and is bordered by the Pennsylvania counties of Delaware, Montgomery, and Bucks, and the New Jersey counties of Burlington, Camden,
150-303-405 (Rev. 6-09)
") A Brief History of Oregon Property Taxation 150-303-405-1 (Rev. 6-09) 150-303-405 (Rev. 6-09) To understand the current structure of Oregon s property tax system, it is helpful to view the system in a
A Brief History of Oregon Property Taxation 150-303-405-1 (Rev. 6-09) 150-303-405 (Rev. 6-09) To understand the current structure of Oregon s property tax system, it is helpful to view the system in a
Residential Market. Downtown Houston
 Downtown Houston The Houston Market Houston s residential market represents one of the best values in the United States. The city ranks third in the 2010 Forbes list of best housing markets, and second
[03.03] Guidelines for the User Cost Method to calculate rents for owner occupied housing. International Comparison Program
![[03.03] Guidelines for the User Cost Method to calculate rents for owner occupied housing. International Comparison Program](/thumbs/40/21493679.jpg "[03.03] Guidelines for the User Cost Method to calculate rents for owner occupied housing. International Comparison Program") International Comparison Program [03.03] Guidelines for the User Cost Method to calculate rents for owner occupied housing Global Office 3 rd Technical Advisory Group Meeting June 10-11, 2010 Paris, France
International Comparison Program [03.03] Guidelines for the User Cost Method to calculate rents for owner occupied housing Global Office 3 rd Technical Advisory Group Meeting June 10-11, 2010 Paris, France
PISA. Agenzia Regionale per la Protezione ambientale della Toscana (ARPAT)
") PISA City in Tuscany, Pisa is a city of nearly 90,000 inhabitants, that become around 200,000 considering also the residents in the surrounding municipalities. Pisa is known worldwide for its Leaning Tower
PISA City in Tuscany, Pisa is a city of nearly 90,000 inhabitants, that become around 200,000 considering also the residents in the surrounding municipalities. Pisa is known worldwide for its Leaning Tower
Beef Demand: What is Driving the Market?
 Beef Demand: What is Driving the Market? Ronald W. Ward Food and Economics Department University of Florida Demand is a term we here everyday. We know it is important but at the same time hard to explain.
Evergreen Line Rapid Transit Project Business Case Executive Summary. February 2008. Reviewed by
 Evergreen Line Rapid Transit Project Business Case Executive Summary February 2008 Reviewed by Recommendation and Executive Summary The business case for the Evergreen Line Rapid Transit Project (the Project)
STRATEGIES FOR PROVIDING A HOME FOR THE LOW INCOME SEGMENT
 STRATEGIES FOR PROVIDING A HOME FOR THE LOW INCOME SEGMENT Resource Speaker: MR. EDUARDO T. MANICIO Executive Vice President Social Housing Finance Corporation WHO ARE THE LOW-INCOME GROUPS Usually identified
UNIFE World Rail Market Study
 UNIFE World Rail Market Study Status quo and outlook 2020 Commissioned by UNIFE, the European Rail Industry And conducted by The Boston Consulting Group 2 1 Executive Summary This is the third "World Rail
Poverty among ethnic groups
 Poverty among ethnic groups how and why does it differ? Peter Kenway and Guy Palmer, New Policy Institute www.jrf.org.uk Contents Introduction and summary 3 1 Poverty rates by ethnic group 9 1 In low income
GTA Cordon Count Program
 Transportation Trends 2001-2011 Executive Summary Project No. TR12 0722 September 2013 1.0 Introduction The Cordon Count program was established to collect traffic data as a tool for measuring travel trends
NEXTix UNIFIED CITY-WIDE TELECOMMUNICATIONS
 NEXTix UNIFIED CITY-WIDE TELECOMMUNICATIONS Unlocking the infinite possibilities of communications SUMMARY The city of Taguig, known for its openness to technological innovations, has recently implemented
THE IMPLICATIONS OF ALTERNATIVE GROWTH PATTERNS ON INFRASTRUCTURE COSTS
 City of Calgary THE IMPLICATIONS OF ALTERNATIVE GROWTH PATTERNS ON INFRASTRUCTURE COSTS REPORT APRIL 2, 2009 IBI GROUP REPORT City of Calgary EXECUTIVE SUMMARY Purpose of Report Calgary has seen record
PUBLIC TRANSPORT NETWORK DESIGN AND APPRAISAL A CASE STUDY OF PORTO
 Advanced OR and AI Methods in Transportation PUBLIC TRANSPORT NETWORK DESIGN AND APPRAISAL A CASE STUDY OF PORTO Álvaro COSTA 1, Pedro ABRANTES, Oana GROZAVU, Sílvia MAGALHÃES Abstract. The city of Porto
Multifamily Housing: Sustainable Development in Efficient, Walkable Communities
 Multifamily Housing: Sustainable Development in Efficient, Walkable Communities by the Greater Charlotte Apartment Association Multifamily rental housing is a critical piece of the housing market in the
Chapter 3 Review Math 1030
 Section A.1: Three Ways of Using Percentages Using percentages We can use percentages in three different ways: To express a fraction of something. For example, A total of 10, 000 newspaper employees, 2.6%
Transport demands in suburbanized locations
 Agronomy Research 12(2), 351 358, 2014 Transport demands in suburbanized locations M. Lukeš *, M. Kotek and M. Růžička Faculty of Engineering, Czech University of Life Sciences Prague, 165 21 Prague 6
GIS Analysis of Population and Employment Centers in Metro Denver Served by RTD s FasTracks
 APA Transportation Planning Division 2011 Student Paper Competition GIS Analysis of Population and Employment Centers in Metro Denver Served by RTD s FasTracks Patrick Picard 2208 E. 17 th Ave., Apt. #4
Ex-Ante Evaluation (for Japanese ODA Loan)
") Japanese ODA Loan Ex-Ante Evaluation (for Japanese ODA Loan) 1. Name of the Project Country: The Democratic Socialist Republic of Sri Lanka Project: New Bridge Construction Project over the Kelani River
Japanese ODA Loan Ex-Ante Evaluation (for Japanese ODA Loan) 1. Name of the Project Country: The Democratic Socialist Republic of Sri Lanka Project: New Bridge Construction Project over the Kelani River
From : Başpınar & Partners Law Firm. Date : 27.06.2014. Subject : Communiqué on Spatial Planning Preparation I. INTRODUCTION
 From : Başpınar & Partners Law Firm Date : 27.06.2014 Subject : Communiqué on Spatial Planning Preparation I. INTRODUCTION Communiqué on Spatial Planning Preparation ( Communiqué ) which is prepared by
11. Monitoring. 11.1 Performance monitoring in LTP2
 178 11. Monitoring 11.1 Performance monitoring in LTP2 Performance against the suite of indicators adopted for LTP2 is shown in the following table. This shows progress between 2005/06 and 2009/10 (the
Slums and informal settlements An evidence-based approach to sustainable upgrading and development
 Slums and informal settlements An evidence-based approach to sustainable upgrading and development 1 billion people currently live in slums, this is set to double over the next 30 years. Slums are a physical
Downtown Schools & Real Estate Development Professor Gerard Mildner
 Downtown Schools & Real Estate Development Professor Gerard Mildner In recent months, the Center for Real Estate has been looking at the connection between the development of schools in downtowns and regional
Econ 137 Urban Economics Lecture Notes III
 Econ 137 Urban Economics Lecture Notes III Guillermo Ordonez, UCLA Questions for Lecture Notes III Is there a land use pattern? What is it like? What determines the price of land? What determines the pattern
GCE. Geography. Mark Scheme for January 2011. Advanced Subsidiary GCE Unit F762: Managing Change in Human Environments
 GCE Geography Advanced Subsidiary GCE Unit F762: Managing Change in Human Environments Mark Scheme for January 2011 Oxford Cambridge and RSA Examinations OCR (Oxford Cambridge and RSA) is a leading UK
SAMPLE GRANT PROPOSAL 2 GRANT SEEKER: SUNRIDGE SUPPORT CALOOCAN CITY, PHILIPPINES
 SAMPLE GRANT PROPOSAL 2 GRANT SEEKER: SUNRIDGE SUPPORT CALOOCAN CITY, PHILIPPINES DISCLAIMER: Names and addresses in this grant proposal sample have been changed. Similarities to actual programs, people
PUBLIC DISCLOSURE COMMUNITY REINVESTMENT ACT PERFORMANCE EVALUATION
 PUBLIC DISCLOSURE February 22, 2010 COMMUNITY REINVESTMENT ACT PERFORMANCE EVALUATION Community Bank of Bergen County RSSD No. 275509 18 Railroad Avenue Rochelle Park, New Jersey 07662 FEDERAL RESERVE
A Tides Center Project
 June 29, 2015 A Tides Center Project Delivered via email to Matt.fell@mcagov.org Matt Fell, Transportation Manager Merced County Association of Governments 369 West 18 th Street Merced, CA 95340 RE: Comments
Cooperation assessment São Paulo and the Netherlands
 Cooperation assessment São Paulo and the Netherlands Second Brazilian Dutch Dialogues, São Paulo 28-31 August 2011 COLOFON Author Date State and reference : Andrea van der Kerk / Maarten Hofstra on behalf
Plan Plus Volume 1 No 1 2002 (117-123)
") Plan Plus Volume 1 No 1 2002 (117-123) APPLICATION OF GIS (GEOGRAPHIC INFORMATION SYSTEM) FOR LANDSLIDE HAZARD ZONATION AND MAPPING DISASTER PRONE AREA: A STUDY OF KULEKHANI WATERSHED, NEPAL Purna Chandra
Plan Plus Volume 1 No 1 2002 (117-123) APPLICATION OF GIS (GEOGRAPHIC INFORMATION SYSTEM) FOR LANDSLIDE HAZARD ZONATION AND MAPPING DISASTER PRONE AREA: A STUDY OF KULEKHANI WATERSHED, NEPAL Purna Chandra
Financing For Development by Sir K Dwight Venner, Governor, ECCB (3 August 2001)
") The Caribbean countries now find themselves having to make fundamental adjustments to the structure of their economies and financial systems in response to changes at the global level. The region is not
The Caribbean countries now find themselves having to make fundamental adjustments to the structure of their economies and financial systems in response to changes at the global level. The region is not
Policies and progress on transport access, including access for the rural population and low-income households
 Transport Policies and progress on transport access, including access for the rural population and low-income households The newest long-term strategy of the Ministry of Transport and Communications Finland,
NBER WORKING PAPER SERIES HUMAN CAPITAL, ECONOMIC GROWTH, AND INEQUALITY IN CHINA. James J. Heckman Junjian Yi
 NBER WORKING PAPER SERIES HUMAN CAPITAL, ECONOMIC GROWTH, AND INEQUALITY IN CHINA James J. Heckman Junjian Yi Working Paper 18100 http://www.nber.org/papers/w18100 NATIONAL BUREAU OF ECONOMIC RESEARCH
Income and wealth inequality
 Income and wealth inequality Income and wealth inequality The end of industrialization and Reaganomics Income inequality Wealth inequality Poverty Income and wealth inequality The end of industrialization
Transportation Funding Overview SAMCo. Victor Boyer, Executive Director San Antonio Mobility Coalition (SAMCo) January 10, 2006
 January 10, 2006") Transportation Funding Overview SAMCo Victor Boyer, Executive Director San Antonio Mobility Coalition (SAMCo) January 10, 2006 San Antonio Mobility Coalition, Inc: Non profit, public/private partnership
Transportation Funding Overview SAMCo Victor Boyer, Executive Director San Antonio Mobility Coalition (SAMCo) January 10, 2006 San Antonio Mobility Coalition, Inc: Non profit, public/private partnership
Education in Hampton Roads
 Section X Education in Hampton Roads Figure 10.1 Graduation Rates in Hampton Roads and Virginia... 97 Figure 10.2 Enrolled Students in Hampton Roads... 97 Figure 10.3 Percent of Population Attaining High
The Metro System of Bucharest city. 231.043 Seminar zur Verkehrsplanungmit Exkursion SS 2011 (Vom 9.-13.5.2011) TU Wien Peeraphan Jittrapirom 0928527
 TU Wien Peeraphan Jittrapirom 0928527") The Metro System of Bucharest city 231.043 Seminar zur Verkehrsplanungmit Exkursion SS 2011 (Vom 9.-13.5.2011) TU Wien Peeraphan Jittrapirom 0928527 The Metro System of Bucharest city Current network coverage
The Metro System of Bucharest city 231.043 Seminar zur Verkehrsplanungmit Exkursion SS 2011 (Vom 9.-13.5.2011) TU Wien Peeraphan Jittrapirom 0928527 The Metro System of Bucharest city Current network coverage
Why build the Silvertown Tunnel?
 Why build the Silvertown Tunnel? Over the last 30 years east London has changed with the redevelopment of former industrial areas into major commercial and residential districts. The development of Canary
Who Is Working For Minimum Wage In Ontario? By Sheila Block
 Who Is Working For Minimum Wage In Ontario? By Sheila Block October, 2013 The Wellesley Institute engages in research, policy and community mobilization to advance population health. Copies of this report
TRANSPORTATION. Georgia s Strength in Transportation 4 TRANPORTATION SYSTEMS IN GEORGIA. Highways 2 Airport 3 Railroads 4 Ports 5. Inside this issue:
 TRANSPORTATION SS8G2 highway system, airport, deepwater ports, and railroads 4 TRANPORTATION SYSTEMS IN GEORGIA Georgia s Strength in Transportation Many teachers dig in to the stories of our state s history
Comparing Levels of Development
 2 Comparing Levels of Development Countries are unequally endowed with natural capital. For example, some benefit from fertile agricultural soils, while others have to put a lot of effort into artificial
AN ILLUSTRATION OF COMPARATIVE QUANTITATIVE RESULTS USING ALTERNATIVE ANALYTICAL TECHNIQUES
 CHAPTER 8. AN ILLUSTRATION OF COMPARATIVE QUANTITATIVE RESULTS USING ALTERNATIVE ANALYTICAL TECHNIQUES Based on TCRP B-11 Field Test Results CTA CHICAGO, ILLINOIS RED LINE SERVICE: 8A. CTA Red Line - Computation
INTEGRATION AND REGULATORY STRUCTURES IN PUBLIC TRANSPORT CASE STUDY BRUSSELS CAPITAL REGION
 INTEGRATION AND REGULATORY STRUCTURES IN PUBLIC TRANSPORT CASE STUDY BRUSSELS CAPITAL REGION Brussels, July 2003 1- GENERAL INFORMATION ON THE CASE STUDY A/ General statistics on the case study - Area
Chapter 9: Transportation
 Chapter 9: Transportation What is this chapter about? The goals and policies in this chapter convey the City s intent to: Create a coordinated, efficient, and more affordable multimodal transportation
EXECUTIVE SUMMARY. Asset Management Relationships and Dependencies. Introduction
 EXECUTIVE SUMMARY Introduction The Asset Management Plan demonstrates sound stewardship of the Region s existing assets to support services at desired levels and to ensure the support of the Region s infrastructure
Doing Direct Selling Business in the Philippines
 Doing Direct Selling Business in the Philippines Philippines Overview An archipelago of 7,107 islands, situated in the western Pacific Ocean of Southeast Asia. The current population of the Philippines
Inner London s economy a ward-level analysis of the business and employment base
 Inner London s economy a ward-level analysis of the business and employment base by Dmitry Sivaev, October 2013 Inner London is a key economic hub of the UK. Over 200,000 businesses employing over 2,000,000
Crime Mapping and Analysis Using GIS
 Crime Mapping and Analysis Using GIS C.P. JOHNSON Geomatics Group, C-DAC, Pune University Campus, Pune 411007 johnson@cdac.ernet.in 1. Introduction The traditional and age-old system of intelligence and
Women, Wages and Work A report prepared by the UNC Charlotte Urban Institute for the Women s Summit April 11, 2011
 A report prepared by the UNC Charlotte Urban Institute for the Women s Summit April 11, 2011 A report prepared for the Women s Summit by the UNC Charlotte Urban Institute 1 Table of Contents Table of Contents...
Site Deliverability Statement Alternative Site at: Bridge Road, Old St Mellons
 Site Deliverability Statement Alternative Site at: Bridge Road, Old St Mellons Representor Number 1135 AS(N)4 Persimmon Homes 9 th February 2015 Contents Site Deliverability Statement Alternative Site
Asset Management Plan
 Asset Management Plan Final Report May 2014 EXECUTIVE SUMMARY Adequate municipal infrastructure such as roads, bridges, and underground water and sewage pipes are essential to economic development, citizen
Rural Residential Buildable Lands Inventory
 The Dalles Periodic Review, May 2013 Rural Residential Lands Inventory Contents Introduction and Summary... 1 Concerns related to the 2007 Analysis... 2 Rural Residential Capacity Summary... 2 Methodology...
TITLE A CTS FOR THE NEW ROME EXHIBITION
 CityMobil2 - Socio-economic impact study Reference Group Meeting Lausanne 23 June 2015 TITLE A CTS FOR THE NEW ROME EXHIBITION Carlo Sessa Gabriele Giustiniani, ISIS ITR 30/3/2015 1 Envisioning AUTOMATED
Bonifacio Global City. Ideal Manila.
 Bonifacio Global City. Ideal Manila. by Ursula Faix/ bad architects group Bonifacio, south-east of Manila, a large real estate investment marketed as Bonifacio Global City, is actually a former American