Chapter 8 Congestion Management System
|
|
|
- Posy Tate
- 8 years ago
- Views:
Transcription
1 Chapter 8 The mobility and access provided by the Richmond region s transportation system is a critical component in the quality of life for local residents and visitors. Whether traveling to work, shopping, school, or for social purposes, we all value the ability to reach our destinations in a way that meets our expectations. However, like so many other metropolitan areas across the country, increasing traffic congestion along the region s highways regularly threatens our ability to get to destinations in a timely manner. While the causes of congestion are varied and difficult to fully understand, we all recognize it when we are sitting in traffic. To put a face on congestion, below are some facts generated by the Texas Transportation Institute s 2007 Urban Mobility Study. - The delay per traveler has climbed across the country from 14 hours in 1982 to 38 hours in In 2005, congestion resulted in 4.2 billion hours of delay and wasted 2.9 billion gallons of fuel costing urban areas $78.2 billion Urban Mobility Study The good news is that there are congestion management solutions more roadways and transit, ramp metering, High Occupancy Vehicle (HOV) lanes, incentives to make trips at different times, and better incident management (for example, clearing crashes and vehicle breakdowns more quickly) that can make a difference in addressing the effects of congestion. The dominant mode of transportation in the Richmond area is the highway system. Many transportation modes utilize the region s roadways. For example, roads provide transportation access for buses, carpools, bicycle and pedestrian travel, and freight movement. Although there is a need to reduce vehicle emissions to improve air quality, roadways remain as the primary component in the Plan s recommendations. Included in the LRTP are a variety of improvements planned for the roadways in the Richmond region. Some of these improvements are meant to reduce vehicle-miles of travel and improve traffic operations, which would then improve air quality and reduce energy consumption. This chapter of the LRTP highlights the results of the Richmond Area Metropolitan Planning Organization s (RAMPO s) efforts to understand and manage traffic congestion through the fourth update to the region s, or CMS. A separate CMS technical document contains detailed information about the analyses presented throughout Chapter 8. Chapter 8 8-1

2 Background In an attempt to address the problems caused by congestion, the federal government, through the passage of the 1998 Transportation Equity Act for the 21st Century (TEA-21) and its predecessors, the 1991 Intermodal Surface Transportation Efficiency Act (ISTEA) and the 2005 Safe, Accountable, Flexible, Efficient Transportation Equity Act: A Legacy for Users (SAFETEA-LU) have required that a (CMS) be in place in all Transportation Management Areas, which are metropolitan areas with populations over 200,000. Based on the 2000 Census, the Richmond Urbanized Area population which includes the City of Petersburg is 818,836. The urbanized area within the Richmond Area MPO study area is estimated at 707,270. Federal regulations state the following required elements of a CMS: 1. Methods to monitor and evaluate the multimodal transportation system, identify the causes of congestion, identify and evaluate alternative actions, and evaluate the efficiency and effectiveness of implemented actions; 2. Definition of parameters for measuring the extent of congestion and for supporting the evaluation of the effectiveness of congestion reduction and mobility enhancing strategies; 3. Establishment of a program for data collection and system performance monitoring; 4. Identification and evaluation of the anticipated benefits of both traditional and nontraditional congestion management strategies; 5. Identification of an implementation schedule, implementation responsibilities, and possible funding sources for each strategy; and 6. Implementation of a process for periodic assessment of the efficiency and effectiveness of implemented strategies, in terms of the area s established performance measures. To comply with these regulations, the Richmond Area MPO established a CMS that includes major highways and roads, as well as some minor roadways. The goal of the CMS is to reduce congestion and improve traffic safety through the use of technology, improving roads, and increasing vehicle occupancy. The CMS is an ongoing effort to identify, develop, and implement the most effective transportation strategies to enhance travel in the Richmond region. This report is the fourth in a series of (CMS) studies for the Richmond Area MPO. The goal of the MPO s CMS is to provide an ongoing process that allows for a periodic assessment of the region s transportation network, in addition to identifying where congestion regularly exists along area roadways. The process also identifies appropriate mitigation strategies that focus on improving transportation efficiency, and providing viable alternatives to single occupant vehicles. 8-2 Chapter 8

3 The Richmond Area MPO has been developing and refining a CMS for the region since the mid 1990 s. The first report, published in 1997, and the three subsequent reports published in 1999, 2001, 2003 all have included a comprehensive transportation system analysis, identification of performance measures, and an inventory of existing congestion management strategies. CMS Process The CMS is a vital part of the MPO transportation planning process that results in serious consideration of strategies resulting in the most efficient and effective use of existing and future transportation facilities. Congestion management solutions can come in a variety of forms, such as: building park and ride lots, improving bicycle/pedestrian facilities, carpooling, adding lanes to existing roadways, increasing transit service, and coordinating traffic signals. For a detailed listing of the various strategies available, refer to the CMS Toolbox of Strategies found in the CMS Technical Document. Based on currently available data sources, the CMS is organized to provide an assessment of roadways in the Richmond area. As it is included in the 2031 LRTP, the CMS update is an attempt at a system-wide approach to identify, analyze, and address congestion in our region. The CMS process can be described in terms of four activities that seek to define, identify, mitigate, and monitor both recurring and non-recurring congestion. The four work tasks are summarized below. System Definition and Data Collection Identification of the transportation mode(s) and network(s) for incorporation in the CMS study network. Development of the program for data collection that will include evaluating how often data should be collected, on which modes it should be collected, and defining the CMS network (existing and future congested corridors for all transportation modes being studied in the CMS). Congestion Definition and Identification Develop indicators of congestion that can be quantified through the use of performance measures (for example, travel time and speed for roadway segments) and apply the congestion indicators to the regional network determined in Step 1. The result will be the identification of locations where recurring and non-recurring congestion exist along the CMS network. The resulting list of congested corridors is included in the CMS component of the 2031 LRTP. Strategy Evaluation Compile a toolbox of congestion mitigation strategies and a methodology for applying strategies to the congested corridors, bottlenecks, and other areas identified in Step 2. Chapter 8 8-3

4 System Monitoring and Evaluation of Recommendations Outline data collection and monitoring efforts to identify trends in the overall transportation system and, over time, attempt to gauge the effectiveness of strategies that are implemented along congested corridors. This step results in the development of two products: 1. The development of a state-of-the-transportation system report and; 2. Individual reports, where applicable, that provide analyses of traffic flow both before and after strategies have been implemented along the identified CMS corridors. Relationship to the Transportation Planning Process Starting with the 2026 LRTP, all CMS work tasks have proceeded in conjunction with LRTP work tasks. The two documents, which previously have been developed and printed as separate reports, are physically merged together in the LRTP document. The updated CMS consists of two parts. The component contained in the LRTP provides: A state of the transportation system analysis for the region. This includes a historical analysis of several factors related to transportation system performance and a comparison of Richmond data to both national trends and trends identified for similar regions throughout the U.S. An identification of congested corridors found throughout the region. Recommendations As derived from both the LRTP and the CMS study group, the CMS outputs described above then flow into the region s transportation planning and project development processes. For example, the menu of appropriate strategies developed for a corridor can be utilized during the project development process; specifically, the Development and Evaluation of Alternatives step in the National Environmental Policy Act (NEPA) process or the State Environmental Review Process (SERP). Additionally, information developed by the CMS study group can be used by state and local agencies undertaking detailed corridor studies. In both cases, the CMS study group s recommendations can help streamline the project development process by filtering out strategies for a corridor that are not viable and selecting strategies that will warrant more detailed analysis during the NEPA and SERP processes. Projects resulting from state and local corridor studies and the evaluation of alternatives undertaken during the NEPA or SERP process are eventually considered as recommendations in the LRTP. The LRTP establishes the transportation policy framework for the region and identifies projects for implementation. Projects identified in the long-range plan are eligible to be programmed in the three-year Richmond Area MPO Transportation Improvement Program (TIP) for funding and implementation. 8-4 Chapter 8

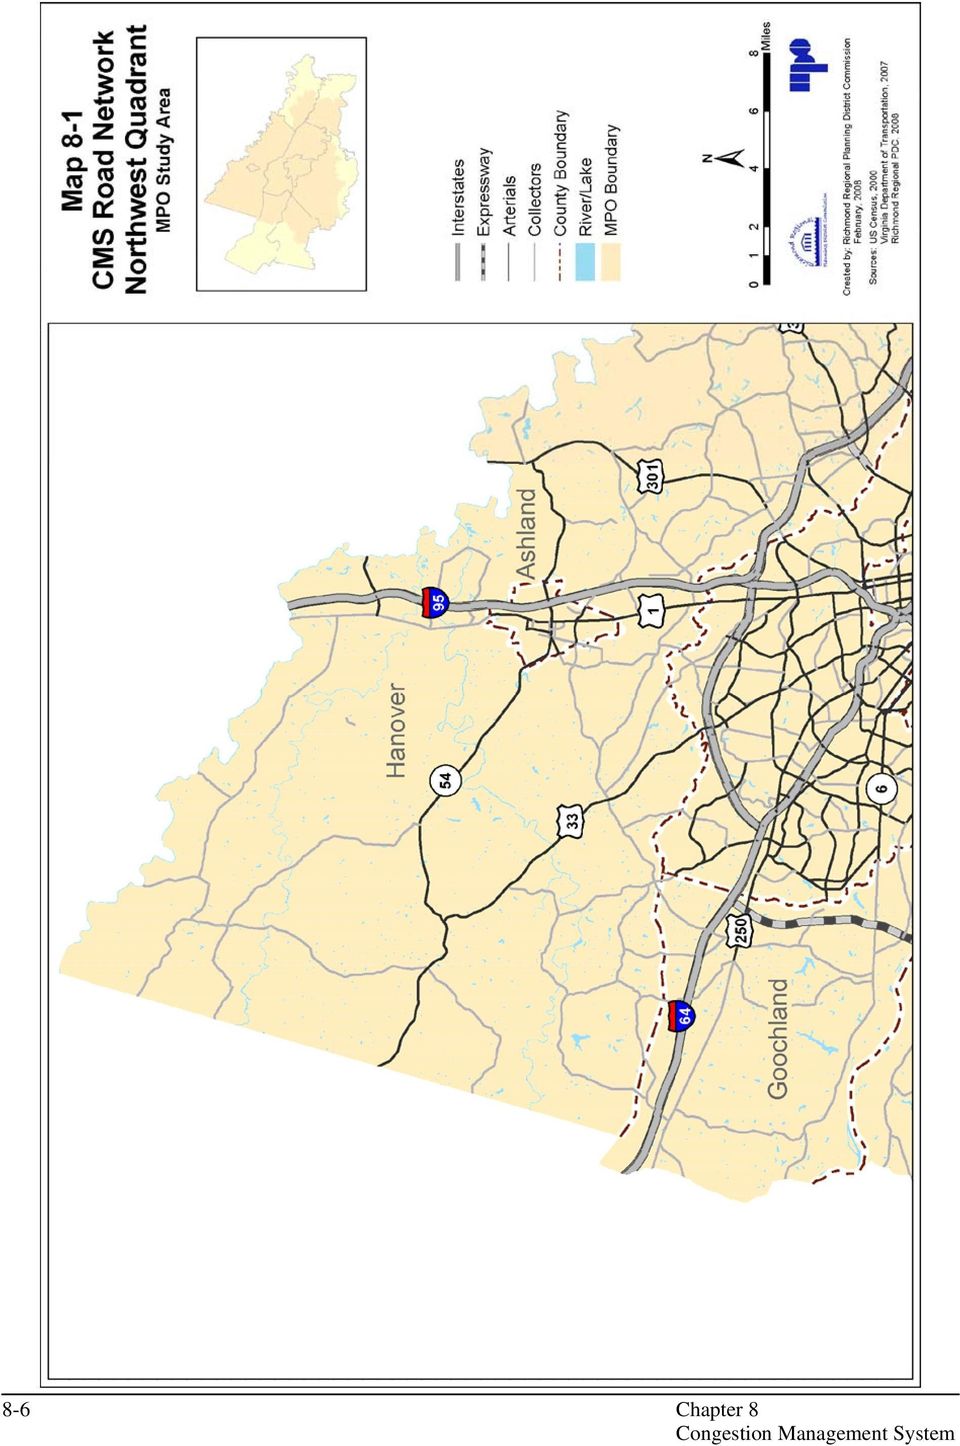
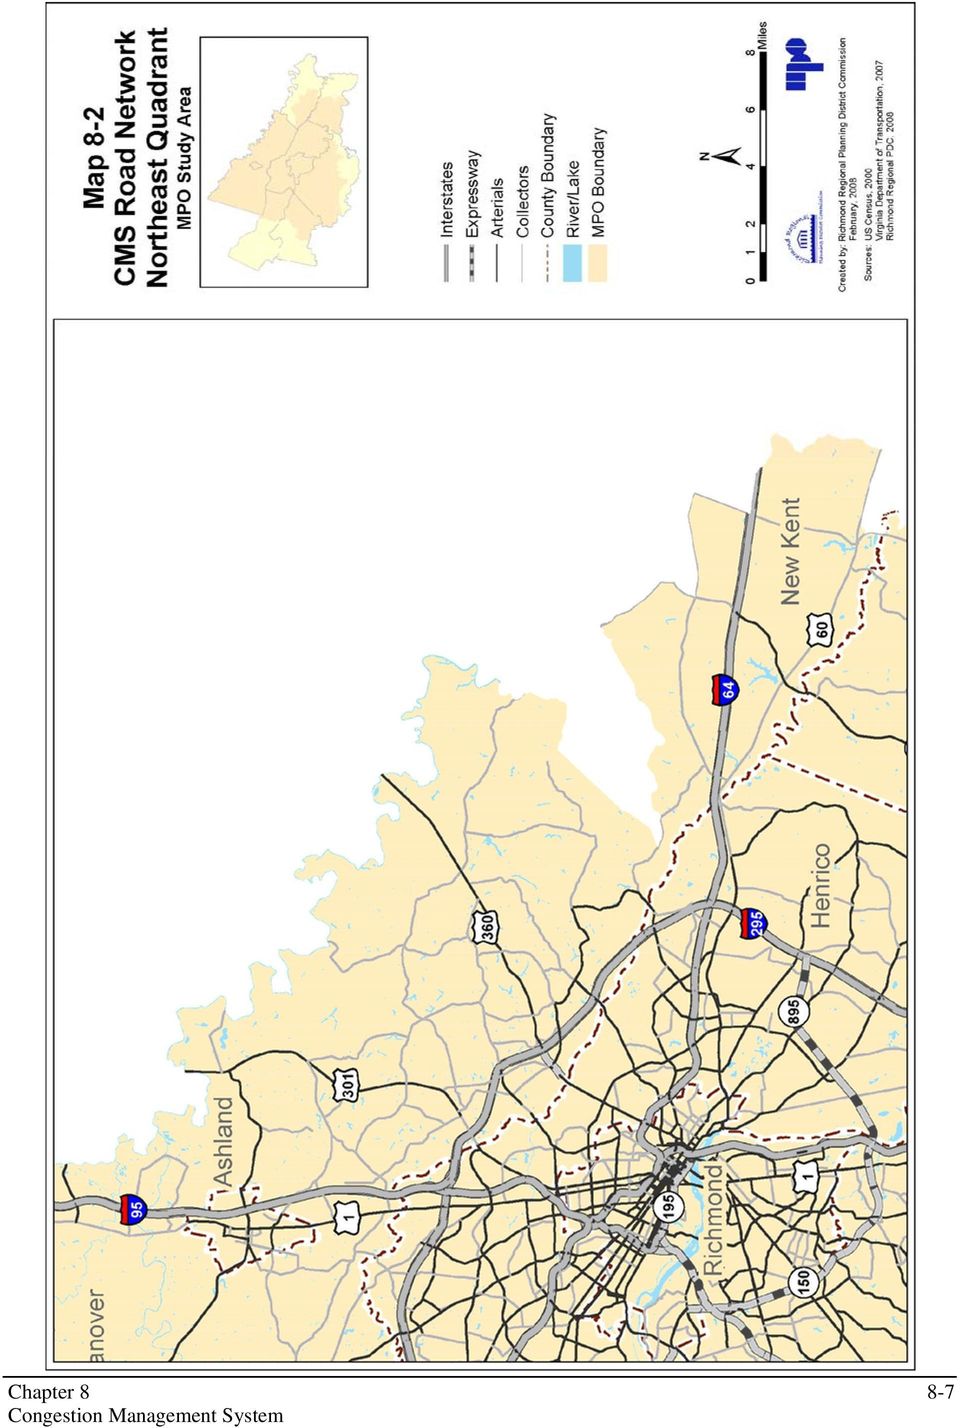
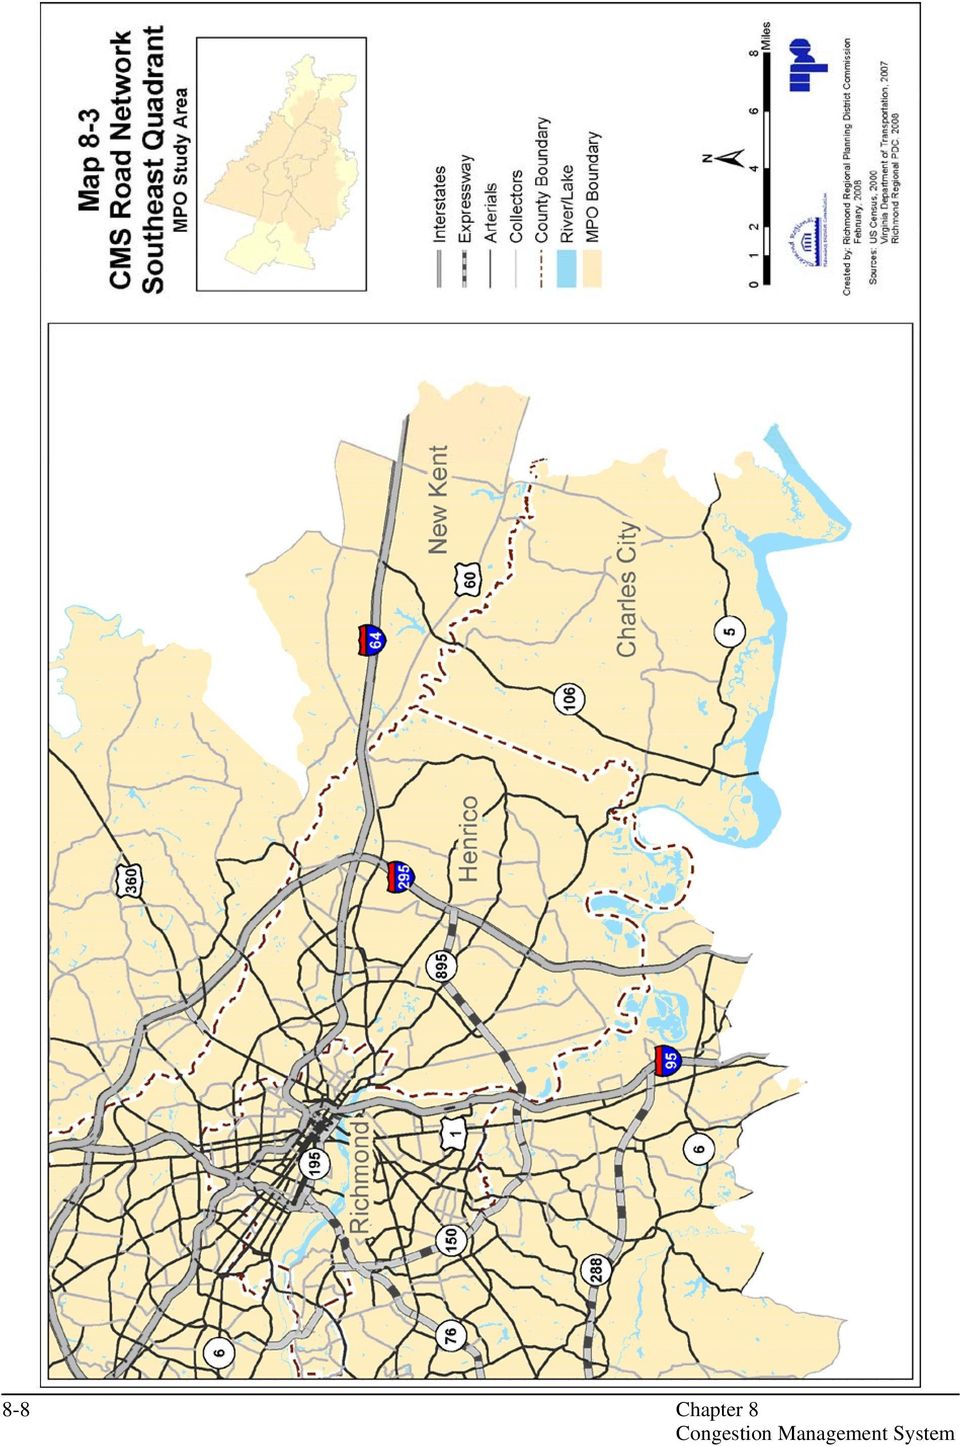
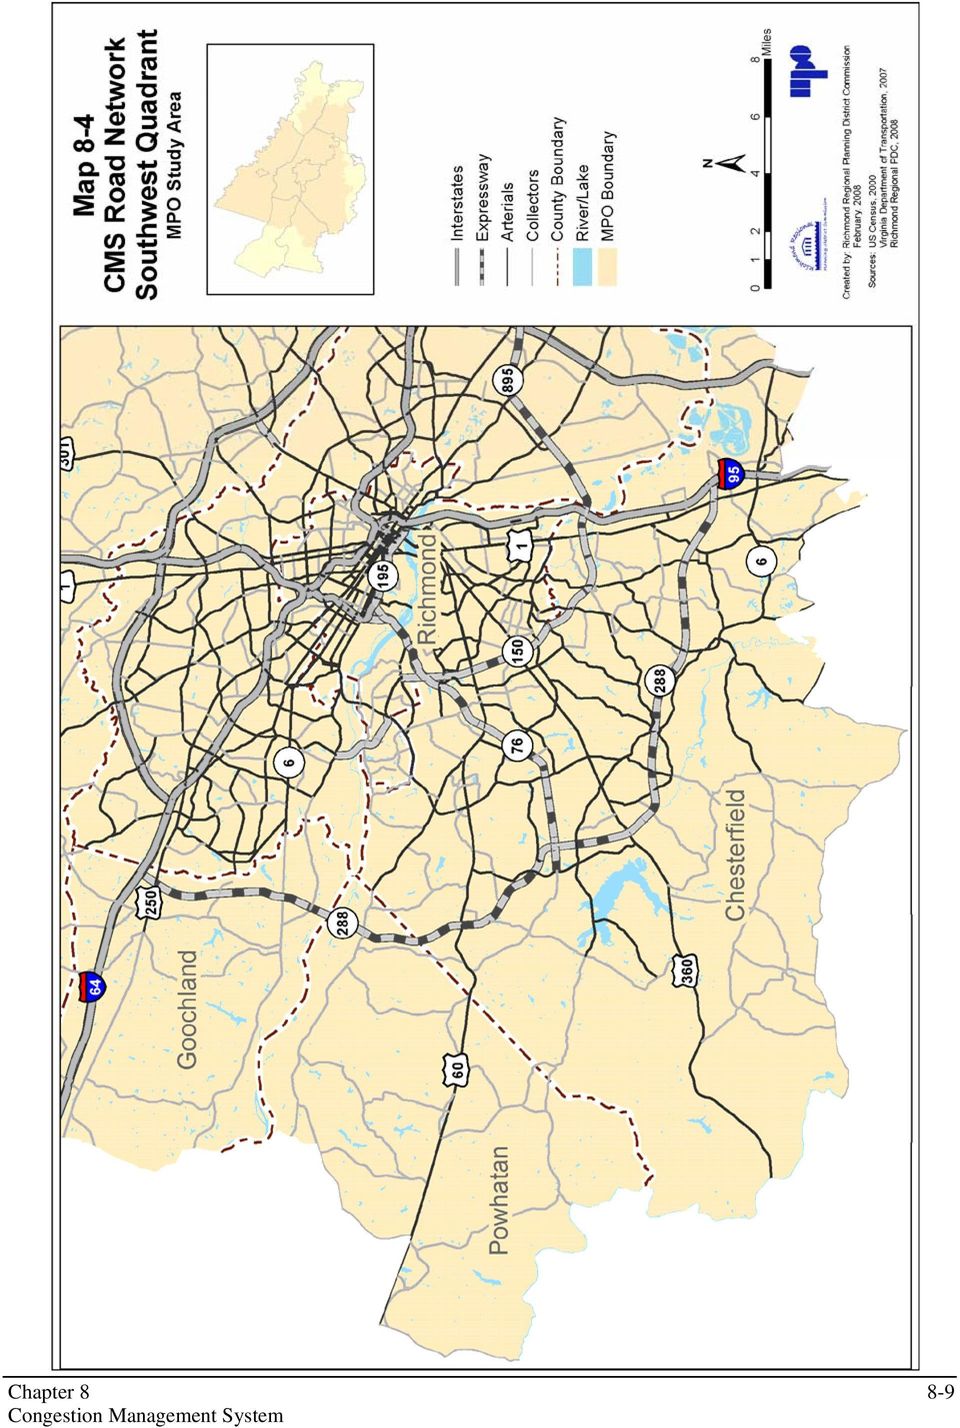
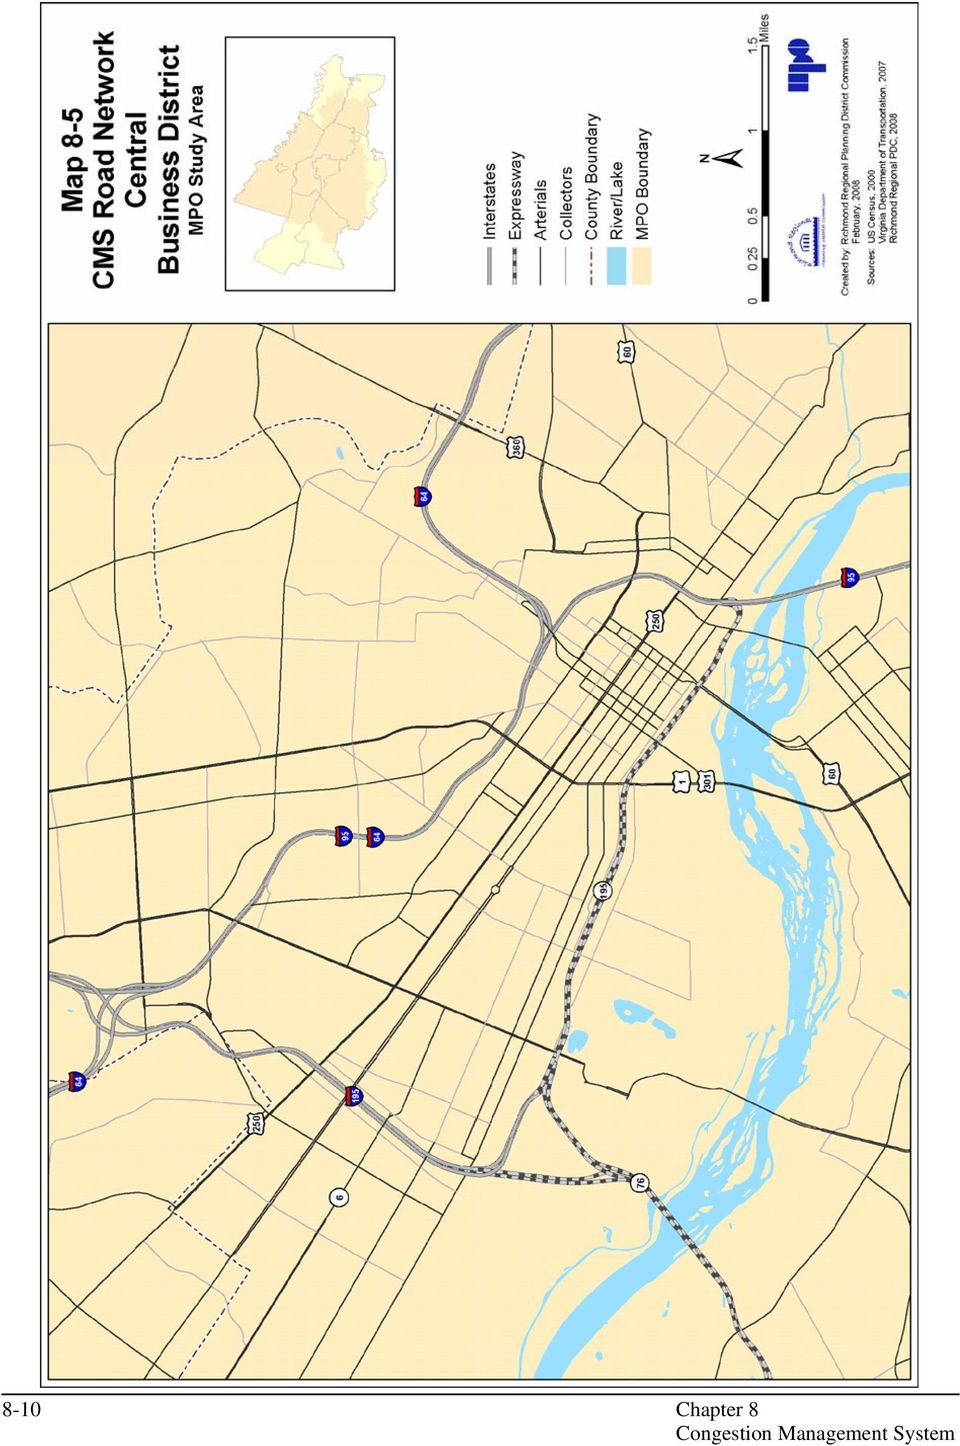
5 CMS Roadway Network The CMS study network of roadways covers major roadways included within the CMS study network. This network consists of approximately 4,070 1 lane-miles of existing roadways. All interstates, expressways and principle arterials within the Richmond MPO study area are included in the network. Map 8-1 through Map 8-5 shows the locations of the roadways included in the CMS/LRTP study area. The five maps break the MPO study area into the following geographic sections: Map 8-1: Northwestern MPO Area Map 8-2: Northeastern MPO Area Map 8-3: Southeastern MPO Area Map 8-4: Southwestern MPO Area Map 8-5: Central Richmond Area State of the Transportation System A comprehensive assessment of factors related to transportation network performance is an essential component of a complete congestion management system. In combination with the other CMS components, it helps to provide decision makers with a better understanding of the many influences that affect the performance of the transportation network. Results can help to prioritize competing strategies to maintain an efficient and safe transportation system. The state of the transportation system analysis for the region includes, for each transportation factor, an analysis over time for the measure and a comparison, where applicable, of Richmond data to both national trends and trends identified for similar regions throughout the U.S. This section of Chapter 8 is divided into three main categories: 1. Historic Transportation Trends 2. Public Transportation Trends 3. Comparing the Richmond Area to Other Urbanized Areas 1 Only includes roads functionally classified as interstates, expressways and principle arterial Chapter 8 8-5

6 8-6 Chapter 8
7 Chapter 8 8-7
8 8-8 Chapter 8
9 Chapter 8 8-9
10 8-10 Chapter 8
11 Historic Transportation Trends The first part of this section looks at historical trends for the following four factors that relate to the performance of the highway network in the Richmond area: Population Vehicle Registrations Vehicle-Miles of Travel (VMT) Vehicle Occupancy For each of these factors, their change over time was analyzed and Richmond area trends were compared to Virginia and national trends. Time periods and geographic extent used in the study were directly related to the availability of data. For population and vehicle registrations, data was collected and analyzed for all of the nine localities found within the Richmond Regional Planning District Commission (RRPDC). The historic trend analysis for both population and vehicle registrations covered the thirteen year period from 1992 to For vehicle-miles of travel, we looked at data for the Richmond urbanized area from Trends in Population and Vehicle Registrations In the Richmond region, growth in vehicle registrations far outpaces the region s population growth. Figure 8-1 indicates that, from 2000 to 2006, the region s average annual growth rate for vehicle registrations (2.9%) is more than double that of the area s average annual growth in population (1.4%). Richmond area s vehicle registration is increasing at a faster rate than that of the state and nation. In 2006, there were 925,988 registered vehicles in the Richmond region, or.98 vehicles for every area resident. By comparison, Virginia had.87 vehicles per person and nationally there were.82 vehicles per person. Figure 8-1 Average Annual Growth Rate in Vehicle Registrations and Population: Average Annual Growth Rate 3.0% 2.5% 2.0% 1.5% 1.0% 0.5% 0.0% Vehicle Registration 2.9% 1.6% 1.6% 1.4% 1.3% 0.6% Population RRPDC Virginia United States Sources: Virginia Dept. of Motor Vehicles, Weldon Cooper Center for Public Service, U.S. Bureau of the Census, FHWA Highway Statistics Reports ( ) Chapter
.")
12 Trends in Vehicle-Miles of Travel Referred to as VMT, vehicle-miles of travel is a measure commonly used to gauge the daily demand residents and visitors place on a region s transportation network. VMT is the sum of the number of miles every vehicle travels on an average weekday in the Richmond region. Average annual daily traffic counts (AADT) and centerline road length are used to calculate VMT. Figure 8-2 shows that VMT in the Richmond region has grown by an average of 9.4 percent annually from 2000 to 2005 and this is outpacing state and national VMT growth trends for the same time period. For the Richmond urbanized area, there was approximately 26.2 million vehicle-miles of travel per day in To put that number into perspective, every day, the total vehicle-miles traveled in the Richmond area is equivalent to driving a vehicle completely across Virginia from the eastern shore to Cumberland Gap approximately 44,407 times. These VMT figures coincide with the increases in population and vehicle registrations discussed earlier. Over time, more people continue to move to the Richmond region in addition to the rapid rise in people registering to use vehicles along the region s roadways this all adds up to increased levels of vehicle-miles traveled. Figure 8-2 Average Annual Growth Rates in Vehicle-Miles of Travel: % Average Annual Growth Rate 8.0% 6.0% 4.0% 2.0% 9.4% 0.2% 2.8% 0.0% Richmond Urbanized Area United States Virginia Source: FHWA Highway Statistics Reports ( ) Using available data from FHWA s 2005 Highway Statistics Report, the Richmond urbanized area s daily VMT per capita in 2005 was compared to other urbanized areas in the south and southeast. Of the cities shown in Figure 8-3, Charlotte came in with the highest amount at 34 vehicle-miles of travel per person and Washington, D.C. and Hampton Roads had the lowest figure of 23 VMT per person. Richmond s 29 vehiclemiles of travel per capita fits roughly in the middle of the field and this figure outpaces both Hampton Roads and Washington, D.C Chapter 8

13 Figure 8-3 Daily VMT per Capita in Southeastern Urban Areas: Charlotte Knoxville Raleigh Jacksonville Nashville Orlando Atlanta Greensboro Richmond - 29 Greenville, SC Tampa-St.Pete-Clearwater Louisville Memphis Baltimore Norfolk-VA Beach-Newport News Washington, D.C. Vehicle Occupancy Trends An assessment of vehicle occupancy rates (VOR) helps to paint a picture of how efficiently a region s roadway network moves people. Vehicle occupancy rates are calculated by counting both passenger vehicles and the number of people at a given location along a roadway. The number of people divided by the number of passenger vehicles is the average vehicle occupancy for that location. Vehicle occupancy data reflects on the roadway network s efficiency since it measures the number of people moving along a highway in comparison to the number of vehicles. A decrease in VOR means that more vehicles are needed to move the same number of people along a roadway. Adding more vehicles to a roadway can stress the road s ability to efficiency move vehicles and people, resulting in traffic congestion. On the other hand, increasing the VOR can result in increasing person movement without necessarily adding more cars to the roadway. Vehicle occupancy data has been collected on various roadway segments throughout the Richmond region in the years 1995, 2000, 2002 and, most recently, in 2006/2007. For the 2006/2007 survey, vehicle occupancy information was collected by the Virginia Department of Transportation (VDOT) at 27 locations throughout the Richmond metropolitan area from October 2007 to March The 2006/2007 Vehicle Occupancy Study found in the CMS Technical Report identifies the locations of the 27 count stations. The methodology for the 2007/2008 survey differs slightly in comparison to the previous surveys. This survey measures vehicle counts only for the peak direction of travel for both AM and PM peak period whereas the previous surveys measured bi-directional vehicle counts. As a result, the total vehicle count for 2007/2008 is lower than that of Chapter

14 Figure 8-4 shows the resulting 2007/2008 VOR for the AM, PM, and combined AM/PM periods. The results follow typical trends in vehicle occupancy data. Specifically, the PM VOR of 1.14 is higher than the AM VOR of The PM time period has a slightly higher VOR, likely due to a greater percentage of discretionary trips such as shopping where drive alone trips are less prominent than during the typical peak morning commute period. Figure /2008 Vehicle Occupancy Rates Time Period Total Autos Total Passengers 2007/2008 VOR AM 197, , PM 159, , Combined AM/PM 356, , Figure 8-5 depicts historical peak period vehicle occupancy rates derived from four VOR surveys conducted by VDOT for the Richmond MPO. An initial VOR survey was conducted in 1995, the next surveys were conducted in 2000 and in 2002, and this report details the results of the 2007/2008 survey. The first two surveys collected data at 17 count locations and the last two surveys collected data at 27 locations. Historical comparison generally shows a decreasing trend in average VOR. However, the most recent survey reveals that even though the vehicle occupancy rate for PM is following the decreasing trend, the AM vehicle occupancy rate has increased to the 2000 level of 1.13 after a drop in The combined AM/PM rate has also increased slightly from (Note: 2007 counts for peak direction of travel only) Figure 8-5: Vehicle Occupancy Rates: Vehicle Occupancy Rate (VOR) PM Combined AM/PM AM * Survey Year 8-14 Chapter 8

15 Figure 8-6 shows a historical comparison between Richmond MPO data (combined AM/PM rates) and USDOT average vehicle occupancy rates for work trips, as derived from the National Household Travel Survey (NHTS). The comparison indicates that declining vehicle occupancy rates are occurring at both the national level and in the Richmond metropolitan area. However, the 2007/2008 vehicle occupancy rate seems to break the declining trend by increasing slightly from This slight increase could be attributed to the 2007 vehicle occupancy counts which were taken for peak direction of travel only. Figure 8-6: Comparison Between Richmond MPO and U.S. Department of Transportation Data Vehicle Occupancy Rate US DOT Richmond MPO Survey Year Public Transportation Trends The second component of the State of the Transportation System report analyzes the following data related to the performance of the Richmond area transit system: GRTC Ridership from 2002 to 2007 RideFinders vanpool and carpool participation from 2002 to 2007 Annual transit passenger miles for the Richmond region, the nation, and southeastern urban areas from 2000 to 2005 Transit passenger miles per capita in southeastern urban areas, 2005 GRTC Ridership Trends Functioning as the principal public transportation provider for the Richmond region, the GRTC Transit System (GRTC) is the focus of the public transportation trends analysis. Concerning performance, GRTC s 2007 Comprehensive Operation Analysis indicates that, in general, GRTC performs better than the 11 peer transit systems used throughout the report for comparison purposes. In the cost effectiveness and revenue generation measures GRTC ranks near the top in most of the rankings such as farebox recovery, cost per passenger, subsidy per trip, revenue per revenue mile and so on. GRTC s Service Span measures show that it provides an average service span on weekdays and Saturdays and above average on Sundays. However, the general transportation efficiency which Chapter

16 measures the average speed of buses ranks GRTC last among its peers. This shows that GRTC buses spend more time in areas of congestion and have more boardings and alightings per stop than those of the peer group. The slow operating speed could be the result of GRTC operating primarily during peak hours when the level of congestion is the highest during the day. Therefore, the good financial efficiency exhibited by GRTC comes at the expense of providing more service during off peak times and reducing headways during peak times. The 2007 COA analysis also indicates excess bus capacity during AM and PM peak times. It indentifies several underperforming routes and excess bus stops on major corridors. Some of the major recommendations of the COA are providing new bus services, better signage and schedules, transfer centers and bus rapid transit along the Broad Street corridor. The graph in Figure 8-7 looks at GRTC ridership trends for the 2002 to 2007 period. The graph indicates that growth for the 2002 to 2007 time period has fluctuated but shown a steady increase, settling on 10,306 total annual trips for Figure 8-7 GRTC Ridership: Total Annual Trips (1000s) Year Carpool and Vanpool Trends Looking at vehicle sharing trends, RideFinders carpool and vanpool participants were combined and growth trends were identified from Under the management of GRTC, RideFinders provides services to foster carpool and vanpool participation throughout the Richmond region. Figure 8-8 shows that, for the six year period, vanpool and carpool participation grew at an average annual rate of approximately 30%, from around 2,234 participants in 2002 to around 7,722 participants in Chapter 8

17 Figure 8-8 Richmond Area Vanpool & Carpool Trends: Participants Year Total Annual Transit Passenger Miles, Annual transit passenger miles represent, at the regional level, the total amount of passenger miles traveled using public transportation. The graph shows average annual growth rates in total passenger miles from 2000 to In 2005, approximately 45 million passenger miles were traveled on all modes of public transit in the Richmond region. For the 5 year period, Richmond s average annual transit usage growth rate of 2.7 percent is higher than that of the nation (0.9%) but is only half as much as that of the southeastern urban areas (5.4%). A detailed listing of the urban areas used in the analysis can be found in the CMS Technical document. Figure 8-9 Average Annual Growth in Transit Passenger Miles: Average Annual Growth Rate Richmond Urbanized Area Southeastern Urban Areas Nation Chapter

18 Transit Passenger Miles per Capita in Southeastern Urban Areas, 2005 Transit passenger miles per capita represent, on average, the number of miles each person travels using public transportation for a given year. The graph in Figure 8-10 depicts a comparison of 2005 transit passenger miles per capita for the Richmond urbanized area and a selected group of large southeastern urban areas. The comparison shows that Washington, D.C. came in with highest figure at 475 transit miles per person, and Knoxville, Tenn. came in with lowest figure at 27 transit miles per person. The Richmond area s 55 transit miles per person places the region in the lower half of the study group. The three largest southeastern metropolitan areas in the analysis: Washington, D.C.; Baltimore, Md.; and Atlanta, Ga. had from four to seven times as many passenger miles per person than the Richmond area. Washington, D.C., Baltimore, Charlotte and Atlanta are the only four urban areas in the comparison group with light rail transit or a subway system in place. The light rail in Charlotte started in November 2007 and therefore, the 2005 transit passenger miles data is pre light rail era. All of the remaining urban areas found in the graph show slight differences in passenger miles per person for Figure 8-10 Transit Passenger Miles Per Capita in Southeastern Urban Areas, Transit Passenger Miles per Capita Washington DC Baltimore Atlanta Charotte Jacksonville Hampton Roads Memphis Durham RICHMOND Tallahassee Roanoke Greensboro Chattanooga Charleston Knoxville Urban Area Source: National Transit Database Comparing the Richmond Area to Other Urban Areas Since 1982, the Texas Transportation Institute at Texas A&M University (TTI) annually publishes a report highlighting information from the university s ongoing Urban Mobility Study. Each annual report provides information on congestion and mobility for 85 metropolitan areas. Richmond is included in the study under the classification of a medium urban area (population between 500,000 and one million). Throughout the report, Richmond s congestion and mobility data were compared to the 29 other medium urban areas shown in Figure Chapter 8

19 Figure Urban Mobility Report Medium Urban Area Information Population Growth 2005 Urban Area Size Population Density Urban Areas 2005 Population Change (%) (sq. miles) (persons/sq. mile) Jacksonville, FL 990, ,320 Nashville-Davidson, TN 990, ,311 Salt Lake City, UT 970, ,425 Raleigh-Durham, NC 950, ,324 Richmond, VA 920, ,926 Louisville, KY-IN 905, ,618 Hartford-Middletown, CT 890, ,483 Bridgeport-Stamford, CT-NY 870, ,900 Charlotte, NC-SC 860, ,976 Austin TX 855, ,485 Oklahoma City, OK 850, ,036 Tulsa, OK 810, ,112 Tucson, AZ 750, ,647 Dayton, OH 745, ,900 Honolulu, HI 705, ,612 Birmingham, AL 690, ,154 El Paso, TX-NM 675, ,054 Rochester, NY 665, ,413 Springfield, MA-CT 660, ,289 Omaha, NE-IA 640, ,832 Sarasota-Bradenton, FL 640, ,310 Allentown-Bethlehem, PA-NJ 620, ,280 Fresno, CA 615, ,851 Akron, OH 615, ,600 Grand Rapids, MI 595, ,337 Oxnard-Ventura, CA 580, ,532 Albuquerque, NM 575, ,825 New Haven, CT 560, ,577 Albany-Schenectady-Troy, NY 530, ,552 Toledo, OH-MI 520, , area average 1,804, ,363 Very large area average 6,023, ,125 2,835 Large area average 1,666, ,205 Medium area average 741, ,680 Small area average 321, ,705 Medium urban areas between 500,000 and 1 million Notes: Very large urban areas - over 3 million population population Large urban areas between 1 million and 3 million population Small urban areas - less than 500,000 population Chapter

20 The primary source of information for the Urban Mobility Study is the Federal Highway Administration s Highway Performance Monitoring System (HPMS) database, with supporting information from various state and local agencies. The Urban Mobility Study only includes data for freeways and principle arterials in each metropolitan area, thus, some statistics may be conservative. For the CMS, three sets of information were selected and analyzed from the 2007 Annual Urban Mobility Report: Travel Time Index Traffic Congestion Cost per Person Annual Hours of Delay per Person Travel Time Index The travel time index is a ratio calculated by TTI to analyze the effect that both recurring and non-recurring (i.e., accidents, construction) delay have on travel times during daily peak travel periods. It measures the amount of additional time needed to make a trip during a typical peak travel period in comparison to traveling at free-flow speeds. The travel time index is computed by dividing the average of all peak period trip times for a region by the average of all free flow (non-peak) travel times for the region. If an average trip in a region took 26 minutes during the peak travel period, but only 20 minutes under free-flow conditions, the travel time index would be 26/20 = This can also be expressed by stating that the delay penalty for driving during the peak period is approximately 6 minutes. As shown in Figure 8-12, the travel time index for the Richmond region was 1.09 in This means that, on average, it would take a Richmond region commuter 9 percent longer to make a trip during peak travel periods than it would for the same trip at times of the day when travel occurs at free-flow speeds. Stated another way, an average 20 minute trip under freeflow conditions would take approximately 22 minutes during peak travel period conditions. The graph in Figure 2 also shows that the travel time index for the Richmond region has grown steadily over time by 4.8 percent from a low of 1.04 in 1982 to the currently reported 1.09 in Chapter 8
 delay have on travel times during daily peak travel periods.")
FINAL REPORT DEVELOPMENT OF CONGESTION PERFORMANCE MEASURES USING ITS INFORMATION. Sarah B. Medley Graduate Research Assistant
 FINAL REPORT DEVELOPMENT OF CONGESTION PERFORMANCE MEASURES USING ITS INFORMATION Sarah B. Medley Graduate Research Assistant Michael J. Demetsky, Ph.D., P.E. Faculty Research Scientist and Professor of
7.0 Transportation Management
 7.0 Transportation Management I. Introduction The Kansas City region has invested considerable effort and resources in the design and implementation of its regional multimodal transportation system. As
Where Do We Want to Go? How Can We Get There?
 Where Do We Want to Go? How Can We Get There? The BRTB has adopted nine goals, with supporting strategies, performance measures, and performance targets. Together, these goals, strategies, measures, and
ORANGE COUNTY TRANSPORTATION AUTHORITY. Final Long-Range Transportation Plan - Destination 2035. Attachment A
 ORANGE COUNTY TRANSPORTATION AUTHORITY Final Long-Range Transportation Plan - Destination 2035 Attachment A DESTINATION 2035 DESTINATION 2035 EXECUTIVE SUMMARY ATTACHMENT A Moving Toward a Greener Tomorrow
Ne w J e r s e y Tr a f f i c Co n g e s t i o n :
 Ne w J e r s e y Tr a f f i c Co n g e s t i o n : A Growing Crisis January 2008 Cover photo : Route 3, Passaic County introduction A rising tide of traffic congestion threatens to increase roadway gridlock,
Technical Memorandum PERFORMANCE MEASURES. Prepared by:
 Technical Memorandum PERFORMANCE MEASURES Prepared by: March 2014 TABLE OF CONTENTS Executive Summary... 1 1. Introduction... 2 1.1 Performance Measures and the Public Sector... 2 1.2 National Focus: MAP
12MAP-21, a funding and authorization bill to govern U.S. federal surface MONITORING IMPLEMENTATION AND PERFORMANCE
 MONITORING IMPLEMENTATION AND PERFORMANCE 12MAP-21, a funding and authorization bill to govern U.S. federal surface transportation spending, creates a data-driven, performance-based multimodal program
The Economic Cost of Traffic Congestion in Florida. Final Document Contract FDOT BDK75 977-19 (UF # 00072256)
") August 2010 The Economic Cost of Traffic Congestion in Florida Final Document Contract FDOT BDK75 977-19 (UF # 00072256) Prepared for: Florida Department of Transportation Project Manager J. Darryll Dockstader
August 2010 The Economic Cost of Traffic Congestion in Florida Final Document Contract FDOT BDK75 977-19 (UF # 00072256) Prepared for: Florida Department of Transportation Project Manager J. Darryll Dockstader
INDOT 2000-2025 Long Range Plan
 Chapter 9 INDOT 2000-2025 Long Range Plan Highway Needs Analysis Overview The statewide transportation planning process provides for the identification of highway needs through a comprehensive process
SURFACE TRANSPORTATION PROGRAM (STP) PROCEDURES FOR THE OKLAHOMA CITY URBANIZED AREA FUNDS
 PROCEDURES FOR THE OKLAHOMA CITY URBANIZED AREA FUNDS") SURFACE TRANSPORTATION PROGRAM (STP) PROCEDURES FOR THE OKLAHOMA CITY URBANIZED AREA FUNDS October 2015 Background The Surface Transportation Program (STP) was originally established as Section 133 of
SURFACE TRANSPORTATION PROGRAM (STP) PROCEDURES FOR THE OKLAHOMA CITY URBANIZED AREA FUNDS October 2015 Background The Surface Transportation Program (STP) was originally established as Section 133 of
A Bicycle Accident Study Using GIS Mapping and Analysis
 A Bicycle Accident Study Using GIS Mapping and Analysis Petra Staats, Graduate Assistant, Transportation Policy Institute, Rutgers University, New Brunswick, NJ, USA pstaats@eden.rutgers.edu Summary Surveys
7.0 TRANSPORTATION MANAGEMENT
 7.0 TRANSPORTATION MANAGEMENT The Kansas City region has invested considerable effort and resources in the design and implementation of its regional multimodal transportation system. As a result of this
Transportation Policy and Design Strategies. Freight Intensive. Level of Freight Presence
 Appendix G Transportation Policy and Design Strategies CONTEXT SENSITIVE SOLUTIONS To address the need to describe freight systems which account for the population distress which may result, an analysis
Virginia's Transportation Performance Management System
 Virginia's Transportation Performance Management System Office of Intermodal Planning and Investment Commonwealth Transportation Board Presented by: David Tyeryar, Deputy Secretary of Transportation September
GAO INTELLIGENT TRANSPORTATION SYSTEMS. Improved DOT Collaboration and Communication Could Enhance the Use of Technology to Manage Congestion
 GAO United States Government Accountability Office Report to the Committee on Science, Space, and Technology, House of Representatives March 2012 INTELLIGENT TRANSPORTATION SYSTEMS Improved DOT Collaboration
Examples of Transportation Plan Goals, Objectives and Performance Measures
 Examples of Transportation Plan Goals, Objectives and Performance Measures The next step in the Long Range Transportation Plan (LRTP) process is to develop goals, objectives, and performance measures.
CHAPTER 8: INTELLIGENT TRANSPORTATION STSTEMS (ITS)
") CHAPTER 8: INTELLIGENT TRANSPORTATION STSTEMS (ITS) Intelligent Transportation Systems (ITS) enables people and goods to move more safely and efficiently through a state-of-the-art multi-modal transportation
CHAPTER 8: INTELLIGENT TRANSPORTATION STSTEMS (ITS) Intelligent Transportation Systems (ITS) enables people and goods to move more safely and efficiently through a state-of-the-art multi-modal transportation
Congestion Management Systems: A Federal Perspective. 7 Key CMS Components
 Congestion Management Systems: A Federal Perspective Brian Betlyon FHWA Resource Center brian.betlyon@fhwa.dot.gov 7 Key CMS Components 1. Area of Application 2. System Definition (modes & network) 4.
Technical Report 4: Congestion Management Process Final Plan for Adoption October 2015
 Long Range Transportation Plan Technical Report : Congestion Management Process Final Plan for Adoption October East Robinson Street, Suite, Orlando, FL -- www.metroplanorlando.com MetroPlan Orlando @metroplan_orl
5 Performance Measures
 5 Performance Measures This page left blank intentionally. 5 2 Moving Forward Monterey Bay 2035 Introduction The investments identified in the 2035 MTP/SCS are expected to result in significant benefits
ITS Investment Strategy 10-Year Program, FY07-16
 New Jersey Department of Transportation ITS Investment Strategy 10-Year Program, FY07-16 Statewide Traffic Operations ITS Engineering March, 2007 Intelligent Transportation Systems Investment Strategy
A Framework for Monitoring the Performance of Travel Demand Management and Vehicle Miles Traveled (VMT) Reduction Activities
 Reduction Activities") A Framework for Monitoring the Performance of Travel Demand Management and Vehicle Miles Traveled (VMT) Reduction Activities WA-RD 806.1 Mark E. Hallenbeck June 2013 Orion Stewart Anne Vernez Moudon Office
A Framework for Monitoring the Performance of Travel Demand Management and Vehicle Miles Traveled (VMT) Reduction Activities WA-RD 806.1 Mark E. Hallenbeck June 2013 Orion Stewart Anne Vernez Moudon Office
Integrating the I-95 Vehicle Probe Project Data and Analysis Tools into the FAMPO Planning Program
 Integrating the I-95 Vehicle Probe Project Data and Analysis Tools into the FAMPO Planning Program I-95 Corridor Coalition Background The I-95 Corridor Coalition is an alliance of transportation agencies,
1 FIXED ROUTE OVERVIEW
 1 FIXED ROUTE OVERVIEW Thirty transit agencies in Ohio operate fixed route or deviated fixed route service, representing a little less than half of the 62 transit agencies in Ohio. While many transit agencies
HERS_IN. HIGHWAY ECONOMIC REQUIREMENTS SYSTEM (for) INDIANA. AASHTO Transportation Estimator Association Conference October 16, 2001
 INDIANA. AASHTO Transportation Estimator Association Conference October 16, 2001") AASHTO Transportation Estimator Association Conference October 16, 2001 HERS_IN HIGHWAY ECONOMIC REQUIREMENTS SYSTEM (for) INDIANA OVERVIEW HERS Background System Planning Tool Development HERS_IN Structure
AASHTO Transportation Estimator Association Conference October 16, 2001 HERS_IN HIGHWAY ECONOMIC REQUIREMENTS SYSTEM (for) INDIANA OVERVIEW HERS Background System Planning Tool Development HERS_IN Structure
Who is implementing managed lanes with pricing strategies? Operational Under Construction/ Development
 Who is implementing managed lanes with pricing strategies? Operational Under Construction/ Development Managed Lane Facilities in the U.S. Operational Under Construction Under Development I-10 (Katy Freeway),
BICYCLE TRENDS IN CAMBRIDGE
 BICYCLE TRENDS IN CAMBRIDGE Cambridge promotes bicycling as a healthy, environmentally friendly way of getting around as an important part of the City's efforts to improve mobility and protect our environment.
How much are teachers really paid? A Nationwide Analysis of Teacher Pay
 How much are teachers really paid? A Nationwide Analysis of Teacher Pay September 2014 How much are teachers really paid? A Nationwide Analysis of Teacher Pay by: Pamela Villarreal Senior Fellow at the
Texas Freight Advisory Committee A PRIMER ON PUBLIC SECTOR FREIGHT PERFORMANCE MEASURES
 Texas Freight Advisory Committee A PRIMER ON PUBLIC SECTOR FREIGHT PERFORMANCE MEASURES October 1, 2013 A PRIMER ON PUBLIC SECTOR FREIGHT PERFORMANCE MEASURES How Do Performance Measures Assist the Public
ANGELOUECONOMICS 2012 INDUSTRY HOTSPOTS
 ANGELOUECONOMICS 2012 INDUSTRY HOTSPOTS INDUSTRY SPECIALIZATION OF AMERICA'S 100 LARGEST METROPOLITAN AREAS INDUSTRY CLUSTERS 19-24 (of 36) ABOUT THE RANKINGS In the 21 st Century, the engines that drive
Alternatives to the Circ Project Prioritization Methodology Prepared for Circ Task Force July 28, 2011
 Alternatives to the Circ Project Prioritization Methodology Prepared for Circ Task Force July 28, 2011 CCRPC staff has developed a draft methodology described below and detailed in the attached pages for
Nearly 38,000 vehicles cross the Shinnecock Canal on Sunrise Highway (NYS Route 27) daily, during peak summer months.
 daily, during peak summer months.") 2. Traffic Characteristics Traffic volumes have increased in concert with population growth in the Towns of Southampton and East Hampton. The New York State Department of Transportation (NYSDOT) maintains
2. Traffic Characteristics Traffic volumes have increased in concert with population growth in the Towns of Southampton and East Hampton. The New York State Department of Transportation (NYSDOT) maintains
By Anthony Downs Senior Fellow The Brookings Institution. March 19, 2002
 Testimony On Peak-Hour Traffic Congestion Testimony before the Committee on the Environment and Public Works U.S. Senate By Anthony Downs Senior Fellow The Brookings Institution March 19, 2002 My name
A Presentation by the Project Managers: Rick Canizales Prince William County. Jana Lynott, AICP Northern Virginia Transportation Commission
 A Presentation by the Project Managers: Rick Canizales Prince William County & Jana Lynott, AICP Northern Virginia Transportation Commission for the: Public Open House and Hearing December 6, 2005 George
Needs Analysis. Long Beach Bicycle Master Plan. Bicycle Commuter Needs. LONG BEACH BICYCLE MASTER PLAN Needs Analysis
 Long Beach Bicycle Master Plan Needs Analysis The purpose of reviewing the needs of commuter and recreational bicyclists is twofold: (1) it is instrumental when planning a system which must serve both
The Need for Traffic Incident Management
 The Need for Traffic Incident Management With traffic incidents responsible for approximately 50-60% of the congestion delays motorists encounter on the nation s roadways every day, increased roadway capacity
A Case for Real-Time Monitoring of Vehicular Operations at Signalized Intersections
 White Paper A Case for Real-Time Monitoring of Vehicular Operations at Signalized Intersections 10 1 0 1 0 TRAFINFO.COM TrafInfo Communications, Inc. 556 Lowell Street Lexington, MA 02420 www.trafinfo.com
CHAPTER 4 SURFACE TRANSPORTATION PROGRAM (STP)
") Local Assistance Program Guidelines Chapter 4 CHAPTER 4 SURFACE TRANSPORTATION PROGRAM (STP) CONTENTS Section Subject Page Number 4.1 INTRODUCTION... 4-1 4.2 ELIGIBILITY CRITERIA... 4-1 General... 4-1
Local Assistance Program Guidelines Chapter 4 CHAPTER 4 SURFACE TRANSPORTATION PROGRAM (STP) CONTENTS Section Subject Page Number 4.1 INTRODUCTION... 4-1 4.2 ELIGIBILITY CRITERIA... 4-1 General... 4-1
Overview of the Travel Demand Forecasting Methodology
 Overview of the Travel Demand Forecasting Methodology Prepared by the Central Transportation Planning Staff (CTPS) Authors: Scott A. Peterson, Manager Ian Harrington, Chief Planner March 29, 2008 1 OVERVIEW
PENNSYLVANIA TRANSPORTATION BY THE NUMBERS:
 PENNSYLVANIA TRANSPORTATION BY THE NUMBERS: Meeting the State s Need for Safe and Efficient Mobility MAY 2013 202-466-6706 www.tripnet.org Founded in 1971, TRIP of Washington, DC, is a nonprofit organization
Traffic Information in NYC
 Traffic Information in NYC What We Know, What We Need to Know Prepared for Transportation Alternatives January 23, 2007 Schaller Consulting 94 Windsor Place, Brooklyn, NY (718) 768-3487 schaller@schallerconsult.com
AUGUST 2015 URBAN MOBILITY. Scorecard
 AUGUST 2015 2015 URBAN MOBILITY Scorecard 2015 URBAN MOBILITY SCORECARD Published jointly by The Texas A&M Transportation Institute and INRIX David Schrank Research Scientist Bill Eisele Senior Research
CAPACITY AND LEVEL-OF-SERVICE CONCEPTS
 CHAPTER 2 CAPACITY AND LEVEL-OF-SERVICE CONCEPTS CONTENTS I. INTRODUCTION...2-1 II. CAPACITY...2-2 III. DEMAND...2-2 IV. QUALITY AND LEVELS OF SERVICE...2-2 Service Flow Rates...2-3 Performance Measures...2-3
PRIORITIZATION PROCESSES
 PROJECT SELECTION & PRIORITIZATION PROCESSES STIP Workshop Presented by: Bill Lawrence April 2011 Purpose and Review Overview of Project Selection Process Review Various Prioritization Processes Tk Take
South Carolina Multimodal Transportation Plan Vision, Goals, Objectives, and Performance Measures
 South Carolina Multimodal Transportation Plan Vision, Goals, Objectives, and Performance Measures Prepared for: Prepared by: June 2013 TABLE OF CONTENTS 1. Introduction... 1 1.1 Baseline Understanding...
CHAPTER 4 EXISTING TRANSPORTATION MANAGEMENT
 CHAPTER 4 EXISTING TRANSPORTATION MANAGEMENT TRANSPORTATION MANAGEMENT SYSTEMS Prior to 1991, the Missouri Department of Transportation (MoDOT) had begun development of several independent management systems.
2010 Utility Bill Comparisons for Selected U.S. Cities
 Memphis Light, Gas and Water 2010 Utility Bill Comparisons for Selected U.S. Cities Electricity Natural Gas Water Wastewater The information in this book has been compiled to ensure maximum accuracy at
9988 REDWOOD AVENUE PROJECT TRAFFIC IMPACT ANALYSIS. April 24, 2015
 9988 REDWOOD AVENUE PROJECT TRAFFIC IMPACT ANALYSIS April 24, 2015 Kunzman Associates, Inc. 9988 REDWOOD AVENUE PROJECT TRAFFIC IMPACT ANALYSIS April 24, 2015 Prepared by: Bryan Crawford Carl Ballard,
The financial plan was prepared in conjunction with the Technical Working Group. Refer to Table 3-1: Funding and Implementation Plan.
 3 Financial Plan The purpose of the financial plan is to identify funding options that would be likely sources of money to advance recommendations made by this study. The Capitol Region Transportation
Performance Measures for RIDOT s Traffic Management Center
 Performance Measures for RIDOT s Traffic Management Center Catherine Burns, EIT Transportation Engineer Sudhir Murthy, PE, PTOE President 5/2011 Presentation Outline RIDOT Performance Measures Public Outreach
School-related traffic congestion is a problem in
 SCHOOL TRANSPORTATION Automated Vehicle Location for School Buses Can the Benefits Influence Choice of Mode for School Trips? TORI D. RHOULAC The author is Assistant Professor, Department of Civil Engineering,
TH 23 Access Management Study Richmond to Paynesville
 TH 23 Access Management Study Richmond to Paynesville Prepared For: Minnesota Department of Transportation District 8 Prepared By: Short Elliott Hendrickson Inc. July 2015 Table of Contents I. Introduction...
Moving Ahead for Progress in the 21st Century. 2014 Performance Report
 MAP 21 Moving Ahead for Progress in the 21st Century 2014 Performance Report A report to Florida s Congressional Delegation March 2014 Overview: Because life is precious, FDOT has set the highway safety
Executive Summary. Literature/Community Review. Traffic Flows and Projections. Final Report Truck Route System for Miami-Dade County CORRADINO
 Executive Summary The Miami-Dade County Metropolitan Planning Organization (MPO) has prepared a Truck Route System Plan for Miami-Dade County. The MPO and its consultants have worked closely with the MPO
Questions and Answers about the Orange Bus/Rail Investment Plan
 Why are transit improvements needed? Questions and Answers about the Orange Bus/Rail Investment Plan The Triangle Region is now home to 1.5 million people. The U.S. Census and the 2035 Joint Long Range
Multi Modal Roadway Transportation Impact Fees and Asset Value
 January 2010 SB 360 Article Series: Factors to be Considered in Transitioning from a Road Impact Fee to a Mobility Fee Contributing Authors: Steven A. Tindale, P.E., AICP Robert P. Wallace, P.E., AICP
TRAVEL TIME BASED OKLAHOMA CONGESTION ANALYSIS: Pilot Study
 Technical Memorandum TRAVEL TIME BASED OKLAHOMA CONGESTION ANALYSIS: Pilot Study Prepared for: Oklahoma Department of Transportation Prepared by: November 2014 Technical Memorandum The Technical Memos
AIR QUALITY TECHNICAL MEMORANDUM
 AIR QUALITY TECHNICAL MEMORANDUM AIR QUALITY TECHNICAL MEMORANDUM GOLDEN GLADES INTERCHANGE PD&E STUDY Miami-Dade County, Florida Financial Management Number: 428358-1-22-01 Efficient Transportation Decision
NEVADA TRANSPORTATION BY THE NUMBERS:
 NEVADA TRANSPORTATION BY THE NUMBERS: Meeting the State s Need for Safe and Efficient Mobility APRIL 2013 202-466-6706 www.tripnet.org Founded in 1971, TRIP of Washington, DC, is a nonprofit organization
The New Mobility: Using Big Data to Get Around Simply and Sustainably
 The New Mobility: Using Big Data to Get Around Simply and Sustainably The New Mobility: Using Big Data to Get Around Simply and Sustainably Without the movement of people and goods from point to point,
Transportation Management Plan Template
 DATE: TO: FROM: SUBJECT: Date Name Position Transportation Service Center Name Position Transportation Service Center Transportation Management Plan Job Number(s) Control Section(s) Route Details County
Transportation Improvement Program FY 2006-2008
 Transportation Improvement Program FY 2006-2008 Hidalgo County Metropolitan Planning Organization Adopted By Policy Committee: March 24, 2005 Public Meeting Date: March 1, 2005 Public Meeting Date: April
Federal Highway Administration 1200 New Jersey Avenue, SE Washington, DC 20590 202-366-4000
 1 of 8 12/27/2013 8:21 AM U.S. Department of Transportation Federal Highway Administration 1200 New Jersey Avenue, SE Washington, DC 20590 202-366-4000 MAP-21 - Moving Ahead for Progress in the 21st Century
Nashville Freight Model. Max Baker, Nashville MPO Rob Bostrom, WSA July 17, 2008 Tennessee MUG
 Nashville Freight Model Max Baker, Nashville MPO Rob Bostrom, WSA July 17, 2008 Tennessee MUG Overview of Presentation Nashville Area Study Background Truck Model Nashville Area Nashville Area MPO 7 County
How To Modernize And Maintain Roads, Highways And Bridges In Maine
 MAINE TRANSPORTATION BY THE NUMBERS: Meeting the State s Need for Safe and Efficient Mobility OCTOBER 2012 202-466-6706 www.tripnet.org Founded in 1971, TRIP of Washington, DC, is a nonprofit organization
Appendix E Transportation System and Demand Management Programs, and Emerging Technologies
 Appendix E Transportation System and Demand Management Programs, and Emerging Technologies Appendix Contents Transportation System Management Program Transportation Demand Management Program Regional Parking
MISSOURI TRAFFIC SAFETY COMPENDIUM
 2010 MISSOURI TRAFFIC SAFETY COMPENDIUM MISSOURI STATE HIGHWAY PATROL STATISTICAL ANALYSIS CENTER 1510 East Elm Jefferson City, Missouri 65101 (573) 751-9000 CONTENTS PAGE EXECUTIVE SUMMARY INTRODUCTION...1
Cloud ITS: Reducing Congestion & Saving Lives
 Cloud ITS: Reducing Congestion & Saving Lives In 2008, for the first time in human history, the proportion of the worlds population based in urban areas was greater than 50 percent. *IBM Report: Transportation
Delaware Department of Transportation Transportation Management Program
 Delaware Department of Transportation Transportation Management Program Delmarva Freight & Goods Movement Task Force Meeting December 4, 2013 Overview ITMS Background Relationship to Freight and Goods
District of Columbia State Data Center Quarterly Report Summer 2007
 District of Columbia State Data Center Quarterly Report Summer 2007 Commuting to Work: Bike? Walk? Drive? Introduction by Joy Phillips Robert Beasley In 2005, 45 percent of District residents drove to
INTELLIGENT TRANSPORTATION SYSTEMS IN WHATCOM COUNTY A REGIONAL GUIDE TO ITS TECHNOLOGY
 INTELLIGENT TRANSPORTATION SYSTEMS IN WHATCOM COUNTY A REGIONAL GUIDE TO ITS TECHNOLOGY AN INTRODUCTION PREPARED BY THE WHATCOM COUNCIL OF GOVERNMENTS JULY, 2004 Whatcom Council of Governments 314 E. Champion
Chapter 5 Financial Plan
 The Safe, Accountable, Flexible, Efficient Transportation Equity Act: A Legacy for Users (SAFETEA_LU) requires that the MTP incorporate a financial plan for the planning period. The MTP is required to
Intelligent Transportation System - I
 Chapter 48 Intelligent Transportation System - I 48.1 Overview Intelligent Transportation Systems (ITS) is the application of computer, electronics, and communication technologies and management strategies
Crash Report Calendar Years 2003 through 2006 August 2007
 Bloomington/Monroe County Metropolitan Planning Organization Crash Report Calendar Years 2003 through 2006 August 2007 (this page intentionally left blank) Table of Contents Executive Summary... ii Introduction...
EPA Technical Assistance for Sustainable Communities Building Blocks
 EPA Technical Assistance for Sustainable Communities Technical Assistance Tool: Complete Streets Deerfield Beach, Florida February 16, 2012 To: CC: Amanda Martinez, City of Deerfield Beach Roger Millar,
City of Rockville Regional Development Impacts: Transportation Capacity Analysis. June, 2013
 City of Rockville Regional Development Impacts: Transportation Capacity Analysis June, 2013 Purpose and Need Response to Council and Public Evaluate use of more advanced traffic analysis methodology and
Public Sector Solutions
 Public Sector Solutions The New Jersey DOT Command Center uses INRIX real-time data and analytics to monitor congestion and deploy resources proactively to manage traffic flow and inform travelers. INRIX
The Indiana Experience
 Transportation Asset Management Case Studies Presented by HIGHWAY ECONOMIC REQUIREMENTS SYSTEM-STATE The Indiana Experience Aerial view of the I-65/I-75 split in Indianapolis. Photo by James Kinder. FRONT
HOW WILL PROGRESS BE MONITORED? POLICY AREA. 1. Implement the 2040 Growth Concept and local adopted land use and transportation plans
 PERFORMANCE MONITORING APPROACH OAR 660-044-0040(3)(e) directs Metro to identify performance measures and targets to monitor and guide implementation of the Climate Smart Strategy. The purpose of performance
2009-3. The Preservation of Local Truck Routes: A Primary Connection between Commerce and the Regional Freight Network
 2009-3 The Preservation of Local Truck Routes: A Primary Connection between Commerce and the Regional Freight Network July 2009 This Goods Movement Challenges and Opportunities Report was prepared jointly
Florida s Transportation Visioning Summit Summary
 Florida s Transportation Visioning Summit Summary Introduction The Florida Department of Transportation (FDOT) convened Florida s Transportation Visioning Summit on December 17, 2014 in Lake Buena Vista.
Wilmington Urban Area Metropolitan Planning Organization Surface Transportation Program Direct Attributable Project Submittal Guide Fiscal Year 2016
 Wilmington Urban Area Metropolitan Planning Organization Surface Transportation Program Direct Attributable Project Submittal Guide Fiscal Year 2016 Date of Release: September 14, 2015 Pre application
Measuring the Street:
 Measuring the Street: New Metrics for 21st Century Streets 1 Measuring the Street: New Metrics for 21st Century Streets New York City s streets are constantly called on to the meet new and varied needs
CONNECTICUT S TOP TRANSPORTATION ISSUES:
 CONNECTICUT S TOP TRANSPORTATION ISSUES: Meeting the State s Need for Safe, Smooth and Efficient Mobility NOVEMBER 2015 202-466-6706 tripnet.org Founded in 1971, TRIP of Washington, DC, is a nonprofit
How To Design A Crash Investigation Site
 CHAPTER 7 CRASH INVESTIGATION SITES December, 2000 7. Crash Investigation Sites (CIS) 7.1. Introduction and Usage The idea of "crash investigation sites" or areas outside of the freeway mainline where
How does CDOT rank among state DOTs?
 1 Colorado Department of Spring 2014 How does CDOT rank among state DOTs? State transportation departments, the federal government and third-party groups use a variety of metrics to judge the performance
Transportation Management Toolbox Strategies
 Transportation Management Toolbox Strategies Introduction This transportation management toolbox is being developed to provide the Kansas Department of Transportation (KDOT), Mid-America Regional Council
GTA Cordon Count Program
 Transportation Trends 2001-2011 Executive Summary Project No. TR12 0722 September 2013 1.0 Introduction The Cordon Count program was established to collect traffic data as a tool for measuring travel trends
Knoxville Regional Transportation Planning Organization. Certification Review Report. April 2012
 Knoxville Regional Transportation Planning Organization Certification Review Report April 2012 Federal Highway Administration Federal Transit Administration Tennessee Division Office Region 4 404 BNA Drive,
Transit in the United States 3. Operating Costs and Performance Measures 13. Quality of Transit Service 19. ADA Compliance Bus 28
 1999 National Transit Summaries and Trends Introduction 1 Introduces the transit modes discussed throughout the NTST. Transit in the United States 3 National statistics and trends in ridership, miles of
The Housing Downturn in the United States 2009 First Quarter Update
 The Housing Downturn in the United States 2009 First Quarter Update May 2009 TABLE OF CONTENTS The Housing Downturn in the United States: 2009 First Quarter Update Introduction The Housing Downturn: National
Intersection Cost Comparison Spreadsheet User Manual ROUNDABOUT GUIDANCE VIRGINIA DEPARTMENT OF TRANSPORTATION
 Intersection Cost Comparison Spreadsheet User Manual ROUNDABOUT GUIDANCE VIRGINIA DEPARTMENT OF TRANSPORTATION Version 2.5 i Virginia Department of Transportation Intersection Cost Comparison Spreadsheet
The Public Health Costs of Traffic Congestion A Health Risk Assessment
 HCRA Harvard Center for Risk Analysis The Public Health Costs of Traffic Congestion A Health Risk Assessment By: Jonathan I. Levy, Jonathan J. Buonocore, & Katherine von Stackelberg Traffic congestion
INITIATIVE: PERFORMANCE METRICS AND GUIDELINES
 INITIATIVE: PERFORMANCE METRICS AND GUIDELINES SUMMARY Policy makers want to fund programs that work. Being able to measure and communicate the value achieved by investing in transit, therefore, is a critical
Ethernet Access (Formerly Converged Ethernet Access) Operations Manual
 Operations Manual") Ethernet Access (Formerly Converged Ethernet Access) Operations Manual 1. Service Description. Ethernet Access (formerly known as Converged Ethernet Access or Multi-Service Ethernet Access) provides dedicated
Ethernet Access (Formerly Converged Ethernet Access) Operations Manual 1. Service Description. Ethernet Access (formerly known as Converged Ethernet Access or Multi-Service Ethernet Access) provides dedicated
Chapter VIII: Long-Term Outlook and the Financial Plan
 A. Long-Term Outlook Chapter VIII: Long-Term Outlook and the Financial Plan When examining the long-term outlook for transportation planning and programming over the foreseeable future, there are several
Surface Transportation Program (STP) Projects
 Projects") Toledo Metropolitan Area Council of Governments American Reinvestment and Recovery Act (Economic Stimulus Program) Application Packet for: Surface Transportation Program (STP) Projects APPLICATIONS DUE
Toledo Metropolitan Area Council of Governments American Reinvestment and Recovery Act (Economic Stimulus Program) Application Packet for: Surface Transportation Program (STP) Projects APPLICATIONS DUE
Management System Support Tool
 Management System Support Tool Prepared for: Cambridge Systematics, Inc. Federal Highway Administration Michigan Department of Transportation Prepared by: Michigan Department of Transportation Statewide
EFFORTS ACCOMPLISHED TO DATE
 12. Intelligent Transportation Systems The Dallas-Fort Worth (DFW) Metropolitan Area is currently involved in the planning, programming, and implementation of Intelligent Transportation System (ITS) programs
City of Toronto. Congestion Management Plan OCTOBER 2013
 City of Toronto Congestion Management Plan 2014 2018 OCTOBER 2013 This report was prepared in 2013 by Delcan and Lura Consulting for the City of Toronto Transportation Division. TABLE OF CONTENTS The Need