BASICS OF MAP DESIGN A-B. Dr. Ori Gudes
|
|
|
- Dulcie Coral Grant
- 7 years ago
- Views:
Transcription
1 BASICS OF MAP DESIGN A-B Dr. Ori Gudes
2 Outline of Presentation Maps and Cartography. Topographic vs. Thematic maps. Paper maps vs. Digital maps. Principles of Map Design. Practical Tips.
3 Maps and Cartography Cartography is the science and art of making maps The term map is used to describe digital or analog (soft- or hardcopy) output from a GIS that shows geographic information using wellestablished cartographic conventions.
4 Topographic vs. Thematic Maps Topographic maps show all natural (rivers, ridges) and man-made (roads, buildings) geographic features on a terrain (i.e., topography). Thematic maps reflects a particular theme, for example political, cultural or agricultural features of an area.
5 Topographic vs. Thematic Maps

6 Paper Maps vs. GIS Maps
7 Principles of Map design
8 Principles of Map design Purpose Typically, a map does not have more than one purpose. Audience Who will be reading your map? Size, scale, and media The physical size of a map relative to the geographic extent shown on the map. Focus Refers to where the designer wants the map reader to first focus. Integrity Cross validating some of your information. Balance How does your map look on the page or screen? Completeness Use of basic map elements, which is the subject of the next presentation (ESRI, 2007).


9 Classification Schemes
10 Examples
 and meanings attributed to them. 4. Providing context and extra information with inset maps. 5.")
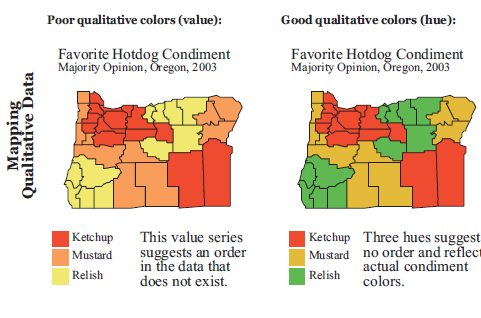
11 Making maps more readable 1. Using transparency to show more than one phenomena. 2. Converting labels to annotation for customisation. 3. Use of colours ( and meanings attributed to them. 4. Providing context and extra information with inset maps. 5. As a general rule, the typical user is unable to differentiate between more than seven (plus or minus two) ordinal categories and have a tendency to look at the maps from upper left corner to lower right. 6. Mimicking or creating special effects may cost you time and a cluttered map.


12 Examples

13 Elements of a Map 1. Map body 2. Legend 3. Title 4. Scale 5. North arrow 6. Preview map 7. Other elements (grid etc;)

14 Layout Component

15 Basic map design Inset map Scale Author North Arrow Map Body Data Source Title Grid Legend Projection 15 Tuesday, 9 August 2016
16 Map Layout examples Map layout example 1: This map (the shape of the mapped area is based on a composition of satellite images) has a neutral grey background. This grey background unites the marginal information to the mapped area evokes the impression that no disturbing 'gaps' occur in the layout, yet the map remains transparent. A good example of an informal balance. Map type: Frame map in combination with Bleeding edge. 16 Tuesday, 9 August 2016
17 Map Layout examples Map layout example 2: This map is an standard example of a topographic map. Notice the typical symmetric balance in a frame type of map layout. 17 Tuesday, 9 August 2016
18 Map Layout examples Map layout example 3: This is a typical design problem. How to represent an area with a strong one directional stretched out shape, like The Gambia or Chili. Easy solution is to represent the area more times containing related themes!! 18 Tuesday, 9 August 2016
19 Map Layout examples Map layout example 4: A very good example of uniformity. Orientation has been the leading guide for this design and has been carried though to the extreme: All maps: slanted All marginal information slanted items: All legend components: slanted All text: Italic Result: coherency 19 Tuesday, 9 August 2016
20 Map Layout examples Map layout example 5: The Solomon Islands area widely spread out in the South Pacific Ocean. Here a great number of extension insets have been used to map the entire country. A location map displays the true geographical position. This map is a good example of the map type: bleeding edge map 20 Tuesday, 9 August 2016
21 Map Layout examples Map layout example 6: A typical example of a very bad map design and layout. The mapped area should cover approx % of the paper size. This example has even less that 35% mapped area coverage. The distance from the lower legend items to the mapped area is far too remote to make any sensible relation. Possible solutions: Choose different scale Reduce the extensive legend by generalizing the thematic content 21 Tuesday, 9 August 2016
22 Map Layout examples Map layout example 7: Sometimes creativity in layout leads to interesting points of view. The world represented upside down shows clearly that the majority of the landmass is on the Southern hemisphere (according to this map)?! 22 Tuesday, 9 August 2016
23 Map Layout, final note Final note: Those who have studied these slides should be aware that the information obtained should be an incentive for further exploring the possibilities of text and map layout. Each map is unique and requires its' own unique layout (with the exception of map series). Imagination and artistic feeling are beyond doubt of paramount importance to achieve this goal. I hope the preceding slides contribute to create suitable, interesting and complete designs. 23 Tuesday, 9 August 2016
24 Adding Cartographic Elements to the Map - Demo in Class
. Graticule measure grid: Intersecting lines that show location using projected (x,y) coordinates.")
25 Adding a Reference System (GRID) There are three types of reference systems you can add in ArcMap: Intersecting lines that show location using geographic coordinates (degrees of latitude and longitude). Graticule measure grid: Intersecting lines that show location using projected (x,y) coordinates. References grid: A grid of lines that divides a map into a specified number of rows and columns; the row and column labels often identify locations listed in a map index. For example like A1, B2 etc; The map on the left includes a graticule to allow readers to locate features by their latitude and longitude coordinates. The map on the right uses a simple reference grid to help readers find map features.
26 Adding a Grid to the Map - Demo in Class

27 Exporting Maps
28 Exporting Map - Demo in Class

29 Exporting Maps to PDF
30 Exporting Map to PDF- Demo in Class
31 Web Cartographic Resources (Colour Brewer) (Ask a Cartographer) apevaluationguidelines.pdf (Map Evaluation Guidelines) Visit ArcGIS Online to discover maps produced by ArcMap Designing Better Maps: A Guide for GIS Users / /qid= /sr=8-2/ref=sr_8_xs_ap_i2_xgl14/ ?v=glance&s=books&n=507846
32 Review Visually, the map body should be the most prominent element on the map. The main elements of a map are the map body, legend, title, scale, north arrow, and the inset map. Maps can also contain other elements such as graticules, text boxes, charts, graphics, and images. You can modify the properties of all the elements in a layout to suit your needs. ArcMap gives you tools to organise and arrange the elements so that a map is easy to read. To increase the information conveyed by a map and to make a map more readable, you can adjust layer transparency, convert labels to annotation, and add a reference system. To improve a map's visual balance, you can add graphic elements such as borders and text boxes.
33 Review 6 Cs of a map (Wheaton, 2011) 1. Colourful - (able to distinguish key features and the patterns, but not cluttered). 2. Creative - (but not confusing). 3. Correct (all information provided in the map should be correct). 4. Context - (location, coordinates, projections, scale, orientation, setting). 5. Convincing - (fits to purpose and conveys the message). 6. Consistent - (connection and consistency between all map elements logic, graphic and typography). Follow the principles introduced in this workshop, ask your colleagues to comment on your maps, and do a little research on maps with the similar theme before/during your map design. KISS... Wheaton, Joe, Advanced GIS Courses, retrieved at 01/05/2012 from ESRI, 2007, Basics of map making, retrieved at 01/05/2012 from Acknowledgement: Thanks to Dr John Hayes from QUT for the materials and ideas used in this presentation
34 Thank you
GEOGRAPHIC INFORMATION SYSTEMS CERTIFICATION
 GEOGRAPHIC INFORMATION SYSTEMS CERTIFICATION GIS Syllabus - Version 1.2 January 2007 Copyright AICA-CEPIS 2009 1 Version 1 January 2007 GIS Certification Programme 1. Target The GIS certification is aimed
DATA VISUALIZATION GABRIEL PARODI STUDY MATERIAL: PRINCIPLES OF GEOGRAPHIC INFORMATION SYSTEMS AN INTRODUCTORY TEXTBOOK CHAPTER 7
 DATA VISUALIZATION GABRIEL PARODI STUDY MATERIAL: PRINCIPLES OF GEOGRAPHIC INFORMATION SYSTEMS AN INTRODUCTORY TEXTBOOK CHAPTER 7 Contents GIS and maps The visualization process Visualization and strategies
An Esri White Paper October 2010 Esri Production Mapping Product Library: Spatially Enabled Document Management System
 An Esri White Paper October 2010 Esri Production Mapping Product Library: Spatially Enabled Document Management System Esri, 380 New York St., Redlands, CA 92373-8100 USA TEL 909-793-2853 FAX 909-793-5953
ArcGIS ArcMap: Printing, Exporting, and ArcPress
 Esri International User Conference San Diego, California Technical Workshops July 25th, 2012 ArcGIS ArcMap: Printing, Exporting, and ArcPress Michael Grossman Jeremy Wright Workshop Overview Output in
Microsoft Excel Basics
 COMMUNITY TECHNICAL SUPPORT Microsoft Excel Basics Introduction to Excel Click on the program icon in Launcher or the Microsoft Office Shortcut Bar. A worksheet is a grid, made up of columns, which are
Reef Explorer User Guide
 Reef Explorer User Guide Contents USER INTERFACE...2 DATA CONTENT...3 BASEMAPS...4 ESRI BASEMAPS...4 National Geographic World Map...4 Light Gray Canvas Map...4 Ocean Basemap...4 World Terrain Base...4
What is GIS? Geographic Information Systems. Introduction to ArcGIS. GIS Maps Contain Layers. What Can You Do With GIS? Layers Can Contain Features
 What is GIS? Geographic Information Systems Introduction to ArcGIS A database system in which the organizing principle is explicitly SPATIAL For CPSC 178 Visualization: Data, Pixels, and Ideas. What Can
Data Visualization. Prepared by Francisco Olivera, Ph.D., Srikanth Koka Department of Civil Engineering Texas A&M University February 2004
 Data Visualization Prepared by Francisco Olivera, Ph.D., Srikanth Koka Department of Civil Engineering Texas A&M University February 2004 Contents Brief Overview of ArcMap Goals of the Exercise Computer
A form of assessment Visual, attractive and engaging. Poster presentations are... A conversation starter
 Poster presentations Aims and Objectives This guide shows you how to produce a poster that is clear and creative, helping you make the most of your poster design Introduction Why do we make posters? A
Step 2: Learn where the nearest divergent boundaries are located.
 What happens when plates diverge? Plates spread apart, or diverge, from each other at divergent boundaries. At these boundaries new ocean crust is added to the Earth s surface and ocean basins are created.
User s Guide to ArcView 3.3 for Land Use Planners in Puttalam District
 User s Guide to ArcView 3.3 for Land Use Planners in Puttalam District Dilhari Weragodatenna IUCN Sri Lanka, Country Office Table of Content Page No Introduction...... 1 1. Getting started..... 2 2. Geo-referencing...
INTRODUCTION to ESRI ARCGIS For Visualization, CPSC 178
 INTRODUCTION to ESRI ARCGIS For Visualization, CPSC 178 1) Navigate to the C:/temp folder 2) Make a directory using your initials. 3) Use your web browser to navigate to www.library.yale.edu/mapcoll/ and
Introduction to GIS (Basics, Data, Analysis) & Case Studies. 13 th May 2004. Content. What is GIS?
 & Case Studies. 13 th May 2004. Content. What is GIS?") Introduction to GIS (Basics, Data, Analysis) & Case Studies 13 th May 2004 Content Introduction to GIS Data concepts Data input Analysis Applications selected examples What is GIS? Geographic Information
Introduction to GIS (Basics, Data, Analysis) & Case Studies 13 th May 2004 Content Introduction to GIS Data concepts Data input Analysis Applications selected examples What is GIS? Geographic Information
Graphic Communication Desktop Publishing
 Graphic Communication Desktop Publishing Introduction Desktop Publishing, also known as DTP, is the process of using the computer and specific types of software to combine text and graphics to produce
Creating Figure Ground Maps in ArcMap 10.x: Basic procedures to download, open, manipulate and print spatial data
 Creating Figure Ground Maps in ArcMap 10.x: Basic procedures to download, open, manipulate and print spatial data These procedures outline: A. Retrieving Property Data B. Uncompressing the Downloaded Files
Training in Cartography: e-learning Courses in Thematic Cartography
 Training in Cartography: e-learning Courses in Thematic Cartography Concepción Romera and Judith Sánchez National Atlas and Thematic Cartography Department (cromera@fomento.es, jsgonzalez@fomento.es) National
Applications & Operations - Resource Stewardship & Major Projects
 Temporary GIS Technician (12 Months) BC Oil & Gas Commission, Fort St John Grid 18 - $55,294.14 - $62,886.67* * Posted salary includes a JFMM Allowance of 10% & a Location Allowance of 3% Applications
Cookbook 23 September 2013 GIS Analysis Part 1 - A GIS is NOT a Map!
 Cookbook 23 September 2013 GIS Analysis Part 1 - A GIS is NOT a Map! Overview 1. A GIS is NOT a Map! 2. How does a GIS handle its data? Data Formats! GARP 0344 (Fall 2013) Page 1 Dr. Carsten Braun 1) A
Advanced Presentation Features and Animation
 There are three features that you should remember as you work within PowerPoint 2007: the Microsoft Office Button, the Quick Access Toolbar, and the Ribbon. The function of these features will be more
WHAT IS GIS - AN INRODUCTION
 WHAT IS GIS - AN INRODUCTION GIS DEFINITION GIS is an acronym for: Geographic Information Systems Geographic This term is used because GIS tend to deal primarily with geographic or spatial features. Information
NGA GRID GUIDE HOW TO USE ArcGIS 8.x ANS 9.x TO GENERATE MGRS AND OTHER MAP GRIDS
 GEOSPATIAL SCIENCES DIVISION COORDINATE SYSTEMS ANALYSIS TEAM (CSAT) SEPTEMBER 2005 Minor Revisions March 2006 POC Kurt Schulz NGA GRID GUIDE HOW TO USE ArcGIS 8.x ANS 9.x TO GENERATE MGRS AND OTHER MAP
Excel -- Creating Charts
 Excel -- Creating Charts The saying goes, A picture is worth a thousand words, and so true. Professional looking charts give visual enhancement to your statistics, fiscal reports or presentation. Excel
KB COPY CENTRE. RM 2300 JCMB The King s Buildings West Mains Road Edinburgh EH9 3JZ. Telephone: 0131 6505001
 KB COPY CENTRE RM 2300 JCMB The King s Buildings West Mains Road Edinburgh EH9 3JZ Telephone: 0131 6505001 Email: kbcopy@ed.ac.uk martin.byrne@ed.ac.uk colin.doherty@ed.ac.uk Step 1. Set up page orientation
Create a folder on your network drive called DEM. This is where data for the first part of this lesson will be stored.
 In this lesson you will create a Digital Elevation Model (DEM). A DEM is a gridded array of elevations. In its raw form it is an ASCII, or text, file. First, you will interpolate elevations on a topographic
ADWR GIS Metadata Policy
 ADWR GIS Metadata Policy 1 PURPOSE OF POLICY.. 3 INTRODUCTION.... 4 What is metadata?... 4 Why is it important? 4 When to fill metadata...4 STANDARDS. 5 FGDC content standards for geospatial metadata...5
Creating a Poster in PowerPoint 2010. A. Set Up Your Poster
 View the Best Practices in Poster Design located at http://www.emich.edu/training/poster before you begin creating a poster. Then in PowerPoint: (A) set up the poster size and orientation, (B) add and
Three daily lessons. Year 5
 Unit 6 Perimeter, co-ordinates Three daily lessons Year 4 Autumn term Unit Objectives Year 4 Measure and calculate the perimeter of rectangles and other Page 96 simple shapes using standard units. Suggest
GIS: Geographic Information Systems A short introduction
 GIS: Geographic Information Systems A short introduction Outline The Center for Digital Scholarship What is GIS? Data types GIS software and analysis Campus GIS resources Center for Digital Scholarship
Instructions to Create Your Rollup Poster in PowerPoint
 Instructions to Create Your Rollup Poster in PowerPoint THE IDEAL POSTER IS DESIGNED TO... Provide a brief overview of your research Encourage discussion Stand alone when you re not there to provide an
Publisher 2010 Cheat Sheet
 April 20, 2012 Publisher 2010 Cheat Sheet Toolbar customize click on arrow and then check the ones you want a shortcut for File Tab (has new, open save, print, and shows recent documents, and has choices
Census Data with Tableau Public
 Census Data with Tableau Public Before you begin, download the template at http://public.tableausoftware.com/views/census-template/dashboard?:embed=yes&:toolbar=yes&:tabs=no Get your data together 1. Gather
Making a Great Poster. A Great Poster is:
 Making a Great Poster Marilee P. Ogren PhD Ogren@mit.edu Readable A Great Poster is: Unreadable = grammatical problems, complex, passive sentences, misspellings Legible Illegible = small font, fancy font,
Word processing software
 Unit 244 Word processing software UAN: Level: 2 Credit value: 4 GLH: 30 Assessment type: Relationship to NOS: Assessment requirements specified by a sector or regulatory body: Aim: R/502/4628 Portfolio
Guide To Creating Academic Posters Using Microsoft PowerPoint 2010
 Guide To Creating Academic Posters Using Microsoft PowerPoint 2010 INFORMATION SERVICES Version 3.0 July 2011 Table of Contents Section 1 - Introduction... 1 Section 2 - Initial Preparation... 2 2.1 Overall
Introduction to Google Earth May 24, 2011. TJ Keiran Senior Planner / GIS Specialist Cowlitz-Wahkiakum Council of Governments
 Introduction to Google Earth May 24, 2011 TJ Keiran Senior Planner / GIS Specialist Cowlitz-Wahkiakum Council of Governments Purpose of this class Introduce free version of Google Earth Demonstrate common
Are Your Client Reports Brand-boosters or Brand-busters?
 Are Your Client Reports Brand-boosters or Brand-busters? November 2, 2015 by Joyce Walsh Seven ways advisors can harness the power of design to better-serve clients and reinforce their brand promise Advisor
Digital Cadastral Maps in Land Information Systems
 LIBER QUARTERLY, ISSN 1435-5205 LIBER 1999. All rights reserved K.G. Saur, Munich. Printed in Germany Digital Cadastral Maps in Land Information Systems by PIOTR CICHOCINSKI ABSTRACT This paper presents
Information Literacy Program
 Information Literacy Program Excel (2013) Advanced Charts 2015 ANU Library anulib.anu.edu.au/training ilp@anu.edu.au Table of Contents Excel (2013) Advanced Charts Overview of charts... 1 Create a chart...
Data Visualization. Brief Overview of ArcMap
 Data Visualization Prepared by Francisco Olivera, Ph.D., P.E., Srikanth Koka and Lauren Walker Department of Civil Engineering September 13, 2006 Contents: Brief Overview of ArcMap Goals of the Exercise
Creating a Poster Presentation using PowerPoint
 Creating a Poster Presentation using PowerPoint Course Description: This course is designed to assist you in creating eye-catching effective posters for presentation of research findings at scientific
Intro to GIS Winter 2011. Data Visualization Part I
 Intro to GIS Winter 2011 Data Visualization Part I Cartographer Code of Ethics Always have a straightforward agenda and have a defining purpose or goal for each map Always strive to know your audience
Tutorial 4 - Attribute data in ArcGIS
 Tutorial 4 - Attribute data in ArcGIS Note: Before beginning the tutorial, please make sure your server folder is mapped. The data you will be working with this week is contained in a winzip archive called
InDesign for Beginners Step-By-Step Guide
 InDesign for Beginners Step-By-Step Guide Learning Objectives At the end of the workshop, you will be able to: 1. Adjust text with the Character panel and change alignment with the Paragraph panel or Control
A KNOWLEDGE-BASED APPROACH FOR REDUCING CLOUD AND SHADOW ABSTRACT
 A KNOWLEDGE-BASED APPROACH FOR REDUCING CLOUD AND SHADOW Mingjun Song, Graduate Research Assistant Daniel L. Civco, Director Laboratory for Earth Resources Information Systems Department of Natural Resources
Contents. The OWRB Floodplain Viewer. Creating Maps... 8. Helpful Tips... 10
 Contents QUICK START GUIDE... 2-5 Add layers...9 Search for Layers...9 COMPREHENSIVE GUIDE... 6 Navigate the map...6 Locate specific places...6 Add layer from file...9 Add layer from web...9 Display pop-up
Spotfire v6 New Features. TIBCO Spotfire Delta Training Jumpstart
 Spotfire v6 New Features TIBCO Spotfire Delta Training Jumpstart Map charts New map chart Layers control Navigation control Interaction mode control Scale Web map Creating a map chart Layers are added
Tutorial 6 GPS/Point Shapefile Creation
 Tutorial 6 GPS/Point Shapefile Creation The objectives of this tutorial include: 1. Converting GPS field collected point information into a shapefile 2. Creating a shapefile from a simple x,y coordinate
Spreadsheet Modelling
 Unit 42: Spreadsheet Modelling Unit code: QCF Level 3: Credit value: 10 Guided learning hours: 60 Aim and purpose Y/601/6637 BTEC Nationals This unit aims to enable learners to use complex spreadsheet
Week 5 Cookbook: GIS Tutorial Chapter 2 GIS Map Design: Choropleth Maps
 Week 5 Cookbook: GIS Tutorial Chapter 2 GIS Map Design: Choropleth Maps Week 5 Overview 1. Introducing Choropleth Maps 2. Introducing Map Elements 3. First Hands-On Example 4. Your Turn: GIS Tutorial Chapter
GEOGRAPHIC INFORMATION SYSTEMS
 GIS GEOGRAPHIC INFORMATION SYSTEMS FOR CADASTRAL MAPPING Chapter 6 2015 Cadastral Mapping Manual 6-0 GIS - GEOGRAPHIC INFORMATION SYSTEMS What is GIS For a long time people have sketched, drawn and studied
Sign Inventory and Management (SIM) Program Introduction
 Program Introduction") Sign Inventory and Management (SIM) Program Introduction A Sign Inventory and Management (SIM) Program is an area of asset management that focuses specifically on creating an inventory of traffic signs
Sign Inventory and Management (SIM) Program Introduction A Sign Inventory and Management (SIM) Program is an area of asset management that focuses specifically on creating an inventory of traffic signs
Introduction to ArcView 3.2a
 Introduction to ArcView 3.2a Training Center U.S. Geological Survey Center for Earth Resources Observation and Science (EROS) Sioux Falls, South Dakota, USA Introduction to ArcView 3.2a Introduction to
Introduction to GIS. http://libguides.mit.edu/gis
 Introduction to GIS http://libguides.mit.edu/gis 1 Overview What is GIS? Types of Data and Projections What can I do with GIS? Data Sources and Formats Software Data Management Tips 2 What is GIS? 3 Characteristics
Create Charts in Excel
 Create Charts in Excel Table of Contents OVERVIEW OF CHARTING... 1 AVAILABLE CHART TYPES... 2 PIE CHARTS... 2 BAR CHARTS... 3 CREATING CHARTS IN EXCEL... 3 CREATE A CHART... 3 HOW TO CHANGE THE LOCATION
June, 2006 Tutorial: Create map with multiple views and data layers using ArcMap GIS 9.0
 June, 2006 Tutorial: Create map with multiple views and data layers using ArcMap GIS 9.0 This presentation demonstrates how to create a publication-quality map illustration consisting of three panes or
What s New in IBM SPSS Statistics 20
 Myrto Setzi Associate Sales Engineer What s New in IBM SPSS Statistics 20 Editable Text Editable Text Editable Text Business Analytics software Agenda Themes of the release Demonstration Questions 2 Themes
Lesson Plan for Media Literacy
 Constructions Beliefs & Values Audience Intent Form Lesson Plan for Media Literacy Text Production Audience Lesson Focus: What is the focus of the lesson? How will I teach it? The lesson will focus on
Formulas, Functions and Charts
 Formulas, Functions and Charts :: 167 8 Formulas, Functions and Charts 8.1 INTRODUCTION In this leson you can enter formula and functions and perform mathematical calcualtions. You will also be able to
Tips & Tricks for ArcGIS. Presented by: Jim Mallard, Crime Analysis Supervisor Arlington, Texas. 2007 IACA Conference Pasadena, Ca
 Tips & Tricks for ArcGIS Presented by: Jim Mallard, Crime Analysis Supervisor Arlington, Texas 2007 IACA Conference Pasadena, Ca Table of Contents Lock & Load Labels for Maximum Speed!...2 Choose your
The Basics of Navigation
 The Basics of Navigation Knowledge of map reading and the use of the compass is an indispensable skill of bushcraft. Without this skill, a walker is a passenger and mere follower on a trip. To become a
Introduction to ArcMap for Water Resources Data
 Introduction to ArcMap for Water Resources Data Barbara Parmenter and Jack Melcher, revised: 9/15/2011 INTRODUCTION... 1 CHOOSING A HCDN STATION FOR WATERSHED MAPPING... 2 DOWNLOADING DATA FROM THE NATIONAL
A GIS helps you answer questions and solve problems by looking at your data in a way that is quickly understood and easily shared.
 A Geographic Information System (GIS) integrates hardware, software, and data for capturing, managing, analyzing, and displaying all forms of geographically referenced information. GIS allows us to view,
Introduction to Geographic Information Systems. A brief overview of what you need to know before learning How to use any GIS software packages
 Introduction to Geographic Information Systems A brief overview of what you need to know before learning How to use any GIS software packages 1 What is GIS? More than map-making software GIS is a system
NICAR Hands-On: Census Data with Tableau Public
 NICAR Hands-On: Census Data with Tableau Public Get your data together 1. Gather your data. You ll need: a. 2010 and 2000 census data for place (with population > 2000) b. Annexation data by place, from
Microsoft Publisher 2010 What s New!
 Microsoft Publisher 2010 What s New! INTRODUCTION Microsoft Publisher 2010 is a desktop publishing program used to create professional looking publications and communication materials for print. A new
DERIVATION OF THE DATA MODEL
 ARC/INFO: A GEO-RELATIONAL MODEL FOR SPATIAL INFORMATION Scott Morehouse Environmental Systems Research Institute 380 New York Street Redlands CA 92373 ABSTRACT A data model for geographic information
Compiled from ESRI s Web site: http://www.esri.com. 1. What Is a GIS?
 Compiled from ESRI s Web site: http://www.esri.com 1. What Is a GIS? A geographic information system (GIS) is a computer-based tool for mapping and analysing things that exist and events that happen on
Investigation 6: What happens when plates collide?
 Tectonics Investigation 6: Teacher Guide Investigation 6: What happens when plates collide? In this activity, students will use the distribution of earthquakes and volcanoes in a Web GIS to learn about
Adobe InDesign - New User
 Adobe InDesign - New User Category: Graphics & Web Design, Adobe InDesign The InDesign Environment Using the tools and palettes Control palette Using Context menus Opening and closing documents Navigating
Dr. Lisa White lwhite@sfsu.edu
 Dr. Lisa White lwhite@sfsu.edu edu Associate Dean College of Science and Engineering San Francisco State University Purpose of a Poster To communicate/publicize to others your research/experiment results
Personal Geodatabase 101
 Personal Geodatabase 101 There are a variety of file formats that can be used within the ArcGIS software. Two file formats, the shape file and the personal geodatabase were designed to hold geographic
Educational Level Guide. Pros
 GIS software summary This information is based on an evaluation carried out on behalf of the RGS-IBG (please see disclaimer). Category* Cost E- learnin g credits Educational Level Guide Pros Cons Summary
Composition and Layout Techniques
 Composition and Layout Techniques Composition Techniques Composition Composition is the placement or arrangement of visual elements or ingredients in a work of art, as distinct from the subject of a work.
Designing a Poster using MS-PowerPoint
 Designing a Poster using MS-PowerPoint TABLE OF CONTENTS Introduction... 3 Main components of a poster... 3 Setting up your poster... 5 Setting up the document size... 5 Configuring the grid and guides...
Microsoft Office 2013
 Student manuals available at: www.learnit.com/manuals Username: manuals; Password: password Microsoft Office 2013 New Features Take this class home with you! Student Videos Available at: www.learnitanytime.com
Graphic Design for Beginners
 Graphic Design for Beginners Level: Duration: Time: Cost: Introduction 6 Days 9:30 AM - 4:30 PM Call for details Overview Managing the Adobe Photoshop Environment Working with Selections Enhancing an Image
Introduction to Microsoft PowerPoint
 Introduction to Microsoft PowerPoint School of Medicine Library University of South Carolina WHAT IS POWERPOINT? PowerPoint (PPT) is a powerful, easy-to-use presentation graphics software program which
RULES FOR THE BARBARA PETCHENIK CHILDREN'S WORLD MAP COMPETITION 2013
 RULES FOR THE BARBARA PETCHENIK CHILDREN'S WORLD MAP COMPETITION 2013 The Barbara Petchenik Award was created by the International Cartographic Association in 1993 as a memorial for Barbara Petchenik,
In this session, we will explain some of the basics of word processing. 1. Start Microsoft Word 11. Edit the Document cut & move
 WORD PROCESSING In this session, we will explain some of the basics of word processing. The following are the outlines: 1. Start Microsoft Word 11. Edit the Document cut & move 2. Describe the Word Screen
Page 1 of 5 (document version 1)
") Lecture 3 - Computer cartography This lecture will cover: Essential map furniture: North arrow Scale bars Legends Choosing colours: Colour spaces Help with choosing a colour scheme Colour blindness issues
Lecture 3 - Computer cartography This lecture will cover: Essential map furniture: North arrow Scale bars Legends Choosing colours: Colour spaces Help with choosing a colour scheme Colour blindness issues
LEOworks - a freeware to teach Remote Sensing in Schools
 LEOworks - a freeware to teach Remote Sensing in Schools Wolfgang Sulzer Institute for Geography and Regional Science University of Graz Heinrichstrasse 36, A-8010 Graz/Austria wolfgang.sulzer@uni-graz.at
ArcGIS Tutorial: Adding Attribute Data
 ArcGIS Tutorial: Adding Attribute Data Introduction A common need in GIS is to map characteristics, or attributes, of different geographic areas. These maps are called thematic maps. Examples of thematic
PowerPoint 2007 Basics Website: http://etc.usf.edu/te/
 Website: http://etc.usf.edu/te/ PowerPoint is the presentation program included in the Microsoft Office suite. With PowerPoint, you can create engaging presentations that can be presented in person, online,
Visual Communication Program Assessment Revised 2014-2015 Graphic Design Portfolio Checklist/Assessment
 Triton College Visual Communication Assessment 2015 1 Visual Communication Program Assessment Revised 2014-2015 Graphic Design Portfolio Checklist/Assessment The VIC 282 Portfolio Design and Production
SAS Mapping: Technologies, Techniques, Tips and Tricks Darrell Massengill
 SAS Mapping: Technologies, Techniques, Tips and Tricks Darrell Massengill Every organization has location based data. The difficulty is in choosing the right technology and tool to effectively transform
Working with SmartArt
 CHAPTER Working with SmartArt In this chapter by Geetesh Bajaj Understanding SmartArt 206 Adding SmartArt to a Presentation 206 Formatting SmartArt 208 Sample SmartArt Variants 211 Common SmartArt Procedures
How to make a Radar chart / spider chart
 How to make a Radar chart / spider chart When it comes to using scale measures as part of a personal outcomes approach, the radar chart can help you communicate the data effectively. Most importantly it
Data Modeling Basics. John Auel GIS Technician II United Services Group
 Data Modeling Basics John Auel GIS Technician II United Services Group Background Bachelor of Science at University of Wisconsin, Steven s Point Area of Emphasis -- Cartography Been at United Services
How to Create Dashboards. Published 2014-08
 How to Create Dashboards Published 2014-08 Table of Content 1. Introduction... 3 2. What you need before you start... 3 3. Introduction... 3 3.1. Open dashboard Example 1... 3 3.2. Example 1... 4 3.2.1.
Latin American and Caribbean Flood and Drought Monitor Tutorial Last Updated: November 2014
 Latin American and Caribbean Flood and Drought Monitor Tutorial Last Updated: November 2014 Introduction: This tutorial examines the main features of the Latin American and Caribbean Flood and Drought
Geography 3251: Mountain Geography Assignment III: Natural hazards A Case Study of the 1980s Mt. St. Helens Eruption
 Name: Geography 3251: Mountain Geography Assignment III: Natural hazards A Case Study of the 1980s Mt. St. Helens Eruption Learning Objectives: Assigned: May 30, 2012 Due: June 1, 2012 @ 9 AM 1. Learn
Data source, type, and file naming convention
 Exercise 1: Basic visualization of LiDAR Digital Elevation Models using ArcGIS Introduction This exercise covers activities associated with basic visualization of LiDAR Digital Elevation Models using ArcGIS.
Tutorial 3 - Map Symbology in ArcGIS
 Tutorial 3 - Map Symbology in ArcGIS Introduction ArcGIS provides many ways to display and analyze map features. Although not specifically a map-making or cartographic program, ArcGIS does feature a wide
TUTORIAL MOVE 2009.1: 3D MODEL CONSTRUCTION FROM SURFACE GEOLOGICAL DATA
 UNIVERSITÁ DEGLI STUDI DI MILANO FACOLTÀ DI SCIENZE MATEMATICHE FISICHE E NATURALI DIPARTIMENTO DI SCIENZE DELLA TERRA ARDITO DESIO TUTORIAL MOVE 2009.1: 3D MODEL CONSTRUCTION FROM SURFACE GEOLOGICAL DATA
WBU PowerPoint Guidelines
 WBU PowerPoint Guidelines Guidelines on how to make the use of PowerPoint and other visual presentations accessible to audience members who have a vision or print impairment Published by the World Blind
Create a Presentation on Marketing. Intel Easy Steps 1 2012 Intel Corporation All rights reserved.
 Create a Presentation on Marketing Intel Easy Steps 1 2012 Intel Corporation Marketing Presentation Creating a Marketing Presentation When you start a business you need to use different strategies to ensure
BIRT: A Field Guide to Reporting
 BIRT: A Field Guide to Reporting x:.-. ^ 11 Diana Peh Alethea Hannemann Nola Hague AAddison-Wesley Upper Saddle River, NJ Boston Indianapolis San Francisco New York Toronto Montreal London Munich Parts
Supporting High-Quality Printing in Web Applications with ArcGIS for Server
 2013 Esri International User Conference July 8 12, 2013 San Diego, California Technical Workshop Supporting High-Quality Printing in Web Applications with ArcGIS for Server Craig Williams Tanu Hoque Esri
Automated Map Production Workflows. Aileen Buckley and David Watkins abuckley@esri.com and dwatkins@esri.com ESRI, Inc., U.S.A.
 Automated Map Production Workflows Aileen Buckley and David Watkins abuckley@esri.com and dwatkins@esri.com ESRI, Inc., U.S.A. Abstract As noted cartographer Professor Waldo Tobler wrote in 1959, Automation,