investigation of which sea states yield the dominating contribution to fatigue accumulation in offshore structure
|
|
|
- Barrie Horton
- 7 years ago
- Views:
Transcription
1 investigation of which sea states yield the dominating contribution to fatigue accumulation in offshore structure Hamed Mohammad Tahery Marine Technology Submission date: March 2015 Supervisor: Sverre Kristian Haver, IMT Co-supervisor: Jørgen Amdahl, IMT Ole David Økland, Marintek Norwegian University of Science and Technology Department of Marine Technology
2
3 Acknowledgment This thesis is the final work to fulfil the requirement of Master of Science degree in Marine structures at the Department of Marine technology, Norwegian University of Science and Technology, Trondheim, Norway. I would like to express my sincere gratitude to my supervisor, Professor Sverre Haver for his support, guidance and encouragement throughout the work on the thesis. Your patient and kindness have been motivating me to keep going. Thank you. I would also like to acknowledge my co-supervisor, Professor Jørgen Amdahl, for his carrying attitude and valuable collaboration and discussions in every stage of this work. Finally, special gratitude and love to my family and friends for supporting me in finishing this thesis work. Trondheim, 17/03/2015 Hamed M.Tahery 1
4 2
5 Scope of work Title: Investigation of which sea states yield the dominating contribution to fatigue accumulation in offshore structures Student: Hamed M. Tahery Background It is generally expected that the major contributions to fatigue damage come from sea states of moderate severity, i.e. sea states with a significant wave height in the range 4m 8m. This is because these sea states occur relatively frequently. Based on about 1 year of good quality measurements of the Statoil jacket Kvitebjørn, however, it was experienced that the dominating fatigue accumulation during the period of measurements occurred during two rather severe storms. This seems not to agree with common expectation. The purpose of this thesis is to investigate fatigue accumulation versus sea state severity. The investigation shall focus on a drag dominated jacket structure. For such a structure the hydrodynamic loading is given by the Morrison equation. The topics that shall be given special focus are: Relative importance of mass term versus drag term in the Morrison load equation. Relative importance of dynamics. The necessary weather information will be given by the Norwegian hindcast data base, NORA10, giving weather characteristics every 3 hours from The fatigue assessment is to be done by calculating the fatigue accumulation for every 3- hour period during Below a possible division into sub-tasks is given. 1. Introduce briefly typical properties of jackets in general and Kvitebjørn jacket in particular. 2. Describe closed form approximation of the S-N approach. This is an important part of the investigation. If one shall be able to address properly the bullet points above, the fatigue assessment must be based on a closed form 3
6 approach. Assume that stress width is well modelled by a 2-parameter Weibull distribution. In this part one should also select the S-N curve that will be used in the following. Discuss one slope versus two slope curves in view of the closed for approximation. Can we for the purpose adopt a one slope curve? 3. A previous investigation linearized the problem. Here we will apply time domain analysis in order to find the short term distribution of stress width. The time domain analysis shall be done with USFOS. The computer model of the platform will be the same as used in Design of Offshore Structures. Select a number of sea states covering the whole scatter diagram. Do a couple of 3-hour time domain simulations for each of these sea states. Find for each sea state the sample of stress widths and fit a Weibull distribution to the samples. Use method of moments and least square fit. 4. Determine response surfaces for the Weibull parameters. This is done by fitting surface to the point estimates from the sea states above. 5. In the fatigue analysis, all waves can be considered to come from same direction, but the effects of this simplification shall be discussed. Fatigue accumulation is to be calculated for all 3-hours period. Use the close form approximation and select Weibull parameters in agreement with the response surfaces. Accumulated fatigue during 57 years shall be shown versus hs and versus storm events. Variability in fatigue accumulation from year to year shall also be indicated. Special attention should be done regarding the calculation for the period covered by the analysis done by Marintek. 6. Summarize the investigation in conclusions pointing out major learnings of this investigation. The candidate may of course select another scheme as the preferred approach for solving the requested problem. He may also other subjects than those mentioned above. The work may show to be more extensive than anticipated. Some topics may therefore be left out after discussion with the supervisor without any negative influence on the grading. 4
7 The candidate should in his report give a personal contribution to the solution of the problem formulated in this text. All assumptions and conclusions must be supported by mathematical models and/or references to physical effects in a logical manner. The candidate should apply all available sources to find relevant literature and information on the actual problem. The report should be well organised and give a clear presentation of the work and all conclusions. It is important that the text is well written and that tables and figures are used to support the verbal presentation. The report should be complete, but still as short as possible. The final report must contain this text, an acknowledgement, summary, main body, conclusions, suggestions for further work, symbol list, references and appendices. All figures, tables and equations must be identified by numbers. References should be given by author and year in the text, and presented alphabetically in the reference list. The report must be submitted in two copies unless otherwise has been agreed with the supervisor. The supervisor may require that the candidate should give a written plan that describes the progress of the work after having received this text. The plan may contain a table of content for the report and also assumed use of computer resources. As an indication such a plan should be available by end of November. From the report it should be possible to identify the work carried out by the candidate and what has been found in the available literature. It is important to give references to the original source for theories and experimental results. The report must be signed by the candidate, include this text, appear as a paperback, and - if needed - have a separate enclosure (binder, diskette or CD- ROM) with additional material. Supervisor: Co-supervisors: Sverre Haver, NTNU. Jørgen Amdahl (NTNU) and Ole David Økland (Marintek) 5
8 6
9 Abstract In assessment of the fatigue damage, it has been assumed that the moderate sea states (significant wave height ranged between 4-8m) should have major influence on the offshore structures because they have relatively more frequent occurrences than the higher sea state and have much severe effect than the lower sea states. Despite of all the expectations, the accumulative fatigue damage calculated by Ole David Økland for two large storm events, claims that the dominating fatigue damage is caused due to higher sever sea states (significant wave height ranged between 9-13m). This result is based on the measured responses of the Kvitebjørn platform. The purpose of this thesis is to investigate fatigue accumulation for every 3 hour period during , versus sea state severity. All these data have been performed in a omnidirectional scatter diagram and almost all the sea states with H S 5 meter have been included in the calculations. Due to the relatively high height of this specific jacket (190 m), the equation of motion has been solved by time domain analysis approach using USFOS. Moreover, the global FEM analysis has been done and the nominal stresses at each end of the braces are calculated. In order to find local stresses and furthermore the fatigue damage at each end, the nominal stresses and the stress concentration factors alongside the two slope S-N curve introduced to the utility tool for fatigue estimation, called FATAL. Using rainflow counting method, FATAL s output involves two different types of data, the accumulative damage for each brace and the histogram of the stress ranges versus number of cycles. The stress range values have been fitted to the Weibull probability paper plot and the Weibull parameters are obtained for each sea state. At the end the fatigue damages have been calculated by using the closed form equation. The results obtained by both approaches indicate that the sea states with the highest probability of exceedance (i.e. 7.5 H S 9.5 ) have the dominating contribution in accumulative fatigue damage. 7
10 8
11 Table of Contents Acknowledgment... 1 Scope of work... 3 Abstract... 7 Table of Contents... 9 Table of figures Chapter 1: Introduction Background and motivation Objective Chapter 2: Definition of a Jacket Introduction Types of Jackets Structural Design Parameters Jacket Design Analysis Tubular joints General Types of Tubular Joints Chapter 3: Loads and Responses of a Jacket Platforms Introduction Environmental Loads General Waves Equation of motion General Linear mechanical system Morison s Equation
12 3.4.1 General Coefficient determination of Morison s equation Calculate the hydrodynamic forces General Time domain analysis Structural damping [FATAL User s Manual] Local Stress Calculation of Tubular Joints General Stress Concentration Factor for Tubular Joints Superposition of stresses in tubular joints Chapter 4: stress range distribution General Cycle counting methods General Rainflow counting method Short-Term stress range distribution Chapter 5: Fatigue of tubular joints Introduction Fatigue life estimation Fatigue assessment by S-N Approach (Miner-Palmgren) Fatigue assessment by S-N Approach (Closed Form) Uncertainties in analysis of Fatigue life Chapter 6: Case study, Result and Discussion Introduction Kvitebjørn jacket Response calculation using USFOS Introduction
13 6.3.2 Scatter diagram Energy Wave Spectrum: [USFOS Theory description-2010] Morison s equation coefficients Structural damping USFOS Results Damage calculation using FATAL (Miner-Palmgren) Introduction Stress Concentration Factor FATAL Results Damage calculation using MATLAB Introduction The Miner-Palmgren approach (Direct method) Closed form fatigue damage approach (Approximate) Comparison of the result Conclusion Recommendation and further work References Appendix
14 12
15 Table of figures Figure 1.1 Kvitebjørn platform 15 Figure 1.2 Contribution to fatigue life for brace A1A2 and A1B1] 16 Figure 2.1 Conventional fixed steel-jacket structure 17 Figure 2.2 Geometrical definitions for tubular joints 21 Figure 2.3 Classification of simple joints 22 Figure 3.1 Wave characteristics 27 Figure 3.2 regular waves 27 Figure 3.3 Ranges of validity for various wave theorie. 29 Figure 3.4 (a) Applied sector numbering, (b) Main wave direction in the structure coordinate system 31 Figure 3.5 The Pierson-Moskowitz spectrum and the standard JONSWAP spectrum. 34 Figure 3.6 phase angle with damping factors 38 Figure 3.7 Relative response magnitude 39 Figure 3.8 Suggested Drag and Inertia Coefficient Values from DNV 42 Figure 3.9 Actual damping ratio as a function of frequency. 46 Figure 3.10 Axial forces, in and out-of-phase bending moment 47 Figure 3.11 Extrapolating of the geometric peak stress to the weld toe (chord side) 48 Figure 3.12 superposition of stresses 50 Figure 4.1 sample Weibull paper plot. 54 Figure 5.1 Stress distributions in a tubular joint 56 Figure 5.2 Basic definitions for two-slope S-N curves 58 Figure 6.1 Strain gauges at main legs and diagonal braces at elevation -108m 64 Figure 6.2 Name conventions for vertical diagonal bracings between elevation -108m and -74m. 65 Figure 6.3 Omnidirectional scatter diagram, Figure 6.4 The actual surface elevation and its corresponding wave spectrum. 69 Figure 6.5 Illustration of irregular sea state generation 70 Figure 6.6 Morison coefficients over the height of the jacket 70 Figure 6.7 Surface elevation 72 Figure 6.8 Total wave load 73 Figure 6.9 Overturning moment reaction 74 Figure 6.10 Base shear 75 Figure 6.11 Element axial force 76 Figure 6.12 element in-plane bending moment 77 Figure 6.13 element out-of-plane bending moment 78 Figure hour damage for each sea state 81 Figure 6.15 Accumulative damage for each sea state 82 13
16 Figure 6.16 total damage according to Hs for each brace 83 Figure 6.17 Histogram of Rainflow amplitudes. 85 Figure hour damage for each sea state 87 Figure 6.19 Accumulative damage for each sea state 88 Figure 6.20 Weibull Probability Paper of stress ranges
17 Chapter 1: Introduction 1.1 Background and motivation The Kvitebjørn platform, Figure 1-1, was designed for installation in North Sea in 190m water depth. The jacket has been installed in two pieces, the bottom and top section which are connected to the topside rectangular shape deck. Figure 1.1 Kvitebjørn platform [D. Karunakaran et al.-2001] 15

18 In assessment of the fatigue damage, it has been assumed that the moderate sea states (significant wave height ranged between 4-8m) should have major influence on the offshore structures because they have relatively more frequent occurrences than the higher sea state and have much severe effect than the lower sea states. Despite of all the expectations the accumulative fatigue damage calculated by Ole David Økland for two large storm events shows: the contribution of these two storms is relatively large [O.D. Økland-2010]. The results is shown in Figure 1-3 Figure 1.2 Contribution to fatigue life for brace A1A2 and A1B1 [O.D. Økland-2010] This calculations are performed according to the measured responses (i.e. Axial force in- and out of plane bending moments) in the diagonal bracing of the tubular joint at the EL (-)108 of Kvitebjørn jacket. Having almost 60 years ( ) hindcast data (3-hour sea state), the aim is to investigate fatigue accumulation versus sea state severity, compare them with the measured data and Marintek report and investigate which sea states have the major contribution in accumulated fatigue damage in general. 1.2 Objective The purpose of this thesis is to investigate fatigue accumulation for every 3 hour period during , versus sea state severity. The investigation shall focus on a drag dominated jacket structure in relatively deep water. 16
19 Chapter 2: Definition of a Jacket 2.1 Introduction The jacket structures are still the most common offshore structures used for drilling and production. Some structures contain enlarged legs, which are suitable for selfbuoyancy during its installation at the site. Generally jackets are Steel trussed structures fixed to the bottom of the ocean. These structures consist of tubular members interconnected to form a three-dimensional space frame and usually have four to eight legs designed to achieve good stability against toppling in waves (see figure 2.1). Actually the main reason for using jacket type platforms is to provide lateral stiffness to hold up against environmental loads. These platforms generally support a superstructure having 2 or 3 decks with drilling and production equipment, and work over rigs. Figure 2.1 Conventional fixed steel-jacket structure (adapted from 17
20 Jackets have been installed in water depths ranging from 0 to 400 meters, to support topside weight of up to tonnes. Yet still some conceptual designs have been considered for greater water depth and larger topside weight.[dnv Report No ] Generally the performance of the jackets in ocean environment has been reasonable, however, increasing the water depth has major impact on the steel weight and thus the cost increases rapidly. 2.2 Types of Jackets Jacket platforms may differ in shape and complexity depending on the purpose (drilling, production, utility, etc.) and ocean environment (water depth, waves, current, wind, earthquake, etc.). The jackets are classified in three categories based on their modes of installation as below: Self-floater jacket Barge launched jacket Lift installed jacket In early days the self floating jacket, which was floated out to the installation site and upended, was quite popular because it required a minimum of offshore installation equipment. The barge launched mode of installation has been most common as long as only smaller lifting vessels were available. During the last ten years many platforms weighing less than tons have been lift installed, thus minimizing the need for temporary installation aids. Most often jackets have piled foundations, but lately jackets have also been designed with plated foundations, which reduce installation time. Among the piled jackets it is distinguished between those with piles in the legs, template type jacket, and those with piles arranged as skirts and clusters, tower type jackets. [DNV Report No ] 18
21 2.3 Structural Design Parameters The jacket design is governed by the following: Functional requirements, i.e., support of topside, well conductors, risers, etc. Water depth Foundation soil conditions Environmental conditions, i.e., wave, current, wind, temperature, earthquake, etc. Important items to be considered in an economical jacket design are: Jacket configuration Foundation (piled, plated, etc.) Type of installation Use of high strength steel Use of cast nodes to improve fatigue performance 2.4 Jacket Design Analysis In order to design the shallow water jackets to get the satisfactory strength, using Static Theory has been recommended by DNV. In this method the wave loads are applied statistically on the structure. In addition a deterministic fatigue analysis, earthquake analysis (if required) and design for the temporary installation have to be done. The natural period of the jacket is calculated to establish the need for wave dynamic analysis. On the other hand, in deep water situation, the platforms have larger Eigen period than the shallow water platforms i.e. in deep water their natural period is closer to wave period. This is the reason that the responses in deep water jackets are often dynamically amplified when subjected to the wave forces. These jackets need to be designed based on both static and dynamic (stochastic) wave analysis. In addition a fatigue analysis, earthquake analysis (if required) and the temporary installation phase design have to be carried out. It should be mentioned that for fatigue investigation, a stochastic dynamic fatigue analysis may result better than deterministic fatigue analysis.[a.a. Næss-1985] 19
22 2.5 Tubular joints General As it mentioned earlier in this chapter, Jackets are constructed as truss framework in which tubular members are the major constituent of the main structural members. In general, the functionality of the tubes as structural members is quite advantageous. Because of their low drag coefficient, the hydrodynamic forces induced by wave and current are comparatively small. Moreover, due to the uniform and symmetrical cross section, they demonstrate outstanding buckling strength, minimal stress concentrations and no sensitivity to lateral load directions. However, tubular members have lower fatigue strength due to very high stress concentration at the weld toes in the intersection areas. This is because interconnections and joints of the offshore platforms are usually welded and it causes the structural discontinuities. Therefore, proper design of tubular joints against fatigue failure needs to be done. [A.A. Næss-1985] In order to assess the fatigue behavior, a very detailed knowledge of the magnitudes of the stress concentration factors (SCF) and the corresponding values of the peak stresses at the weld toes of the connections should be calculated. Moreover, the empirical data obtained from fatigue test on tubular joints is needed. All these parameters are explained further in this thesis Types of Tubular Joints There are a great variety of shapes and design types for tubular joints. They consist of main and secondary members in which the larger tubes, according to the size, are called chords and the smaller ones in size are denoted as braces. See figure
23 Figure 2.2 Geometrical definitions for tubular joints [DNV-RP-C ] There are a few non-dimensional geometrical parameters related to the figure above which are going to be used later: Diameter ratio β = d/d (2-1) Chord stiffness γ = R/T (2-2) Wall thickness ratio τ = t/t (2-3) Gap parameters P = g/d (2-4) Chord length parameter a = L/D (2-5) In general, tubular joints may be classified in accordance with their geometrical configuration, the action and transfer of loads, and the design types. The design types fall into the following category [A.A. Næss-1985]: Simple welded joints Overlapping joints Complex joints Cast steel nodes 21
24 In this report, only the first category, simple welded joints, will be discussed and for further information about the other groups the reference is made to [A.A. Næss- 1985]. - Simple welded tubular joints If the brace tube is welded to another member without overlapping and without stiffeners or reinforcements, the joint is called simple welded joints which may appear as uniplane or multiplane form. Figure 2.3 shows some typical simple joint: Figure 2.3 Classification of simple joints [DNV-RP-C ] Multiplane joints are often found in the main structure of jacket platforms, while the joints in the secondary structural elements and the bracing between main legs in horizontal planes, consider as uniplane joints. There are different kinds of joints such as K-, X-, Y- joints and etc. which are evaluated in terms of simpler uniplane joints, disregarding the effect of braces which are not lying in the considered planes. [A.A. Næss-1985] 22
25 As it is clear in figure above, the classification of the joints is not only based on the geometry of the joints and the load transfer mode should also be considered. According to [DNV-RP-C ], A joint can be classified as K-joint, if the axial force carried by a brace can be balanced to within 10% by another brace, which is on the same side and in the same plane of the joint, (Figure 2.3 a, d and e). But if the axial force on a brace at a joint is not shared or balanced by other brace in the same joint and if it reacted as beam shear in the chord, it is classified as Y-joint, (Figure 2.3 b) The X-joint classification, for an axial force in a brace is balanced by a brace in the opposite direction (figure 2.3 f). 23
26 24
27 Chapter 3: Loads and Responses of a Jacket Platforms 3.1 Introduction An offshore structure will be subjected to a number of loads and load combinations during its service life. Identification and modeling of all loads, is an important task in the reliability evaluation. These loads may be categorized as following: Permanent Loads (P) Live Loads (variable functional loads) (L) Environmental Loads (E) Deformation Loads (D) Accidental Loads (A) Loads that vary in magnitude and/ or direction will cause stress variations in the structure and may lead to fatigue damage. In this connection, the live loads and the environmental loads are of greater concern. The contribution of the live loads may be dominating the fatigue damage for the equipment such as Cranes, etc., whereas the environmental loads, wave loads in particular, are dominating for the main load carrying part of the structure [A.A. Næss-1985]. Therefore main focus of this section will be on environmental loads and various types of structural responses. In order to find the structural responses of all types of offshore structure, the equation of motion should be solved. All the various terms of this equation and the methods to calculate the motions of the structures will be discussed further in this chapter. 3.2 Environmental Loads General The parameters describing the environmental conditions shall be based on observations from, or in the vicinity of the actual location and on general knowledge about the environmental conditions in the area. In case of relatively shallow water where there are no structural dynamic effects, the parameters mentioned below are usually sufficient for designing the jacket platform. 25
28 wave height (H), wave period (T) and wave direction current velocity, current direction and current profile steady wind velocity, wind direction and wind profile water level variations (tidal, storm surge and potentially field subsidence) However, as it mentioned before by increasing the length of the jacket, additional environmental parameters are needed in further design. For such circumstances the wave spectrum needs to be defined for different sea states, and the relative occurrence rate of significant wave height (Hs) and zero up crossing period (Tz) (or spectral peak period (Tp)) needs to be established. The wave spectra are usually of a single peak type (PM, or JONSWAP), however double peak spectra may also be applicable for some areas. Different wave spectra are discussed in section According to DNV-RP-C203, in the North Sea, the time varying surface waves apply the main loads and they are of major importance in the design of Jacket structures for deep water environments, where the wind loads only represent a contribution of less that 5% of the total environmental loading and it is not common to observe current velocities more than 1 m/s. This causes to raise the response to more than 10% of the total induced environmental force Waves Ocean waves have been described using two different methods: Discrete wave method, which consider the sea as composed of discrete or individual waves, described by their heights H and period T. See Figure 3-1. Stochastic method, which represent the sea in terms of the statistical properties of surface elevation. In both methods, the calculation of wave kinematics is based on regular wave theory and the detailed explanation can be found in references [A.A. Næss-1985], [S.K. Haver-2013] and [R.W. Clough et al.-1975]. 26
29 Regular waves Figure 3.1 Wave characteristics (Adapted from Chadwick et al, 1998) Regular waves are periodic and uniform with a period T and height H. The most important parameters of regular waves are given in figure below. Figure 3.2 regular waves [DNV-RP-C ] There are several different regular wave theories to calculate the important wave parameters such as fluid particle velocity and acceleration around a submerged structure. These theories are listed below. Linear Airy Wave Theory 27
30 Stokes Wave Theory Cnoidal Wave Theory Stream Function Wave theory Solitary Wave Theory Standing Wave Theory In order to determine which wave theory should be applied in a specific problem, these three non-dimensional parameters have to be verified considering the wave height H, the wave period T and the water depth d. Wave steepness parameter: S = 2π H gt 2 = H λ 0 (3-1) Shallow water parameter: S = 2π d gt 2 = d λ 0 (3-2) Ursell number: U r = H2 d 3 = H k 2 0 d 3 = 1 4π 2 U (3-3) R Where λ 0 and k 0 are the linear deep water length and wave number corresponding for wave period T. Having two of the parameters, the third one is uniquely determined using the relation equation below: U R = S μ 3 (3-4) The validity ranges of different wave theories are shown in figure 3-3. In the next part the Airy wave theory has been discussed. The horizontal axis is a measure of shallowness while the vertical axis is a measure of steepness. To investigate about the other theories around reference is made to [DNV-RP-C ]. 28
31 Figure 3.3 Ranges of validity for various wave theories. [DNV-RP-C ] Airy Wave Theory The Airy wave theory which is also referred to as small amplitude wave theory and sinusoidal wave theory is the simplest way to represent a wave. This theory assumes that the wave height is much smaller than both the wavelength and the water depth. Based on the assumption which allows the free surface boundary conditions to be linearized, the surface elevation is considered to be at the mean water level given by: η(x, y, t) = H 2 cos θ (3-5) Where H = 2A and A = A H = A C the wave amplitude. θ = k(x cos β + y sin β) ωt is the phase and is the direction of the propagation. Consequently, the surface profile is given by a sine function: 29
32 η = H 2 sin(ωt kx) (3-6) Where T is a wave period, ω = 2π/T and k = 2π/L The rest of the equations of the wave kinematics related to linear wave theory are given below: Wave length: L = gt2 2π. tanh (2πd L ) = 2π k (3-7) Water particle velocity: u = H 2. gt L w = H 2. gt L a) horizontal component cosh[2π(z + d)/l]. cosh(2π. d/l) b) vertical component sinh[2π(z + d)/l]. cosh(2π. d/l) Water particle acceleration: a) horizontal component. cos(ωt) (3-8). sin(ωt) (3-9) a x = g. π. H L cosh[2π(z + d)/l]. cosh(2π. d/l). sin ωt (3-10) g. π. H a z = L b) vertical component Subsurface pressure sinh[2π(z + d)/l]. cosh(2π. d/l). cos(ωt) (3-11) cosh [2π(z + d)/l] p = ρ. g. η. ρ. g. z (3-12) cosh (2π. d/l) Where H = Wave Height L = Wave length g = Acceleration of gravity η = Water surface elevation 30
33 T = Wave period d = Water depth k = Wave number ω = Angular frequency ρ = Water density z = Distance to water particle from SWL, positive upwards Irregular waves Although, real waves in the ocean does not look like the regular waves and they have irregular forms as shown in Figure 3-1, they can be modelled as a summation of sinusoidal wave components. The wave period of such a sea state are defined as time between successive up-crossing through still water level, whereas the wave heights are defined as the difference between maxima and minima values within the wave periods. [DNV-RP-C ] The simplest way to describe such a sea condition is to consider it as a stationary sea state and it means the statistical properties of the sea state have been assumed to be constant during a short time interval (3-6 hours). Now the theory of stationary stochastic process can be used to represent such a sea state. [A.A. Næss-1985] The following terms are used in the description: Main wave directionθ 0 : The main wave direction denotes the middle direction for each of the sectors, The analysis is only performed for waves in these discrete directions. The sector numbering and main wave directions are shown in Figure 3-4. Figure 3.4 (a) Applied sector numbering, (b) Main wave direction in the structure coordinate system [DNV Report No ] 31
34 The main wave directions are given by a set of prescribed discrete directions. The probability distribution of the main wave direction is given as a discrete distribution with P θ i Probability that the main wave direction is θ i, i=1,2,, N θ Where N θ is the number of possible main wave directions, and N θ P θ i i=1 = 1 (3-13) Characteristic sea state parameters: (Scatter diagram) The scatter diagram gives the occurrence frequency of a discrete number of combinations of H S and T Z, where all the sea states are used to describe the sea environments, see figure 6.3 in chapter 6. The advantage of scatter diagram is to consider the individual periods of each of these sea-states, where waves with same height also have a range of different periods that allows constructing long term distribution fatigue. The wave data are provided on a statistical basis where a cell of the diagram represents a particular combination of the relation between the zero crossing time period T Z, of each block, (which is based on the type of the wave energy spectrum), the significant wave height H S and its probability of occurrence. Significant wave height H S, is the average value of the highest third of the wave heights and the Mean zero up-crossing periods, T Z, is the average value of the wave periods. Wave spectra: Due to the dynamic sensitivity of the deep water jackets to wave forces, the frequency distribution of the random waves becomes a significant wave design parameter and therefore selection of wave spectra is very important. The wave spectrum S(ω) is the power spectral density function of the sea surface elevation which is used to describe the short term stationary irregular sea state. The 32
35 spectra are then parametrized by some statistical feature such as, significant wave height, hs, and spectral peak period, tp. There are basically three mathematical spectral models commonly used, the Pierson- Moskowitz, JONSWAP and Ouchi-Hubble (double peak). Since the use of the Ouchi- Hubble is very limited, in this section only Pierson-Moskowitz and JONSWAP spectra are introduced. See figure 3.5. Pierson-Moskowitz spectrum (PM) This spectrum was originally developed for wave growth unaffected by the size of the generation area called fetch length. This kind of sea condition has been considered as fully-developed sea states. The PM spectrum is applicable for major part of the time in the North Sea and it may be used for most fatigue analyses. [A.A. Næss- 1985] The Pierson-Moskowitz spectrum defined by S PM (ω) = H S 2 4. ω p. ω 5. exp ( 5 4 ( ω 4 ) ) (3-14) ω p Where ω p = 2π/T p is an angular spectral peak frequency. JONSWAP spectrum This spectrum applies when the growth of the waves is limited by the size of the generation area. This is the case for extreme wave condition in the North Sea. The JONSWAP spectrum is given by [DNV-RP-C ] 2 S J (ω) = A γ S PM (ω)γ exp( 0.5(ω ω p ) ) σ.ω p (3-15) Where S PM (ω)= Pierson-Moskowitz spectrum γ = non-dimensional peak shape parameter σ Spectral width parameter { σ = σ a for ω ω p σ = σ b for ω > ω p A γ = ln (γ) is a normalizing factor 33
36 As you can see in the equation 3-15 the JONSWAP spectrum is formulated as a modification of the PM spectrum for a developing sea state in a fetch limited situation. [DNV-RP-C ] Figure 3.5 The Pierson-Moskowitz spectrum and the standard JONSWAP spectrum. It is good to mention that, in order to characterize the moderate and low sea state in open sea areas which often included of both Wind Sea and swell, a two peak spectrum may be used. The Ochi-Hubble (1976) spectrum and the Torsethaugen (1996) spectrums are the examples of this spectrum. [S.K. Haver-2013] 3.3 Equation of motion General The structural response of a platform under hydrodynamic loading such as wind, wave and current is obtained by solving the equation of motion. The dynamic equilibrium equations of the system can be written as: Mx (t) + c(x, x )x (t) + k(x, x )x(t) = F(t) (3-16) Where x is translational or rotational motion. 34
37 x = dx dt is the rate change of response. M= (m+a) is the total mass of the system including added mass. c(x, x ) is damping coefficient associated with the motion degree of freedom. k(x, x ) is stiffness coefficient associated with the motion degree of freedom. F (t) is external load acting on the mass in the direction of the selected degree of freedom. The left hand side of the equation characterizes the mechanical properties of the system, i.e. how the platform respond to the loading, while the right hand side defines the external loading. The loading will of course also be a function of the geometrical properties of the platform, i.e. structure and/or structural member dimensions, spatial distance between members and so on. [S.K. Haver-2013] Although the damping and stiffness coefficient are generally of a non-linear nature, they can be considered as a linear function of x for a wide range of response problems while the results are quite acceptable. Therefore, in general response problems are categorized in two groups: Linear mechanical system, i.e. c(x, x ) = c and k(x, x ) = k Non-linear mechanical system In section 3.4, it is assumed that the damping and the stiffness coefficient are independent of the magnitude of x (t) and x(t) which means the system is a linear mechanical system. Regarding the non-linear mechanical system, reference is made to [S.K. Haver-2013]. It should be mentioned that to simplify the calculation without loosing too much of generality regarding the classification of the structural response, the system will be considered as a single degree of freedom. Although a detailed analysis of most structures requires a much more complex dynamic model which is out of the scope of this report and could be found in [R.W. Clough et al.-1975] and [L. Meirovitch-1986]. 35
38 3.3.2 Linear mechanical system As it mentioned before, the right hand side of the equation of motion defines the external loading. Depending on the assumption for the surface process, the response problem will be classify in groups below:[s.k. Haver-2013] Linear response problem Drag load governed response Second and higher order forcing Slamming induced response Since most Jacket platforms place in the second category, in this report the drag load governed response will be discussed and for the other three categories the reference is made to [S.K. Haver-2013]. - Drag load governed response Since the damping and stiffness forces are considered as linear function, the equation of motion become: Mx (t) + c x (t) + k x(t) = F(t) (3-17) The solution of this equation consist of two part, homogeneous solution, x h, and particular solution, x p. x = x h + x p (3-18) The contribution of the homogenous solution may be larger at the initial time, however it is damped out with time. The equation for this solution is: x h = e λω 0t. (Asinω d t + Bcosω d t) (3-19) Where A and B are constants and they are determined from the initial or boundary conditions. λ is relative damping ω 0 is natural frequency of the system ω d = ω 0 1 λ 2 is damping frequency of oscillating 36
39 On the other hand, as far as the hydrodynamic loads are acting on the structure, the particular solution will exist. According to the nature of external loading, the solution may differ from one to another. Basically there are two types of external loading acting on the offshore structure named arbitrary or harmonic. To determine the particular solution for a structure under the arbitrary external load which is not of concern of this report, the frequency-response method or the impulseresponse method will be used. For detail calculation references are made to [A.A. Næss-1985] and [S.K. Haver- 2013]. If the harmonic type of loading applied on a structure, the external load appeared in equation 3-17, will turn to sinusoidal form as below: F(t) = F 0 sin(ωt) (3-20) Where F 0 is the static loading ω is the frequency of the load Accordingly the particular solution will be x p = x 0 sin(ωt θ) (3-21) Where x 0 = F 0 mω 0 2 D (3-22) And θ = arctg 2λβ (1 β) 2 (3-23) Where θ is the phase angle and it is the phase lag between the excitation (applied force) and the response (displacement) D is the dynamic amplification factor which describes the ratio of contribution of the static load F 0 in the response. 37
40 1 D = (1 β 2 ) 2 + (2λβ) 2 (3-24) Where β is the relative frequency relation between the frequency of the loading, ω and the natural frequency of the system, ω 0, given by β = ω ω 0 (3-25) Equation 3-23 is plotted in figure below. Figure 3.6 phase angle with damping factors According to the graph, some points should be mentioned β = 1 : for all values of the relative damping λ, θ = 90 β < 1 if the relative damping λ 0 θ 0 β > 1 if the relative damping λ 0 θ 180 Figure 3-7 shows dynamic amplification factor, D, as a function of relative frequency based on equation
41 Figure 3.7 Relative response magnitude As it is clear in this figure, when the frequency of the external load (wave) becomes close to the natural frequency, the dynamic amplification factor increases rapidly and has its maximum when they are equal. This phenomenon called resonance. According to the relative frequency the dynamic responses could be categorized in three groups: β 1 : Quasi-statically behaving structure: In this region the dynamic effect is zero or very small because the stiffness of the system has the same phase as loading and they control the dynamics. β 1 : As it mentioned before, in this region the structure is at its resonance and the dynamic effect is very large. The dynamic is controlled by damping which is 90 out of phase with the loading. β 1 : In this region the dynamic is controlled by mass or inertia which is 180 out of phase (opposite direction) with the loading and reduce the response. 39
42 As it can be seen, the important quantity in the linear mechanical system is the natural period of the structure. According to natural period the above group of structures may group in two general classes: Quasi-static structure: if the natural period is less than 2 second, the structure can be studied in this group. In some cases which dynamics getting important, it should be considered by a dynamic amplification factor assuming the structure as a single degree of freedom system.[s.k. Haver- 2013] Dynamically behaving structures: If the largest natural period increases well above 2 seconds, the structure should be considered in this group. The drag term and inertia term in equation 3-17 can not be ignored anymore. Methods to calculate the excitation loads and furthermore solving the equation of motion for this category will be discussed in next sections. 3.4 Morison s Equation General In order to predict wave forces on a vertical slender cylinder per unit length, J.M.Morison (Morison et al., 1950) simply superimposed the linear inertia force (from potential theory and oscillating flows) and the adapted quadratic drag force (from real flows and constant currents) to obtain the following result: F t = F inertia(t) + F drag(t) (3-26) It means the horizontal hydrodynamic force df on a strip of length dz on a body expressed by Morison s equation is: df = ρ πd2 4 dzc Ma 1 + ρ 2 C Ddz u u (3-27) In which the first of these two terms is the inertia force and the second represents the drag force. Where Positive force direction is in the wave propagation direction. 40
43 ρ is the mass density of the water D is the cylinder diameter C M, C D are the mass and drag coefficients u is the horizontal undisturbed fluid velocity. It s equation for infinite depth is: u = ωξ a e kz sin(ωt kx) (3-28) a1 is the horizontal undisturbed fluid acceleration and it s equation for infinite depth reads: a 1 = ω 2 ξ a e kz cos(ωt kx) (3-29) Here ξ a is wave amplitude. Note that in equation 3-27 the drag and inertia force are functions of time and they are 90 out of phase with each other. That is because, in an oscillatory motion, there is a phase shift between velocity and acceleration. Morison s equation is applicable when the wave length L is at least five times more than the diameter of the structural member D. Morison s equation is often used to calculate the hydrodynamic forces (wave loads) on circular cylinder structural members of fixed offshore structures in the drag and inertia regimes.[o.m. Faltinsen- 1990] It is better to find the inertia and drag coefficient by testing in full scale or model scale. It is difficult to get the relevant conditions in a model, and also to perform a full scale test especially in waves. Therefore, there are still large uncertainties associated with the values of the coefficient Coefficient determination of Morison s equation The most important source of loading applied on offshore structures comes from hydrodynamic actions which are influenced by C D and C M values. There are three parameters which influence the mass and drag coefficient in Morison s equation [DNV-RP-C ] 41
44 Where Reynolds number Keulegan-Carpenter number Re = V m. D υ KC = V m. T D (3-30) (3-31) Surface roughness = K/D (3-32) D = diameter [m] T = wave period or period of oscillation [s] K = roughness height [m]. For North Sea conditions a range of roughness from m to 0.05 m may be appropriate, depending on the precautions taken to reduce the growth. [A.A. Næss-1985] v= total flow velocity [m/s] vm= maximum orbital particle velocity [m/s] ν= fluid kinematic velocity [m 2 /s] Various design codes or rules also specify (or suggest) appropriate values for CD and C M. Those published by Det NorskeVeritas 1989 or the American Petroleum Institute (API) are the most widely accepted; the DNV suggestions for design purposes are shown in Figure 3-8. Figure 3.8 Suggested Drag and Inertia Coefficient Values from DNV [J.M.J. Journée et al.-2001] It should be mentioned that, Marine growth is an important parameter to be considered. This will also roughened the surface of the structure and increase the drag coefficient. For more information see [DNV-RP-C ] and [J.M.J. Journée et al.-2001]. 42
45 3.5 Calculate the hydrodynamic forces General In order to calculate the hydrodynamic loading two general methods have been stablished, Deterministic calculation and Spectral method. The spectral method itself has two different approaches including, Regular wave approach and time history simulation. Since in this thesis the time history simulation has been used to calculate the hydrodynamic forces, only this approach will be discussed and for further information about other methods references are made to [A.A. Næss-1985], [S.K. Haver-2013], [DNV Report No ] and [J.M.J. Journée et al.-2001] Time domain analysis In order to solve the equation of motion for a non-linear problem where a proper evaluation of dynamics needs to be done, a very convenient approach is time domain analysis. This would specially be the case if the mechanical system can be assumed to be of a linear nature while the loads consider being non-linear. This is often applied for the structure with a largest natural period exceeding 2-3 second or more. Considering a one-degree-of-freedom formulation of equation of motion, the hydrodynamic forces on individual members were computed by the Morison s equation in which the integration of the forces was performed over the instantaneous wetted length. The total force at each time step is obtained by summing the forces on the individual members and applied on structure. Incident wave kinematics was calculated by using Airy wave theory. Then the structural response at each time step is calculated using a numerical integration procedure and a time history of response is thus obtained. Further in this thesis the distribution of response amplitudes will be obtained directly from the time history using the Rainflow technique. [S.K. Haver- 2013] [O.M. Faltinsen-1990] Here is a brief explanation of the various steps of a time domain analysis. For more detailed information and examples the reference is made to [S.K. Haver-2013]. The equation of motion for a single degree of freedom system written as: 43
46 mx (t) + cx (t) + kx(t) = F(t) (3-33) Assuming x i = x(t i ), x i = x (t i ) and x i = x (t i ) is known, the relation reads x (t) = dx dt dx = x tdt (3-34) x (t) = dx dt dx = x (t)dt The goal is to solve the dynamic equilibrium and find the displacement at the next step forward from t to (t + τ) i.e. x(t + τ). The dynamic equilibrium for next step may be written as: mx (t + τ) + cx (t + τ) + kx(t + τ) = F(t + τ) (3-35) Assuming τ being infinitely small, the acceleration can be assumed to be constant between steps and equal to: x (τ) = 1 2 (x (t) + x (x + h)); t τ t + h (3-36) Where h is the length of each step Knowing the acceleration over the next step, the speed and the displacement can be determined according to equation t+τ x (t + τ) = x (t) + x (ε)dε t+τ x(t + τ) = x(t) + x (ε)dε t t By introducing equation 3-36 to equation 3-37 the velocity can be calculated: (3-37) (3-38) x (t + τ) = x (t) + 1 (x (t) + x (t + h)) 2 dε t t+τ = x (t) (x (t) + x (t + h))τ (3-39) Subsequently, we introduce equation 3-34 to equation 3-38 to get the displacement: x(t + τ) = x(t) + t t+τ [x (t) + 1 (x (t) + x (t + h))ε] dε 2 = x(t) + x (t)τ (x (t) + x (t + h))τ2 (3-40) 44
47 3.5.3 Structural damping [FATAL User s Manual] For the structural cases which have entered to their nonlinear behaviour range the equation of motion of the structure should be solved directly and the modal procedure is of no use anymore. To solve the equation of motion the mass, stiffness and stiffness matrices of equation (3-33) should be known. Damping is difficult to model correctly because an oscillating system consist of different types of damping. Various methods for approximating the correct damping exist and give satisfactory solutions. Rayleigh damping (Rayleigh, 1954) is a special case of which known as proportional damping or classical damping model expresses damping as a linear combination of the mass and stiffness matrices, that is, C = α 1 M + α 2 K (3-41) Here α 1 and α 2 are the Rayleigh damping coefficients. Using the assumption of the linear viscous damping in structures focusing on Rayleigh damping (equation (3-41)) the damping matrix can be defined as a function of mass and stiffness matrices. The damping ratio for the nth mode of such a system is: ζ n = α 2 1 ω n + β 2 ω n (3-42) The coefficients α and β can be determined from specified damping ratios ζ i and ζ j for the i th and j th modes, respectively (Chopra, 2007). 1 ωi ω i 1 2 [ ] { α ω β } = {ζ i ζ } j j 1 ωj (3-43) The procedure introduced by Hall (2006) is convenient for determining α and β. Selecting a desired amount of damping and a frequency range of ϖ to Rϖ covering those modes of interest, R>1, Δ can be computed; 45
48 1 + R 2 R Δ = ζ 1 + R + 2 R (3-44) Where Δ determines bounds on the damping ratios that are imparted to those modes within the specified frequency range. The modes in the given frequency range will have a damping ration bounded between ζ + Δ and ζ Δ. α and β can be calculated from: 2R α = 2ζω 1 + R + 2 R α = 2ζ 1 2R ω 1 + R + 2 R (3-45) And it can be used to compute an actual damping value for nth mode from equation (3-42) if ω n is known. Figure 1 shows a comparison between different choices of R with a given ζ =%10. In this figure ω =1 for all cases. Figure 3.9 Actual damping ratio as a function of frequency[fatal User s Manual] It can be shown that larger R results in larger Δ which is of less desire. This means that although we may like to choose a larger R to cover a larger range of frequencies but it results in larger Δ which decreases the accuracy of the damping ratio used as the basis of formation of the range. For R=3, although a small range of frequency is covered, the fluctuation between maximum and minimum damping in this range 2 Δ= , which results in ζ max ω=1.3 = and ζ min ω=ω + 3=2.7 = which are close to ζ = %10, for R = 15 on the other hand the frequency 46
49 range covered is a large one but the difference between maximum and minimum damping is 2Δ = which result in ζ max ω=1.15 = and ζ min ω=ω + 15=4.87 = which have relatively large divergence from ζ = %10. As a result it s better to use to close frequencies to enter equation (3-44). 3.6 Local Stress Calculation of Tubular Joints General Using the global FEM analysis discussed in [A. Næss-1985] the magnitude of displacement of each end of the beam can be obtained. the load cases are as follow: Axial forces Bending moments, in and out-of-plane Torsional forces Shear forces In order to investigate the fatigue life of the tubular joints, the axial forces and in/outof-plane moments are used to calculate the nominal stresses in the braces, Figure below. While, neglecting the effect of the torsional moments and shear forces in fatigue assessment of the jackets is a common approach. [DNV Report No ] Figure 3.10 Axial forces, in and out-of-phase bending moment Each load case has its particular distribution of stresses along the intersection line and thereby its particular influence on the fatigue life. The method to evaluate the nominal stresses at each ends and combined effect of the load cases are discussed further in this thesis. 47
50 3.6.2 Stress Concentration Factor for Tubular Joints The stresses at the intersection of welded tubular joints are not equally distributed. Regardless of the type of joints, large stress concentrations are formed along the welds which cause an extreme rise to the local stresses compare to nominal stresses at certain point. These points located at the weld toe are called hot-spots and here defined as: the greatest value around the brace/chord intersection of the extrapolation to the weld toe of the geometric stress distribution near the weld [DNV Report No ]. In a very simple word, hot-spots are the locations or points where the highest stresses occur. See figure below. Figure 3.11 Extrapolating of the geometric peak stress to the weld toe (chord side) In welded joints two different sets of hot-spots can be observed at the weld toe. One set at the brace side and the other at the chord side. Depending on the design and the geometry of the joint, the maximum stress value may be found on either the chord side or the brace side. The Stress Concentration Factor (SCF) is employed to scale the nominal stresses from the global analysis to account for local geometrical effect. This factor and its corresponding magnitudes of the hot-spot stresses are the most important parameters to decide the fatigue strength of tubular joints. There are tables and equations to calculate the stress concentration factors for simple tubular joints given in [A.A. Næss-1985] and [DNV-RP-C ]. 48
51 3.6.3 Superposition of stresses in tubular joints The stresses are calculated at three different points as below: At the crown At the saddle At the intermediate points between the saddle and the crown At the crown and saddle points, the hot spot stress is obtained by summation of the single stress components from axial, in-plane and out of plane action.(see figure 2.2) The hot spot stresses at the third group of points, may be higher and is derived by a linear interpolation of the stress duo to the axial action at the crown and saddle and a sinusoidal variation of the bending stress resulting from in-plane and out of plane bending. [DNV-RP-C ] Thus the hot spot stress should be evaluated at 8 spots around the circumference of the intersection as below: (see figure 3.12). σ 1 = SCF AC σ x + SCF MIP σ my (3-46) σ 2 = 1 2 (SCF AC + SCF AS )σ x SCF MIPσ my SCF MOPσ mz (3-47) σ 3 = SCF AS σ x SCF MOP σ mz (3-48) σ 4 = 1 2 (SCF AC + SCF AS )σ x SCF MIPσ my SCF MOPσ mz (3-49) σ 5 = SCF AC σ x SCF MIP σ my (3-50) σ 6 = 1 2 (SCF AC + SCF AS )σ x SCF MIPσ my SCF MOPσ mz (3-51) σ 7 = SCF AS σ x + SCF MOP σ mz (3-52) σ 8 = 1 2 (SCF AC + SCF AS )σ x SCF MIPσ my SCF MOPσ mz (3-53) Where σ x is the nominal stresses due to axial load σ my is the nominal stresses duo to in-plane bending 49
52 σ mz is the nominal stresses duo to out-of-plane bending SCF AS is the stress concentration factor at the saddle for axial load SCF AC is the stress concentration factor at the crown for axial load. SCF MIP is the stress concentration factor for in-plane moment. SCF MIP is the stress concentration factor for out-of-plane moment. Figure 3.12 superposition of stresses Influence functions may be used as an alternative to the procedure given here to calculate hot spot stress. See e.g. Combined Hot-Spot Stress Procedures for Tubular Joints, ref. [J. Buitrago et al.-1984] and Development of SCF Formulae and Generalized Influence Functions for use in Fatigue Analysis ref. [M. Efthymiou- 1988]]. 50
53 Chapter 4: stress range distribution 4.1 General The fatigue strength is expressed in terms of the number of stress cycles Nof stress range S leading to failure. Statistics for the number of stress cycles and the stress range distribution must consequently be produced from the statistical description of the hot-spot stress process, i.e. a stress range distribution should be fitted to the stress range and the corresponding stress cycle. 4.2 Cycle counting methods General Time domain fatigue analysis results in time-series of stresses. For narrow-band Gaussian process, the cycles are well defined, while for more general stress-time histories, wide-banded response, there is no strict relationship between the stress cycles, stress maxima and stress minima. There are three different procedures in order to describe the fatigue damage for a wide band process as below: Cycle counting algorithm Semi-empirical solution, or Simplified analytical solutions More detail about the wide band process can be found at DNV-RP-F204. In this thesis only the cycle counting method is discussed. The fatigue damage may be obtained by counting the stress cycles in the actual or simulated stress-time histories. Specials purpose counting algorithms have been developed with techniques applicable to non-gaussian stress time histories. The cycle counting methods can be used to count the stress cycle in the actual or simulated stress-time histories. In general four different counting algorithms have been developed as below: Peak counting 51
54 Range counting Level-crossing counting Rainflow counting From the stress time histories, peaks and valleys are identified. Using methods above, the effective stress range can be also identified and grouped. There are cons and pros to utilize each method but as it recommended in many references (e.g. ASTM and DNV) Rainflow counting (RFC) method is the most suitable for marine structures. A detailed description for other method can be found in (Madsen et al. (1986)) Rainflow counting method By applying the RFC method, the estimation of the stress probability density function can be established (i.e. sample estimate of f(s) and the average number of stress cycles per unit time N.) and subsequently be applied in order to estimate of fatigue damage in each stationary short-term condition. The RFC method is explained in steps as below [ASTM E ]; 1. Reduce the time history to a sequence of (tensile) peaks and (compressive) troughs. 2. Imagine that the time history is a pagoda. 3. Turn the sheet clockwise 90, so the starting time is at the top. 4. Each tensile peak is imagined as a source of water that drips down the pagoda. 5. Count the number of half-cycles by looking for terminations in the flow occurring when either: a) It reaches the end of the time history b) It merges with a flow that started at an earlier tensile peak; or c) It encounters a trough of greater magnitude. 6. Repeat step 5 for compressive troughs. 7. Assign a magnitude to each half-cycle equal to the stress difference between its start and termination. 52
55 8. Pair up half-cycles of identical magnitude (but opposite sense) to count the number of complete cycles. Typically, there are some residual half-cycles. There are a few examples which are very useful to understand the method in reference [Wikipedia]. 4.3 Short-Term stress range distribution Based on the work of Dong, et al. [W.B. Dong et al.-2011], a Short-term distribution of hot spot stress ranges obtained in previous chapter may be fitted on either the 2- parameter Weibull function or the generalized gamma function. Although the Generalized gamma function is slightly better, the Weibull function will be employed (because of the simplicity) to fit the Short-term distribution of the wave-induced hot spot ranges. Two parameter cumulative Weibull distribution function reads: F S (s) = 1 exp { ( s A ) B} (4-1) Where s is the stress range extracted from time history A is the shape function B is the scale parameter In order to investigate if the data set is well fitted by Weibull pdf, the Weibull plot technique (Nilson et al, 1982) will be used. The Weibull plot has special scales that are designed so that if the data do in fact follow a Weibull distribution, the points will be linear (or nearly linear). The least squares fit of this line yields estimates for the shape and scale parameters of the Weibull distribution. If s calculated from the equation 4-1 the equation can be written as below: S = A. [ ln(1 F s (s))] 1 B (4-2) 53
56 It should be mention that, the shape parameter is the slope of the fitted line and the scale parameter is the exponent of the intercept of the fitted line. The Weibull distribution also has the property that the scale parameter falls at the 63.2% point irrespective of the value of the shape parameter. The plot shows a horizontal line at this 63.2% point and a vertical line where the horizontal line intersects the least squares fitted line. This vertical line shows the value of scale parameter. Figure below Figure 4.1 sample Weibull paper plot. Later in this project, Weibull parameters will be used to calculate the total fatigue damage using closed form approach. 54
57 Chapter 5: Fatigue of tubular joints 5.1 Introduction In general, fixed offshore structures are subjected to different source of loads as below: Wind Current Earthquake Wave These environmental sources apply cyclic loads on the structure which cause the time-varying stresses. For jacket structures, wave and earthquake are the most important sources of excitation loads. However, earthquake loads are only taken into account in the analysis of structures close to, or within tectonic areas which is not of concern here. Wind and current loads represent an insignificant contribution to the fatigue loading and may be ignored in the fatigue analysis of jacket structures. [DNV Report No ] Fatigue is the accumulation of the damage in the material which is experiencing the fluctuation stresses caused by time-varying loading. Thus when the accumulated damage pass the critical level the fatigue failure will occur. There are two types of fatigue process, including low-cycle and high-cycle fatigue. Most of the offshore structures undergo the fluctuating nominal stress below the yield strength with the cycle number larger than 10e4 which is called high-cycle. [DNV Report No ] Unlike the un-welded component (e.g. seamless pipe) which the fatigue crack initiation period may exceed 95% of the fatigue life and is highly related to material tensile strength The fatigue life of the welded joints is mostly carried out in the fatigue crack propagation phase and they are relatively unaffected by material tensile strength. However changing the materials and environments can change the propagation rates without any consistent trend with regard to tensile strength. [DNV- RP-C ] 55
58 Moreover, tubular welded member which are the main structural elements in the offshore steel structures, represent a very high stress concentrations in the intersection areas because of the structural discontinuities at the joints and interconnections. Therefore, In order to assess the fatigue strength in tubular joints, very detailed knowledge about the parameters mentioned below is crucial. Magnitude of Stress Concentration Factor (SCF) Values of the peak stresses at the weld toes of the connection Empirical data obtained from fatigue test on tubular joints 5.2 Fatigue life estimation Figure 5.1 Stress distributions in a tubular joint Fatigue analysis of offshore structures can be described as a calculation procedure which starts with calculation of responses generated by environmental loads in hot spot regions, and ends with fatigue damage estimation. The link between the waves and the fatigue damage estimate is formed by mathematical models for the wave forces, the structural behaviour and the material behaviour. Therefore, the probabilistic fatigue analysis may be divided into four main steps: 1) Probabilistic modelling of the environmental sea states (short or long-term modelling) 2) Probabilistic modelling of the wave loading 3) Structural response analysis (global and local) 56
59 4) Stochastic modelling of fatigue damage accumulation. The first three steps are previously covered in this report. In the following, the Stochastic accumulated fatigue damage is discussed. In order to calculate the Fatigue capacity of a structural detail, two common methods can be applied, crack growth propagation and S-N curve approach. Assuming the structure without initial cracks and subjected to a constant frequency and amplitude loading, the application of S-N curve can be used to provide the fatigue life. Fatigue life prediction based on S-N curves, involves neoconservative errors because, a significant portion of total fatigue life may consume in the crack initiation phase and its effect has not been considered in this method. Another additional source of uncertainties is the variation of loading parameters. Since the inspection of the installed jacket platforms under the water is difficult, it is essential to consider the largest possible initial flaw for calculating the fatigue life. Fatigue life prediction based on Fracture mechanics approach though, considers the inherent initial crack size along with the variation in the stress ranges in an approximate manner. Even though the uncertainty associated with the application of S-N curve may not be large in comparison to those of hydrodynamic loadings and foundation characteristics it may be of interest to study the result obtained by two different analytical tools, the S-N approach and the fracture mechanics approach.[a. Gupta et al.-1986] In this report though only the S-N approach has been discussed. 5.3 Fatigue assessment by S-N Approach (Miner-Palmgren) The fatigue damage is expressed by means of an experimentally determined S-N curve. S-N curve is obtained from fatigue tests of a specimen and relates the applied stress range to the number of cycle to fracture of the metal. Most S-N plots are based on constant amplitude loading and consist of two different slopes. Figure
60 Figure 5.2 Basic definitions for two-slope S-N curves [DNV-RP-F ] In general the equation of the bilinear S-N curve reads: log N = log a 1 m 1 log S S > S SW log N = log a 2 m 2 log S S S SW (5-1) Or equivalently: N = a 1S m 1 S > S SW N = a 2S m 2 S S SW (5-2) Where m 1 and m 2 are fatigue exponents (inverse slope of the bilinear S-N curve) and a 1 and a 2 are characteristic fatigue strength constant defined as the meanminus-two-standard-deviation curve. S SW is the stress at intersection of the two slope S-N curves given by: S SW = 10 (log(a 1) log(n SW ) m 1 ) (5-3) N SW Is the number of cycles for which change in slope appears. log(n SW ) Is typically 6-7. For further details see DNV RPC203. To calculate the fatigue damage of a joint, the Palmgren-Miner rule will be applied using the S-N curve. This rule is stated that: the number of cycles applied at a given stress level is proportional to the life expended. When the total damage by this concept reaches 100 percent, the fatigue specimen should fail. Miner s rule is based on linear accumulation of damage and is expressed as: 58
61 S SW D = n(s i) + n(s i) N(S i ) N(S i ) 1 Or equivalently, S SW D = 1 S SW n(s i) a 1S m 1 + S SW n(s i) a 2S m 2 (5-4) (5-5) 5.4 Fatigue assessment by S-N Approach (Closed Form) The fatigue damage given by equation (5-4) is for particular sea state. The short term fatigue damage in each stationary environmental condition is: D = n(s i) N(S i ) i = f S(S) S i N T m a 2S 2 + i S SW S SW 0 f S (S) S i N T a 1S i m 1 (5-6) Assuming S i goes to zero, the corresponding expression for a bi-linear S-N curve in log-log scale becomes: D = N T a 2 S SW S m 2f S (S)ds + a 1 0 N T S m 1f S (S)ds (5-7) S SW Where N T is the total number of stress cycle per each 3-hour, and f S (S) is the probability density function (PDF) for the stress ranges. As it is mentioned in chapter 4.3 The Weibull distribution function is usually a good approximation. [DNV Report No ] f S (S) = exp [ ( S A ) B ]. ( B A ) (S A ) B 1 (5-8) Where S is the stress range, A and B are Weibull distribution parameters. By substituting equation (5-8) to (5-7) 59
62 D = N T a 2 S SW S m 2exp [ ( S A ) B ]. ( B A ) (S A ) B 1 ds 0 + N T a 1 S m 1exp [ ( S A ) B ]. ( B A ) (S A ) B 1 ds S SW (5-9) In order to make this equation shorter, gamma function can be used; Γ(n) = exp ( t)t n 1 dt 0 (5-10) Assuming: ( S A ) B = t ds = ( AB B ). (At B) 1 1 B dt (5-11) We can rewrite the equation (5-9) by using gamma function: D = N T A m 2γ [1 + m 2 a 2 B ] + f 0 A m 1Γ [1 + m 1 a 1 B ] (5-12) In order to calculate the total fatigue damage accumulation from all sea states, all the damage given by equation (5-6) and their probability of occurrences should be add together as below: N s D fat = D i P i i=1 (5-13) Where D fat is the Long-Term fatigue damage N s is the number of discrete sea states in the wave scatter diagram P i is the sea state probability. Normally parametrised in terms of significant wave height and peak period. D i is the short term fatigue damage given in equation (5-12) 60
63 5.5 Uncertainties in analysis of Fatigue life The fatigue life predictions involve many different type of uncertainties which have been affected the damage values in this project. In general the uncertainties included in the structural reliability analysis are because of[dnv Report No ]: The gross errors which may occur in real life does not included in the reliability analysis. In addition to physical uncertainty which is present in real life, the reliability analysis includes statistical uncertainty and model uncertainty as well. The uncertainty in the probabilistic model may occur due to distribution tail assumption. Since the main goal of this report is to find the worst sea state according to fatigue damage, the values of the damages are not of a major concern, therefore here we just mention the main sources of uncertainties. But for the further work, In order to reduce the level of uncertainty and being closer to the target reliability the references are made to [A.A. Næss-1985] [DNV Report No ] [DNV Report No ]. The Uncertainty is grouped in three major groups: Uncertainty in load calculation: - Main wave direction - Wave scatter diagram - Wave energy spreading function - Wave spectrum model - Selection of the wave theories - Hydrodynamic coefficients Uncertainty in response calculation - Global structural analysis - Local structural analysis - Calculation of stress concentration factors - Selecting the pdf of stress ranges Uncertainty in S-N data - Selection of S-N curve - Corrosion protection 61
64 62
65 Chapter 6: Case study, Result and Discussion 6.1 Introduction This chapter involves the fatigue analysis of a specific fixed steel Jacket platform called Kvitebjørn, located in relatively deep water at North Sea, subjected to random sea waves. Following, the more detailed topics which are presented in this part and the assumption used in this project, are pointed out: 1- Introducing the Kvitebjørn jacket. 2- Calculating natural frequencies. 3- Extract the scatter diagram from the actual sea states (NORA 10). 4- Calculating the excitation loads, global and local responses using USFOS. 5- Calculating the free surface elevation using the actual data and apply FFT to obtain the wave spectrum. 6- Find the proper coefficient (C D and C M ) to use in Morison equation from DNV. 7- Calculating the hotspot stresses at the joints using FATAL. 8- Calculating the Fatigue Damage (S-N approach/miner-palmgren) using FATAL and discussing about which sea state yield the dominating contribution to fatigue. 9- Calculating the stress ranges and the number of cycles (Rainflow method) using MATLAB. 10- Calculating the Fatigue Damage (S-N approach/miner-palmgren) using MATLAB. 11- Fitting the results from 6 on the Weibull probability distribution function. 12- Calculating the Fatigue Damage (S-N approach/closed Form) using MATLAB. 13- Comparing the results obtained from 5, 7 and Uncertainties involve in this report. And the assumptions are as below: The structure s model is adopted from project in course tmr The hind cast data presented in NORA 10, is valid for this report. The structure is fixed at the sea bed. 63
66 free surface boundary considered as linear (Airy wave theory) Sea states is stationary The structure is considered as a one degree of freedom linear mechanical system. The waves propagate in one direction for all sea state and it is equal to zero according to the local coordinate system. The current speed is equal to zero. The sea states with Hs less than 5 meter do not have any contribution in fatigue damage. 6.2 Kvitebjørn jacket The Kvitebjørn jacket was designed for installation in North Sea in 190 m water depth. The jacket was installed in 2003 in two pieces, the bottom section with the dimension of 50m 50m extends to elevation (-)143 m and the top section with the dimension gradually reaches to 25m 20m at the top of the jacket. As it is shown previously in the Figure [1-1] the jacket has topside with a rectangular deck shape and tons weight. Figure 6.1 Strain gauges at main legs and diagonal braces at elevation -108m [O.D. Økland-2010] 64
67 In order to monitor all the structural responses i.e. axial force and in/ out of plane bending moment, several Strain gauges have been installed on all the diagonal bracing above the elevation (-) 108. (Figure 6.1) Further in this report we used The name convention for vertical diagonal braces and columns between the elevation (-)74 to (-)108, adopted from Øle David s report [O.D. Økland-2010], which are shown in Figure 6.2. Figure 6.2 Name conventions for vertical diagonal bracings between elevation -108m and -74m. First step to investigate how the structure does behave I,e., quasi-statically or dynamically, we need to calculate the natural frequency of the jacket. In general the natural frequency is calculated as below: ω N = 2π T n = k m rad/s (6-1) Where T n is the natural period, k is the total stiffenes of the structure and m is the total mass of the structure. At the design phase the largest natural period has been calculated to be around 5s, but after one year operation the measured natural period is turned out to be about 4s. Hence, the soil stiffness was increased to obtain a realistic frequency in the calculations. Using the modified numerical model time series of structural response 65
68 were calculated using measured wave elevation as input. A comparison of calculated and measured response for selected events showed that generally the agreement was fair, but for some large events a significant deviation between calculated and measured responses were observed. In this report calculation of the Eigen periods have been executed using USFOS software and the result is shown below: Table 6-1 Natural periods in 6 different modes T 1 T 2 T 3 T 4 T 5 T 6 4,50 4,47 1,14 1,14 1,00 1,00 Due to the relatively high Eigen period, nonlinear dynamic responses at the natural period of the structure were expected to have some effect on the fatigue life of the jacket. As it is mentioned before, in fatigue simulation (FLS) where the structure behave dynamically, the true surface level, buoyancy effects, hydrodynamic damping and other nonlinear effects become significant. Therefore the best prediction of «reality» gains by time domain simulation of irregular waves. [USFOS Theory description-2010] 6.3 Response calculation using USFOS Introduction USFOS is a numerical tool for ultimate strength and progressive collapse analysis at space frame structures. The formulation includes nonlinear geometry and nonlinear material properties. The basic idea of the program is to use only one finite element per physical element of the structure, i.e. to use the same finite element discretization as in linear, elastic analysis. [S.K. Chakrabarti-2005] The USFOS nonlinear analysis follows the following basic procedure: The load is applied in steps The nodal coordinates are updated after each load step 66
69 The structure stiffness is assembled at each load step. The element stiffnesses are then calculated from the updated geometry. At every load step each element is checked to see whether the forces exceed the plastic capacity of the cross section. If such an event occurs, the load step is scaled to make the forces comply "exactly" with the yield condition. A plastic hinge is inserted when the element forces have reached the yield surface. The hinge is removed if the element later is unloaded and becomes elastic. The load step is reversed (the load is reduced) if global instability is detected. In order to introduce the environmental loads to USFOS, the sea state should be specified. In the present study the hindcast data of NORA 10 is assumed to be valid. Time domain analysis has been done using the USFOS for almost 70 (3-hour) sea states which have the significant wave height more than 5 meter. Since the goal is to find the worst sea state according to fatigue strength and not the real value of fatigue, it can be assumed that all the waves propagate in one direction which is a very conservative assumption but at the same time does not affect the conclusion. Moreover, by this assumption and taking the direction equal to zero we are not able to consider the contribution of all 8 braces at the same time i.e., just 4 braces are going to handle all forces during the life span which is again a very conservative assumption. Ole David Økland, assumed the sea state with zero current speed which is the same here. As it is mentioned in section 3.2.2, Airy wave theory is a good approximation to represent a wave in order to calculate the important wave parameters such as fluid particle velocity and acceleration around a submerged structure. USFOS has a predefined wave data, which includes the Airy wave theory. Alongside the theory some other parameters have to be specified in the input file. These parameters are extracted and shown in this report. All the input files (i.e. head, model and the scripts for run all the cases) used for USFOS are exist in appendix. 67

70 6.3.2 Scatter diagram The hindcast data presented in NORA 10, calculated for 1957 to 2013 for latitude 61.2 and longitude The data are presented as an omnidirectional scatter diagram in Figure 6.3. The high lighted blocks are the chosen sea states to calculate the fatigue for. Since the sea states with Hs less than 5 meter do not have a significant contribution in fatigue, all the blocks with Hs larger than 5 meter has been investigated. Figure 6.3 Omnidirectional scatter diagram, Energy Wave Spectrum: [USFOS Theory description-2010] In section 3.2, two different types of wave energy spectra have been discussed. in this report the JONSWAP model has been used which according to [S.K. Haver- 2013], is adequate for sea states located not far away from the relation given by Torsethaugen(2004): t p0 = 0.78f e h s (6-2) Where f e is the proper effective fetch which is equal to 370 km. In order to check the validity of JONSWAP for this project, a time history of an actual sea state should be adopted and after applying FFT, the spectrum should be 68
71 compared with the JONSWAP. This procedure has been done in MATLAB for an actual surface elevation and the result illustrated below Figure 6.4 The actual surface elevation and its corresponding wave spectrum. For integration of the spectrum two methods are available [USFOS Theory description-2010], 1) A constant angular frequency width is used, i.e. ω u,j ω λ,j = ω = ω u ω λ N (6-3) Where ω u and ω λ are the upper and lower limit for integration of the wave energy spectrum. 2) The angular frequency limits are adjusted so that each component contains the same amount of energy, i.e. ω u,j a j = 2 S(ω)dω ω λ,j = 2 ω u S(ω)dω ω N = Constant (6-4) This implies that all wave components have the same amplitude. In order to get larger density of the wave component where there is larger wave energy, we used the second option as an input for representing the spectrum. Both methods are illustrated in figure below: 69
72 Figure 6.5 Illustration of irregular sea state generation Morison s equation coefficients Drag and inertia coefficient applied in this project are proposed in DNV-RP-C205 [DNV-RP-C ] for non-gaussian irregular wave analysis, and they are specified as function of depth. Drag coefficient 1.05 for below (+) 2 m, and 0.65 for above (+) 2 m Inertia coefficient 1.20 for below (+) 2 m, and 1.60 for above (+) 2 m Figure 6.6 Morison coefficients over the height of the jacket Structural damping In the Kvitebjørn jacket model the structural damping was introduced as Rayleigh damping with 1.5% for first and third natural frequencies and presented in Table 70
73 below. Based on these values it is possible to calculate the Rayleigh damping coefficients and calculate the damping ratio at any arbitrary excitation frequency. [1] Table 6-2 Structural Damping Natural period (s) Frequency ω (s -1 ) Damping Ratio λ USFOS Results 4,50 0,222 0,15 1,14 0,877 0,15 In general, the main results of a USFOS analysis are as follow: Ultimate collapse load or critical collapse temperature Energy absorption Load displacement relations at any nodal point Element forces at all load levels Formation of plastic hinges Redistribution of forces And the results are presented in the following way: As plots and images, presented by the graphical post-processor XFOS As printed tables, presented by the POSTFOS module As analysis print-out on the Analysis Print File generated by USFOS during the analysis As on-line print-out to terminal or batch-output stream In this project, only the dynamic results is of interest, but for being able to check the validity of our input files (head and model file) at the early stage the analysis explained below have been done. Having the information and assumption like the wave theory and given spectrum with specific significant wave height and peak period, USFOS is able to run quasi-static analysis and represent the surface elevation, Total wave load, Overturning moment and base shear reaction. Because of the very long length of the time period (3 hours), the graphs are not very clear especially for time series graphs. Thus here, 71
74 samples of 1200 seconds for case which H S = 7.5 and T P = 14.5 showed in the figure 6.7 to These graphs are imported from USFOS. Figure 6.7 Surface elevation 72
75 Figure 6.8 Total wave load 73
76 Figure 6.9 Overturning moment reaction 74
77 Figure 6.10 Base shear 75
78 Figure 6.11 Element axial force 76
79 Figure 6.12 element in-plane bending moment 77
80 Figure 6.13 element out-of-plane bending moment 78
81 6.4 Damage calculation using FATAL (Miner-Palmgren) Introduction USFOS offers a beta release for fatigue assessment. The beta is mainly connected with the relatively low level user interface (text based input, no graphical user interface with a fatigue button). This Utility tool for fatigue estimation is called FATAL. [FATAL User s Manual] The fatigue simulation involves several steps, which are listed in brief below: Create the analysis model of the actual problem, (dynamic simulation), and specify joints (connections) to check for fatigue. USFOS will identify (automatically) the actual force time histories to store for the succeeding fatigue post processing. 2. Run USFOS for the actual case(s), and the results will be stored on the.dyn file 3. Define the actual SCF s and specify actual SN-curve(s) in a input file for the tool FATAL. 4. Run FATAL for the actual case(s). Each FATAL analysis produces a damage file (extension.dam), which is a readable ASCII text file. This text file contains part damages, (for the actual simulation time), for all connections, 8 (clock) positions for each connection. FATAL has predefined S-N curve according to DNV which should be specified as a three word in the input file called control file. In this project the S-N curves for tubular joint in seawater with cathodic protection has been used. (NORSOK T SEA_CAT). The control file used for FATAL, reported at the appendix B Stress Concentration Factor SCFs for the braces/joints, as established in design can be found in [O.D. Økland- 2010]. Geometry data and SCFs for joints with instrumented braces are shown in Table
82 Table 6-3 Geometry data and SCFs for joints at EL (-)108 Brace Leg Element End Point Side D t (t/tref) k SCF AC SCFAS SCF IPB SCF OPB ID ID A1A2 A Chord Brace A1B1 A Chord Brace A2A1 A Chord Brace A2B2 A Chord Brace B1B2 B Chord Brace B1A1 B Chord Brace B2B1 B Chord Brace B2A2 B Chord Brace FATAL Results Using the dynamic results extracted from USFOS alongside the FATAL control file including all the SCF s and S-N curve, we get a text file as a result. This file includes the total number of cycles, maximum stress range and total damage in 8 points around the hot spot circle and the time histories of stresses in those points. Figure 6.14 shows 3-hour damage(largest damage value between 8 hotspot) in each sea state block for each brace and Figure 6.15 Represent the accumulative damage (3-hor damage multiply by the number of occurrence between ) for all H S and T P. It is observed that, all four braces have the same general behavior but with the slightly different values (Figure 6.14). The reason for the inequality is; in the model used for this project the thickness of column (A1) is 5 cm less than the other 3 columns which cause an unsymmetrical load contribution. 80
83 Significant Wave Height Hs (m) Hour A1B1 0, ,0001 0, ,0003 0,0004 Significant Wave Height Hs (m) 3-Hour A2B2 0, ,0001 0, ,0003 0,0004 0, Peak Period Tp (s) Peak Period Tp (s) Significant Wave Height Hs (m) Hour B1A1 0, , , , , , ,00030 Significant Wave Height Hs (m) 3-Hour B2A2 0, , , , , , Peak Period Tp (s) Peak Period Tp (s) Figure hour damage for each sea state As it is shown in this graph, for the Hs larger than 11.5 we get the maximum damage in 3 hour which seems reasonable, because according to the Morison s equation discussed in chapter 3.5 and equation 3-28 and 3-29, wave amplitude is an effective parameter in excitation force and in those sea states the waves apply very large loads on the structure. But it is known that damage is the cumulative result of large number of repeated action of applied stresses. So considering the scatter diagram, the number of occurrence of these kind of sea state (Hs larger than 11.5) is so low which make the total contribution very small. The total accumulative damage for each block (sea state) which is equal to the 3- hour damage multiply by the number of occurrence in 57 years is shown in figure
84 It is noticeable that, despite the outcome of figure 6.14 (3-hour graph), the damage (according to H S ) is very small for H S 11.5 compare to the damage values at the interval 7.5 H S 9.5 which are the sea states with the highest probability of exceedance. Significant Wave Height Hs (m) Accumularivr Damage A1B1 0, , , , , , ,0030 0,0035 Significant Wave Height Hs (m) Accumularivr Damage A2B2 0, , , , , , ,0030 0,0035 0, Peak Period Tp (s) Peak Period Tp (s) Significant Wave Height Hs (m) Accumularivr Damage B1A1 0, , , , , Significant Wave Height Hs (m) Accumulative Damage B2A2 0, , , , , , ,0030 0,0035 0, , Peak Period Tp (s) Peak Period Tp (s) Figure 6.15 Accumulative damage for each sea state As you can see in this graph the maximum damage according to T P, is in the interval 10.5 T P 13.5 which was expected because it is close to the 3T (T is the natural period shown in Table 6-1) and thus the structure experiences higher dynamic loads due to resonance. All the damage values are tabulated and showed in Appendix A-1 and A-2. 82
85 In order to assess that which sea state has the most contribution in Fatigue of the structure, Figure 6.16 is presented. Each bar is related to one of the braces and the values of the accumulative damage are obtained according to each Hs i.e. looking at the table showed in appendix A-2, the accumulative damage values showed in the figure below, are equal to the summation of each row (i.e. constant Hs by different Tp) which is also showed in the last column of the table. 0,014 0,012 A1B1 A2B2 B1A1 B2A2 Accumulative Damage 0,010 0,008 0,006 0,004 0,002 0, Hs (m) Figure 6.16 total damage according to Hs for each brace It is mentioned before that all 4 braces (parallel to the applied wave direction) have almost the same behavior by different values which is also observable in this figure. Moreover, it is clearly shown that in the interval 7.5 H S 9.5, we have the maximum damage. Furthermore, the total fatigue damage value during 57 years can be calculated by adding all damage values according to H S (placed in the last column of table A-2). 83
86 Consequently the average damage for each year is obtainable by dividing the total value by 57. The results for each brace are shown below: Table 6-4 Damage values for each brace Brace Total Damage During 57 years Total Damage per year A1B1 5,65E-02 9,91E-04 A2B2 6,49E-02 1,14E-03 B1A1 3,68E-02 6,46E-04 B2A2 3,17E-02 5,56E-04 It should be mentioned that the damage values may differ from the actual results. The reason lies in the uncertainties which are bullet pointed in section 5.4. For example assuming just one wave direction during 57 years of data, applies all the loads (which normally should be carried out by 8 braces) only on 4 braces. It is noticed that, however the jacket platform has a oscillating motion and all the braces (parallel to the wave direction) are experiencing both the tension and compression axial forces, the braces can be grouped in two different types according to the wave direction (see figure 6-16) The braces which are carrying the load mainly in tension (B1A1, B2A2) The braces which are carrying the load mainly in compression (B1A1, B2A2) It can be seen that the first group (tubular members in tension) has a comparatively small fatigue damage which is expected (in and out-of-plane bending is zero). But since it is not the case in the real world and there are waves from all directions, the larger value considers being the main fatigue damage. As an explanation, if only the A1B1 brace is considered, when the waves hit the jacket, this brace is carrying a large amount axial force in compression, but when the structure returns to the first place, the excitation loads are much smaller (the drag force at the trough acts as an excitation force on the opposite direction of the wave propagation). In addition, the structural and environmental damping reduces the forces acting on the brace. So we can say, the brace A1B1 is carrying the loads mainly in compression. In next chapter, the closed form damage calculation has been performed using MATLAB. In addition the validity of the results calculated by FATAL, is checked by introducing the stress time histories into MATLAB and calculate the damage by the same procedure. 84

87 6.5 Damage calculation using MATLAB Introduction As it is mentioned in previous chapter, we get eight 3-hour time histories of stresses for each brace. Using the Rainflow counting method which is discussed in chapter we are able to calculate the stress ranges and corresponding number of cycles. Figure 6.16 shows a few examples with the constant T P = 12.5 and four different H S. The reason for choosing T P = 12.5 is that this is very close to 3 rd factor of the natural frequencies and thus the values of the responses are very high. Further in this chapter it has been discussed. Figure 6.17 Histogram of Rainflow amplitudes. 85
88 These graphs are representing the two important parameters for calculating the damage of a structure or member, stress amplitude and the corresponding number of cycles Comparing two individual case in figure 6.17, we can see that the amplitude and the number of cycles are much larger for Hs=12.5 than the one with Hs=6.5 which cause much larger fatigue damage as it is showed further in this section (Figure 6.18) It should be mentioned that, the stress level less than 10 MPa is taken out from the results, because they have relatively very small contribution (or no contribution) on fatigue life. Moreover, the MATLAB function used in this part calculates the amplitude of the stresses which according to [DNV classification notes No ] by assuming the linear responses we can use the following relation: σ = 2. amplitude (6-5) According to S-N approach there are two ways to calculate the fatigue damage [A.A. Næss-1985], The Miner-Palmgren approach. Closed form fatigue damage approximation. Both methods (discussed in chapter 5) have been applied using MATLAB and the results are presented in this chapter. It should be mentioned that, for each brace only the hot spot with maximum damage has been considered. MATLAB function used for Rainflow counting adopted from the WAFO toolbox and modified to calculate the damage using both methods. The functions are presented in Appendix B-4 Moreover, the values of the damage (3-hour and accumulated) for both methods and the Weibull parameters are shown in tables in Appendix A. 86
89 6.5.2 The Miner-Palmgren approach (Direct method) In order to investigate the fatigue damage of a member, for any specific value of stress range, we need to have the calculated number of cycles, n(s i ), and the number of cycle to failure of the member, N(S i ). Using the WAFO tool, all the parameters in equations (5-1 to 5-5) in chapter 5, have been distracted from FATAL output file and the results are presented in two different figures, figure 6.17 is shown the 3-hour damage and then the accumulative damage is illustrated in figure As you can see in figure 6.17, the maximum damage is again (like the FATAL results) related to brace A2B2. Then the braces A1B1, B1A1 and B2A2 have the smaller damage respectively. Significant Wave Height Hs (m) Hour Damage A1B1 13 0, , , , , , ,0012 Significant Wave Height Hs (m) 3-Hour Damage A2B2 13 0, , , , , , , Peak Period Tp (s) Peak Period Tp (s) Significant Wave Height Hs (m) Hour Damage B1A1 13 0, , , , , , ,0012 Significant Wave Height Hs (m) 3-Hour Damage B2A2 13 0, , , , , , Peak Period Tp (s) Peak Period Tp (s) Figure hour damage for each sea state 87
90 Significant Wave Height Hs (m) Accumulative Damage A1B1 13 0, , , , , , Significant Wave Height Hs (m) Accumulative Damage A2B2 13 0, , , , , , Peak Period Tp (s) Peak Period Tp (s) Significant Wave Height Hs (m) Accumulative Damage B1A1 13 0, , , , , , ,0030 0, Significant Wave Height Hs (m) Accumulative Damage B2A2 13 0, , , , , , ,0030 0, Peak Period Tp (s) Peak Period Tp (s) Figure 6.19 Accumulative damage for each sea state The results in this part suggest that, the lower Hs (H S = 5,5 6,5) cause the maximum damage in the platform, but the H S 10,5 have the same behavior as the damages showed in previous section. By comparing the damage values in table A-2 and A-4 (Appendix), we can see that there is a deviation at the lower part (H S 8,5), but the rest of the values are following the exact same pattern. Although the results do not seem very reliable for the lower part, the total damage calculated and it is showed in table below: Table 6-5 Damage values for each brace Brace Total Damage During 57 years Total Damage per year A1B1 4,41E-2 7,74E-04 A2B2 4,55E-02 7,98E-03 B1A1 5,19E-02 9,10E-04 B2A2 4,79E-02 8,40E-04 88

91 6.5.3 Closed form fatigue damage approach (Approximate) In this part, we used the stress cycles taken from Rainflow counting. It is known that the braces are subjected to n 0 stress cycle in each specific block in scatter diagram i.e., for each individual H S and T P, there are stress ranges and their corresponding number of cycles. Therefore we can assume that these stress cycles are randomly distributed with a probability density function Fs, which it has been discussed in chapter 4. Here, a few graphs of the fitted Weibull distribution function are presented in figure Moreover all the calculated Weibull parameters (A and B in equation (4-1)) for each 3-hour sea state have been shown in Appendix A-7. Figure 6.20 Weibull Probability Paper of stress ranges. 89

92 It can be seen that, for the stress ranges between 10 5 and 10 7, the Weibull paper fits quite acceptable on the results and this is where we get as same behavior as the damage values calculated by FATAL, but by going outside that range the deviation becomes bigger. So, this deviation cause uncertainties on the damage values calculated using the Weibull parameters. Further it is shown that the Closed form approximation method gives higher damage values in the lower H S, and lower values in the higher H S, compare to the Direct method. In order to improve the accuracy of the results, the 3-parameter Weibull or the other kind of distribution functions (e.g. Rayleigh or generalized gamma) might be better choices. Here only the Weibull parameters related to brace A2B2 is showed and the other three tables can be found in appendix A-7 The Weibull parameters for each sea state are as follow: Table 6-6 Weibull parameters for brace A2B2 Having all the Weibull parameters we can now calculate the fatigue damage by the equation (5-13). The results for 3-hour and accumulative damage is shown in figure 6.21 as follow: 90
93 Significant Wave Height Hs (m) Hour Damage A1B1 13 0, , , , , , ,0030 0,0035 0,08 10 Significant Wave Height Hs (m) Hour Damage A2B2 13 0, , , , , Peak Period Tp (s) Peak Period Tp (s) Significant Wave Height Hs (m) Hour Damage B1A1 13 0, , , , ,00020 Significant Wave Height Hs (m) Hour Damage B2A2 13 0, , , , , , Peak Period Tp (s) Peak Period Tp (s) Significant Wave Height Hs (m) Accumulative Damage A1B1 13 0, ,001 0, ,003 0,004 0, Significant Wave Height Hs (m) Accumulative Damage A2B2 13 0, ,001 0, ,003 0,004 0, Peak Period Tp (s) Peak Period Tp (s) Significant Wave Height Hs (m) Accumulative Damage B1A1 13 0, ,001 0, ,003 0,004 0, ,0030 0,0035 Significant Wave Height Hs (m) Accumulative Damage B2A2 13 0, , , , , , ,0012 0, Peak Period Tp (s) Peak Period Tp (s) Figure hour and Accumulative damage for each sea state 91
94 In the graphs illustrated above, we can see almost the same behavior as we have seen in FATAL graphs. This means, the worst sea state according to fatigue is related to the sea states with 5.5 H S 9.5 and the contribution of higher sea states is relatively small. But as you can see, the lower sea states have more contribution according to closed form method compare to the Miner-Palmgren. The detailed explanation about the difference between the direct method and the approximate method can be found in next section. In addition, the maximum damage according to T P, is expectedly come from the sea states with 10.5 T P 12.5 which is in agreement with the results obtained using direct method (FATAL). The total fatigue damage value during 57 years can be calculated by adding all damage values according to H S (placed in the last column of table A-6). Consequently the average damage for each year is obtainable by dividing the total value by 57. The results for each brace are shown below: Table 6-4 Damage values for each brace Brace Total Damage During 57 years Total Damage per year A1B1 6,60E-02 1,16E-03 A2B2 7,21E-02 1,26E-03 B1A1 4,39E-02 7,70E-04 B2A2 5,72E-02 1,00E-03 92
95 6.6 Comparison of the result In the previous chapters, fatigue damage results for each sea state have been presented by different approaches. Now we can compare those results to see the differences. In this part, the results calculated by Direct method and the approximate method have been compared. In order to have a general comparison, the cumulative damage according to each H S have been calculated. The cumulative damage values for each H S can be found in Appendix A. 0,010 FATAL APPROX 0,008 Accumulative Damage 0,006 0,004 0,002 0, Hs (m) Figure 6.22 comparison between closed form and Direct methods. Figure above shows the accumulative damage versus the significant wave height for both methods. Since the aim of this project is to find the worse sea state according to fatigue of the Kvitebjørn platform, the damage values are not of major concern. Therefore in this section, the general differences ae discussed instead of exact values. As it is mentioned before, there is a large deviation in the lower tail of the Weibull probability paper plot in which the results are placed under the Weibull line. Thus the 93
96 corresponding bars, illustrated in figure 6.22, is not following the trend of the direct method for H S 7,5. These values are also quite larger than the damage values calculated by direct method. See figure 6.22 For H S 7.5, almost the same trend for both method can be observed but the closed form method gives the conservative damage values for 7.5 H S 9.5 while it underestimates the damage for H S 10.5 According to the results, it can be concluded that the damage values calculating by closed form method for the H S 10.5 are too conservative while they are underestimated the damage values for H S Conclusion In this report, the fatigue damage of the Kvitebjørn jacket platform has been studied based on Miner-Palmgren method using two slopes S-N curve. The worse sea states according to damage are clarified based on the results obtained by two different approaches, Direct approach and Closed form approach. The fatigue damage based on Direct approach is performed using FATAL and The final results suggest that: The main contribution of the fatigue damage is related to the sea states with 7.5 H S 9.5. according to the peak period the most fatigue damage comes from the sea state with 10.5 T P 13.5 The fatigue damage based on the closed form approach is performed by using MATLAB. The stress range histories (extracted from FATAL result file) are introduced to MATLAB to calculate the values of stress ranges and the corresponding number of cycles. In order to find a proper probability function, the results are fitted to the Weibull probability paper and the Weibull parameters are calculated. These 94
97 parameters are used in the closed form equation to obtain the fatigue damage. The results have some differences with the damage calculated by direct method at the lower sea states. According to the approximate method the worst sea states are the ones with 5.5 H S 9.5. the results is showing that the Closed form approximation method gives higher damage values in the lower H S, and lower damage in the higher H S, compare to the Direct method. In order to improve the accuracy of the results, the 3-parameter Weibull or the other kind of distribution functions (e.g. Rayleigh or generalized gamma) might be the better choices. 6.8 Recommendation and further work In order to calculate the fatigue damage, some assumption has been taking into account. Changing a few of those assumptions may conduce to more precise results. The following suggestions can be considered in further work: The wave propagation is assumed to be in one direction. Assuming different directions and providing a directional scatter diagram will improve the accuracy of the results. The current speed has been considered to be zero. Including the actual current speed in equations may change the results. The Weibull distribution function is used as the best fit for the stress range results which is proved incorrect. So considering 3-parameteres Weibull Distribution function or Generalized Gamma distribution function will indeed lead to better results. The jacket is assumed to be fixed at the sea bed. Improving the model (introduced to USFOS as an input) is another source of uncertainties which can be reconsidered. 95
98 96
99 References ASTM E1049, Standard practices for cycle counting in fatigue analysis, Buitrago, J., Zettlemoyer, N. and Kahlish, J. L.: Combined Hot-Spot Stress Procedures for Tubular Joints. OTC Paper No Houston, May Chakrabarti, S.K., handbook of offshore engineering, vol1. Elsevier Clough, R.W., Penzien, J., Dynamic of structures, Mc Graw-Hill, DNV-RP-C205. Environmental Conditions and Environmental Loads, October 2010 DNV-RP-C203. Fatigue Design of Offshore Steel Structures. October 2012 DNV-RP-C203. Fatigue Design of Offshore Steel Structures. April 2010 DNV-RP-F204. Recommended practice, Riser fatigue. October 2010 DNV Report no , Guideline for offshore structural reliability: Application to jacket platforms, DNV Report no , Guideline for offshore structural reliability: Example for jacket platforms, DNV Classification notes No. 30.7, Fatigue assessment of ship structures, February, Dong, W.B., Moan, T. and Gao, Z., Long-term fatigue analysis of multi-planar tubular joints for jacket-type offshore wind turbine in time domain, Engineering structure, Efthymiou, M.: Development of SCF Formulae and Generalised Influence Functions for use in Fatigue Analysis. Recent Developments in Tubular Joint Technology, OTJ 88, October 1988, London. Faltinsen, O.M., Sea loads on ships and offshore structures, Cambridge University press FATAL user s manual Gupta, A., Singh, R.P., Fatigue behavior of offshore structure, Berlin, Springer, 1986 Haver, S.K., Prediction of characteristic response for design purposes, March, Journée, J.M.J., Massie, W.W., Offshore hydromechanics, First Edition, Delft University of Technology, January, Karunakaran, D., Haver, S.K., Bærheim, M., Spidsøe, N., Dynamic behaviour of kvitebjørn jacket in North Sea, OMAE 2001/OFT Meirovitch, L., Element of vibration analysis, Mc Graw-Hill, New York,
100 Næss, A.A., Fatigue handbook, Offshore Steel Structures, TAPIR, Trondheim, USFOS Hydrodynamics Theory Description of use Verification, Wikipedia, Rainflow-counting algorithm. Økland, O.D., Fatigue assessment of Kvitebjørn jacket, Marintek report no. MT70F10-066,
101 Appendix 99
 100")
102 A-1 Tabulated 3-hour results (FATAL / Miner-Palmgren) 100

103 101

104 A-2 Tabulated accumulative results (FATAL / Miner-Palmgren) 102
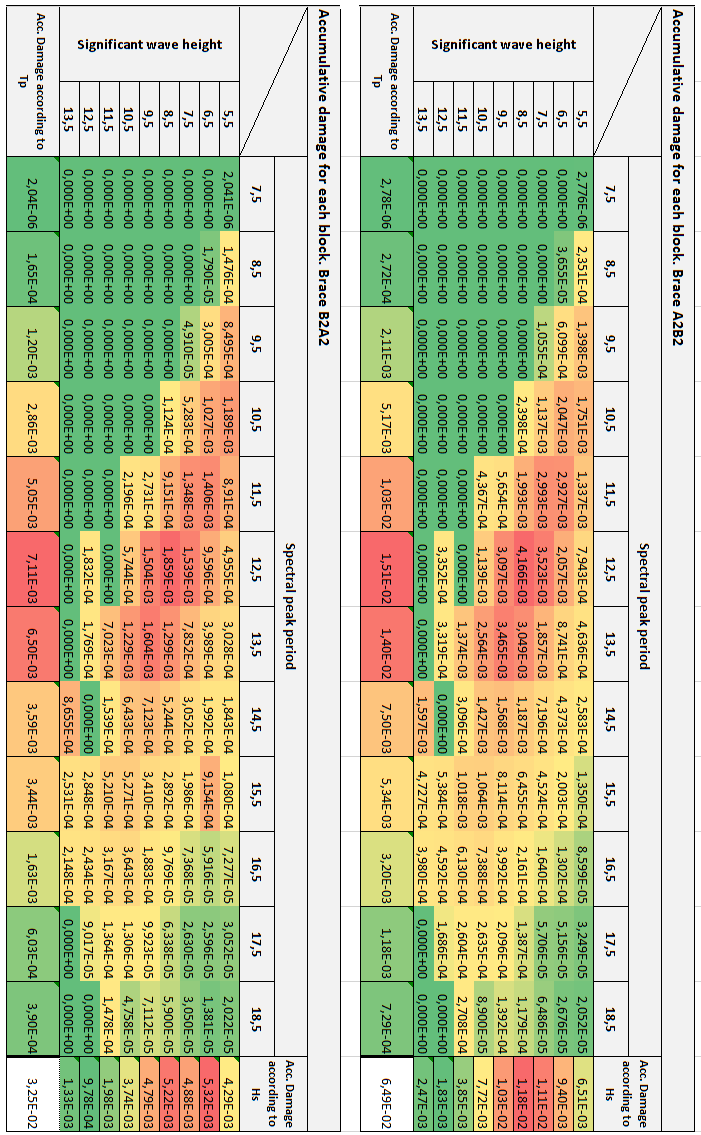
105 103
106 A-3 Tabulated 3-hour results (MATLAB / Miner-Palmgren) 104

107 105

108 A-4 Tabulated accumulative results (MATLAB / Miner-Palmgren) 106

109 107
110 108
111 A-5 Tabulated 3-hour results (MATLAB / Closed Form) 109

112 110
")
113 A-6 Tabulated accumulative results (MATLAB / Closed Form) 111
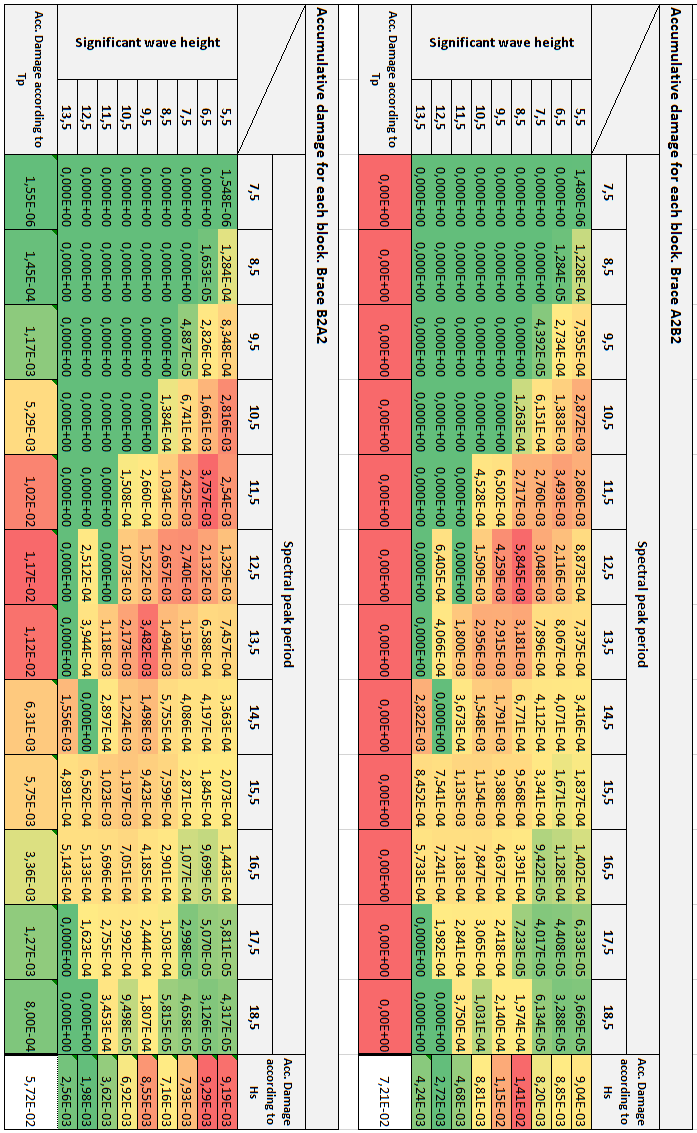
114 112

115 A-7 Tabulated Weibull parameters 113

116 114
Stress and deformation of offshore piles under structural and wave loading
 Stress and deformation of offshore piles under structural and wave loading J. A. Eicher, H. Guan, and D. S. Jeng # School of Engineering, Griffith University, Gold Coast Campus, PMB 50 Gold Coast Mail
When the fluid velocity is zero, called the hydrostatic condition, the pressure variation is due only to the weight of the fluid.
 Fluid Statics When the fluid velocity is zero, called the hydrostatic condition, the pressure variation is due only to the weight of the fluid. Consider a small wedge of fluid at rest of size Δx, Δz, Δs
MODULE VII LARGE BODY WAVE DIFFRACTION
 MODULE VII LARGE BODY WAVE DIFFRACTION 1.0 INTRODUCTION In the wave-structure interaction problems, it is classical to divide into two major classification: slender body interaction and large body interaction.
Proceedings of OMAE'01 20 th International Conference on Offshore Mechanics and Arctic Engineering June 3-8, 2001, Rio de Janeiro, Brazil
 Proceedings of OMAE' 2 th International Conference on Offshore Mechanics and Arctic Engineering June 3-8, 2, Rio de Janeiro, Brazil OMAE2/SR-259 PROBABILISTIC MODELLING AND ANALYSIS OF RISER COLLISION
Structural Axial, Shear and Bending Moments
 Structural Axial, Shear and Bending Moments Positive Internal Forces Acting Recall from mechanics of materials that the internal forces P (generic axial), V (shear) and M (moment) represent resultants
Simulation of Offshore Structures in Virtual Ocean Basin (VOB)
") Simulation of Offshore Structures in Virtual Ocean Basin (VOB) Dr. Wei Bai 29/06/2015 Department of Civil & Environmental Engineering National University of Singapore Outline Methodology Generation of
Simulation of Offshore Structures in Virtual Ocean Basin (VOB) Dr. Wei Bai 29/06/2015 Department of Civil & Environmental Engineering National University of Singapore Outline Methodology Generation of
Lecture L2 - Degrees of Freedom and Constraints, Rectilinear Motion
 S. Widnall 6.07 Dynamics Fall 009 Version.0 Lecture L - Degrees of Freedom and Constraints, Rectilinear Motion Degrees of Freedom Degrees of freedom refers to the number of independent spatial coordinates
Physics 9e/Cutnell. correlated to the. College Board AP Physics 1 Course Objectives
 Physics 9e/Cutnell correlated to the College Board AP Physics 1 Course Objectives Big Idea 1: Objects and systems have properties such as mass and charge. Systems may have internal structure. Enduring
AP1 Oscillations. 1. Which of the following statements about a spring-block oscillator in simple harmonic motion about its equilibrium point is false?
 1. Which of the following statements about a spring-block oscillator in simple harmonic motion about its equilibrium point is false? (A) The displacement is directly related to the acceleration. (B) The
Frequency domain application of the Hot-Spot method for the fatigue assessment of the weld seams
 Frequency domain application of the Hot-Spot method for the fatigue assessment of the weld seams Dr. Ing. Sauro Vannicola 1 sauro.vannicola@ch.abb.com Dr. Ing. Luigi De Mercato 2 luigi.de-mercato@ch.abb.com
Loads Tools Checks Reports
 Loads Tools Checks Reports SDC Verifier or the Structural Design Code Verifier is a powerful postprocessor program with an advanced calculation core which works seamlessly with Siemens multi-solver, FEA
RANDOM VIBRATION AN OVERVIEW by Barry Controls, Hopkinton, MA
 RANDOM VIBRATION AN OVERVIEW by Barry Controls, Hopkinton, MA ABSTRACT Random vibration is becoming increasingly recognized as the most realistic method of simulating the dynamic environment of military
MECH 450F/580 COURSE OUTLINE INTRODUCTION TO OCEAN ENGINEERING
 Department of Mechanical Engineering MECH 450F/580 COURSE OUTLINE INTRODUCTION TO OCEAN ENGINEERING Spring 2014 Course Web Site See the MECH 450F Moodle site on the UVic Moodle system. Course Numbers:
DESIGN OF SLABS. 3) Based on support or boundary condition: Simply supported, Cantilever slab,
 Based on support or boundary condition: Simply supported, Cantilever slab,") DESIGN OF SLABS Dr. G. P. Chandradhara Professor of Civil Engineering S. J. College of Engineering Mysore 1. GENERAL A slab is a flat two dimensional planar structural element having thickness small compared
DESIGN OF SLABS Dr. G. P. Chandradhara Professor of Civil Engineering S. J. College of Engineering Mysore 1. GENERAL A slab is a flat two dimensional planar structural element having thickness small compared
Finite Element Formulation for Plates - Handout 3 -
 Finite Element Formulation for Plates - Handout 3 - Dr Fehmi Cirak (fc286@) Completed Version Definitions A plate is a three dimensional solid body with one of the plate dimensions much smaller than the
The Basics of FEA Procedure
 CHAPTER 2 The Basics of FEA Procedure 2.1 Introduction This chapter discusses the spring element, especially for the purpose of introducing various concepts involved in use of the FEA technique. A spring
Optimum proportions for the design of suspension bridge
 Journal of Civil Engineering (IEB), 34 (1) (26) 1-14 Optimum proportions for the design of suspension bridge Tanvir Manzur and Alamgir Habib Department of Civil Engineering Bangladesh University of Engineering
8.2 Elastic Strain Energy
 Section 8. 8. Elastic Strain Energy The strain energy stored in an elastic material upon deformation is calculated below for a number of different geometries and loading conditions. These expressions for
7. DYNAMIC LIGHT SCATTERING 7.1 First order temporal autocorrelation function.
 7. DYNAMIC LIGHT SCATTERING 7. First order temporal autocorrelation function. Dynamic light scattering (DLS) studies the properties of inhomogeneous and dynamic media. A generic situation is illustrated
Frequency-domain and stochastic model for an articulated wave power device
 Frequency-domain stochastic model for an articulated wave power device J. Cândido P.A.P. Justino Department of Renewable Energies, Instituto Nacional de Engenharia, Tecnologia e Inovação Estrada do Paço
Copyright 2011 Casa Software Ltd. www.casaxps.com. Centre of Mass
 Centre of Mass A central theme in mathematical modelling is that of reducing complex problems to simpler, and hopefully, equivalent problems for which mathematical analysis is possible. The concept of
Determination of Acceleration due to Gravity
 Experiment 2 24 Kuwait University Physics 105 Physics Department Determination of Acceleration due to Gravity Introduction In this experiment the acceleration due to gravity (g) is determined using two
Vibrations of a Free-Free Beam
 Vibrations of a Free-Free Beam he bending vibrations of a beam are described by the following equation: y EI x y t 4 2 + ρ A 4 2 (1) y x L E, I, ρ, A are respectively the Young Modulus, second moment of
Brandangersundet Bridge A slender and light network arch
 Brandangersundet Bridge A slender and light network arch Rolf Magne Larssen Dr. ing./ Ph.D. Dr. ing A. Aas-Jakobsen AS Oslo, Norway rml@aaj.no Rolf Magne Larssen, born 1958, received his Ph.D. in structural
bi directional loading). Prototype ten story
. Prototype ten story") NEESR SG: Behavior, Analysis and Design of Complex Wall Systems The laboratory testing presented here was conducted as part of a larger effort that employed laboratory testing and numerical simulation
NEESR SG: Behavior, Analysis and Design of Complex Wall Systems The laboratory testing presented here was conducted as part of a larger effort that employed laboratory testing and numerical simulation
A Cost- Effective Computational Tool for Offshore Floater Design
 Introduction A Cost- Effective Computational Tool for Offshore Floater Design Jang Whan Kim, Hyunchul Jang & Jim O Sullivan Technip Offshore floating platforms are complex engineering systems with numerous
NUMERICAL SIMULATION OF REGULAR WAVES RUN-UP OVER SLOPPING BEACH BY OPEN FOAM
 NUMERICAL SIMULATION OF REGULAR WAVES RUN-UP OVER SLOPPING BEACH BY OPEN FOAM Parviz Ghadimi 1*, Mohammad Ghandali 2, Mohammad Reza Ahmadi Balootaki 3 1*, 2, 3 Department of Marine Technology, Amirkabir
WavePiston Project. Structural Concept Development Hydrodynamic Aspects. Preliminary Analytical Estimates. February 2010
 WavePiston Project Structural Concept Development Hydrodynamic Aspects Preliminary Analytical Estimates February 2010 WavePiston Project Structural Concept Development Hydrodynamic Aspects Preliminary
Prelab Exercises: Hooke's Law and the Behavior of Springs
 59 Prelab Exercises: Hooke's Law and the Behavior of Springs Study the description of the experiment that follows and answer the following questions.. (3 marks) Explain why a mass suspended vertically
Section 5.0 : Horn Physics. By Martin J. King, 6/29/08 Copyright 2008 by Martin J. King. All Rights Reserved.
 Section 5. : Horn Physics Section 5. : Horn Physics By Martin J. King, 6/29/8 Copyright 28 by Martin J. King. All Rights Reserved. Before discussing the design of a horn loaded loudspeaker system, it is
Force measurement. Forces VECTORIAL ISSUES ACTION ET RÉACTION ISOSTATISM
 Force measurement Forces VECTORIAL ISSUES In classical mechanics, a force is defined as "an action capable of modifying the quantity of movement of a material point". Therefore, a force has the attributes
The elements used in commercial codes can be classified in two basic categories:
 CHAPTER 3 Truss Element 3.1 Introduction The single most important concept in understanding FEA, is the basic understanding of various finite elements that we employ in an analysis. Elements are used for
Understanding Poles and Zeros
 MASSACHUSETTS INSTITUTE OF TECHNOLOGY DEPARTMENT OF MECHANICAL ENGINEERING 2.14 Analysis and Design of Feedback Control Systems Understanding Poles and Zeros 1 System Poles and Zeros The transfer function
DEVELOPMENT AND APPLICATIONS OF TUNED/HYBRID MASS DAMPERS USING MULTI-STAGE RUBBER BEARINGS FOR VIBRATION CONTROL OF STRUCTURES
 13 th World Conference on Earthquake Engineering Vancouver, B.C., Canada August 1-6, 2004 Paper No. 2243 DEVELOPMENT AND APPLICATIONS OF TUNED/HYBRID MASS DAMPERS USING MULTI-STAGE RUBBER BEARINGS FOR
SEISMIC DESIGN. Various building codes consider the following categories for the analysis and design for earthquake loading:
 SEISMIC DESIGN Various building codes consider the following categories for the analysis and design for earthquake loading: 1. Seismic Performance Category (SPC), varies from A to E, depending on how the
METHODS FOR ACHIEVEMENT UNIFORM STRESSES DISTRIBUTION UNDER THE FOUNDATION
 International Journal of Civil Engineering and Technology (IJCIET) Volume 7, Issue 2, March-April 2016, pp. 45-66, Article ID: IJCIET_07_02_004 Available online at http://www.iaeme.com/ijciet/issues.asp?jtype=ijciet&vtype=7&itype=2
Fluid structure interaction of a vibrating circular plate in a bounded fluid volume: simulation and experiment
 Fluid Structure Interaction VI 3 Fluid structure interaction of a vibrating circular plate in a bounded fluid volume: simulation and experiment J. Hengstler & J. Dual Department of Mechanical and Process
CH. 2 LOADS ON BUILDINGS
 CH. 2 LOADS ON BUILDINGS GRAVITY LOADS Dead loads Vertical loads due to weight of building and any permanent equipment Dead loads of structural elements cannot be readily determined b/c weight depends
A new & widely applicable bedform tracking tool
 A new & widely applicable bedform tracking tool C.F. van der Mark & A. Blom University of Twente Faculty of Engineering Technology Department of Water Engineering and Management P.O. Box 217, 75 AE Enschede,
EFFECTS ON NUMBER OF CABLES FOR MODAL ANALYSIS OF CABLE-STAYED BRIDGES
 EFFECTS ON NUMBER OF CABLES FOR MODAL ANALYSIS OF CABLE-STAYED BRIDGES Yang-Cheng Wang Associate Professor & Chairman Department of Civil Engineering Chinese Military Academy Feng-Shan 83000,Taiwan Republic
Dispersion diagrams of a water-loaded cylindrical shell obtained from the structural and acoustic responses of the sensor array along the shell
 Dispersion diagrams of a water-loaded cylindrical shell obtained from the structural and acoustic responses of the sensor array along the shell B.K. Jung ; J. Ryue ; C.S. Hong 3 ; W.B. Jeong ; K.K. Shin
Transmission Line and Back Loaded Horn Physics
 Introduction By Martin J. King, 3/29/3 Copyright 23 by Martin J. King. All Rights Reserved. In order to differentiate between a transmission line and a back loaded horn, it is really important to understand
Introduction to Engineering System Dynamics
 CHAPTER 0 Introduction to Engineering System Dynamics 0.1 INTRODUCTION The objective of an engineering analysis of a dynamic system is prediction of its behaviour or performance. Real dynamic systems are
Determination of source parameters from seismic spectra
 Topic Determination of source parameters from seismic spectra Authors Michael Baumbach, and Peter Bormann (formerly GeoForschungsZentrum Potsdam, Telegrafenberg, D-14473 Potsdam, Germany); E-mail: pb65@gmx.net
SUPPLEMENTAL TECHNICAL SPECIFICATIONS BI-DIRECTIONAL STATIC LOAD TESTING OF DRILLED SHAFTS
 July 14, 2015 1.0 GENERAL BI-DIRECTIONAL STATIC LOAD TESTING OF DRILLED SHAFTS This work shall consist of furnishing all materials, equipment, labor, and incidentals necessary for conducting bi-directional
Finite Element Method (ENGC 6321) Syllabus. Second Semester 2013-2014
 Syllabus. Second Semester 2013-2014") Finite Element Method Finite Element Method (ENGC 6321) Syllabus Second Semester 2013-2014 Objectives Understand the basic theory of the FEM Know the behaviour and usage of each type of elements covered
Finite Element Method Finite Element Method (ENGC 6321) Syllabus Second Semester 2013-2014 Objectives Understand the basic theory of the FEM Know the behaviour and usage of each type of elements covered
PHYSICAL QUANTITIES AND UNITS
 1 PHYSICAL QUANTITIES AND UNITS Introduction Physics is the study of matter, its motion and the interaction between matter. Physics involves analysis of physical quantities, the interaction between them
Practice Problems on Boundary Layers. Answer(s): D = 107 N D = 152 N. C. Wassgren, Purdue University Page 1 of 17 Last Updated: 2010 Nov 22
: D = 107 N D = 152 N. C. Wassgren, Purdue University Page 1 of 17 Last Updated: 2010 Nov 22") BL_01 A thin flat plate 55 by 110 cm is immersed in a 6 m/s stream of SAE 10 oil at 20 C. Compute the total skin friction drag if the stream is parallel to (a) the long side and (b) the short side. D =
BL_01 A thin flat plate 55 by 110 cm is immersed in a 6 m/s stream of SAE 10 oil at 20 C. Compute the total skin friction drag if the stream is parallel to (a) the long side and (b) the short side. D =
AP Physics C. Oscillations/SHM Review Packet
 AP Physics C Oscillations/SHM Review Packet 1. A 0.5 kg mass on a spring has a displacement as a function of time given by the equation x(t) = 0.8Cos(πt). Find the following: a. The time for one complete
Seismic Analysis and Design of Steel Liquid Storage Tanks
 Vol. 1, 005 CSA Academic Perspective 0 Seismic Analysis and Design of Steel Liquid Storage Tanks Lisa Yunxia Wang California State Polytechnic University Pomona ABSTRACT Practicing engineers face many
Algebra 1 2008. Academic Content Standards Grade Eight and Grade Nine Ohio. Grade Eight. Number, Number Sense and Operations Standard
 Academic Content Standards Grade Eight and Grade Nine Ohio Algebra 1 2008 Grade Eight STANDARDS Number, Number Sense and Operations Standard Number and Number Systems 1. Use scientific notation to express
The use of Operating Deflection Shapes (ODS) to model the vibration of sanders and polishers HSL/2006/104. Project Leader: Author(s): Science Group:
 to model the vibration of sanders and polishers HSL/2006/104. Project Leader: Author(s): Science Group:") Harpur Hill, Buxton Derbyshire, SK17 9JN T: +44 (0)1298 218000 F: +44 (0)1298 218590 W: www.hsl.gov.uk The use of Operating Deflection Shapes (ODS) to model the vibration of sanders and polishers HSL/2006/104
Harpur Hill, Buxton Derbyshire, SK17 9JN T: +44 (0)1298 218000 F: +44 (0)1298 218590 W: www.hsl.gov.uk The use of Operating Deflection Shapes (ODS) to model the vibration of sanders and polishers HSL/2006/104
Differential Relations for Fluid Flow. Acceleration field of a fluid. The differential equation of mass conservation
 Differential Relations for Fluid Flow In this approach, we apply our four basic conservation laws to an infinitesimally small control volume. The differential approach provides point by point details of
REINFORCED CONCRETE. Reinforced Concrete Design. A Fundamental Approach - Fifth Edition. Walls are generally used to provide lateral support for:
 HANDOUT REINFORCED CONCRETE Reinforced Concrete Design A Fundamental Approach - Fifth Edition RETAINING WALLS Fifth Edition A. J. Clark School of Engineering Department of Civil and Environmental Engineering
Solving Simultaneous Equations and Matrices
 Solving Simultaneous Equations and Matrices The following represents a systematic investigation for the steps used to solve two simultaneous linear equations in two unknowns. The motivation for considering
Unsteady Pressure Measurements
 Quite often the measurements of pressures has to be conducted in unsteady conditions. Typical cases are those of -the measurement of time-varying pressure (with periodic oscillations or step changes) -the
The dynamic equation for the angular motion of the wheel is R w F t R w F w ]/ J w
![The dynamic equation for the angular motion of the wheel is R w F t R w F w ]/ J w](/thumbs/25/5134815.jpg "The dynamic equation for the angular motion of the wheel is R w F t R w F w ]/ J w") Chapter 4 Vehicle Dynamics 4.. Introduction In order to design a controller, a good representative model of the system is needed. A vehicle mathematical model, which is appropriate for both acceleration
Chapter 4 Vehicle Dynamics 4.. Introduction In order to design a controller, a good representative model of the system is needed. A vehicle mathematical model, which is appropriate for both acceleration
Physics Notes Class 11 CHAPTER 3 MOTION IN A STRAIGHT LINE
 1 P a g e Motion Physics Notes Class 11 CHAPTER 3 MOTION IN A STRAIGHT LINE If an object changes its position with respect to its surroundings with time, then it is called in motion. Rest If an object
How To Write An Analysis System For Bridge Test
 Study of Analysis System for Bridge Test Chen Ke, Lu Jian-Ming, Research Institute of Highway, 100088, Beijing, China (chenkezi@163.com, lujianming@263.net) Summary Analysis System for Bridge Test (Chinese
Fluid Mechanics: Static s Kinematics Dynamics Fluid
 Fluid Mechanics: Fluid mechanics may be defined as that branch of engineering science that deals with the behavior of fluid under the condition of rest and motion Fluid mechanics may be divided into three
STUDY OF DAM-RESERVOIR DYNAMIC INTERACTION USING VIBRATION TESTS ON A PHYSICAL MODEL
 STUDY OF DAM-RESERVOIR DYNAMIC INTERACTION USING VIBRATION TESTS ON A PHYSICAL MODEL Paulo Mendes, Instituto Superior de Engenharia de Lisboa, Portugal Sérgio Oliveira, Laboratório Nacional de Engenharia
INTERFERENCE OF SOUND WAVES
 1/2016 Sound 1/8 INTERFERENCE OF SOUND WAVES PURPOSE: To measure the wavelength, frequency, and propagation speed of ultrasonic sound waves and to observe interference phenomena with ultrasonic sound waves.
Rules for Classification and Construction Industrial Services
 IV Rules for Classification and Construction Industrial Services 6 Offshore Technology 4 Structural Design Edition 2007 The following Rules come into force on December 1 st, 2007 Germanischer Lloyd Aktiengesellschaft
Module 7 (Lecture 24 to 28) RETAINING WALLS
 RETAINING WALLS") Module 7 (Lecture 24 to 28) RETAINING WALLS Topics 24.1 INTRODUCTION 24.2 GRAVITY AND CANTILEVER WALLS 24.3 PROPORTIONING RETAINING WALLS 24.4 APPLICATION OF LATERAL EARTH PRESSURE THEORIES TO DESIGN 24.5
Module 7 (Lecture 24 to 28) RETAINING WALLS Topics 24.1 INTRODUCTION 24.2 GRAVITY AND CANTILEVER WALLS 24.3 PROPORTIONING RETAINING WALLS 24.4 APPLICATION OF LATERAL EARTH PRESSURE THEORIES TO DESIGN 24.5
Chapter 2. Derivation of the Equations of Open Channel Flow. 2.1 General Considerations
 Chapter 2. Derivation of the Equations of Open Channel Flow 2.1 General Considerations Of interest is water flowing in a channel with a free surface, which is usually referred to as open channel flow.
with functions, expressions and equations which follow in units 3 and 4.
 Grade 8 Overview View unit yearlong overview here The unit design was created in line with the areas of focus for grade 8 Mathematics as identified by the Common Core State Standards and the PARCC Model
PHYS 211 FINAL FALL 2004 Form A
 1. Two boys with masses of 40 kg and 60 kg are holding onto either end of a 10 m long massless pole which is initially at rest and floating in still water. They pull themselves along the pole toward each
Design of Steel Structures Prof. S.R.Satish Kumar and Prof. A.R.Santha Kumar. Fig. 7.21 some of the trusses that are used in steel bridges
 7.7 Truss bridges Fig. 7.21 some of the trusses that are used in steel bridges Truss Girders, lattice girders or open web girders are efficient and economical structural systems, since the members experience
New approaches in Eurocode 3 efficient global structural design
 New approaches in Eurocode 3 efficient global structural design Part 1: 3D model based analysis using general beam-column FEM Ferenc Papp* and József Szalai ** * Associate Professor, Department of Structural
Open channel flow Basic principle
 Open channel flow Basic principle INTRODUCTION Flow in rivers, irrigation canals, drainage ditches and aqueducts are some examples for open channel flow. These flows occur with a free surface and the pressure
Sample Questions for the AP Physics 1 Exam
 Sample Questions for the AP Physics 1 Exam Sample Questions for the AP Physics 1 Exam Multiple-choice Questions Note: To simplify calculations, you may use g 5 10 m/s 2 in all problems. Directions: Each
METHOD OF STATEMENT FOR STATIC LOADING TEST
 Compression Test, METHOD OF STATEMENT FOR STATIC LOADING TEST Tension Test and Lateral Test According to the American Standards ASTM D1143 07, ASTM D3689 07, ASTM D3966 07 and Euro Codes EC7 Table of Contents
Dynamics of Offshore Wind Turbines
 Proceedings of the Twenty-first (2011) International Offshore and Polar Engineering Conference Maui, Hawaii, USA, June 19-24, 2011 Copyright 2011 by the International Society of Offshore and Polar Engineers
Deflections. Question: What are Structural Deflections?
 Question: What are Structural Deflections? Answer: The deformations or movements of a structure and its components, such as beams and trusses, from their original positions. It is as important for the
SIESMIC SLOSHING IN CYLINDRICAL TANKS WITH FLEXIBLE BAFFLES
 SIESMIC SLOSHING IN CYLINDRICAL TANKS WITH FLEXIBLE BAFFLES Kayahan AKGUL 1, Yasin M. FAHJAN 2, Zuhal OZDEMIR 3 and Mhamed SOULI 4 ABSTRACT Sloshing has been one of the major concerns for engineers in
2.016 Hydrodynamics Reading #2. 2.016 Hydrodynamics Prof. A.H. Techet
 Pressure effects 2.016 Hydrodynamics Prof. A.H. Techet Fluid forces can arise due to flow stresses (pressure and viscous shear), gravity forces, fluid acceleration, or other body forces. For now, let us
Thompson/Ocean 420/Winter 2005 Tide Dynamics 1
 Thompson/Ocean 420/Winter 2005 Tide Dynamics 1 Tide Dynamics Dynamic Theory of Tides. In the equilibrium theory of tides, we assumed that the shape of the sea surface was always in equilibrium with the
State Newton's second law of motion for a particle, defining carefully each term used.
 5 Question 1. [Marks 20] An unmarked police car P is, travelling at the legal speed limit, v P, on a straight section of highway. At time t = 0, the police car is overtaken by a car C, which is speeding
Approximate Analysis of Statically Indeterminate Structures
 Approximate Analysis of Statically Indeterminate Structures Every successful structure must be capable of reaching stable equilibrium under its applied loads, regardless of structural behavior. Exact analysis
EVALUATION OF SEISMIC RESPONSE - FACULTY OF LAND RECLAMATION AND ENVIRONMENTAL ENGINEERING -BUCHAREST
 EVALUATION OF SEISMIC RESPONSE - FACULTY OF LAND RECLAMATION AND ENVIRONMENTAL ENGINEERING -BUCHAREST Abstract Camelia SLAVE University of Agronomic Sciences and Veterinary Medicine of Bucharest, 59 Marasti
THEORETICAL MECHANICS
 PROF. DR. ING. VASILE SZOLGA THEORETICAL MECHANICS LECTURE NOTES AND SAMPLE PROBLEMS PART ONE STATICS OF THE PARTICLE, OF THE RIGID BODY AND OF THE SYSTEMS OF BODIES KINEMATICS OF THE PARTICLE 2010 0 Contents
F = ma. F = G m 1m 2 R 2
 Newton s Laws The ideal models of a particle or point mass constrained to move along the x-axis, or the motion of a projectile or satellite, have been studied from Newton s second law (1) F = ma. In the
Algebra 2 Chapter 1 Vocabulary. identity - A statement that equates two equivalent expressions.
 Chapter 1 Vocabulary identity - A statement that equates two equivalent expressions. verbal model- A word equation that represents a real-life problem. algebraic expression - An expression with variables.
2.0 BASIC CONCEPTS OF OPEN CHANNEL FLOW MEASUREMENT
 2.0 BASIC CONCEPTS OF OPEN CHANNEL FLOW MEASUREMENT Open channel flow is defined as flow in any channel where the liquid flows with a free surface. Open channel flow is not under pressure; gravity is the
DYNAMICAL ANALYSIS OF SILO SURFACE CLEANING ROBOT USING FINITE ELEMENT METHOD
 International Journal of Mechanical Engineering and Technology (IJMET) Volume 7, Issue 1, Jan-Feb 2016, pp. 190-202, Article ID: IJMET_07_01_020 Available online at http://www.iaeme.com/ijmet/issues.asp?jtype=ijmet&vtype=7&itype=1
MODELLING AND ANALYSIS OF MARINE OPERATIONS
 RECOMMENDED PRACTICE DNV-RP-H3 MODELLING AND ANALYSIS OF MARINE OPERATIONS APRIL FOREWORD (DNV) is an autonomous and independent foundation with the objectives of safeguarding life, property and the environment,
THE COMPOSITE DISC - A NEW JOINT FOR HIGH POWER DRIVESHAFTS
 THE COMPOSITE DISC - A NEW JOINT FOR HIGH POWER DRIVESHAFTS Dr Andrew Pollard Principal Engineer GKN Technology UK INTRODUCTION There is a wide choice of flexible couplings for power transmission applications,
Canyon Geometry Effects on Seismic SH-Wave scattering using three dimensional BEM
 Proceedings of the rd IASME / WSEAS International Conference on GEOLOGY and SEISMOLOGY (GES'9) Canyon Geometry Effects on Seismic SH-Wave scattering using three dimensional BEM REZA TARINEJAD* and MOHAMMAD
Abaqus/CFD Sample Problems. Abaqus 6.10
 Abaqus/CFD Sample Problems Abaqus 6.10 Contents 1. Oscillatory Laminar Plane Poiseuille Flow 2. Flow in Shear Driven Cavities 3. Buoyancy Driven Flow in Cavities 4. Turbulent Flow in a Rectangular Channel
Mechanics lecture 7 Moment of a force, torque, equilibrium of a body
 G.1 EE1.el3 (EEE1023): Electronics III Mechanics lecture 7 Moment of a force, torque, equilibrium of a body Dr Philip Jackson http://www.ee.surrey.ac.uk/teaching/courses/ee1.el3/ G.2 Moments, torque and
SOLUTIONS TO CONCEPTS CHAPTER 15
 SOLUTIONS TO CONCEPTS CHAPTER 15 1. v = 40 cm/sec As velocity of a wave is constant location of maximum after 5 sec = 40 5 = 00 cm along negative x-axis. [(x / a) (t / T)]. Given y = Ae a) [A] = [M 0 L
Rotation: Moment of Inertia and Torque
 Rotation: Moment of Inertia and Torque Every time we push a door open or tighten a bolt using a wrench, we apply a force that results in a rotational motion about a fixed axis. Through experience we learn
Chapter 11 Equilibrium
 11.1 The First Condition of Equilibrium The first condition of equilibrium deals with the forces that cause possible translations of a body. The simplest way to define the translational equilibrium of
Measurement with Ratios
 Grade 6 Mathematics, Quarter 2, Unit 2.1 Measurement with Ratios Overview Number of instructional days: 15 (1 day = 45 minutes) Content to be learned Use ratio reasoning to solve real-world and mathematical
Applications of Second-Order Differential Equations
 Applications of Second-Order Differential Equations Second-order linear differential equations have a variety of applications in science and engineering. In this section we explore two of them: the vibration
p atmospheric Statics : Pressure Hydrostatic Pressure: linear change in pressure with depth Measure depth, h, from free surface Pressure Head p gh
 IVE1400: n Introduction to Fluid Mechanics Statics : Pressure : Statics r P Sleigh: P..Sleigh@leeds.ac.uk r J Noakes:.J.Noakes@leeds.ac.uk January 008 Module web site: www.efm.leeds.ac.uk/ive/fluidslevel1
DYNAMIC ANALYSIS ON STEEL FIBRE
 International Journal of Civil Engineering and Technology (IJCIET) Volume 7, Issue 2, March-April 2016, pp. 179 184, Article ID: IJCIET_07_02_015 Available online at http://www.iaeme.com/ijciet/issues.asp?jtype=ijciet&vtype=7&itype=2
MODULE E: BEAM-COLUMNS
 MODULE E: BEAM-COLUMNS This module of CIE 428 covers the following subjects P-M interaction formulas Moment amplification Web local buckling Braced and unbraced frames Members in braced frames Members
Advanced Structural Analysis. Prof. Devdas Menon. Department of Civil Engineering. Indian Institute of Technology, Madras. Module - 5.3.
 Advanced Structural Analysis Prof. Devdas Menon Department of Civil Engineering Indian Institute of Technology, Madras Module - 5.3 Lecture - 29 Matrix Analysis of Beams and Grids Good morning. This is
Adequate Theory of Oscillator: A Prelude to Verification of Classical Mechanics Part 2
 International Letters of Chemistry, Physics and Astronomy Online: 213-9-19 ISSN: 2299-3843, Vol. 3, pp 1-1 doi:1.1852/www.scipress.com/ilcpa.3.1 212 SciPress Ltd., Switzerland Adequate Theory of Oscillator: