Green Cooling Technologies Market trends in selected refrigeration and air conditioning subsectors
|
|
|
- Shannon Phillips
- 7 years ago
- Views:
Transcription
1 Proklima Green Cooling Technologies Market trends in selected refrigeration and air conditioning subsectors
2 As a federally owned enterprise, GIZ supports the German Government in achieving its objectives in the field of international cooperation for sustainable development. Published by Deutsche Gesellschaft für Internationale Zusammenarbeit (GIZ) GmbH Registered offices Bonn and Eschborn, Germany Programme Proklima Dag-Hammarskjöld-Weg Eschborn, Germany Phone: Fax: proklima@giz.de Internet: Responsible Bernhard Siegele, Proklima Programme Manager, bernhard.siegele@giz.de Authors Dr. Johanna Gloёl, Dietram Oppelt, Claudia Becker, Dr. Jonathan Heubes (HEAT GmbH, Glashütten) Concept Jürgen Usinger, Dietram Oppelt (HEAT GmbH, Glashütten) Database management Pascal Radermacher (HEAT GmbH, Glashütten) Review Dr. Daniel Colbourne, Jürgen Usinger (HEAT GmbH, Glashütten), Franziska Froelich, Marion Geiss, Alvaro Zurita (GIZ Proklima) On behalf of The German Federal Ministry for the Environment, Nature Conservation, Building and Nuclear Safety Division K II 7, International Climate Finance, International Climate Initiative Köthener Straße Berlin, Germany Phone: +49 (0) Fax: +49 (0) kii7@bmub.bund.de Internet: Photos Title: Marius Graf - Fotolia.com Layout GIZ Proklima Place and date of publication Eschborn, Mai 2014 Serial number G-S en-01 2
3 The Green Cooling Initiative Refrigeration and air conditioning are responsible for a significant share of global greenhouse gas emissions. Especially in developing and emerging countries, the demand for cooling equipment is rising. Low efficiencies and high leakage rates of refrigerant gases with high global warming potential will increase these emissions drastically. Our goal is to accelerate the transfer of environmentally friendly technologies in the refrigeration and air conditioning sectors to and within developing countries. We believe that the exchange between technology suppliers and users, as well as between the industry, public institutions and civil society is crucial for the promotion of green cooling technologies. We want to provide useful information, give access to knowledge and get you connected with others working on the same goal: Promoting green cooling technologies worldwide. The International Climate Initiative Since 2008, the International Climate Initiative (IKI) of the Federal Ministry for the Environment, Nature Conservation, Building and Nuclear Safety (BMUB) has been financing climate and biodiversity projects in developing and newly industrialising countries, as well as in countries in transition. Based on a decision taken by the German parliament (Bundestag), a sum of at least 120 million euros is available for use by the initiative annually. For the first few years the IKI was financed through the auctioning of emission allowances, but it is now funded from the budget of the BMUB. The IKI is a key element of Germany s climate financing and the funding commitments in the framework of the Convention on Biological Diversity. The Initiative places clear emphasis on climate change mitigation, adaption to the impacts of climate change and the protection of biological diversity. These efforts provide various co-benefits, particularly the improvement of living conditions in partner countries. The IKI focuses on four areas: mitigating greenhouse gas emissions, adapting to the impacts of climate change, conserving natural carbon sinks with a focus on reducing emissions from deforestation and forest degradation (REDD+), as well as conserving biological diversity. New projects are primarily selected through a two-stage procedure that takes place once a year. Priority is given to activities that support creating an international climate protection architecture, to transparency, and to innovative and transferable solutions that have an impact beyond the individual project. The IKI cooperates closely with partner countries and supports consensus building for a comprehensive international climate agreement and the implementation of the Convention on Biological Diversity. Moreover, it is the goal of the IKI to create as many synergies as possible between climate protection and biodiversity conservation. GIZ Proklima Proklima is a programme of the Deutsche Gesellschaft für Internationale Zusammenarbeit (GIZ) GmbH. Since 2008 Proklima has been working successfully on behalf of the Federal Ministry for the Environment, Nature Conservation, Building and Nuclear Safety (BMUB) under its International Climate Initiative (ICI) to disseminate ozone-and climatefriendly technologies. Proklima has been providing technical and financial support for developing countries since 1996, commissioned by the German Federal Ministry for Economic Cooperation and Development (BMZ) to implement the provisions of the Montreal Protocol on Substances that Deplete the Ozone Layer. 3
4 Contents Contents... 4 Executive Summary Introduction The Challenge Environmental impact of the RAC sectors Green Cooling Technologies The Technology Mechanism (UNFCCC) Stakeholders in the RAC sectors The Green Cooling Initiative (GCI) Content overview Stakeholders and Networks The private sector Manufacturers End-users Associations Financial institutions (private sector) Standardisation bodies The public sector Governments and government institutions Development agencies and financing organisations (public sector) Civil society Non-governmental organisations (NGO) Consumers Universities and research institutes Media Sector transformation Two examples: Sector transformation in MAC and domestic refrigeration Overview of stakeholders and dynamics in the focus subsectors of this study The role of networks Background on subsector analysis
5 3.1 Subsector characterisation Direct and indirect emissions Emission reduction potentials Lifetime CO 2 emission calculations Regulations and standards Production and demand Methodology to derive production and demand Estimating current and future numbers of appliances in use, unit sales, and emissions Unitary air conditioning (UAC) Subsector characterisation Overview Energy efficiency trends International and national regulations Scope of improvement Alternative technologies - refrigerants Energy efficiency Reducing cooling needs CO 2 emissions over lifetime Production and Demand Overview Demand Production Future demand and stock Global GHG emissions and reduction potential Market situation and technology options in key-focus markets (China, India and Brazil) Conclusion Mobile air conditioning (MAC) Subsector characterisation Overview Energy efficiency trends International and national regulations Scope of Improvement Alternative Technologies - refrigerants Energy efficiency
6 5.3.3 Reducing cooling needs CO 2 emissions over life time Production and demand Overview Demand Production Future demand Future emissions Conclusion Chillers Subsector characterisation Overview Energy efficiency trends International and national regulations Alternative technologies/refrigerants Indirect emissions Reducing cooling needs CO 2 emissions over lifetime Production and demand Overview Demand Production Conclusion References Annex List of abbreviations Glossary Country list Tables Figures
7 Executive Summary The study analyses the potential of green technologies in the refrigeration and air conditioning (RAC) sectors. It provides an overview on the global cooling value chain for key RAC subsectors and how private and public stakeholders as well as the civil society can drive dynamics towards a wider penetration of green cooling technologies. The refrigeration and air conditioning sectors are responsible for about 15% of global greenhouse gas (GHG) emissions, equivalent to 4.8 GT CO 2 per annum (2012) going up to 12 GT CO 2 (2030). Emissions are growing at a rate which is at least three times faster than the global average increase of GHG emissions. Emissions in the RAC sectors originate from the use of high-global-warming-potential (GWP) refrigerants and energy consumption of RAC systems. About 50% of the emissions can be avoided globally by 2030 against the business-as-usual (BAU) by leapfrogging from high GWP refrigerants to low GWP natural refrigerants and applying best in class, highly energy efficient appliances. The Technology Mechanism of the UN Framework Convention on Climate Change (UNFCCC) targets an accelerated technology transfer across all sectors and countries globally to allow the deployment of the least climate harming technologies. Front runners among the public and private sector as well as from the civil society will play a pivotal role in driving the dynamics towards low-gwp solutions. The urgency to reduce GHG emissions requires that available technologies are rapidly deployed. With the phase-out of chlorofluorocarbons (CFCs) low-gwp technologies with natural refrigerants were directly deployed for refrigerators while for mobile air conditioning (MAC) and many other appliance systems, high-gwp hydrofluorocarbons (HFC) were introduced. The engagement of the civil society and NGOs was driving the leapfrogging to the best technology for domestic refrigerators. Public, regulatory pressure in the EU is now driving the dynamics also for MAC systems, and the German car industry is now opting to use natural refrigerants. The study identifies key factors through which different public, private and civil society stakeholders can influence the dynamics towards an accelerated and wider penetration of green cooling technologies. To allow a better assessment on how stakeholders can steer towards green cooling technologies, this study provides insights into the global cooling value chain for the three key RAC subsectors, unitary air conditioners, chillers and mobile air conditioning. Unitary Air Conditioning (UAC) is the most significant RAC subsector, both in terms of current and future sales and carbon emissions. With some 100 million units sold (2012), the UAC subsector is the single largest RAC subsector with a market size of USD 60 billion. Nearly two thirds of the world demand originates in Asia with China being responsible for the main share of 38%. Future demand for UAC is expected to nearly triple by 2030 to over 1.7 billion units. The production of UAC is also highly concentrated in China. China accounts for 65% of the global production capacity of UACs. The next biggest producer is Thailand with a 7% share of the global production capacity. Approximately three quarters of the total production in China are dominated by the five leading players (Gree, Midea, Haier, Chigo, Hisense). UAC green cooling potential: Applying best available technologies currently in the market with high energy efficiencies and natural refrigerants can lead to lifetime CO 2 emissions reductions for UAC systems from approximately 25 to 10 tco 2eq. The natural refrigerant HC-290 has been tested successfully by leading manufacturers in China and India and is now available in the market. Countries such as Japan and Korea but also China have been running labelling and minimum energy efficiency programs over years and were able to significantly increase the energy efficiencies of the UAC stock. From 2006 to 2012 China has improved the Energy 7
8 Efficiency Ratio (EER) of the best UAC models available in its market from 4 to 6. Most of the units sold in developing countries still have an EER lower than 3, significantly below the best available standards. UAC green cooling dynamics: The leading manufacturers for UACs, in particular the leading Chinese manufacturers are now able to sell highly energy efficient UACs with inverter technologies and natural refrigerants. Governments and end users for all countries will benefit from the introduction of mandatory labelling, the introduction of demanding minimum energy efficiency standards and front-runner programs. Labels are ideally linked to the mandatory use of natural refrigerants. Mobile Air Conditioners (MACs): Over 90% of cars are now equipped with MACs. In total some 56 million units are sold with a value of about 6 billion USD. Demand in Asia has grown very strongly during the last decade with Asia now accounting for nearly 50% of the global demand. The remainder of the market is mostly split between the US and Europe. MAC producers traditionally were producing for their regional original equipment manufacturers (OEM), i.e. the leading Japanese MAC manufacturers Denso, Calsonic Kansei and Keihin-Sanden for Toyota, Nissan and Honda, the leading European MAC producers, Behr and Valeo, for Daimler, VW, BMW, Renault and PSA, the leading US MAC manufacturers Delphi and Hallo-Visteon for General Motors and Ford. With the emergence of the Chinese car market as the largest market of the world, European, Japanese, US and Korean manufacturers were setting up joint ventures with Chinese car manufacturers. Also the traditional MAC suppliers moved to China to set up local production facilities. Now the leading production locations for MAC systems are China, Japan, the US and Germany. MAC green cooling potential: Applying best available technologies currently in the market with high energy efficiencies and natural refrigerants can lead to life time CO 2 emissions reductions for UAC systems from around 25 to 10 t CO 2eq. Coefficients of Performance (COP) for MAC systems continuously improved during the last ten years from 1 to up to 4. MAC green cooling dynamics: It will be interesting to see if other regions will follow Europe in the move towards low-gwp refrigerants in the MAC subsector. China will likely play a decisive factor in this regard being the leading market place for car and MAC manufacturing. Most European players present in China are likely seeking synergies with their technological developments in Europe. Globally, there is significant emission reduction potential with labelling for energy efficiency and Minimum Energy Efficiency Standards (MEPS) for MAC systems. Chillers: Nearly half of the demand of the 7.4 billion USD market for chillers is coming from Asia where China has a 38% market share. The next biggest market is the US market. Total global sales are some units (2012). The production of chillers is less concentrated than for UAC and MAC. Leading producing countries are China, the US and Italy. The international market is still dominated by three US (Carrier, Trane, York) and two Japanese brands (Hitachi and Daikin) although Chinese brands (Gree, Haier, Midea, Broad) are rapidly gaining market share mainly in Southeast Asia and the Middle East. Chiller green cooling potential: Applying best available technologies currently in the market with high energy efficiencies and natural refrigerants can lead to lifetime CO 2 emissions reductions for UAC systems from approximately 3500 to 1500 t CO 2eq. Significant emission reductions can be achieved by moving towards better energy efficiency with EER above 5, where most chillers deployed in developing countries still have EER below 3 or 4. Chiller green cooling dynamics: Nearly all leading manufacturers globally offer highly energy efficient chillers with natural refrigerants. The deployment of natural refrigerants for chillers is still held back through standards or regulations limiting their use, especially regarding hydrocarbons due to their flammability. These barriers need to be removed. Both, front-running private industry players and the public can play a key role in this respect. Often energy efficient chillers with natural refrigerants have somewhat higher upfront costs but lower operation costs. This barrier between higher upfront and lower running costs can be effectively addressed through available loan financing. The 8
9 public in cooperation with private financial institutions can play a key role in providing the required financing and guarantees especially for small and medium enterprises and operators. The public would greatly benefit by also applying Minimum Energy Efficiency Standards (MEPS) for chillers in combination with labelling and certifications requiring the use of natural refrigerants. 9
10 1 Introduction 1.1 The Challenge The worldwide demand for refrigeration and air-conditioning (RAC) is increasing steadily due to a growing population, urbanisation and economic growth. More and more people are able to afford domestic refrigeration and air-conditioning and the same is true for enterprises. A functioning cold chain can prevent food going to waste. Cooling is often necessary for the development of competitive industry and services. The energy demand for cooling in developing countries 1 is likely to rise by 7% annually until the year 2050 (IEA, 2010). Calculations by GIZ Proklima have shown that equipment with low efficiencies and high release rate of refrigerants with high global warming potential (GWP) are the reasons why the RAC sectors are responsible for 10 to 15 % of global greenhouse gas emissions. This is the equivalent of 4.8 Gt CO 2eq per year, but this number is rising continuously and is estimated to reach more than 12 Gt CO 2eq per year by 2030 (GIZ Proklima, 2012, based on Schwarz et al., 2011). On average, about two-thirds of greenhouse gas (GHG) emissions are caused by energy consumption (indirect emissions) and one-third by the use of refrigerants (direct emissions) (GIZ Proklima, 2012). Direct emissions can be completely avoided by switching to natural refrigerants with a negligible or no GWP and it is estimated that more than 50% of indirect emissions from energy consumption can be cut by improving product efficiency (GIZ Proklima, 2012). Increasing demand for electricity due to refrigeration and air conditioning can contribute to the already strained energy supply in many developing countries. This now rising demand often comes after long periods where little money was invested to expand the electricity production, leading to problems with energy security (UNIDO, 2008; CLASP, 2002; WEC, 2013). Black-outs are not only an inconvenience but have negative impacts on the whole economy. Whilst energy efficiency in industrialised countries is often discussed in the context of environmental impacts, in developing countries it helps to meet additional goals: The same electricity generation can be used to supply more people in countries where electrification rates are still low (WEC, 2013). It also reduces the need for additional investments in energy infrastructure, which can be a huge financial burden to poor countries (WEC, 2013). Energy efficient appliances often lead to net savings for households because of lowered energy bills. Compared to industrialised countries, the cost of electricity per kwh relative to income is typically much higher in developing countries. Thus the investment in energy efficient equipment yields a greater economic benefit. Scope of this study and guiding questions The aim of this study is to analyse the potential of green technologies in the refrigeration and air conditioning (RAC) sectors and show the key actors and drivers promoting their dissemination. The study compiles information about the market structure, key technology options and important stakeholders in order to answer the following questions: 1 This study refers to developing and developed countries where the designations developed and developing do not necessarily imply a judgment on the state of the development process in a certain country. The designations avoid having to differentiate between the slightly differing classifications under the Montreal Protocol and the UN Framework Convention on Climate Change (UNFCCC) unless necessary for clarification and are, therefore, used for easier comprehension. 10
11 What are the key RAC subsectors with a high potential for technology transfer that leads to significant CO 2 emission reductions? What is the global demand for refrigeration and air conditioning now and in the future? Which countries and companies play key roles in the supply and purchasing of RAC equipment? What are the key technology options and technology trends for specific RAC subsectors? What does the stakeholder landscape look like? What are the dynamics of green cooling technologies spreading in the different subsectors? What are the contributions and potential contributions of governments, NGOs and private sector stakeholders to sector transformation? What are significant international and national regulations and standards in the RAC sectors? The three subsectors unitary air conditioning (UAC), air conditioning chillers and mobile air conditioners (MAC) were chosen because of their high GHG emission reduction potential and their high potential for applying natural refrigerants instead of fluorinated gases. The percentage of cars, houses, offices and other buildings with air conditioning is growing, especially in developing countries. UAC, air conditioning chillers and MAC are among the most significant contributors to GHG emissions of all RAC sectors and therefore among the ones with the highest emissions mitigation potential. UACs and MAC are significant mainly because of the high number of individual units whereas AC chillers can individually contain substantial amounts of refrigerant. High leakage rates and poor end-oflife refrigerant recovery make MAC a subsector with a high potential for emission reductions. There are natural refrigerant solutions for applications in all of these subsectors already in use. Information for this study was collected in a thorough literature review and a model was used to calculate current and future stock numbers and emissions. The study addresses active and potential members in the Green Cooling Initiative (GCI) network and related technology partnerships who want to get involved in green cooling technologies. This includes private, public and civil society actors in developing and industrialised countries with the ability to develop, market or support the dissemination of such green technologies in the RAC sectors. 1.2 Environmental impact of the RAC sectors Refrigerants pose a threat to the environment because of their ozone depletion potential (ODP) and GWP. They fall into the following groups: Table 1: Different groups of refrigerants and their ozone depletion and global warming potentials compared to CO 2 on a 100 (GWP 100) and 20 (GWP 100) year time horizon (IPCC, 2007) Substance group Abbreviation ODP GWP 100 GWP 20 Atmospheric lifetime Example (refrigerant/foam blowing agent) Saturated chlorofluorocarbons CFC 0, , ,700 R11, R12 14,400 14,400 Saturated HCFC 0, R22, R141b hydrochlorofluorocarbons 0,11 5,490 average 1,502 4, Saturated hydrofluorocarbons HFC R32, R134a 14,800 12,000 average 2,362 4,
12 Unsaturated hydrochlorofluorcarbons Unsaturated hydrofluorocarbons Natural refrigerants u-hcfc < R1233zd u-hfc - <1-12 days R1234yf, R1234ze, R1234yz R744 (carbon dioxide) R717 (ammonia) R290 (propane) The GWP of a substance can be determined for different time horizons (usually 20, 100 or 500 years). Because of the different atmospheric lifetimes ranging from a few years to several centuries, usually the GWP 100 is used. HFCs with an average lifetime of 21.7 years might be better represented by the GWP 20. The Montreal Protocol on substances that deplete the ozone layer from 1989 is now effectively controlling the use of the ozone depleting refrigerants chlorofluorocarbons (CFC) and hydrochlorofluorocarbons (HCFC). There has been a worldwide ban on CFCs since HCFCs, initially used as substitutes for CFCs, have been forbidden in most non-article 5 ( developed ) countries since 2010 but are still widely used in Article 5 ( developing ) countries where they must be phased out by Figure 1 shows the expected phase-out of CFCs and HCFCs in developing and developed countries. Figure 1: Phase-out plan for CFCs and HCFCs according to the Montreal Protocol Hydrofluorocarbons (HFC) have no ozone depleting potential and are currently not controlled under the Montreal Protocol. HFCs can have extremely high GWP. They are listed under the Kyoto Protocol to the United Nations Framework Convention on Climate Change (UNFCCC) from 2005 as substances whose emissions are to be limited or reduced. Some countries and regions, such as the EU, have already introduced laws restricting the use of HFCs (see Chapter 3). Unsaturated HFCs (u-hfcs, also marketed as hydrofluoroolefins, or HFOs ) are synthetically made HFCs with no ODP and low GWP that have been developed specifically to fulfil regulations that prohibit HFCs with higher GWP (e.g., above 150). Some are slightly flammable and combustion can form hydrogen fluoride (HF). In the atmosphere their decomposition leads to formation of trifluoroacetic acid (TFA), which is a strong acid with toxicity to some organisms (Key et al., 1997). TFA exists naturally in the oceans in very low concentrations, it is highly persistent and there is no known degradation mechanism (Luecken et al., 2010). There are no studies about the longterm effect on organisms and the food chain. Whilst only 10-20% of HFC-134a are transformed into TFA, 100% of u-hfc-1234yf reacts to TFA. Studies modelling future TFA concentrations in rainwater due to u-hfc1234yf predict concentrations 2 A residual consumption of HCFCs will be allowed until
13 that were already reached in extreme events in the 1990, when HFC-134a was first used more widely (Henne et al., 2010; Luecken et al., 2010; Christoph, 2002) and are regularly reached in China today (Wang et al., 2014). These models therefore seem to underestimate future TFA concentrations. Concentrations are expected to be especially high in dry regions with little precipitation or close to industrial centres and high population density. TFA has been shown to accumulate in conifers already (Christoph, 2002). TFA from Europe is expected to precipitate in Asia and Africa in concentrations of up to 2500 ng L -1 (Henne et al., 2010). To a small amount, TFA produces tropospheric ozone (Luecken et al., 2010). The strong advantages of natural refrigerants are that they have zero ODP, a negligible GWP, are part of the natural biogeochemical cycles and do not form persistent substances in the atmosphere, water or biosphere. They include carbon dioxide (CO 2), ammonia (NH 3) and hydrocarbons such as propane (C 3H 8), propene (C 3H 6) and isobutane (C 4H 12) and have been used as refrigerants for over 150 years (Calm, 2008). Natural refrigerants are widely used in some RAC applications, for example isobutane in domestic refrigerators and ammonia in large cooling processes. Hydrocarbons (HCs) are flammable and ammonia is slightly flammable, corrosive and of higher toxicity. Therefore they require additional safety measures ( Table 2 gives a summary of refrigerant safety groups). Simple measures such as using appropriate materials, selection of safe components and technician training can handle these undesirable characteristics. Natural refrigerants are relatively cheap because they are mass produced for a wide range of uses and are readily available if distribution structures are present. Natural refrigerants can often be sourced as by-products from other processes. Recycling or disposal after use in RAC systems is easier than with CFCs, HCFCs and HFCs. Table 2: Refrigerant safety groups after ISO817:2009 and EN378-1:2008. Lower toxicity Higher toxicity No flame propagation A1, e.g.: R-744 (CO 2), CFC-11, B1, e.g.: HCFC-123 R404a, HFC-134a, R410a Lower flammability A2, e.g.: u-hfc-1234yf, HFC-152 B2, e.g.: Methyl formate, R717 (ammonia) Higher flammability A3, e.g.: hydrocarbons, R430a, R510a B3 The following list shows a comparative summary of refrigerant properties, highlighting positive and negative properties of different refrigerants. The ODP of HCFCs is lower than that of CFCs, but still high enough to justify a complete phase-out. Both HCFCs and HFCs have a high GWP, up to several thousand times higher than that of CO 2. All fluorinated refrigerants produce persistent wastes. They are persistent in the atmosphere or in the case of the decomposition product TFA in the hydrosphere. Fluorinated refrigerants are also produced from fluorspar, which is a depletable resource. Its global reserves are estimated to be 240 million tonnes, most of which can be found in China, Mexico, Mongolia, South Africa and Namibia (USGS, 2013). European reserves are mainly depleted (CTEF, 2013). Mine production in 2012 was at 6.85 million t (USGS, 2013); making fluorspar available for another 35 years if consumption stays constant. The EU has included fluorspar in its list of the 14 most critical raw materials, defined by supply risk and economic importance (EC Enterprise and Industry, 2010). The reasons are that mining activities are limited to a few countries globally, the recycling rate is smaller than 1 % and substitution possibilities are few (EC Enterprise and Industry, 2010). 13

14 In order to be able to recycle or dispose HCFCs, HFCs and u-hfcs, they have to be reclaimed from appliances with special equipment and be cleaned. Recycling is mainly possible for pure refrigerants and even more difficult for blends. Cleaned refrigerants can be used again. Refrigerants for disposal have to be rendered environmentally safe by incinerating them at high temperatures and collecting decomposition products such as hydrogen fluoride (HF) and hydrogen chloride (HCl). Dedicated recycling plants are rare in developing countries. Special safety measures have to be taken for hydrocarbons, u-hfcs (flammability) and ammonia (higher toxicity). Some CO 2 systems are not as energy efficient in warmer climates or need additional cycle adjustments to become as efficient as other systems. Generally, applications using natural refrigerants are as efficient as or more efficient than those using HFCs and HCFCs; HC and ammonia have superior thermodynamic properties with high critical temperatures and low boiling points (Mohanraj, 2009). The costs can be related to the system, which is typically higher for flammable or higher toxicity refrigerants. However, newly developed u-hfc refrigerants are significantly more expensive (estimates range from 100 US$/kg to 150 /kg or more in Europe) than HFCs that have been in use for several years where patents have expired (approx. 6US$/kg), and also more expensive than natural refrigerants (e.g. CO 2: <1 US$/kg). Because there are no international property rights, natural refrigerants can be produced or sold by any company in any country locally. Far more patents are associated with HFCs, u-hfcs and u- HCFCs refrigerants and applications than with natural refrigerant applications. Only natural refrigerant system designs can be patented, not the refrigerants themselves. Table 3: Refrigerant characteristics. Green shows positive and red negative properties The reduction of indirect emissions (i.e., CO 2 emissions from electricity production or fuel consumption) is related to both the energy efficiency of RAC equipment and the carbon intensity of electricity production in a country or vehicle fuel. The carbon intensity indicates the amount of CO 2 released per unit (kwh) of electricity produced and is dependent on a country s energy mix. Because of its high energy consumption, the RAC sectors have a high potential to reduce these. Some countries have introduced sector specific regulations such as minimum energy performance rules to reduce the CO 2 emissions by increasing the efficiency. 14
15 Terms 1: Precautionary approach The term precautionary approach refers to the principle that one should take caution before engaging in an activity that poses a threat to the environment or human health, even if this threat is not fully known or scientifically proven yet. By employing this principle, one means to anticipate and avoid damage as opposed to having to repair damage that could have been prevented. Coined by the Montreal Protocol in 1987 and in the 1992 Rio declaration, the precautionary principle has become internationally recognised: Where there are threats of serious or irreversible damage, lack of full scientific certainty shall not be used as a reason for postponing cost-effective measures to prevent environmental degradation. Just like CFCs, HCFCs and HFCs, the newest generation of synthetic refrigerants, u-hfcs will again be responsible for introducing a persistent compound into the environment. Contrary to its predecessors, u-hfcs have no ODP and a low GWP. Their degradation product TFA however, has no known degradation pathway and will accumulate in water bodies, plants and soils. It is phytotoxic and its long term effects are not known yet. This is another case where the precautionary approach should take effect and a more environmentally-friendly technology be introduced. 1.3 Green Cooling Technologies Equipment with both maximised energy efficiency and natural refrigerants, which is therefore minimising its environmental impact, is here termed green cooling technologies. Green cooling technologies offer long-term solutions for almost all types of systems and appliances in the RAC sectors. The growing use of HFCs in the RAC sectors can be clearly linked to the phase-out of CFCs and HCFCs in these industries, a fact that was specifically noted by the Rio+20 declaration in 2012 and other high level political declarations, such as by the Climate and Clean Air Coalition (CCAC). In the past the phase-out of one group of refrigerants that damaged the environment has always led to the increased use of refrigerants that were only slightly less damaging. This happened in the switch from CFCs to HCFCs (though note that HCFCs were regularly used before the phase-out of CFCs as well) and on to HFCs in developed countries and is currently visible in developing countries where HFCs are replacing HCFCs, and to some extent in developed countries where u-hfcs are introduced. Switching from ozone depleting and climate harming fluorinated substances to natural refrigerants in energy-efficient systems and applications is often referred to as leapfrogging. Within the Montreal Protocol, states have always been encouraged to choose alternatives that not only save the ozone layer but that also do not harm the climate, such as by the UN Secretary-General Ban Kimoon, who urged parties and industries to seize the opportunity provided by the HCFC phase-out to leapfrog HFCs wherever possible in his 2011 Ozone Day message. A phase-down of HFCs is also discussed as an amendment to the Montreal Protocol. With growing concern on future regulations prohibiting the use of HFCs, countries as well as industries have to look for opportunities to leapfrog which will prevent them from having to phase new sets of fluorinated gases in and out again. Figure 2 visualises the leapfrogging scheme. 15
 Whilst the Montreal Protocol only covers ozone depleting substances (ODS), the following substances, with a climate impact, are covered under the UNFCCC and the")
16 Figure 2: Leapfrogging to green cooling technologies 1.4 The Technology Mechanism (UNFCCC) Whilst the Montreal Protocol only covers ozone depleting substances (ODS), the following substances, with a climate impact, are covered under the UNFCCC and the Kyoto Protocol: HFCs, PFCs, methane, CO 2, N 2O and SF 6. Other than the Montreal Protocol, which includes a binding prohibition of production and use of ODS, the Kyoto Protocol aims to generally limit the emissions of CO 2 and other greenhouse gases to the atmosphere. In this context it is important to take the RAC sectors into account as they have the potential to contribute significantly to the reduction of greenhouse gas emissions. According to the Kyoto Protocol, the reduction of emissions is preferable where a high reduction can be achieved in a cost-effective way, which is often the case in developing countries where the reduction potential is high. Previous mechanisms under the UNFCCC to reduce greenhouse gas emissions include emission trading, the clean development mechanism and joint implementation. The latter two already include cooperation between developing and industrialised countries, but were criticised about being inefficient (e.g. Bullock et al., 2009; Zaman and Hughes, ). Most importantly, the Kyoto Protocol has no overall limits on emissions or substances for developing countries where the Montreal Protocol also foresees binding targets for developing countries. Whilst the Bali Roadmap (2007) called for emission reductions in both developing as well as industrialised countries, it was acknowledged that industrialised countries would support developing countries with less financial means. The promotion of environmentally friendly technologies was suggested as another way to reduce emissions costeffectively with the additional benefit of economic growth and technical development. 3 see also 16
17 In 2010, at the Conference of the Parties in Cancun to review and revise the progress of the Kyoto-Protocol, the socalled Technology Mechanism was introduced. It aims to mobilize the development and transfer of clean technology to boost efforts to address climate change, getting it to the right place at the right time and for the best effect on both adaptation and mitigation. The Technology Executive Committee (TEC), and Climate Technology Centre and Network (CTCN) have been formed to implement the technology mechanism. An important feature of this mechanism is the emphasis on private sector involvement and informal networks. The task of the TEC and the CTCN is to support the development and transfer of technologies for mitigation and adaption. They are to provide an overview of technological needs and analysis of policy and technical issues consider and recommend actions to promote technology development and transfer promote and facilitate collaboration between policy, industry, research and non-profit organisations catalyse the development and use of technology road maps or action plans at international, regional and national levels. The TEC is formed by nine members from annex I countries, nine from non-annex I countries 4 and one member each from a small island state and a least developed country. Whilst the TEC mainly provides policy advice to the Conference of the Parties to the UNFCCC, the CTC, hosted by UNEP, supports the practical side of the Technology Mechanism. It has the task to manage and respond to requests from developing countries foster collaboration and access to information and knowledge to accelerate technology transfer strengthen networks, partnerships and capacity building for climate technology and private sector involvement 1.5 Stakeholders in the RAC sectors The RAC sectors show a high potential for technology transfer as their environmental impact can be highly reduced by advanced technologies. Technology transfer for green cooling involves a whole series of different stakeholders from government institutions to manufacturers and end-users of refrigeration equipment: Individuals, organisations and businesses who are seeking or offering climate-friendly cooling technology or related know-how, funding opportunities, or policy advice. Their action and interaction determine the rate, direction, and success of technology change. The main players are: Private sector: Manufacturers, industry associations, end-users, standardisation bodies, financial institutions; servicing companies, training centres Public sector: Governments, international organisations, government institutions, financial institutions, training and certification institutes Civil society: Non-governmental organisations (NGOs), research institutes (including universities), media, consumers An important role can be attributed to the interaction between stakeholders of the three sectors. Technology change almost always involves stakeholders from at least two of the sectors. Previous examples of industry transformation 4 Countries listed in annex I of the Kyoto protocol are industrialised countries and economies in transition. Non-annex I countries are developing countries. The country groups have different commitments under the Kyoto protocol in terms of CO 2 emission reductions and providing financial resources. 17
18 towards more environmentally friendly technologies show that the private sector plays a vital role in these transformations. However, consumers and environmental NGOs also have the potential to initiate change (as is illustrated in chapter 2). When tackling global issues such as climate change, ozone protection and social and environmental sustainability, networks between various stakeholders and across borders play an increasingly important role. 1.6 The Green Cooling Initiative (GCI) GCI is a project funded by the International Climate Initiative (IKI) of the Federal Minister for the Environment, Nature Conservation, Building and Nuclear Safety (BMUB) and implemented by the Deutsche Gesellschaft für Internationale Zusammenarbeit (GIZ) GmbH. The aim of the Green Cooling Initiative (GCI) is to accelerate the transfer of environmentally friendly technologies in the refrigeration and air conditioning sectors to and between developing countries. These sectors have been identified as a growing market in developing countries with predicted rising greenhouse gas emissions and for which the necessary technology to significantly reduce emissions is already available for most of the RAC subsectors. The GCI wants to establish a global Green Cooling Network with several sub-networks, such as regional networks (Africa network) or sectoral networks (MAC network). The aim of the networks is to promote dialogue on green cooling and knowledge transfer between stakeholders from the private and public sectors and civil society. More specifically, the GCI aims to initiate several exemplary technology cooperation projects with private sector involvement in developing countries that will lead to CO 2 emission reductions. The infrastructure for different networks will be provided and supported by a website containing information about the refrigeration and air conditioning sectors ( On this website, GCI aims to provide sector-specific information that is interesting for members of the private sector wishing to invest in a certain country, policy makers that are seeking to reduce emissions in their countries, as well as civil society players who want to enhance their actions for green cooling. As much as possible, information on technologies, best-practice examples, regulations, capacity building, market trends and emission reduction potentials will be given on a country by country level. Additionally, the website will be a platform that can connect different stakeholders to form new networks or technology partnerships for the transfer of environmentally-friendly RAC equipment. The first step in establishing networks is a systematic mapping of information, which is supported by this study. GCI and the Technology Mechanism GCI wants to enhance visibility of green cooling technology and the related mitigation potential in the TEC. Furthermore, the initiative offers support to this body when it comes to RAC specific policy recommendations, for example through Technology Road Maps and workshops with TEC members and observers. GCI also looks for opportunities to integrate its working groups or technology partnerships, once established, into the CTCN. 1.7 Content overview Chapter 2 examines the stakeholder landscape and the dynamics of green cooling technologies spreading around the world. It highlights the role of different stakeholders and shows examples from the private, public and civil society sectors and their actions and activities involving the RAC sectors. Who are relevant drivers and what are the contributions of countries, NGOs, private sector stakeholders and others to sector transformation? 18
19 Chapter 3 describes the technical background of the refrigeration cycle and the methodologies used to compile and calculate data for chapters 4, 5 and 6. Chapters 4, 5 and 6 look at the three subsectors UAC, MAC and AC chillers in more detail. Technical options to reduce GHG emissions from these subsectors in regard of refrigerants as well as energy efficiency are explored. The average energy efficiency in different countries is compared to energy efficiency regulations and mitigation potentials. The chapters also show the present and future global demand for units in these subsectors and resulting GHG emissions. The current market for the chosen subsectors is described in detail, including the main producing countries and the most important companies. 19

20 2 Stakeholders and Networks The international effort to transform the RAC sectors to use ozone- and climate-friendly technology originates from the Montreal Protocol, an environmental treaty ratified by 197 countries. Increasingly, the focus is shifting from avoiding ODS to reducing the overall GHG emissions of the RAC equipment. This is addressed under the climate regime of the UNFCCC. Still, political treaties and regulations are not the only reasons why industry sectors change and also do not necessarily lead to an immediate reaction. There are broader dynamics, triggering innovation cycles, towards more climate solutions driven by several stakeholders. It is worth looking at all the players and stakeholders involved in the process of sector transformation to understand the dynamics, driving forces, chances and challenges. State governments and government institutions are responsible for drafting national regulations and putting them in place. The private sector will have to implement the desired changes in terms of technologies. On the other hand, civil society players, such as NGOs or consumers, can also influence both the public and private sectors to bring green cooling technologies forward. At this time, there is still significant potential to reduce greenhouse gas emissions through the dissemination of green cooling technologies energyefficient technologies using natural refrigerants. Some subsectors are more Figure 3: Stakeholders and networks in RAC technology advanced than others, so they provide examples of dynamics that can advance green cooling in other sectors or other regions. Therefore, this section takes a closer look at the categories of stakeholders and provides examples of dynamics that have influenced the dissemination of green cooling technologies or have the potential to do so. The individual chapters in this study on mobile air conditioning, unitary air conditioning and chillers will then take a closer look at the current situation, the main drivers and trends in these three subsectors. 2.1 The private sector In the outcome document of the 2012 Rio+20 UN conference on sustainable development, the states emphasised their reliance on the private sector: We recognize that a dynamic, inclusive, well-functioning, socially and environmentally responsible private sector is a valuable instrument that can offer a crucial contribution to economic growth and reducing poverty and promoting sustainable development (UNCSD, 2012). In many cases, the private sector, usually in the form some major players, has both opposed change and driven change. Economic risk is likely a decisive factor for the private sector but it may not be the only one. It is therefore important to explore reasons for private companies to become laggards or front-runners in the sector transformation towards green cooling. 20
21 2.1.1 Manufacturers Manufacturers of RAC systems and components are central and critical players in technology transfer within the RAC sectors. They are the ones to offer climate-friendly technology, to seek new solutions for their businesses or to block technologies that they believe to be a threat. Manufacturers can participate in technology transfer by driving innovation within their own business areas towards more climate-friendly solutions, which they can then put on the market and gain competitive advantages in the market. Both the market as determined by consumer awareness and demand and the regulatory environment drive manufacturers to innovations, which can be measured by looking at patent files or transfers. A study on patents suggests that innovation of climate-friendly technology was mostly driven by energy prices until the 1990s and since then, environmental and climate policies have induced more innovation (Dechezlepretre et al., 2010). In terms of technology transfer, it is important to note that companies inventing new environmentally friendly alternatives will usually first file domestic patents only, as the innovation is developed specifically for a certain country. In a study on patents specifically for mobile air conditioning systems, inconsistent regulatory landscapes are found to be an important factor to limit the international diffusion of patents (Rave and Goetzke, 2011). If the invention is to be used in other regions, companies have to invest in additional R&D to adapt the patent to another country s specific conditions, such as climate or regulatory framework. Other options for manufacturers to participate in sector transformation are to participate in collaborative research and development programmes, and to provide input to standard committees or stakeholder processes for new or revised regulations. Drivers and dynamics - example 1 Climate friendly manufacturing innovation supported and driven by government kick-starting subsidies Businesses in Germany that install a new energy-efficient commercial cooling system running on natural refrigerants can obtain a subsidy of up to 35% of the installation costs for the new system. From 2008 to 2013, subsidies of around 60 million Euros for over 600 modernised or new systems were granted. This programme is part of the German Environmental Ministry s Climate Initiative 5. When a newly developed technology is more expensive than established systems, a government provision such as this German subsidy programme can assist manufacturers in making their climate-friendly products competitive. They are often more expensive because of logistical aspects such as the availability of parts and engineer expertise. Once these new systems have penetrated the market to a certain degree they become economically viable. Stakeholders involved: Public sector Private sector Civil society In addition to equipment and component manufacturers, chemical companies have considerable influence in the RAC industry. These companies develop and sell substances that are used as refrigerants. With growing international concern on the high GWP of fluorinated substances, increasing efforts are put into the development of so-called low-gwp refrigerants. The major players in this area are a few large companies, among them Honeywell and Dupont (USA), Arkema (France), Solvay (Belgium) and Mexichem Fluor (Mexico). Natural refrigerants are also provided by various companies such as HyChill (Australia), Settala Gas (Italy), Linde (Germany) or Puyang Zhongwei (China) to name a few
22 Due to international property rights and patents that apply to newly developed, synthetic refrigerants, every generation of these substances sees less companies competing. For example, u-hfc-1234yf is manufactured by two companies only DuPont and Honeywell. DuPont and Honeywell are also cooperating in this area and the market has oligopolistic, sometimes monopolistic features 6. A third company, Arkema has announced that it wants to start the supply of u-hfc-1234yf in There is some conflict between manufactures of RAC equipment and chemical companies. More expensive refrigerants, such as u-hfc-1234yf mean higher profits for chemical companies but higher costs for equipment manufacturers. Natural refrigerants are not yet readily available in every country or region. Availability of refrigerants also involves companies that do not manufacture but supply and distribute the substances. Especially in developing countries, availability can be an issue for both newly developed synthetic refrigerants and natural refrigerants. Synthetic refrigerants have to be manufactured by skilled people, knowhow is limited and production is controlled. There is a higher potential for profit, and therefore a high incentive for an enterprise to produce them. Natural refrigerants are mass commodities, which enables also small companies to process and sell them. Whether or not natural refrigerants are available in a country or region is an important factor in terms of infrastructure needed to manufacture and service green cooling equipment locally. Therefore, local supply networks play a critical role. Hydrocarbons are already widely used in some places, but their availability, and that of CO 2 as refrigerant, is still a barrier for the introduction of natural refrigerants in developing countries End-users End-users vary considerably with the subsector in question. The main end-users for domestic refrigeration and room air conditioners are individual consumers and appliance retailers. Concerning commercial refrigeration, breweries, cold drink and ice cream companies operate fleets of display cabinets, drink fountains and vending machines. Big office buildings, hotels and data centres have higher cooling needs and use chillers and other commercial refrigeration equipment. Car manufacturers are the only direct purchasers of MAC devices. Different industries, supermarkets and food processing companies are all end-users of commercial and industrial RAC products. Consumer brands such as beverage, beer or ice-cream companies are especially important in this context due to their global operation and recognition value. They have the potential to contribute greatly to the dissemination of climate-friendly technology by aligning their procurement strategy accordingly. Organisational changes affecting technology procurement within end-user companies can be driven by economic reasons (energy savings), risk analyses dealing with regulations and pressure from public opinion, and corporate environmental sustainability goals (emission reduction). Public awareness and environmental campaigns by non-governmental organisation (NGOs) can also exert pressure on consumer brands, and even push them into a front-runner role (see also Example 8). Drivers and dynamics - example 2 Supply contract between end-user and supplier The Coca-Cola Company committed to purchasing only HFC-free cold drink equipment by 2015, with CO 2 being the refrigerant of choice. To support this redirection in the company s procurement system, they signed a supply
23 agreement over 1.1 million compressors with manufacturer Sanden Japan. This enabled the supplier to scale up their production 7. Stakeholders involved: Public sector Private sector Civil society Corporate social responsibility Businesses are facing more and more scrutiny from consumers, public institutions and non-governmental organisations. Consequently, corporate sustainability (CSR), environmental protection and climate change issues are entering the CEO level of corporations and business networks have become more prevalent. CSR plans have become a vital part of companies strategic work, especially where strong brand recognition value is involved. These programmes are then presented in sustainability reports and related communication activities. In this respect initiatives in the RAC sectors can also link for example to the The Global Compact. The Global Compact was created to foster exchange on CSR. It aims to provide a platform for companies to align with UN agencies, labour and civil society to support fundamental principles in the areas of human rights, labour rights, environment and transparency and corporate governance. One of its 10 main principles, principle 7, refers to the precautionary approach, a principle that has become fundamental to international environmental agreements such as the Montreal Protocol (see Terms 1). The relevance of CSR in the global context of sustainable development was also recognised by the Rio+20 conference where the signatories committed to support national regulatory and policy frameworks that enable business and industry to advance sustainable development initiatives taking into account the importance of corporate social responsibility (UNCSD, 2012). The relevance of business networks is also described in chapter Associations Many countries have at least one industry association dedicated to the RAC sectors, such as the Brazilian ABRAVA or the Japanese JRAIA. Other types of associations range from those covering a specific subsector, for example the Southern African Refrigerated Distribution Association (SARDA) or the Indian Association of Ammonia Refrigeration (AAR), to international or regional associations, such as the Association of European Refrigeration Compressor Manufacturers (ASERCOM). On behalf of their members, associations monitor and analyse market trends, conditions and trade practices as well as new or proposed legislation in their industry sector. Associations give a voice to their sector as opposed to an individual company and represent the businesses interests towards national or international institutions, the media and the public. Associations also set up conferences or trade events. On behalf of their members, associations may participate in stakeholder consultations concerning refrigeration related regulations, and comment on the related developments externally to the media and internally to their members. Drivers and dynamics - example 3 Industry participating in consultation processes on regulations For a new directive on energy efficient commercial refrigeration equipment (Ecodesign), the Joint Research Centre (JRC) of the European Commission invited input from stakeholders such as manufacturers, consumer organisations and NGOs. Industry associations as well as individual companies provide data to the JRC, which is used in the
24 preparation process 8. Associations such as EPEE and Eurovent have also participated in other Ecodesign preparation processes such as on compressors and chillers, and in the stakeholder consultation about the European F-Gas Regulation 9. Stakeholders involved: Public sector Private sector Civil society Associations work in the interest of their members. If an associations membership comprises mainly companies with little or no interest in developing or supporting alternative, climate-friendly technologies, then this association is unlikely to become a driving force in green cooling. However, some industry associations are already dedicated to natural refrigerants, such as Eurammon or the International Institute of Ammonia Refrigeration (IIAR). Many associations run their own websites with news on products, training opportunities etc. Industry marketing network on natural refrigerants Marketing company shecco offers online portals dealing specifically with natural refrigerant technology to connect likeminded companies 10. shecco has been organising a series of ATMOsphere events, which deal with the developments in the natural refrigerants sector and bring together mainly companies already dedicated or interested in green cooling, specifically in using natural refrigerants Financial institutions (private sector) Entering into new business sectors can cost businesses a lot of money: Activities range from conducting research, developing new products and building a new or converting an existing production line to raising awareness for climate-friendly products and training employees. Private companies, and especially small and medium size enterprises (SME), often depend on substantial loans when making organisational changes towards a more sustainable future. This is where banks come into play: To make sure companies applying for loans will be able to pay back, banks expect them to explain their project plan and calculation for a return on their investment. By integrating environmental standards into their operations, banks are able to ensure a greater environmental efficacy with their customers. Many of the alternatives using natural refrigerants face higher upfront investment costs while operating costs are lower through the greater energy efficiencies of the appliances. Banks can here play a pivotal role lowering the entry hurdle by making new investments available for green cooling alternatives. Often, the access to loans is the biggest hurdle for new, energy efficient appliances, especially for SME. Some banks already request that the environmental impact of an investment is considered. For example, the World Bank s private branch, the International Finance Corporation, lists resource efficiency and pollution prevention as one of their performance standards (IFC 2012). The Equator Principles (EP), which 79 financial institutions worldwide have adopted, also requires a minimum environmental assessment (EP, 2013). Banks could go one step further by considering minimum environmental performance standards, such as low-gwp requirements for loans concerning investments in RAC technologies. This may be a starting point for multistakeholder networks: Such a network could address and support financial institutions looking to include specific requirements in their environmental standards, such as for building loans Position papers can be found on the associations websites and 10 e.g 24

25 2.1.5 Standardisation bodies Standards are principally technical specifications as a voluntary self-commitment of the industry. However, national laws and regulations often refer to certain standards and thereby make compliance with them compulsory. With regards to refrigeration and air conditioning systems, especially those existing standards dealing with safety are relevant. They may present a barrier to the introduction of alternative, climate-friendly technologies because the technical options often rely on hydrocarbons, which are flammable substances, or on ammonia, which is higher toxicity or CO 2 which is very high pressure. Among a variety of different standardisation bodies with regards to refrigeration systems, the main international organisations are the International Standardisation Organisation (ISO) and the International Electrotechnical Commission (IEC). At the European level, there are the Comité Européen de Normalisation (CEN) and Comité Européen de Normalisation Èlectrotechnique (CENELEC). Both international as well as both European committees collaborate in a way to align standards, which helps avoid contradiction of requirements in different standards. In addition, most countries have at least one national body that reviews and adopts international or European standards, or produces their own standards. 11 Figure 4: Standards organisations While the organisations themselves are usually independent of governments and industry, the experts participating in the committees for drafting the standards are to a large extent industry representatives. With standards being under regular review, the manufacturing or end-using industry can in fact influence or even determine the content of standards. This is where private sector companies can assist to create enabling environments for the market entrance or dissemination of green cooling technologies. However, the opposite is true as well: Companies can also create enabling environments for synthetic, climate-damaging refrigerants and oppose changes in favour of natural refrigerants. International standards are especially important for developing countries, which are often not able to develop their own standards due to missing resources (Snickars, 2002). Developing countries therefore often adopt international standards and integrate them in national regulations. Therefore, international standards on the safe use of natural refrigerants are likely to have global significance. In any case, if a country adopts an international standard for its national regulation, it is nevertheless advisable that this is done in a way that suits the country s specific conditions and needs. Drivers and dynamics - example 4 Standardisation process in developing countries The Swedish Standards Institute (SIS) and the Swedish International Development Cooperation Agency (SIDA) are organising workshops in developing countries to build capacity in standardisation processes and standards related to 11 More detailed information on this in the GIZ handbook Guidelines for the safe use of hydrocarbon refrigerants. 25
26 environmental topics. Workshops are targeted at people from industry, government and local NGOs. The following workshops are examples from their programme: Building institutional capacity on standard setting in the East African Community (EAC), CSR seminars in South Africa and Botswana and Climate related standards and the green economy: opportunities and challenges for developing countries in South Asia and East Africa 12. Stakeholders involved: Public sector Private sector Civil society 2.2 The public sector The transformation of a technology sector is also determined by policies such as energy efficiency regulations, or incentive programmes. These are driven by the public sector governments on the national or regional (e.g. EU) level. Bans of substances damaging the environment or human health are anchored in international treaties. Developed countries contribute to funds such as the Multilateral Fund of the Montreal Protocol. Developing countries on the other hand are responsible for devising their ODS phase-out plans and demand funds for technology transfer or capacity building programmes. International implementing agencies overseeing such programmes are also part of the public sector Governments and government institutions Governments and government institutions play a vital role in the transformation of industry sectors as they can create or prevent so-called enabling environments. Opening markets to foster competition, and devising rules and regulations are approaches that governments can use to set the course for the innovation and introduction of new technologies in the RAC sectors. Measures to promote green cooling aim to reduce both direct and indirect emissions from RAC systems and appliances. 13 While policies often target either the refrigerant type (and its GWP) or the energy efficiency, they can sometimes be combined. For example, rewards for using natural refrigerants may be integrated into labelling schemes for buildings and appliances: The German product label Der Blaue Engel combines energy efficiency standards with the use of natural refrigerants and the UK BREEAM scheme provides additional points for using natural refrigerants. Terms 2: Enabling environments Enabling environments are a main component of the Technology Transfer Framework by the UNFCCC: The enabling environments component of the framework focuses on government actions, such as fair trade policies, removal of technical, legal and administrative barriers to technology transfer, sound economic policy, regulatory frameworks and transparency, all of which create an environment conducive to private and public sector technology transfer. 14 Generally, in order to support sustainable growth in a country or region, government intervention needs to be based on a sound and well thought through rationale. It also needs to be checked regularly and amended if necessary to assure continuous effectiveness. In its innovation strategy project, the OECD emphasises that policies to stimulate innovation need to take account of changes in the global economy and the transformation of innovation processes (OECD, 2010). Where strong regulations on the use of fluorinated gases in applications are in place, industry will have to commit to drive the innovation and dissemination of more climate-friendly technology Seminars 13 An overview of policy measures for the reduction of direct and indirect emissions in the RAC sectors is given in the module 8.1 of the GIZ handbook on NAMAs (GIZ, 2013)
27 The European Union has the most comprehensive policy framework in place that affects the RAC sectors and supports the emergence and dissemination of green cooling technologies. The F-gas regulation 15 targets the use of high-gwp fluorinated refrigerants, as does the MAC directive for mobile air conditioning. Energy efficiency of appliances such as air conditioners is targeted in ecodesign directives 16 and with the European energy label 17. Drivers and dynamics - example 5 Corporations driving regulation change Until 2011, using HC-290 or HC-600a in commercial point-of-sale refrigeration equipment was not legal in the US. Starting in 2008, several companies such as Ben & Jerry s and Pepsico, introduced HFC-free bottle coolers and ice cream freezers to the US for trial, and initiated formal approval processes with the U.S. Environmental Protection Agency s (US EPA) Significant New Alternatives Policy (SNAP) Program. Hydrocarbon technology for various types of commercial coolers and freezers, as well as for household ones, was first approved by US EPA in Recently, Red Bull and their supplier Vestfrost submitted additional refrigerator types using R600a to EPA for approval, which was granted in Stakeholders involved: Public sector Private sector Civil society In the context of the Montreal Protocol and the phase-out of substances used as refrigerants, ministries or other national authorities can have decisive influence on the direction that the RAC sectors in their countries will go in. In particular, all so-called A5-countries have established National Ozone Units (NOU) that are responsible for managing the phase out of ODS in compliance with the Montreal Protocol. The Maldives, for example, are one of the leading developing countries in terms of phase-out of HCFCs, planning to stop using them entirely in 2020, ten years ahead of the globally agreed phase out target. This decision is motivated by both ecological and economic reasons: Moving early to phase out the use of HCFCs not only helps protect the beautiful tropical environment tourists come to see but also positions Maldives as a strong eco-destination, commented Mohamed Nasheed, President of the Republic of Maldives (UNEP 2010). Drivers and dynamics - example 6 Refrigerator labelling and recycling programme in Brazil In Brazil, Minimum Energy Performance Standards (MEPS) for refrigerators, freezers and fridge freezers were adopted in In addition, electric utility companies have to invest 0.5% of their annual net revenues in energy end use efficiency programmes. This measure is known as the Brazilian Public Benefits Fund. Between 2008 and 2010, as part of this programme, 45 electricity distribution companies replaced more than 380,000 refrigerators in low-income households at no cost, replacing old inefficient appliances with modern efficient appliances. 18 The households can save money and reduce energy consumption. For manufacturers of refrigerators, such a programme offers new sales opportunities. For the country, efficient appliances can help secure energy supply and avoid additional investment in new power supply. Drivers and dynamics - example 7 Labelling information campaign in India
28 India launched an energy star rating programme for refrigerators and air conditioners in For greater impact, the Bureau of Energy Efficiency (BEE) conducted a communication and awareness raising campaign to educate salespeople on the labelling scheme. The training was designed to provide participants with knowledge about energy efficiency and advise how to promote environmentally friendly products. 19 Stakeholders involved: Public sector Private sector Civil society Another possibility for governments to actively support green cooling technologies is via procurement practices: Public authorities are major consumers of products and services and their purchasing behaviour does influence the industries in their respective countries. The term Green Public Procurement (GPP) describes the process where public institutions procure goods and services with a reduced environmental impact as compared to such goods and services that would otherwise be procured. Many governments have integrated GPP guidelines in their regulatory framework. For example, the Chinese government procurement regularly publishes a list with environmentally friendly products for public procurement, which is integrated into the country s legal framework (CCICED 2011). GPP is primarily a voluntary instrument governments can employ. It can be promoted through networking and exchange of experiences such as through the International Green Purchasing Network 20 or the SCP Clearinghouse 21. By including ambitious conditions regarding energy-efficiency and natural, low-gwp refrigerants in their public procurement standards, governments can serve as role models for green cooling and create awareness among employees and the private sector. They can thereby provide industry with strong incentives for developing green cooling technologies and products. An overview of policy instruments that governments may apply to green the refrigeration and air conditioning sectors can be found in the GIZ handbook on NAMAs Development agencies and financing organisations (public sector) The international effort to phase-out ODS under the Montreal Protocol is closely related to the international climate change regime. HFCs are often used to replace ozone-depleting substances in RAC technology, but as they contribute to global warming, HFCs are regulated under the UNFCCC and the Kyoto Protocol. The main implementing organisations in the phase-out of HCFCs under the Montreal Protocol are multilateral implementation organisations such as the World Bank, the United Nations Environment Programme (UNEP), the United Nations Development Programme (UNDP) and the United Nations Industrial Development Organisation (UNIDO). These organisations receive funding for their implementation work from the Multilateral Fund (MLF), through which developed countries provide substantial funds for technology transfer programmes in developing countries. Each so-called donor country may implement up to 20% of its contribution in bilateral projects. This is where donor countries implementing agencies such as the German GIZ or the French Agency for Development (AFD) come into play: They put these bilateral projects in cooperation with the partner countries into practice. In addition, developed countries have individual funding programmes, such as the German International Climate Initiative, which has initiated several demonstration projects like the conversion of production lines for air conditioners in China and climate friendly chillers in Indonesia, both using HC-290 as refrigerant module
29 Drivers and dynamics - example 8 Conversion of air conditioner production line In a bilateral cooperation between India and Germany, the Indian company Godrej & Boyce converted one of its production lines to produce split air conditioners using the hydrocarbon propane as refrigerant. The project was funded by the German Environmental Ministry under its International Climate Initiative 23. Activities also involved the training of production and service technicians in the handling of flammable hydrocarbon refrigerants. The project successfully established a best-practice model for India and the region. Consumers are now able to choose the green air conditioner model that is also highly energy efficient. Stakeholders involved: Public sector Private sector Civil society With programmes on resource efficiency and sustainable public procurement, UNEP for example also supports developing countries efforts to initiate and implement green public procurement (UNEP 2012), which could in turn lead to industry incentives and the promotion of green cooling technologies (see previous section on governments and government institutions). Another source of funding for projects related to climate-friendly refrigeration and air conditioning is the Global Environment Facility (GEF). Among other projects, GEF has provided funding for the development and dissemination of solar powered refrigerators using natural refrigerants in Africa and Latin America (Solar Chill) 24. Financing institutions such as the World Bank or regional development banks such as the African Development Bank (AfDB), Asian Development Bank (ADB), Inter American Development Bank (IADB) as well as other sub-regional development banks can link allocation of loans to certain criteria. At the World Bank, for example, environmental assessment is used to examine the potential environmental and social risks and benefits associated with its investment lending operations. Where loans are requested for refrigeration and air conditioning equipment, specific standards concerning energy efficiency, leak prevention, and the use of low-gwp refrigerants could help give green cooling technologies a fast start. 2.3 Civil society Non-governmental organisations (NGO) Several non-governmental organisations (NGO) committed to protect the environment are supporting the phase-out of ozone depleting and climate warming substances. This has led to campaigns in RAC sectors, where NGOs advocate environmentally friendly alternatives for existing technologies: Foremost are Greenpeace and the so-called Greenfreeze revolution which introduced the first model of an F-gas free refrigerator in The technology, for which Greenpeace made sure no patent would apply, was quickly taken up all over Europe, and has spread to Asia, South America, and finally in 2011 to the US market. 25 Today, half of all refrigerators produced globally use natural refrigerants (TEAP 2013). Drivers and dynamics - example 9 NGO action driving corporate action
30 NGOs do not necessarily highlight the subsectors with the highest CO 2 emissions from the RAC sectors but often focus on highly visible companies. Preceding the 2000 Sydney Games, Greenpeace requested major Olympic sponsors, specifically Coca-Cola, to not use HFCs at the so called environmental Olympics. In 2004, the three companies Coca-Cola, Unilever and McDonald s, who had all been addressed by the Greenpeace campaign, created Refrigerants, Naturally!, with Greenpeace and UNEP as founding supporters. Climate-friendly refrigeration has become a major part of the sustainability pledges of these companies. In 2009, CEO Muhtar Kent committed Coca-Cola to eliminating HFCs from all new point-of-sale refrigeration equipment in Stakeholders involved: Public sector Private sector Civil society For Greenpeace as well as for other environmental NGOs, green cooling is usually one among various campaigns or focus points. Other NGOs include the World Wide Fund For Nature (WWF), the European Environmental Bureau (EEB), Noe21 or the Institute for Governance and Sustainable Development (IGSD). The Environmental Investigation Agency (EIA) has also been campaigning intensively for the phase-out of F-gases. Their activities include research, publication of reports and press releases, involvement in stakeholder processes on regulations, and engagement in the Montreal Protocol related meetings and discussions. Another possibility for NGOs is to participate in standardisation processes. In Europe, for example, the organisations ECOS 26 and NORMAPME 27 specialise in this field Consumers Individual households are the prevalent group of end-users when it comes to household appliances such as refrigerators, freezers and room air conditioners. Both environmental and economic benefits play a role here: Consumers are increasingly aware of the environmental impact that their product choice may have. Energy efficiency labels assist consumers in choosing environmentally friendly appliances. Even if the initial cost is higher, they can help save money in the long term. Labelling schemes related to energy efficiency are now common in many countries, not only in the European Union, the United States, or Japan, but also in Brazil, India and South Africa. Looking again at Greenfreeze, the introduction of hydrocarbon household refrigerators: It was only when Greenpeace ran a marketing campaign through which some 70,000 refrigerators were preordered that the first manufacturer converted its factory in order to produce these units 28. The conscious decision of these consumers to opt for a climate-friendly alternative played a crucial part in the technology s successful market introduction. In terms of finance, the sheer mass of consumers makes their contribution impossible to neglect, especially with increasing wealth in densely populated countries. The Climate Policy Initiative (CPI) mapped the overall climate finance investments in Germany for 2010, and concluded that private households made the largest single contribution to overall the country s climate finance that year. These investments were made in the building sector and came up to USD 18.6 billion, or 38% of Germany s total USD 49 billion German climate finance flows (Juergens et al., 2012) and 30
31 2.3.3 Universities and research institutes Universities and research institutes are important actors for the refrigeration and air conditioning sectors. Their work can be commissioned by industry or public institutions or a combination of both. For example, the German Institut für Luft- und Kältetechnik (ILK) Dresden, an independent research institute, has been working together with a private company on the development of a chiller that uses water as refrigerant. The research was commissioned by the German Federal Ministry of Economics and Technology 29. The Danish Technological Institute (DTI) is a partner in the Solar Chill Initiative aiming to bring solar refrigerators and vaccine coolers to developing countries. In developing countries, universities and other research institutes are often involved in their countries HPMPs. One example for this is the University des Mascareignes in Mauritius, which cooperates with the government to establish a research and training platform on natural refrigerants, but there are many others as well. Most technical universities have refrigeration and air conditioning related research departments as parts of their Mechanical Engineering schools such as the ones at Shanghai Jiaotong University (China), Skopje University (Macedonia), University of Cape Town (South Africa), or the University of Ubertandia (Brazil) to name only a few Media In spite of the fact that refrigeration and air conditioning contribute significantly to greenhouse gas emissions and global warming, different technologies and refrigerants are usually not widely discussed in the media. One example where media has shown interest is the discussion about the future of mobile air conditioning. The car manufacturing industry comprises some of the world s largest companies, such as Daimler, General Motors and Volkswagen. The decision concerning the future refrigerant choice of these companies will influence the entire servicing and component manufacturing sector around the world. The discussion focussed on both safety and climate issues. It was taken up in various media channels, from industry platforms such as r744.com 30 to major public broadcasters such as the German ZDF 31. Drivers and dynamics - example 10 National ozone unit media workshops The government of the Maldives plans to ban the import of HCFC-based equipment from 1 July In order to raise awareness among both consumers and industry about these regulations, the NOU sought the media s cooperation and organised a national media training workshop on ozone and climate. It was attended by 22 journalists and broadcasters from the country s print, broadcast and web media. 32 Stakeholders involved: Public sector Private sector Civil society 2.4 Sector transformation Two examples: Sector transformation in MAC and domestic refrigeration Before 1992, domestic refrigerators and mobile air conditioners used CFC-12 as refrigerant. This section looks at the transformation of these two subsectors that happened in response to the phase-out of CFCs. Both industry sectors had to look for alternatives and HFC-134a (with its GWP of 1,430) was an available technical alternative at that time. But the two subsectors went two different ways: Air conditioning in passenger cars was switched to HFC-134a Auto:-Gef%C3%A4hrliche-Klimaanlagen
32 entirely while only roughly half of the world s domestic refrigerators produced today use HFC-134a the other half uses climate-friendly hydrocarbons (TEAP 2013). Therefore, it is relevant to ask which factors were decisive to determine these transformations. The following scheme gives an overview about these subsector transformations and the predominantly involved actors. Figure 5: Overview of two subsector transformation processes 32
33 The Greenpeace Greenfreeze campaign can be identified as a major driving force in the transformation of the domestic refrigeration subsector. Greenpeace cooperated with engineers, manufacturers and consumers to bring Greenfreeze refrigerators on the market. The influence of the consumer also factors in: The Greenfreeze campaign induced some preorders by consumers who wanted to buy the climate-friendly option. Without the NGO-led initiative to introduce hydrocarbons, the subsector transformation may have been towards HFC-134a as the only alternative, similar to what happened in the mobile air conditioning subsector. The mobile air conditioning subsector is today on the verge of transforming again as HFC-134a was banned for MAC in the EU because of its high GWP Overview of stakeholders and dynamics in the focus subsectors of this study The following table summarises the current and potential dynamics that the various groups of stakeholders can engage in. Table 4: Overview of stakeholders and dynamics Stakeholders Private sector Equipment manufacturers Suppliers of components Industry associations Current and potential green cooling dynamics UAC MAC Chillers MAC MAC Chillers promote and apply labelling, MEPS and top-runner programmes demand their suppliers to develop/optimise technical option with natural refrigerants and high energy efficiency further, consider purchase commitments for certain components in order to scale up the suppliers industries run marketing campaigns to make green solutions visible to the buyer provide input to stakeholder consultations regarding standards and regulations form innovation coalitions and networks to promote green cooling solutions pioneer in using HC instead of HFCs participate in funded projects to convert their production lines (MLF, bilateral funds) pioneer in developing MAC with natural refrigerants (i.e. German car manufacturers choice for CO 2) provide servicing infrastructure of MAC systems with natural refrigerants Use HCs, CO 2 and ammonia as refrigerants participate in funded projects to convert their production lines (MLF, bilateral funds) produce technical options demanded by manufacturers provide input to stakeholder consultations regarding standards and regulations look for scaling up industries and will produce optimised components if these are demanded by equipment manufacturers MAC manufacturer to innovate systems (i.e. electric compressors work efficient for cooling and as heat pumps) display and compete with high COPs/low-CO 2 labelling provide and innovate on components for MAC systems with natural refrigerants provide input to stakeholder consultations regarding standards and regulations promote the use of MACs with natural refrigerants as global solution drive new industry standards for MAC systems with natural refrigerants
34 Refrigerant producers and suppliers Technicians, vocational schools drive the development and application industry standards for chillers with natural refrigerants improve availability and supply infrastructure for natural refrigerants to foster scaling up of green cooling industries train personnel to stay up-to-date to state of the art technology can profit as part of an emerging/growing infrastructure for green cooling industries can participate in internationally funded projects or partnerships to receive training End-users operators can integrate green cooling requirements in their CSR programmes and Financing institutions Public sector Governments and government institutions International organisations Financing institutions Civil society Research institutes and universities procurement principles UAC and chillers hotel and office building operators can integrate green cooling requirements in their Chillers UAC MAC Chillers MAC procurement principles install low-gwp and energy efficiency related requirements for loans concerning investments in RAC technologies and buildings dedicated loan programmes for the use of low-gwp chillers devise and enforce regulations or certification programmes regarding refrigerants, leakage etc. (i.e. ban/phase down the use of HFCs and promote the use of natural refrigerants instead) define tax and rebate programmes set up programmes for labelling, MEPS and top-runners, and integrate these into public procurement ban the import/production of UAC with HFCs ban the use of HFC-134a promote the use of natural refrigerants credit programmes regarding AC related fuel consumption tax incentives or subsidies for the use of very energy efficient chillers with natural refrigerant coordinate phase-down of high-gwp HFCs provide information on technical options, capacity building for policy-makers install low-gwp and energy efficiency related requirements for loans concerning investments in RAC technologies and buildings provide favourable loans for low GWP solutions (preferential loan requirements, interest rates etc.) work with governments and industry on technical options strengthen international cooperation for to accelerate technology know-how transfer cooperate with industry and public institutions regarding the dissemination of green cooling in MAC investigate the impact of TFA on the biological system NGOs raise awareness on the global carbon footprint of UACs and global/national GHG reduction targets 34
35 bring attention to problems associated with HFCs petition governments to strengthen regulations MAC bring attention to problems associated with HFCs and fuel consumption Media raise awareness on the global carbon footprint RAC sectors and global/ national GHG reduction targets bring attention to problems associated with HFCs Consumers look for appliance labels and preferably buy green cooling technologies 35
36 2.5 The role of networks Reducing environmental impact is not the sole reason for companies to convince others to work along with them. An important factor is that multi-stakeholder groups can have a more thorough impact on an industry sector, may attract more attention among the public. If big companies lead the way in demanding sustainable technology solutions for their businesses, the corresponding technology providers will have to scale up their economies as well. Thus the entire sector will profit from further development of products, improvement of infrastructure, and falling prices. Understanding this potential, Greenpeace has established a branch called Greenpeace Solutions, where the focus is not on opposition to bad environmental behaviour of companies, but on collaboration and support of those frontrunners who dare to make substantial changes: We catalyze solutions to address global concerns. We engage with businesses, governments, and consumer markets so that one pressures the other to create dramatic improvements in our environment, explains Greenpeace on the corresponding website. 34 Both Greenfreeze and Solar Chill are refrigeration-related campaigns within this Greenpeace branch. The importance of cooperation and interaction of the private and the public sector in networks and partnerships is increasingly recognised. Multi-stakeholder partnerships initiatives among national governments, international institutions, the business community, labour groups, non-governmental organisations, and other actors as drivers for sustainable development were highlighted at the 2002 Johannesburg World Summit 35. Efforts to create and maintain such partnerships come from both the business and the public sector. Business networks exist on three levels and there is interaction between the levels. An important one on the global, overarching level is the World Business Council for Sustainable Development (WBCSD). It was founded just before the 1992 Rio conference, or Earth Summit, with the objective to assure the business sector would be consulted and its voice heard in the negotiations. It does not concentrate on one specific sector or technology, but issues related to refrigeration and air conditioning may be relevant when sustainable supply chains and mitigation of greenhouse gases is discussed. The Consumer Goods Forum (CGF) is a global network of retailers, manufacturers and other stakeholder in the consumer goods sector. It has identified refrigeration as one of the important factors for their efforts to increase environmental sustainability in supply chains. In 2010, the CGF companies resolved to begin phasing out HFC refrigerants by 2015 and replace them with non-hfc refrigerants (natural refrigerant alternatives) where these are legally allowed and available for new purchases of point-of-sale units and large refrigeration installations. 36. A business network specialised in commercial stand-alone refrigeration equipment is Refrigerants, Naturally!. The initiative promotes the use of natural refrigerants in cold drink equipment, ice-cream freezers and other commercial refrigeration equipment. The cooperation aims to support a positive regulatory and political framework for investment in climate-friendly technologies. The initiative consists of leading cold drink and ice cream companies and it is officially supported by Greenpeace and UNEP. Linkages to TEC and CTCN
37 With its Technology Mechanism, the UNFCCC approaches transfer of climate-friendly technology across all technology sectors. It explicitly recognises multi-stakeholder networks and their potential for scaling up technology transfer, and has therefore installed the CTCN. Its mission is to promote transfer of environmentally sound technologies for climate change mitigation. The Climate Technology Network (CTN) is supposed to institutionalise networks to facilitate the cooperation on climate-friendly technologies. It is still in the process of being formed and could include everyone who is able to contribute to technology deployment and transfer, ranging from research institutes to non-governmental organisations and private sector initiatives. The Advisory Board to the CTCN is currently establishing this network of stakeholders.. Since the dissemination of green cooling technologies can reduce emissions significantly, the RAC sectors should be dealt with under the Technology Mechanism. 37
38 3 Background on subsector analysis 3.1 Subsector characterisation With products ranging from small MAC units in passenger cars to an industrial sized cooling facility in a dairy processing factory (see table 4), the RAC sectors are not a homogeneous industry. Accordingly variable are technical options to reduce emissions, which can therefore only really be looked at on a subsector basis. UAC, MAC and chillers are the subsectors that will be looked at in greater detail here. Table 5: Overview of the refrigeration and air conditioning sectors Sector Subsector Examples Unitary air conditioning Room air conditioner Air Conditioning Chillers AC chiller for the cooling of office buildings Mobile AC Passenger car Domestic refrigeration Refrigerators, freezers Refrigeration Commercial Refrigeration Vending machines, integrated supermarket cooling Industrial Refrigeration Condensing unit in food processing Transport Refrigeration Transport of perishable foods in cooled lorries Direct and indirect emissions Direct emissions of refrigerant can occur during normal operation because of leaks from pipes and components. Without appropriate recovery and recycling facilities, most direct emissions occur when the refrigerant is exchanged during regular servicing or when a unit is dismantled (end-of-life emissions). Even though the amount of refrigerant in small units is only in the range of grams to a few kilograms, the high GWP of HCFCs and HFCs means that direct emissions contribute approximately 1/3 to total emissions from the RAC sectors. Indirect emissions are due to energy consumption and contribute the other 2/3 of total emissions. These depend heavily on the source of electricity and how much CO 2 is emitted during its generation and are therefore different for each country. Indirect emissions can be reduced by raising the energy efficiency of a product or by decarbonising electricity production. This study focuses only on potential CO 2 emission reductions achieved by energy efficiency measures; the introduction of less carbon intensive renewable energies is not accounted for in the calculations. Both direct and indirect emissions are given in CO 2 equivalents. Direct emissions are weighted according to the GWP of refrigerants. 38
. During the phase change from liquid to vapour, the heat is absorbed.")
39 The refrigeration cycle The refrigeration cycle follows the same principle for all applications in the different subsectors. Refrigerants are substances that absorb or release latent heat during a phase change (vapour to liquid and back). During the phase change from liquid to vapour, the heat is absorbed. This happens when the pressurised liquid refrigerant expands from the expansion device in the low pressure evaporator, which is a form of heat exchanger. Air or another medium is cooled at the evaporator s surface when the heat of the medium is absorbed. To prepare the refrigerant for the next cooling cycle, a compressor pressurises the refrigerant to a dense vapour, which then undergoes a phase change from vapour to liquid in the condenser. During this process, the refrigerant releases heat, which is transported outside the space that needs cooling. The heat transfer is supported through a heat exchanger. Electrical fans blow air over the evaporator and condenser to enhance the heat exchange. Different applications require changes to the basic design, some of which are illustrated by the following examples: In cars and trucks the power to operate the compressor often comes directly from the motor. In chillers, water is cooled at the evaporator s surface instead of air, and can then be distributed over longer distances, for example in large office buildings. Figure 6: The refrigeration cycle. The refrigerant is under high pressure on the red side and heat is rejected. There is low pressure on the blue side and heat is absorbed Emission reduction potentials In order to transfer the RAC sectors to green cooling, both the direct and indirect emissions have to be reduced. There are several approaches to compare emissions from applications with different energy efficiencies and refrigerants that take both direct and indirect emissions into account. A life cycle assessment looks at all the emissions and negative environmental impacts from production to dismantling. Life cycle emission calculations only look at the direct and indirect emissions during manufacturing, operating and disposal. The TEWI emission calculation is a life cycle approach for appliances where the manufacturing emissions are not calculated. Manufacturing emissions are often difficult to calculate and generally have a minor impact on the overall life cycle emissions in the RAC sectors. It is important to note that some efforts to reduce one form of emissions can inadvertently increase another form of emissions Indirect emissions The energy efficiency of products can usually be improved significantly, but numbers vary depending on the application. Whilst the improvement of energy efficiency can be cost effective to a certain point and decrease the lifetime costs of the product, from a certain point onwards, each additional efficiency measure becomes disproportionately expensive. The following table shows general areas where energy efficiency improvements can apply. More details will be given for each subsector in the following parts of this chapter, but ultimately the potential is different for each product. As the energy efficiency also depends on the thermodynamic properties of the refrigerant, a change to a different refrigerant can also influence the indirect emissions. 39
40 Table 6: Areas of energy efficiency improvement Area of improvement Description Example System improvements components in the system are modified or changed higher efficiency compressor, more effective heat exchangers Parasitic losses electricity use due to parts not immediately used in the cooling cycle more efficient fan/motors, standby/off mode energy use, alternative defrost methods Cycle modifications changes to refrigerant circuit that affects cascade system, multi-stage compression, injection the thermodynamic cycle, sometimes necessary with natural refrigerants Change in use operation of equipment electronic controls, behavioural changes Terms 3: The Rebound effect Some energy efficiency measures have shown a far smaller effect on energy consume than was estimated beforehand because the behaviour of users changed (Moezzi et al., 2009). Instead of predicted reduction in use, the appliance is for example run more often or another appliance is bought that was not affordable to run beforehand. The effect has been estimated to be between 0-50 % in space cooling (IRGC, 2013). In developing countries, the rebound effect can be especially high Direct emissions Direct emissions can be eliminated by using the natural refrigerants CO 2, ammonia (NH 3) and HCs such as propane and isobutane. These natural refrigerants have zero or a negligible GWP. Natural refrigerants are already widely used in some of the RAC subsectors, such as domestic refrigeration (HCs) and industrial refrigeration (ammonia). However, not every natural refrigerant is suitable for every RAC subsector. For some applications there are safety restrictions on the use of natural refrigerants (flammability of HC, higher toxicity of ammonia). In other cases, they might not be compatible with current systems and technical changes would have to be made (e.g. CO 2 systems). The following parts of this study will describe which natural refrigerants are applicable for the subsectors and which special safety measures may need to be considered. Because of their environmental impact, u-hfcs will not be considered as an alternative to reduce direct emissions (see chapter 1.2) Reducing cooling demand Whilst the global demand for cooling is increasing rapidly, as discussed in the introduction to this study, not only changes related to RAC technology can make an impact. It is also possible to reduce the cooling demand of an individual building or space through changes in planning, design and behaviour. For example, by preventing a heat load to build up in a space, a lot of costs and energy can be saved as smaller or no refrigeration and air conditioning units have to be purchased and the run times can be reduced. Both direct and indirect emissions are reduced if smaller systems are used. The reduction of energy demand for heating and cooling that can be achieved through renovations and energy efficient building design is estimated to be up to 46% (BigEE, 2012). Less cooling demand in the refrigeration subsectors is more likely to come from changed behaviour or better training of operators of commercial and industrial refrigeration equipment. Another example comes from supermarket display cabinets, where doors significantly reduce the energy use of refrigeration. 40
41 3.1.3 Lifetime CO 2 emission calculations To illustrate possible emission savings, the lifetime CO 2eq emissions for each of the described subsectors have been calculated in a business-as-usual (BAU) case and compared to several emission reduction scenarios. These include both indirect emission and different methods of direct emission reduction. This approach was chosen as direct and indirect emissions have the highest impact on the environment in the RAC sectors. Refrigerant emissions during manufacturing are very small compared to those during operating and disposal. Results can be seen in the respective subsector sections Regulations and standards Regulations and standards concern the use of both synthetic and natural refrigerants and are therefore important to the RAC industry. These can be restrictions on the use of refrigerants due to their environmental or safety impact. For example, the Montreal Protocol and its phase-out plan for the use of HCFCs have been transferred into national laws. The long-term implications are a need to change to other refrigerants. Countries where HCFCs are banned already have import bans in place. Countries that have started the phase-out of HCFCs in 2013 have restrictions on the amount of HCFCs they are allowed to import. This amount is now decreasing until the effective phase-out in The EU has also systematically restricted the use of HFCs. In its current review of the F-Gas Regulation the EU is also considering the effective phase-down of HFCs (Schwarz et al., 2011). Some countries have introduced taxes on HFCs. The taxes are based on CO 2 equivalent, so that refrigerants with higher GWP are taxed higher. In some countries, such as Denmark, there is a refund of taxes if the refrigerant is returned for recycling or destruction. If there are no leaks, the tax becomes essentially a deposit scheme, giving an incentive to reduce leaks (Pachai and Harraghy, 2013). Table 7: Countries with HFC taxes Country Tax Introduction date Denmark 20 /tco 2eq / kg HFC-134a Norway 39 / kg HFC -134a 2002 Australia 25 $ /lb HFC -134a 2012 $24.15/t CO 2eq Sweden 35 / kg HFC -134a 2010 Slovenia 2.88 /t CO 2eq 2009 Spain 20 /tco 2eq 2014 Taxes in Slovenia were considerably higher until summer 2013 (up to 16 /t CO 2eq). However, no taxes in neighbouring countries led to an HFC black market, rendering the tax ineffective 37. Other countries, such as Poland and France are considering or planning the introduction of HFC taxes 38. It is possible that a phase down of HFCs or the use of non-ods alternatives will also be included in the Montreal Protocol. The Rio+20 declaration noted that the phase-out of ODS led to a rapid increase in the use of HFCs, and 37 N. Masson, A. Maratou: shecco publications & upcoming GUIDEs and GUIDE+. Atmosphere, Brussels, 15/10/ A guide on HFC taxes in the EU will be published by shecco in December 2013, including a detailed overview of taxes and other fiscal measures. 41
42 recently, the G-20 in their St. Petersburg declaration as well as other political leaders declarations, such as the CCAC have supported the idea that the Montreal Protocol will be instrumental to phase down HFCs. This would make use of efficient structures established under the Montreal Protocol Mechanism over years while the reporting of HFCs as a potent GHG would be continued under the framework of the UNFCCC. Proposals to amend the Montreal Protocol in such a way have been submitted since 2009 and a corresponding draft decision for the UNFCCC was submitted by the EU. National laws on energy efficiency dictate Minimum Energy Performance Standards (MEPS), which set a minimum energy efficiency products have to conform to. A standard is a reference of achieving a certain level of quality, developed by a standardisation body on an international, regional (e.g. European) or national level or by an industry association (Corberan et al., 2008). Standards are not mandatory, but especially in developing countries without their own standardisation bodies, international standards are often adopted as national standards and sometimes made into laws. Standards are continuously developed to reflect state of the art technologies and adopted by industries. As HCFC and HFC refrigerants are still the dominating refrigerants in most RAC sectors, most standards for RAC systems are based on these conventional refrigerants. There is a need to further develop and promote readily applicable standards for natural refrigerants. Model safety guidelines for natural refrigerants are to be developed so that their specificities can be considered by standards committees and integrated into European and international safety standard processes. The main international and regional standards concerning refrigerants are listed below 39. ISO 5149: 2003 Mechanical refrigerating systems used for cooling and heating Safety requirements IEC : 2007 Specification for safety of household and similar electrical appliances. Particular requirements for refrigerating appliances, ice-cream appliances and ice-makers IEC : 2002 Specification for safety of household and similar electrical appliances. Particular requirements for motor-compressors IEC : 2003 Specification for safety of household and similar electrical appliances. Safety. Particular requirements for electrical heat pumps air-conditioners, and dehumidifiers IEC : 2007 Specification for safety of household and similar electrical appliances. Safety. Particular requirements for commercial refrigerating appliances with an incorporated or remote refrigerant condensing unit or compressor ISO 817: 2005 Refrigerants designation and system classification EN 378: 2008 Refrigeration Systems and Heat Pumps Environmental Requirement These standards often reference other standards, such as the standard dealing with explosive atmospheres, EN EN60079 defines explosive atmospheres, gives guidelines on how to install electrical applications and protect equipment in these environments. Other examples are standards on components (e.g. piping (EN13480), pumps (EN809:1998) and leak testing (EN1779:1999)). EN 378 is not harmonised with ATEX, the two European Directives on equipment (Equipment and protective systems intended for use in potentially explosive atmospheres) and workplace (Minimum requirements for improving the safety and health protection of workers potentially at risk from explosive atmospheres) in explosive atmospheres (BRA, 2010). However, there might be cases where ATEX applies to RAC equipment and conformity with ATEX should be checked especially if larger refrigeration and air conditioning systems with potentially high amounts of 39 More information on standards relating to hydrocarbon refrigerants can be found in the Guidelines for the safe use of hydrocarbon refrigerants (GIZ Proklima, 2010). 42
43 refrigerant are installed. EN378 and ATEX are linked through the standard EN60079, which EN378 refers to and ATEX is harmonised with. Another important standard for RAC equipment is EN to -8 on unfired pressure vessels, which is harmonised with the EU Pressure Equipment Directive 97/23/EC. This standard is also frequently referred to in the standards dealing with refrigerants and refrigeration systems. The transport of refrigerant cylinders and pre-charged equipment is covered in the ADR, the European Agreement concerning the International Carriage of dangerous goods by Road. For smaller numbers of cylinders, such as usually transported by service companies, only basic legislation applies. This includes ventilation of the vehicle, driver training, securing of cylinders and other simple safety measures (BRA, 2010). Terms 4: Understanding energy efficiency terms COP (Coefficient of Performance): This is defined as total cooling or heating capacity (W) per energy consumption (mainly electrical) (W). EER (Energy Efficiency Ratio): Similar to the COP, but the performance is tested at one defined inside and outside temperature at full cooling capacity. Test conditions are derived from an ISO standard and vary slightly between countries but this does not lead to significantly different results (CLASP, 2011). SEER (Seasonal Energy Efficiency Ratio): Several temperatures are included to account for different cooling needs during the course of the cooling period when a unit is not running at full capacity. In the US the (S)EER is often given in the unit British Thermal Units per hour. A division by the conversion factor of makes a comparison with the (S)EER in W/W possible. IPLV (Integrated Part Load Value): One value is given that includes the efficiency while operating at various capacities. The efficiency at 100%, 75%, 50% and 25% capacity is measured and it is assumed that the unit runs at these capacities at 1%, 42%, 45% and 12% respectively of its running time (AHRI standard 550/ ). The percentages can be varied, given the NPLV (non-standard part load value). MEPS (Minimum Energy Performance Standards): MEPS are set by some countries to eliminate less efficient products from the market and promote those with highest efficiencies. This is often accompanied with a labelling scheme providing information to customers. MEPS are usually increased stepwise to slowly transform the market to highly efficient products. TEWI (Total equivalent warming impact): This concept takes into account direct and indirect emissions over the lifetime (excluding indirect emissions during production and disposal) and gives one number in CO 2 equivalents (Fischer et al., 1991). LCCP (Life Cycle Climate Performance): The LCCP expands the TEWI concept to include emissions during manufacturing. 3.2 Production and demand In order to set priorities for the technology transfer of green cooling technologies, it is important to know about the demand and supply for cooling equipment. In the context of technology transfer, the demand is primarily represented by developing countries, where the technology needs and the potential for improvement are generally high. Particularly those countries with growing economies, high population growth and high temperatures, represent a promising future market for green cooling technology. With the introduction of green cooling appliances, these countries can achieve the highest emissions reductions, covering their growing cooling needs on a sustainable basis (GIZ Proklima 2012b). 43
44 The phase-in of green cooling technology can represent a win-win situation for countries providing green cooling technologies and those with a developing market for green cooling technologies. Through the exchange of technologies new sustainable business opportunities can be developed. Companies providing technologies can make their advanced technologies available and gain additional market opportunities. Companies in countries with developing markets gain access to enhanced technologies and increase their long term competitiveness. Particularly because of the environmental benefits, the 16th session of the Conference of the Parties to the UNFCCC in Cancun (2010) decided to establish the Technology Mechanism to facilitate the transfer and implementation of green technology. Technology transfer is not limited to import and export dynamics of technologies, but also includes the transfer of skills, knowledge and methods of manufacturing. This study focuses on the demand and supply to provide a general global market overview in the RAC sectors and the related market opportunities for green cooling technologies. A sound understanding of the dynamics is essential to initiate appropriate actions, such as bringing together supply and demand countries. The demand for RAC equipment is driven by the cooling need. The demand is often referred to as market or domestic sales. Information about the current market and production of RAC equipment can be found in various reports, documents, websites and other statistical databases. However, estimating the future market is more difficult, which is either based on historical growth rates, expert judgment and sophisticated models including relevant demand drivers such as the future GDP growth, population growth and urbanisation. Production and demand figures are taken from published statistical data. For each of the selected subsectors, the chapter on production and demand provides a global overview of the current demand and production situation. The chapters on UAC and chillers also include future projections of demand and emissions. The methodology used to derive production and demand and to estimate future demand and emissions is described in the following sections Methodology to derive production and demand Unitary air conditioning and chillers In order to assess the global unitary air-conditioning market and production side, literature from JARN (Japan Air Conditioning, Heating & Refrigeration News) Journal, BSRIA (Building Services Research and Information Association) reports and press releases, contributions of Multilateral Fund meetings, as well as numerous web resources, such as information derived from news portals, statistical institutions, financial reports, company profiles etc. were used. Mobile air conditioning The world MAC market is steered by the automobile manufacturers or original equipment manufacturers (OEMs), which commission a few direct (Tier 1) system and component suppliers to develop and manufacture tailor-made MAC solutions for each new car model. Through the OEM-supplier dependency it is possible to analyse the MAC market using data on automobile production and sales. The MAC market size can be estimated based on available data of newly manufactured cars and the share of the fleet equipped with MAC systems. The production of cars and MAC systems is fairly synchronous as the mode of delivery between automotive MAC supplier and the OEM is based on just-in-time logistic systems. This study focuses on country-level passenger car production and demand. Regarding passenger car sales and production, data sources such as the OICA (Organisation Internationale des Constructeurs d Automobiles or the International Organisation of Motor Vehicle Manufacturers) were used. Besides published data, additional information from a survey among major MAC suppliers at the Internationale Automobil- 44
45 Ausstellung in Frankfurt am Main, Germany, on 18 September 2013 (IAA, 2013) was integrated for a more detailed understanding of the global market. 45

46 3.2.2 Estimating current and future numbers of appliances in use, unit sales, and emissions To estimate present emissions and their future development, a comprehensive modelling approach was applied. The first step was to model the stock, i.e. the number of appliances in use in the various countries. Unit sales were derived from the stock, while both unit sales and stock figures were used to calculate the emissions using a vintage bottom-up stock model (see Figure 7). Figure 7: Modelling framework to derive future demand, emission scenarios and mitigation potential Step 1: Modelling the stock In a sophisticated modelling approach, which was chosen to estimate the stock for selected appliances, a relationship is built between the current response (stock, diffusion rate, ownership) and current predictor variables. The following predictors were considered: Population GDP temperature index urbanisation electrification rates 46
47 For these variables, plausible future predictions exist. Specifically, generalised linear models and generalised additive models were used to model the stock accordingly. This detailed approach requires very specific information regarding the response and predictors, and is thus limited to RAC systems with a sound database to calibrate the models. It was possible to use this method in the following subsectors: split residential air conditioning systems MAC systems in passenger cars domestic refrigeration (not shown in this study) Ownership data for UAC systems, which are dominated by split residential systems, were collected for selected countries through a comprehensive literature research using primarily, but not only, BSRIA and JARN documents. The number of cars for selected countries was taken from the World Bank database, given as passenger cars per 1000 inhabitants 40. In order to derive the number of MAC systems, the average percentage of cars containing air conditioning systems (Schwarz et al., 2011) was applied to the modelled absolute number of cars. Different factors were used for developed and developing countries. Penetration rates for domestic refrigerators were taken from McNeil & Letschert (2008). These values represent the responses in the sophisticated GLM and GAM modelling approach. The stock of AC chillers could not be modelled using this sophisticated approach due to lack of data. Step 2: Calculating unit sales and market values The modelled stock was used to derive unit sales figures, taking into account that a certain part of the equipment is decommissioned at end-of-life. Multiplying the unit sales figures by current unit market prices results in market value estimates. Step 3. Modelling emissions, BAU and mitigation scenarios The stock and unit sales figures were then used to calculate current and future CO 2 emissions, accounting for direct (refrigerants) and indirect (energy consumption) emissions. For this calculation, a vintage bottom-up stock model was used, considering additional parameters such as initial charge, cooling capacity, emission factors for each of the appliance types. In order to assess the effect of mitigation strategies two different scenarios were calculated: a business-as-usual (BAU) scenario and a mitigation scenario which considers the change of the refrigerant and system design and improvements in the energy efficiency. A comparison between the BAU scenario and the mitigation scenario results in the mitigation potential. Calculations were done separately for developed and developing countries as the type of equipment, energy efficiency and refrigerants differ substantially. A full description of this vintage bottom-up stock model can be found in module 1 of the GIZ technical handbook on NAMAs in the RAC&F sectors (GIZ 2013)
48 48
49 4 Unitary air conditioning (UAC) 4.1 Subsector characterisation Overview The subsector UAC contains ductless split, ducted split and rooftop ACs as well as VRF systems and self-contained units, which are movable ACs and window/through-the-wall units. As split residential ACs make up 80% of the UAC market (in terms of numbers of units) and are therefore by far the most important subsector of UAC, they will be looked at in more detail in the following section. Split residential ACs consist of two modules; one of which contains the compressor, outdoor heat exchanger and expansion device and is installed outside. The other module with the indoor heat exchanger is placed inside in the room. In cooling mode, air is cooled by being blown over the indoor heat exchanger, which is being used as an evaporator. The modules are connected by refrigerant piping. In reversible ACs, the cycle can be reversed and used for heating, so that the air blown over the indoor heat exchanger is warmed, due to it being used as a condenser. The refrigerants in split AC are mainly HCFC-22 in developing countries or R410A (an HFC mixture) for developed countries. For new units, developed countries have fully phased out HCFCs and developing countries are progressing with the phase-out of HCFC for newly produced units. Inverter technology is used in many new units as they can help with improving the energy efficiency during part load operation. Inverters enable the control of the compressor speed according to the cooling demand, thereby reducing the so-called cycling losses that are present with on-off control. The energy efficiency is given as Energy Efficiency Ratio (EER) or Seasonal Energy Efficiency Ratio (SEER). This refers to the whole system compared to cycle COPs/EERs, which would only look at the efficiency of the refrigeration cycle, neglecting losses due to fans etc. The SEER is a time-weighted average of different COPs based on (normally four) different temperature conditions present in the country or region under consideration. Because lower temperatures, where the AC runs at less than full-capacity are included in the SEER, it is higher than the EER. End-users for ductless split ACs are predominantly private consumers and households Energy efficiency trends Figure 8 shows the trend of the average EER of available products over the last 10 years as well as the highest and lowest EER available (shown by the error bars). Only some selected countries are shown for better readability. The strong increase in EER for the best available products, e.g. from 4 in 2005 to above 6 in 2011 in China, shows the high technological potential. This is not reflected in the average value because EERs in the least efficient products are almost stagnant. In the EU, these have even decreased from 2.5 to 2.2 in the presented time period. China is an exception, with a significant EER increase in the least efficient products, which is reflected in a slight increase in overall product efficiency. In general, the best available products in developed countries have higher EER than in developing countries but other differences in the average of available products or in the least efficient products are small. The reason for comparably high EERs in Japan and China is the high penetration rate of inverter technology. For this 10-year trend, EER data has been used because SEER is a fairly new concept where comparative data is still not sufficiently available. 49
50 EER EU China Japan India Korea Figure 8: Trend of Average EER in selected countries over the last 10 years. The error bars show the lowest and highest EER available. Source: IEA (2011), CLASP (2011), SEAD (2013) Table 8 Average EER values from selected other countries Country EER Date Source Australia IEA, 2011 Brazil SEAD, 2013 Canada SEAD, 2013 China CLASP, 2011 EU CLASP, 2011 Ghana IEA, 2007 India SEAD, 2013 Japan CLASP, 2011 Korea IEA, 2011 Malaysia DMG, 2004 Mexico SEAD, 2013 Russia SEAD, 2013 South Africa SEAD, 2013 Thailand DMG, 2004 United Arab Emirates SEAD, 2013 US unitary CLASP, 2011 Vietnam CLASP, International and national regulations The phase-out of HCFCs under the Montreal Protocol and taxation on HFCs (as described in chapter 3) are the main regulations concerning refrigerants in the UAC subsector. Many countries have MEPS guidelines for AC. These can differ for cooling capacity or GWP of refrigerant and are sometimes increased step-wise to cut out the least efficient products. 50
51 Figure 9 shows MEPS for Japan, Korea, China, the EU and India and Table 9 lists other countries with MEPS that have not been included in the graph. Bolivia, Colombia, Ethiopia, Indonesia, Jordan, Lebanon, Malaysia, Nigeria, Pakistan, Senegal, Serbia and Ukraine are all planning to introduce MEPS (WEC, 2013). Figure 9: MEPS for (S)EER values in selected countries. EER values are shown for India (orange). Table 9: MEPS from selected other countries. The reference WEC, 2013 refers to countries that have MEPS according to the World Energy Council, but no specified values could be found. Country MEPS standard Albania WEC, 2013 Argentina WEC, 2013 Australia & New Zealand 3.3 (< 5 kw) 2.9(5-10 kw) 2.7(11-18 kw) Canada WEC, 2013 China see graph Costa Rica WEC, 2013 Egypt WEC, 2013 EU see graph Ghana 2.8 India see graph Iran WEC, 2013 Israel WEC, 2013 Japan see graph Korea see graph Mexico 2.72 Philippines 2.52 (>12 kw) 2.67 (< 12 kw) Singapore WEC, 2013 Sri Lanka WEC,
52 Taiwan 3.5 (<4kW) 3.2 (> 4kW) Thailand 2.53 (8-12 KW), 2.82 (< 8kW) Tunisia WEC, 2013 United Arab Emirates WEC, 2013 USA see graph Vietnam WEC, 2013 Vietnam WEC, 2013 Newer MEPS give SEER requirements as they are thought to reflect real conditions better. Apart from India, the SEER values are given and these have been adjusted so that small differences in the testing method are accounted for (CLASP, 2011). Lower values for the average EER in Figure 8 than MEPS shown in Figure 9 can be explained because SEER is always higher than EER. Highest MEPS are found in Japan. Japan s high MEPS are also reflected in the high average EER in Figure 8. The same is true for Korea, where an early introduction of MEPS has led to consistently high average and high efficient EERs over the years. However, no huge improvement in the average EER can be seen since the introduction of the MEPS in In China, the introduction of MEPS in 2008 led to a significant improvement in the least efficient product category. In India MEPS are in effect since 2010 and the worst efficient products are on the same level as in Japan. In the EU, where MEPS were only introduced in 2013, the least efficient product is the worst shown here. This shows the high effectiveness of MEPS in increasing the energy efficiency of products in the market. MEPS are introduced increasingly more by developing countries in order to secure energy supply and to protect the market from an inflow of cheap inefficient products from other countries (CLASP, 2002). The introduction of MEPS is often coupled with public campaigns to promote energy efficient appliances and their benefits for households. Labels are introduced to make energy consumption comparable. Examples come from Ghana, where AC MEPS were introduced as early as 2005 and from India, where MEPS came into effect in India has published a benchmarking tool where the annual costs of running ACs from different efficiency classes can be compared Scope of improvement Alternative technologies - refrigerants The following, refrigerant-related changes will lead to savings in direct emissions: A switch to natural refrigerant with low GWP (in particular HC-290/HC-1270) will eliminate nearly all direct emissions. Special safety measures include a maximum charge size, special design of certain electrical components and installation instructions. Reducing refrigerant leakage by changing the design, improving maintenance, and reducing the charge size. Introducing effective recovery and recycling reduces end-of-life emissions. Substitute the use of many splits with a distributed water-cooled system or district cooling, thus greatly minimising the use of refrigerants. This option is advisable for new building developments as an alternative to small ACs but depends on the local situation. Challenges: Because NH 3 is toxic, it should not be used in space occupied by human beings and is therefore not used in residential air conditioners. COPs of UAC CO 2 systems are too low, in particular in high ambient environments, without cycle modifications, which are not economical for small appliances
53 4.3.2 Energy efficiency The possible improvements in energy efficiency depend on the unit under consideration, already existing EER, the refrigerant, climatic conditions and cooling capacity. The ideal refrigeration cycle, assuming constant load, infinite sized heat exchangers and 100% efficient compressors has a COP between 32 and 36 (depending on the refrigerant used), which of course can never be reached completely. This nevertheless leaves a high potential for energy efficiency improvements. The following values are guidelines and it can be seen that the range is often very high. The most important approach is optimised components, such as the compressor and the heat exchanger. Because the majority of AC units are not running at full capacity most of the time, a high energy saving potential in split ACs comes from introducing inverter technology, allowing the units to run at less than full capacity. ACs using HCs as refrigerants have higher efficiencies than CFCs, HCFCs or HFCs. The extent of this is under debate and has been found in experiments to range from 2% (Park and Jung, 2007) to 30% (Wang et al., 2004). Smaller, but consistent electricity savings can be reached by reducing losses in the standby or off modes. This is especially the case for smaller units and in climates where the AC is not always running. Figure 10 shows the average SEER in 2011, and the potential economic and technical improvement (data from SEAD, 2013). The economic potential depends mainly on electricity prices. Higher unit costs for more efficient products are balanced by lower electricity bills during the lifetime of a product. In countries with high energy costs, such as Japan, the economic potential is close to the technical potential. The potentials for technical improvement are dependent on country specific climate and seasonal conditions and take into account realistic compressor efficiencies Reducing cooling needs Similar to other energy intensive sectors, it is worth looking at possibilities to reduce demand for cooling from UACs. An option to reduce cooling needs altogether is to integrate cooling in the design of new buildings. Architecture developed over the centuries in hot countries often features cool yards with fountains and shaded rooms with few windows facing the sun. Cooling needs can be reduced by a building s shape and orientation, shading and thermal insulation 42. Green roofs, windows with low solar transmission and light colour materials can all contribute to lower heat loads in hot climates 43. Table 10: Energy efficiency measures in UAC Measure Improvement COP Cycle improvements Inverter/variable speed Compressor Heat exchanger % % % (SEAD, 2013) Parasitic losses EU: Standby Crankcase heating and control 0.8-9% (lower capacity, higher savings) (Armines, 2009) % (SEAD, 2013) Refrigerant HC 4 % (Park et al., 2007) up to 30% (Wang et al., 2004) Change in use Occupancy sensor
 and developing countries (light blue and orange).")
54 Figure 10: Average SEER, Economic and Technical potential in selected countries. Source: SEAD, CO 2 emissions over lifetime Figure 11 shows the lifetime CO 2 emissions for split residential AC in industrialised (dark blue and dark red) and developing countries (light blue and orange). The BAU scenario is compared to several scenarios including indirect and direct emission reductions. Combining energy efficiency improvements with the introduction of a natural refrigerant can lead to CO 2 emission reductions of about 60% compared to the current BAU applications. As leakage rates are usually higher in developing countries and the average energy efficiency is lower, emissions in developing countries are higher. Assuming the same technology as in industrialised countries could be applied through the transfer of environmentally friendly options, the potential of emission reductions lies at around 70%. Reaching the same energy efficiency as industrialised countries would obviously take developing countries longer. These calculations do not take into account the decarbonisation of electricity generation, which could reduce indirect emissions significantly. 54

55 Figure 11: Life time CO 2 emissions in unitary split air conditioning for the business as usual and several emission reduction options in industrialised (IC) and developing countries (DC). An average value has been applied for IC and DC as there are significant differences within those country groups. 4.4 Production and Demand Overview The UAC market size in 2012 was estimated to be approximately 105 million units, which corresponds to a market value of USD 73 billion. The UAC subsector is divided into the sub-categories ductless splits, ducted splits, rooftop ACs, VRF systems and self-contained units, which are movable ACs, window/through-the-wall units and packaged ACs. Figure 12: Global demand for residential and commercial UAC systems, divided by appliance system types (2012). (A) shows demand by value in USD and (B) shows the volume in units The highest proportion of air conditioners (based on the number of units) are UACs with lower cooling capacities (less than 17.5 kw), which are the focus of this chapter. Because of their low market-share, VRFs, rooftop and packaged air conditioners are excluded from the analysis. VRFs will be addressed in the section about AC chillers. VRFs are often installed as an alternative to chillers. For 2012 this then translates into a market size (without VRF units) of about 100 million units valued at USD 60 billion, regarding ductless, ducted, window-type and movable UACs. Notice that these types of air conditioners will be generalised as UACs in the following and that missing types pointed out above are excluded from the discussion.. Ductless split-systems dominate the market, especially in Asia and Southeast (SE) Asia 44, followed by self-contained devices, such as window-type air conditioners which have significance in Saudi Arabia and the United States. The movable AC market is very small and is not of importance in regions where higher cooling capacity is needed. Ducted split systems are mainly found in the US, where they have a market share of more than 30%. Ductless splits are still missing wider consumer acceptance in the US but they are gaining market share. This stands in sharp contrast to other major markets such as most of the Asian markets, including Japan and China where ductless splits 44 SE Asia is listed separately because the market has different characteristics to other Asian countries. Here, SE Asian countries are Indonesia, Malaysia, the Philippines, Singapore, Thailand and Vietnam. 55

56 are the norm. China is the largest player in the UAC market, dominating both demand and supply (Figure 13 and Figure 14). The following section contains data on the global demand for UAC both the current demand and a projection in the future. It will then look at the production side (shown as production capacity) of the UAC market and show the most important manufacturing countries, an overview of global and local manufacturers and market trends for key countries in the UAC market. Production capacity is higher than actual production depending on the degree of capacity utilisation, but actual data on this are extremely difficult to come by. The data shown here on production capacity are therefore to be taken as an upper limit for supply Demand The demand for UAC units is increasing, mainly because of the growing demand in developing and emerging markets with many first time buyers. Not only is the disposable income and standard of living rising in these countries. Factors such as infrastructure improvement, electrification as well as growing distribution networks all contribute to the growing demand for air conditioning as more customers can be reached (HSBC, 2012, 2013). Additional demand appears to be very likely in a warming world due to anthropogenic climate change 45. Figure 13: Global demand in 2012 for UAC systems including split ACs, window/through-the-wall units and movable air conditioners Roughly two-thirds of the global UAC market is located in Asia and SE Asia and the highest growth rates in 2012 were also found in this region. Nonetheless, air conditioner penetration in key markets are still low (e.g., India 4%, Thailand 14%, Indonesia 7%, Vietnam 6%, Philippines 11%). SE Asia experienced a market growth of almost 20% compared to the previous year 46. Here too, ductless mini-split systems make up the majority of sold units. An exception are the Philippines, where self-contained window units still have a share of 70% 47, which is significantly higher than in India and Taiwan where they contribute 20% and 35% respectively. In Japan and South Korea, mini
57 split systems dominate. China showed a growth in sales of 8% in 2012; with a share of nearly 40%, China is the world s largest UAC market 48. The US UAC market is the largest in North America and is structured differently than the world average. The demand for ductless mini-split systems is very small (around 3%) in comparison to window units and ducted minisplit systems, which both have a share exceeding 40%. However ductless splits are increasingly accepted as energy and cost efficiency become more important to consumers 49. Brazil is the largest air conditioning market in South America. As the penetration of air conditioners is still low and there is a large potential consumer base (similar to India) 50, Brazil remains a promising market to look at 51. Saudi Arabia is the largest air conditioning market in the Middle East where air conditioning is very important due to the climate. Saudi Arabia has the largest share of window units in the world, contributing around 65% to the total 1.8 million air-conditioning units sold in However, the sales of split units have been picking up here. Egypt is another important market in the Middle East with its strategic positioning toward African markets. Ductless split ACs make up 85% of domestic sales, the remaining 15% are window units. The largest AC market in Africa, with about half a million units, is Nigeria. The distribution between ductless split and window units is comparable to Egypt. In Europe, Russia is the biggest market followed by Turkey, Italy and Spain. In all European markets, ductless split units are preferred (with a share of 85 to 90%). Movable AC units account for about 7%. The combined demand of China, Japan, the US, the European countries, Brazil and India accounted for more than 70% of total sales in Production A comparison of Figure 13 and Figure 14 shows the distinctive contrast between annual demand and surplus production capacity. The disparity between current demand and the production capacity somewhat reflects market expectations for a significantly increasing demand in the future. It is also expected that production capacity provides a good picture about manufacturing allocation and possible scale of activity. Manufacturers typically keep excess production capacities to meet the growing sales demand. The excess production capacities indicate the future sales expectations of the companies (Sivak, 2013)
58 Figure 14: Estimate of global distribution of production capacity for UAC systems in 2012 The most significant UAC-producing countries are all in Asia and SE Asia. Nearly 90% of the world s UAC production capacity is based there. China alone would be capable to manufacture 65% of the world s market or largely over 200,000 units if production capacities were fully utilised (Figure 14). On average, the Chinese air conditioner output in 2012 exceeded 200,000 units produced per day (covering 80% of the global market in 2012) and approximately half of the production went into the domestic market. Another 7% of the world s demand is produced in Thailand, the second largest UAC producer. The vast majority (90%) of Thailand s UACs are currently exported. Figure 15 illustrates market overview plotting demand and country-level production capacities. 58
59 Figure 15: World UAC market and production capacities divided by region The situation in the main producing countries is as follows: China: The Chinese market is dominated by Chinese manufacturers. Gree, Midea, Qingdao Haier share two-thirds of domestic sales. India: Voltas is the manufacturer with the highest market share. Together with South-Korean LG and Samsung as well as Japanese Panasonic they cover almost two-thirds of the market. Godrej and Blue Star are also well-known Indian producers with smaller market shares. Interesting is the near absence of the Chinese manufacturers in the Indian market 52. This might change in the future because of rising labour wages in China. Japan: Japan has a developed market, which is dominated by national manufacturers. South Korea: Similar to Japan, Korean manufacturers dominate the home market. Indonesia: South Korean and Japanese manufacturers have a strong position in the largest UAC market in SE Asia. Chinese competitors also have local production bases, from which they are also exporting to other ASEAN markets. Domestic producers have a market share of about 5%. Threequarters of the Indonesian sales are small-capacity mini-splits and 80% of air conditioners are imported. Thailand: Largely an export hub for Japanese and South-Korean manufacturers, a small number of domestic manufacturers produce for the national market. Vietnam: Vietnam is a market with significant growth. Because of rising production costs in China and Thailand, Japanese and Korean manufacturers have built manufacturing bases in Vietnam. The trend to shift production capacities to Vietnam may continue as the air conditioning market in Thailand becomes more mature. Malaysia: Malaysia imports some UACs from China and Thailand, but most of its equipment is produced in the country or imported components are assembled locally. United States: Ducted air conditioning dominates the US market, distinguishing it from the other ductless-split dominated world markets. The US still is a challenging market for Asian exporters and the popular ducted air conditioners are still manufactured domestically. Brazil: Almost all known global Japanese, South Korean, US, and Chinese manufacturers have set up factories in Brazil. Turkey: is Europe s largest UAC-producing country. Saudi Arabia: Market with local production mainly consisting of foreign manufacturers aligned in joint ventures with local companies. Egypt: Egypt s unique location as part of the Middle East, Northern Africa and the Mediterranean region gives it a central importance for manufacturers. Whereas a lot of US-American, Korean and Chinese manufacturers have production facilities there, Sharp is the only Japanese company manufacturing in Egypt. Nigeria: has become especially interesting for Chinese manufacturers. In the recent past, they have set up production facilities (Haier, Shinco) and assembly lines (Chigo). There is a range of technologies specifically designed to meet customer needs in Nigeria, such as automatic voltage switchers for compensating electricity-fluctuations, compressors able to deal with tropical conditions as well as air purifying and mosquito-deterring
60 Figure 16 shows the origin countries of UAC manufacturing companies. Some of these, such as Daikin, Carrier, LG and Haier are operating globally. Others, such as Voltas and Godrej in India are solely domestic producers. Many multinational companies produce in partnerships with local manufacturers or have joint ventures in order to improve their penetration in different markets. Carrier is a good example of such a company. Carrier has global cooperation with Chinese Midea (in China and Egypt) and has established local joint ventures e.g. in Saudi Arabia (SAMCO Carrier). Daikin has also made essential acquisitions in the past to diversify in major world markets. 60

61 Figure 16: Local manufacturers in key UAC-producing countries. Note: Some may act on multi-national level or belong to other multi-nationals as part of their global operations 61
62 Figure 17 shows the countries of origin and the countries in which UACs are being produced for manufacturers acting on the multi-national level. Asian manufacturers clearly dominate the world stage and Asia and SE Asia are the major manufacturing regions. Chinese manufacturers mainly produce within their own country whereas Japanese and South Korean companies have most of their production outsourced to other Asian countries. Chinese and Korean manufacturers have started producing in Africa. US manufacturers are only slowly penetrating Asian/SE Asian UAC markets but are very active in all other regions of the world. European companies mainly produce for the European markets. 62
 and estimated market value for the top-6 countries (B) As expected, the")
63 Figure 17: Manufacturing activity of multi-national manufacturers 53. The figure only shows operational activity and allocated production capacities. The precise type of operation (e.g. fully developed production facilities or simple assembly lines) cannot be specified Future demand and stock Figure 18: Modelled future stock of residential split air conditioners for 2010, 2020, 2030 (A) and estimated market value for the top-6 countries (B) As expected, the total stock of residential split air conditioners is projected to increase, whereby the increase between 2020 and 2030 is much stronger that the increase that is observed from 2010 to 2020 (Figure 18A). This trend is reflected by the market, which shows a similar pattern of increase (Figure 18B). The model results further 53 Some manufacturers especially in the US might be significantly underrepresented as limited information is publically available on their production capacities and sales. 63
64 show that the stock from the top-6 countries, which make up 80% of the global 54 stock, will grow from currently 600 to nearly 1.7 billion units. The corresponding market is projected to increase from around 36 billion Euros in 2010 to more than 130 billion Euros by 2030 (Figure 18B). Various different growth trends are observed depending on the country and region (Figure 18A). While the Asian countries (red colours) show a strong increase in both stock and market values, except for Japan, there is a moderate increase and stagnation seen in the US and Europe 55. Generally this difference is explained by different GDP growth, which is expected to increase exponentially for some Asian countries. A stagnation of stock and market is observed for the US because the AC market there is already highly saturated. Stock and market in Europe show a slight increase only. The projected future increase in Europe may be underestimated, because higher temperature levels due to climate change are expected to boost the air conditioning market in Europe. However, this parameter was not included in the modelling approach. Again, China is the most dominant country with regard to stock and market value. The country represents half of the stock from the top-6 countries by India is the second most important country, following behind the Chinese development by several years Global GHG emissions and reduction potential Total emissions mirror the stock in the country, as the emissions caused by operating an AC unit largely contribute to the overall emissions. Therefore, high stock numbers will cause high emissions. Consequently, the emission trend (Figure 19A) follows the stock trend (Figure 18A), with China and India showing high growth rates, in contrast to the US and Europe. China s emissions from split residential air conditioners are already double the emissions from the US and Europe. India s emissions are currently below the emissions from the US and Europe, but will supersede US emissions between 2025 and 2030 (Figure 19A). Again, China plays a special role as the expected future emissions are in the magnitude of more than 1600 Mt CO 2eq by The plotted countries in Figure 19A make up 80% of the global emissions from split residential air conditioners. The high mitigation potential within this subsector can be seen in Figure 19B 56. The underlying model assumptions account for the replacement of the refrigerant and an improved appliance energy efficiency 57. Emissions can be reduced rapidly as new green technology is phased in. Highest emission reductions are found in countries with significant stocks and total emissions. The emission reduction potential in all counties ranges between 60 and 70% when state-of-the-art technology is introduced. In China, more than 1000 Mt CO 2eq could be reduced annually by Global refers to the most important 99 countries for which the comprehensive stock modelling was performed. A list of these countries can be found in the annex 55 Europe figures consist of data for Germany, United Kingdom, France and Italy. These are currently the most important countries in Europe. 56 The reduction potential is visible from 2010 onwards as penetration rates of green technology have been interpolated between 2010 and A full description of the mitigation scenario can be found in module 5 of the technical handbook NAMAs in the refrigeration, air conditioning and foam sectors (Proklima, 2013). 64
 shows the BAU scenario, while the bottom graph (B) shows the mitigation potential. 4.")
65 Figure 19: Projected total (direct and indirect) emissions from residential split air conditioners for the top-6 countries as calculated by a vintage bottom-up stock model (A). Key determining factors are stock and sales figures. The upper graph (A) shows the BAU scenario, while the bottom graph (B) shows the mitigation potential Market situation and technology options in key-focus markets (China, India and Brazil) New technology trends in the market The main new technology trend in the UAC market is the inverter technology. Inverter technologies are regularly used in Japanese and Oceania ductless split-systems and have quickly risen to a significant share in China. The penetration rate of inverter technologies to other markets such as Latin and Northern America remains slow (Figure 20) although more than 30% of 2012 UAC sales were inverter devices. Especially the US market has been largely inert to adopting inverter UACs for a long time as ductless splits only very slowly become interesting to consumers. However, with improved energy efficiency regulations coming into place, inverter UACs are expected to find more consumer attraction in the US market. Rising interest in inverters shows that the market may eventually shift rapidly towards the integration of these features. 65
66 Figure 20: Penetration of inverter air-conditioning technology by region China Market Situation. In 2012, the China s market for residential air conditioning was more than 10 times larger by sales than the Indian and Brazilian markets. Penetration of residential air-conditioning closes in on 95% in the largest cities 59, and the buying trend now transits from first-time buyers to replacing old equipment. First-time buyer demand will gradually shift to rural markets as incomes rise. Only 23% of households in rural areas own air-conditioning devices so far. Rural areas therefore provide large potential for air conditioner sales. Inverter Technology. Over the past few years, inverter air conditioners, using R410A as refrigerant, have become more popular and environmental awareness has increased in China. From 2009 to 2012 the market share of inverter devices has taken a leap from 10% to over 50%. However, the use of non-inverter air conditioners will likely not be abandoned too soon, as they are well-positioned in the lower price range, which meets the needs of the consumers in rural market where disposable incomes are lower. Additionally, because China is the major global production hub for air conditioners, it will continue to manufacture non-inverter devices in order to satisfy the demand of importing countries such as the US where demand for inverter air-conditioning is very low India Market Situation. Sales of UAC in the Indian market accounted for more than 3.4 million units in The share of split-systems is continuously increasing, overtaking that of self-contained window-type units, and is currently estimated to be around 80%. Because the Indian market is still in development and consumers are very price sensitive (i.e. small changes will have a high impact on demand), there is high competition between split and window ACs and prices tend to be significantly lower than in other markets. The massive devaluation of the Indian Rupee since the second half of 2012 led to manufacturers having to raise prices as two-thirds of the air-conditioning components are imported. Because of this, localised production could become more competitive in India. For now, room air conditioners have a country-wide penetration of 3 to 4%, of which 40% are installed in urban areas. Hence there is still large potential for growth (Sharma et al., 2012) and annual growth rates of 13.5% until 2017 are expected 60. Since room air conditioner appliances are not common home appliances at the moment, India also has the opportunity to leapfrog the usage of high-gwp HFC refrigerants and transition directly to naturalbased solutions. Currently almost all locally manufactured and sold room air conditioners are equipped with HCFC- 22, although importers have turned to R410A
67 Inverter Technology. The penetration rate of inverter UACs in India is still only at 6% people still have little knowledge about inverters Brazil Market Situation. Domestic sales of residential air conditioners in 2012 were in the range of 3.2 million units and therefore comparable to India in market size. Growth had similarly been expected to be higher. Even though Brazil has a large population of 200 million people and a growing middle class, the air-conditioner penetration is still low. The largest UAC market in the southern hemisphere therefore still has potential for significant growth in AC units. The trend of adopting VRF- and inverter-friendly R410A instead of HCFC-22 is increasing. Currently, split systems are gaining ground over self-contained window-type air conditioners even though prices are increasing due to rising industrial taxes and currency devaluation of the Real. Similar to the situation in India, localisation of production remains a key issue in a country with high import tariffs. Inverter Technology. Inverter devices contribute about 7% of all units as Japanese companies have captured notable market share. However, the market uptake remains challenging. 4.5 Conclusion The UAC subsector has the highest predicted growth and emissions of all the RAC sectors. China plays an important role in the UAC subsector as it has the highest demand for AC units as well as being the biggest producer. In recent years, China has set higher MEPS and subsidised energy efficient ACs, leading to distinctly higher energy efficiency in the country s AC stock. China alone is able to provide way more than half of the world s UAC demand and a few key Chinese producers could become highly influential in changing the UAC market. All leading Chinese suppliers are for example already able to produce highly energy efficient equipment with HC-290 as refrigerant. The low amount of refrigerant in most UAC units makes hydrocarbons a safe choice for home appliances. The predicted rising demand is also related to many developing countries being far from reaching their full saturation with UAC. Apart from few countries, such as Thailand, there is little production in these countries, which therefore have to rely on imports. More and more developing countries have recently introduced MEPS or are in the process of introducing MEPS and labels in order to protect themselves against being the dumping ground for energyintensive units. More stringent MEPS that are at least as demanding as the Chinese standards will drive the development towards more energy efficient appliances in the long term. Higher MEPS could be a chance for UAC manufacturers in Thailand to gain a competitive advantage in the market, as they are already producing for the Japanese market with its very high energy-efficiency requirements. UAC demand in India will grow strongly in the future. Energy demand from UAC units will put an additional burden on the already tight electricity supply situations. India will greatly benefit in the future by further heightening MEPS targets. As India will be the next biggest emerging market outside of China, Indian companies will play a much more important role in the future. Energy-efficient UACs with inverter technology and natural refrigerants are not as established yet in Indian companies as they are in Chinese companies but their introduction could lead to very high emission savings in the future. Mandatory MEPS for the majority of UAC consuming countries could lead to a shift to higher energy efficiency globally. There are now good practice MEPS examples from developing countries such as Ghana and India. Raising public awareness about MEPS is important for the successful implication and this could be supported by NGOs. The introduction of MEPS will significantly increase if there is broad stakeholder support (CLASP, 2002). NGOs can also 67
68 support countries with the implementation of MEPS. China has shown that subsidies for energy efficient models can be very successful to catalyse the introduction of highly energy efficient appliances until the production has reached sufficiently high economies of scale. Often, for the economy the costs of such catalysing introduction programmes will be quickly paid back as higher investments in electricity generation, especially for additional costly peak power plants can be avoided. The MLF can accelerate the introduction of green cooling technologies by only financing production conversions from HCFC-22 to models where energy efficiency and natural refrigerants are considered. 68
69 5 Mobile air conditioning (MAC) 5.1 Subsector characterisation Overview Vehicles can heat up significantly in hot weather or under direct influence from sunlight. MAC systems are installed in cars to keep drivers comfortable and safe. This is the reason why the capacity of MACs for passenger cars lies in the range of around 5 kw (IPPC/TEAP, 2005). For conventional cars, the compressor in MACs is connected to the car engine via a belt and there is direct transfer of mechanical power. Fans and controls are powered by electricity. It is estimated that 9% of greenhouse gas emissions from cars are due to direct and indirect emissions from MAC use (US EPA, 2010). In 2006, 20 % of the global refrigerant emissions were from MAC systems in passenger cars (UNEP RTOC, 2011). These direct emissions result from leakage during manufacturing, operation, servicing, repair and at end-of-life. Indirect emissions are due to increased fuel consumption due to MAC operation. After the phase-out of CFCs and HCFCs under the Montreal Protocol, the refrigerant used in MAC is predominantly HFC-134a (see also Figure 4 in chapter 2). However, due to its high GWP of 1,430, the use of HFC-134a increasingly faces restrictions around the world. Few car manufacturers have started to use u-hfc-1234yf in Europe and only in new car models since it became commercially available in late Hydrocarbons are sometimes used in the aftermarket in some countries to avoid the more expensive HFC-134a. The charge size is usually smaller than 1 kg with an average of 600 g (Schwarz et al., 2011). End-users of MAC systems are almost exclusively car original equipment manufacturers (OEMs) Energy efficiency trends There are few numbers on the energy efficiency of MACs for several reasons. MACs are custom-made for car manufacturers and installed during the production of cars. Car manufacturers do not usually publish the COP of MACs and the only numbers come from estimating additional fuel consumption during driving. Scientific publications often consider theoretical aspects or try to model different conditions or components. Measured COPs or actual fuel consumption have been shown to be different to theoretical expectations in the past (Hrnjak, 2010). The additional consumption of fuel of a MAC depends on many different factors: Besides the ambient temperatures and humidity, the rotation speed of the motor, the car model and refrigerant type all play a role. Additional fuel consumption in Europe and the US was measured to be between 3 and 18% depending on ambient temperatures, driving speed, humidity etc. with a yearly average of 5.4% (Weilenmann et al., 2010), but around 20% in China and India, mainly because of the climate (NRDC et al., 2013). Because the additional fuel consumption stays similar for all cars, its percentage is higher in cars with higher efficiency (Johnson, 2002). A little less than 10 years ago, the typical COP of a MAC at 35 C was in the range of 0.9 to 1.6 (IPCC/TEAP, 2005). Over the last 10 years, it has become considerably higher. The IMAC 30/50 project (Improved Mobile Air Conditioning) project from 2004 to 2007 had pledged to reduce energy need by 30% and reached their goal easily 69
70 using commercially available technology 61. Depending on motor speed, ambient temperature, refrigerant and technical set-up, COPs in scientific papers are given in the range of 1.6 up to 4.0 (Brown et al., 2002; Kim et al., 2009; Lee and Jung, 2012; Hrnjak, 2010). This does not mean that there are systems commercially available that have COPs in this range. A comparison concerning COPs of HFC-134a and CO 2 systems is inconclusive. Based on simulations, some authors see higher efficiencies for HFC-134a (Brown et al., 2002), but experimental data show equal or higher COPs for CO 2 at ambient temperatures below 35 C (Kim, 2004; Tamura et al., 2005; Hrnjak, 2010; TEAP, 2013). The performance of u-hfc-1234yf is worse than that of HFC-134a (Lee et al., 2011; Zilio et al., 2011). Competition between different refrigerants has led to an increase in COP in all refrigerant systems over time that is higher than the difference in COP between the refrigerant systems (Hrnjak, 2010). 5.2 International and national regulations The EU MAC directive has been introduced to drastically reduce direct emissions of refrigerants. It restricts refrigerant use to those with a GWP of less than 150, thereby banning HFC-134a, which was globally used until now. This rule applies for new type-approvals from 2011 and for all new cars from Nearly all Tier 1 multi-national MAC suppliers already have developed systems with low-gwp refrigerants. The dominant options here are u-hfcs and CO 2. European manufactures will be forced to implement low-gwp refrigerant systems in the market by As a result, car manufacturers initially agreed to use the specifically developed u-hfc-1234yf. After tests by Daimler showed u-hfc-1234yf to be ignited in crash testing, other German manufacturers, including the VW group and BMW joined Daimler s announcement to opt for CO 2. Developments with CO 2 MAC systems were already going on with nearly all Tier 1 MAC suppliers since the early to mid-2000s, but were stopped after the u-hfc-1234yf agreement. After the German car manufacturers opted for CO 2 systems, developments were newly started. In the US, only refrigerants approved by the EPA s SNAP Program can be used. In the low-gwp category for mobile air conditioning HFC-152a, CO 2, and u-hfc-1234yf, are SNAP-approved. California s proposed Low Emissions Vehicle regulation (LEV III) requires cars to use refrigerants with a GWP of 150 or lower. Also, the US CAFE (Corporate Average Fuel Economy) standards set minimum efficiency standards for cars, mainly based on fuel usage during normal driving conditions. Recently, these standards include a credit system that gives points if a car has an efficient MAC system or uses a low-gwp refrigerant (US EPA, 2010). Because of the homogeneous global MAC market, there is a tendency that car manufacturers opt for MAC units fulfilling the most stringent environmental and safety restrictions in the world, which come from the EU and the US (NRDC et al., 2013). 5.3 Scope of Improvement Alternative Technologies - refrigerants The following, refrigerant-related changes will lead to savings in direct emissions: Switch to alternative refrigerant Several MAC suppliers have reportedly reached implementation readiness for CO 2 systems (own interviews IAA, TEAP 2013). Key component developments were ongoing with regard to internal heat exchangers, external control measures, micro-channel gas coolers and evaporators. Because CO 2 refrigerant requires higher pressures, component walls have to be reinforced. Higher pressures make the system smaller, but maybe slightly heavier. Initially, upfront costs are estimated to be higher in
71 comparison to conventional systems (Schwarz et al., 2011) and the system needs to be significantly altered compared to HFC-134a. However, because of similar or less material requirements and the extremely low cost of the CO 2 refrigerant, this is likely to decrease rapidly. CO 2 is non-flammable, nontoxic, readily available, cheap and efficient. It is nontoxic, but as higher partial pressure (from 1%) in the driver s cabin could lead to drowsiness, special care to prevent leaks into the cabin has to be taken. The different design means that it is not technically possible to illegally use HFC-134a as a drop-in in CO 2 systems in the aftermarket. Both Daimler and VW have announced publicly to install CO 2 MAC in their new car models as soon as the systems are available. U-HFC-1234yf could be used as a drop-in in existing HFC-134a systems or would only require small system changes. Without adjustments, the cooling capacity and performance are lower than for HFC- 134a (Lee and Jung, 2012; Zilio et al., 2011). U-HFC-1234yf is flammable and produces the highly corrosive and therefore dangerous HF when it burns. Particularly the flammable nature of u-hfc- 1234yf has triggered the German manufacturers, Daimler, BMW and VW/Audi to drop the use of u- HFC-1234yf due to the inherent safety risk of this refrigerant. For the Chinese and Indian markets, u- HFC-1234yf is considered very expensive and there is little access to it, making a global rapid change from HFC-134a unlikely (NRDC et al. (2013). Challenges: The servicing sector would need additional technician training and equipment at service stations. This is true for both CO 2 as well as u-hfc-1234yf systems. Leak reduction Leaks from MAC are very high, reaching 10-15% annually in developed countries (IPPC/TEAP, 2005). In developing countries this is closer to 20% on average, reaching up to 40% depending on servicing and road conditions (UNEP, 2013). This is due to the design where refrigerant is led through hoses that are prone to leakage, the compressor is open because of its connection to the motor and vibrations during driving will continuously loosen connections (Hrnjak, 2010). Even though average leakage has been significantly reduced over the last years from 40% in the 1990s (Hrnjak, 2010), the accumulated effect of millions of cars is still considerable. HFC-134a is widely available on the internet and this leads to car owners doing their own servicing which has a high potential for release of refrigerant. Challenges: Natural refrigerant ammonia has not been considered an option for MAC - because of its toxic and corrosive nature it poses a harm to people in the driver s cabin and components in the motor compartment. Even though HCs have shown very good efficiency especially in high ambient temperature environments and are used in the aftermarket, they are currently not the favoured option because of their flammability Energy efficiency CO 2 as refrigerant in MAC is more efficient for ambient temperatures below 35 C whilst driving and below 25 C when the car is idle (Hrnjak, 2010). Because the CO 2 system requires higher refrigerant pressures, it is smaller. This is important in cars with restricted size. Additionally, a CO 2 system allows for heating in a reverse cycle. This becomes important because the generated motor heat in some efficient cars is too low for heating in cold winter months. In spite of known leakage rates for MAC systems, these refrigerant emissions so far have not been accounted for in the CO 2-emissions calculations for cars. In 2009, the US EPA published the Green MAC LCCP, a tool to calculate the so-called life cycle climate performance, taking into account both direct and indirect emissions
72 Table 11: Energy efficiency measures in MAC Measure Improvement COP Cycle improvements Ejector 15% (Lee, 2011) High side pressure controller Parasitic losses Cycle modifications CO 2 refrigerant, two-stage compressor 20% (Janotkova and Pavelek, 2006) Change in use Energy management, heat reflecting windows, parking in the shade 2-4% of total fuel consumption (Glass for Europe, 2011) Reducing cooling needs The energy needed for cooling cars can be reduced considerably in cars by reducing the heat load. The initial cool down requires the most energy. The temperature of the car cabin can be as high as 60 C after standing in the sun. A reduction of this heat load is possible by behavioural changes such as parking in the shadow or buying a white instead of a dark coloured car 63. Another option is to install special heat rejecting windows. This could reduce the heat load by up to 10 C CO 2 emissions over life time BAU emissions in developing countries are again higher than in industrialised countries. This is due to lower COPs in developing countries in often older cars. Leakage rates can also be affected by temperature and are higher in hot countries (LCCP-Model). As many developing countries have hotter climates, this is again included in the calculations. Additionally, there is no collection system for used refrigerants in many developing countries, so that end-of-life emissions are higher (Clodic et al., 2010). It was assumed that the same energy efficiency standards can be reached in developing countries over time. 63 R.Wecker, a2-solar : Potentials of Solar Systems in Vehicles for Air Conditioning. "PRO KLIMA - Zukunft der Autoklimaanlage" 4/12/ V.Fourcade, Glass for Europe : Solar control glazing to curb heat load and air-conditioning fuel consumption. "PRO KLIMA - Zukunft der Autoklimaanlage" 4/12/
 5.4")
73 Figure 21: Lifetime CO 2 emissions in mobile air conditioning systems for the business as usual and several emission reduction options in industrialised (IC) and developing countries (DC). An average value has been applied for IC and DC as there are significant differences within those country groups.) 5.4 Production and demand Overview The original equipment manufacturers (OEMs) or automobile manufacturers largely direct the world MAC market. Automobile manufacturers deliver the specifications for system (tier-1) suppliers to develop and manufacture tailormade MAC systems for their car-models. The whole market structure is globalised as multi-national car OEMs have established production facilities and sales networks all over the world in order to be well-positioned in different markets. The supply chain has aligned along these globalised structures and system suppliers manage their own supply network (Meißner and Jürgens, 2007). Major global MAC system suppliers for passenger cars are DENSO Corp. (Japan), Valeo SA (France), Halla (Korea), Visteon (USA) Climate Controls, DELPHI Automotive (USA), Mahle-Behr GmbH & Co. KG (Germany), Calsonic Kansei (Japan), and Keihin Corp. (Japan). Their market shares are illustrated in Figure 22. Figure 22: Global market share of major MAC suppliers by shipment (2009) 65 Most OEMs have a varied MAC-supplier portfolio although many rely on strong ties to specific suppliers. Good examples are the association of DELPHI with General Motors, which emerged in 1999, or DENSO, being traditionally associated with Toyota. Figure 7 illustrates the preferential relationships between dominant system suppliers and specific OEMs

74 Figure 23: MAC suppliers and affiliations to prominent OEMs. PSA stands for PSA Peugeot-Citroën. The global organisation of the automotive suppliers is highly specialised and competitive, which is in the interest of automobile OEMs. MAC system suppliers produce complete air conditioning devices with control systems for cars. Production of MAC systems is a mass market, which has now also reached lower-class cars and this leads to strong price pressure among MAC suppliers. Upper and premium class automobiles beyond the mass market represent the segment where product diversification and innovation is most likely to take place 66. This seems plausible under the assumption that OEMs achieve the best trade-off charging people higher prices for high-value equipment rather than providing new technologies to customers who want to pay the same price (Dvir and Strasser 2013) Demand Figure 24: Demand (domestic sales) estimates and global distribution of MAC-equipped automobiles in Together, China, EU-27, USA, Japan, Brazil, India, and Russia make up 80% of total annual MAC-equipped car MAC sales (Figure 24). Integration of MAC systems in cars is very common in developed countries and increasing in developing countries. Mass production of MAC systems already began in the early 1960s in the US followed by Japan and other Asian countries in the 1970s. Massive rise of car MAC in Western Europe set in from the early 1990s.The approximate rate of MAC-systems in newly-manufactured cars is close to 99% in North America and Japan, about 90% in Western Europe (ca. 80% in overall Europe) and Asia. MAC penetration in China has reached a rate of more than 94% in The number of MAC containing cars is on average approaching 60% in the rest of the world (Rave and Goetzke, 2011; Clodic et al., 2005; GREEN-MAC-LCCP, 2007). 66 IAA13 personal communications
. Production is still predominantly situated in industrialised countries such as Germany, Japan, South Korea and the US.")
75 5.4.3 Production Figure 25: Global distribution estimate of MAC-equipped automobile production in China, the EU-27 countries, Japan, South Korea, the United States and India, make up 80% of the world s passenger car production equipped with MAC systems (Figure 25). Production is still predominantly situated in industrialised countries such as Germany, Japan, South Korea and the US. However, the relative share of developing countries is rapidly increasing, especially with the emergence of China as a leading car manufacturing country by volume (see Figure 26 for details). Figure 26 and Figure 27 show the countries of origin of the main car companies and brands and the key car and MAC producing countries (the companies shown here comprise over 90% of the market). Most companies are present in all regions and in many different countries. The network of the supply chain works best for OEMs when it is short and efficient. Thus one can assume that MAC suppliers work in close cooperation with car OEMs in order to guarantee just-in-time delivery. DENSO, automotive supplier for Toyota in the United States, for instance, has production facilities in the United States as well as Mexico and Canada to manage efficient delivery. 69,70 With the growth of the Latin American economies, German manufacturers moved to produce in Latin America, with their main production sites in Argentina and Brazil. German car manufacturing VW Group, as well as Japanese and US car makers have plants in Mexico. Behr is one of the MAC producers that provides air conditioning for VW, Mercedes Benz and Fiat in Brazil. DENSO also has production facilities for manufacturing car air conditioners there 71. Even though the scale of production in China is very high, it has yet to become a major car exporting country. The automotive industry is split in many small companies, but is intended to be merged to fewer players in order to enable faster access to overseas markets (APCO worldwide, 2010). Foreign companies are only allowed to produce cars in China through joint ventures. Examples for car manufacturers are Beijing Daimler, Nanjing Fiat or Beijing
.")
76 Hyundai. MAC producing joint ventures are Shanghai DELPHI Auto Air Conditioning System, Guangzhou DENSO and Dongfeng-Behr Therm. Syst. German suppliers, such as Behr tend to ship parts to German manufacturers in China for quality assurance (APCO worldwide, 2010). Japanese and Korean OEMs rely on tier-1 suppliers from their respective countries, either through import or local production (APCO worldwide, 2010). The African and Middle Eastern markets are dominated by companies from Europe and Asia. US-American companies play no important role. Japanese and Korean brands have the largest share of production in Asia and SE Asia. The Japanese market remains a challenge for western suppliers because the ties among the Japanese supply chain are extremely hard to breach IAA13, personal communications 76
77 Figure 26: Manufacturers of passenger cars with MAC systems in key car producing-countries. Some of them act on multi-national level (see next figure) Figure 27: Manufacturing activity of multi-national car manufacturers (data derived from OICA) 77
78 Figure 28: Estimate of world market for MAC-equipped cars in Countries with surplus production numbers over demand values are considered major car exporting countries 78
. Most AC equipped cars are currently found in the US and Europe followed by China.")
79 5.4.4 Future demand Figure 29: Modelled future stock of MAC-equipped cars for 2010, 2020, 2030 (A) and estimated market value (B) for the top-6 countries The stock of AC equipped cars in the top 6 countries and regions is projected to increase, with similar growth rates for the different decades (Figure 29A). Most AC equipped cars are currently found in the US and Europe followed by China. However, this picture will change dramatically in future; China will become the dominant player by 2030 (Figure 29A). In Europe and the US, a saturation point will be reached before This estimated demand pattern follows the ageing and later decreasing population trends which consequently will affect sales in these countries. The current stock of the top 6 countries and regions amounts to nearly 300 million units in 2010 and ca. 800 million units by The market generally follows the shares and trends of the stock, except for India. India has less AC equipped cars than the US and Europe, today and in future, however the growth rates are exceptionally high. This explains the second largest market after China with a market worth 2.3 billion Euro China will have an estimated market of around 7 billion Euro in The market value of the plotted top-6 (Figure 29B) amounts to about 66% of the global market in
80 In contrast to the strong market increase of emerging economies such as China and India, reduced markets are expected in future for Europe. This is primarily caused by the predicted population decline in Germany and the expected stagnation of population in Italy. This highlights the necessity of considering various parameters besides GDP when predicting future stock and markets. Even though the stock of MAC-equipped cars now and projected in the future is higher in Japan than in Indonesia, the market value in Indonesia is predicted to be higher in There will be more people buying MAC-equipped cars than in Japan, where the market is relatively saturated Future emissions Different emission pathways are projected for the top 6 countries (Figure 30A). While the US and Europe show a slight increase of emissions, a stagnation is projected from 2025 onwards at a level of 165 Mt CO 2eq. In contrast, high increase of emissions is expected for growing economies such as China and India. While China s emissions will exceed those of the US and Europe between 2015 and 2020 to finally reach levels of more than 500 Mt CO 2eq, India reaches emission levels similar to those of the US and Europe by 2030 (165 Mt CO 2eq). Again, with the phase-in of green technology based on natural refrigerants, the emissions can significantly be reduced (Figure 30B) 73. Highest emission savings can be achieved in China with more than 250 Mt CO 2eq annually by Followed by a large margin are the US, Europe and India, with an annual mitigation potential below 50 Mt CO 2eq. Interestingly, Indonesia is among the top-6 with highest emission reduction potential. The top-6 countries make up 66% of the global mitigation potential in this specific subsector. 73 A full description of the mitigation scenario can be found in module 5 of the technical handbook NAMAs in the refrigeration, air conditioning and foam sectors (Proklima, 2013). 80
 shows the BAU scenario, while the bottom graph (B) shows the mitigation potential. 5.")
81 Figure 30: Projected total (direct and indirect) emissions from AC equipped cars for the top-6 countries as calculated by a vintage bottom-up stock model (A). Key determining factors are stock and sales figures. The upper graph (A) shows the BAU scenario, while the bottom graph (B) shows the mitigation potential. 5.5 Conclusion Contrary to the other subsectors, the MAC subsector is usually uniform with one refrigerant solution for all MAC units. At the moment the subsector is facing change as the European MAC directive bans the use of HFC-134a, which is the current global standard. Whilst most car manufacturers have opted to use u-hfc-1234yf in the future, three German manufacturers have decided to switch to CO 2 because of safety concerns of u-hfc-1234yf. There are four demand centres globally, the US (with similar structures in Canada and Mexico), the EU, Japan and China. Production usually follows demand and the traditional markets US, Japan and Europe are dominated by their established patterns where mostly EU MAC suppliers are linked to EU automobile manufactures etc. Production has often been moved to China with China now being the number one demand country. A global change to CO 2 could be possible by transforming some demand centres. As it is preferable and cheaper for car manufacturers to have one solution for all their cars the other demand centres would follow. It will be interesting 81
82 to see if other regions will follow Europe in the move towards low GWP refrigerants in the MAC subsector. China will likely play a decisive factor in this regard with being the leading market for car and MAC manufacturing. Most European players present in China are likely seeking synergies with their technological developments in Europe. Legislation about refrigerants in countries with less demand would have little impact on the global market. At the moment there are hardly any energy-efficiency standards for MACs and therefore no incentives for MAC producers to improve the energy-efficiency. Obligatory fuel standards for passenger cars that include MAC use or MEPS for MAC should be introduced. Again, because of the global nature of the MAC subsector, fuel standards or MEPS in a few key countries could help improve energy-efficiency in the whole subsector and have a significant global impact. Manufacturers and OEM suppliers can get involved in the development of standards for CO 2 MAC systems, which would make an introduction in other countries easier and allow early movers competitive advantages. There is an opportunity for Chinese suppliers to establish strategic coalitions with German OEMs to develop innovative CO 2 MAC solutions, initially, for the Chinese market. NGOs can promote the introduction of MAC in fuel standards and highlight the problems of accumulating TFA levels due to u-hfcs. 82
83 6 Chillers 6.1 Subsector characterisation Overview In chillers water is cooled by the evaporator. Cooled water is then distributed over longer distances and used to cool whole buildings (air-conditioning chillers) or industrial processes such as plastics and rubber manufacturing and food processing (process chillers) (biois, 2011). There are few technical differences between AC chillers and process chillers. The cold water from AC chillers usually has higher temperatures than in process chillers where medium and low temperatures are more common (bios, 2011). Even though every chiller, by definition, cools water; there are water-cooled (WC) and air-cooled (AirC) chillers. This refers to the method used to remove heat from the condenser. Chillers vary in their cooling capacity, which can range from as little as 1.75 kw for AirC chillers and up to several MW for WC chillers. Different capacity chillers are equipped with different compressors. Typically process chillers have a lower COP because these chillers need to generate lower temperatures. Efficiencies are given in COP, EER, SEER or integrated part load volume (IPLV, see box Terms 4: Energy efficiency terms in chapter 3). The latter also takes different part load efficiencies into account. The main conventional HFC or HCFC refrigerants used are HFC-134a, R410A, R407C and HCFC-22. HCFC-22 is still in use in developing countries but new appliances are also increasingly moving to the other refrigerants named here. The natural refrigerants propane (HC-290), propene (HC-1270), ammonia (R717) and CO 2 (R744) are regularly used in commercially available chillers. The focus here will be on AC chillers (about 2/3 of all chillers [Clodic et al., 2010]), because of application homogeneity. However, technical trends and emission reduction potentials are similar for process chillers. End-users of AC chillers are predominantly office buildings and the retail sector. The health sector (e.g. hospitals) and the leisure and hotel sector play a secondary role. As an alternative to chillers, Variable Refrigerant Flow systems (VRF) systems have been marketed as alternatives (Amarnath and Blatt, 2008). These have developed from multi-split air conditioners and combine one outdoor condensing unit with several (up to 60) indoor units. A variable speed compressor regulates the refrigerant flow so that each indoor unit can be adjusted individually (Aynur, 2010). In most systems, each indoor unit is connected with refrigerant piping. This makes it a difficult application for natural refrigerants as VRF requires high amounts of refrigerant, with a good quantity in occupied spaces (Aynur, 2010). CO 2 is an option that is being considered in regards to new restrictions on synthetic refrigerants from the European F-Gas regulations, but is generally not efficient enough (cci, 2013).However, there are recent developments where the refrigerant is kept completely outside, similarly to chillers (cci, ). VRFs are generally more expensive than chillers but can be more energy efficient (Aynur, 2010). 74 see also 83
84 6.1.2 Energy efficiency trends Chillers with lower capacities generally have lower efficiencies but the range of efficiencies is relatively uniform below and above 350 kw (Armines, 2012). Lower capacity chillers usually have scroll compressors whilst screw compressors are used for medium capacity and centrifugal compressors for high capacity chillers, which also have the highest efficiencies. IPLV or SEER ratings are always higher than fixed-point EER ratings because they also consider the efficiency at lower temperatures, which is always higher than the efficiency at high temperatures. WC chillers have higher capacities and are usually more efficient than AirC chillers. Water has a higher heat transfer capacity, so that less water is needed than air for the same amount of heat rejection. Water is also normally cooled in a cooling tower. There are some high efficiency range AirC products that are comparable to WC chillers in their efficiency (Naguib, 2011). There is relatively little data published on chiller efficiency trends or efficiency in different countries. The reason for this could be the inhomogeneity of chiller products that are not easily categorised. Data is available from the EU, the US, Australia and China 75. Differences between countries are lower than the range of EER or IPLV within one country in one category, which can be very high. The highest efficiency in part-load efficiency lies at 9.4, which is reached by an oil-free centrifugal WC chiller. This is made possible by magnetic bearings reducing friction losses, the lack of oil interfering with efficiency, extremely high efficiencies in the 25 to 60% load operating range and very good control of variable load (McQuay, DanfossTurbocor). In the US, more than 40% of centrifugal chillers use this technology already 76. Other significant markets are Europe and Australia and growth is expected in China, India, Russia, and Brazil. 75 Chinese chiller efficiencies are label grades from 2004 where grade 3 is taken as the average and grade 1 and 5 make up the maximum and minimum respectively. EER from the EU in 2010 are approximately represented by EUROVENT grades from 2005, with the average corresponding to the median grade
85 Figure 31: Average EER and IPLV for different countries 6.2 International and national regulations Few countries have introduced MEPS regarding chillers and only AC chillers are considered Figure 32). Because of the importance of part load operation, MEPS are sometimes also given for IPLV values (Australia &New Zealand, USA & Canada). The wide range of chillers is taken into account by different specifications in the MEPS. There are different requirements for AirC and WC chillers, the range of cooling capacities and different compressors. In Australia and the USA, there are higher IPLV requirements for chillers that are primarily run during part-load operation and they need to be equipped with more accurate part-load controls (data not shown here). There are few differences in the EER and IPLV of different countries, but MEPS in Australia and New Zealand, which were introduced later, have more stringent requirements. There are labelling programmes for AC chillers in the EU and China with the Chinese grades requiring slightly higher efficiency. A difficulty in comparing EER or IPLV values from different countries is that there is no international test standard yet. The imminent phase-out of HCFCs in developing countries and increasing restrictions on the use of HFCs will lead to significant changes in the refrigerant use in chillers. 85
86 Figure 32: MEPS EER and IPLV requirements for AirC (A) and WC (B) chillers Alternative technologies/refrigerants Propane (HC-290) and propene (HC-1270), ammonia (R717) and CO 2 (R744) are already used in chillers, especially in process chillers. The use of ammonia is a more cost-efficient solution for chillers with high cooling capacity (> kW) whereas HCs dominate at smaller capacities. Because of the high amount of refrigerant and their respective flammability and toxicity, safety measures have to be taken. This usually includes installation of the majority of the refrigerant cycle outside of buildings or in a special machinery room. The water that is then transported to cool occupied spaces poses no risk in itself. The high amount of refrigerant, reaching from several kg to several tonnes, means that leak reduction can significantly reduce direct emissions. Emissions can occur during servicing even if the piping is assumed hermetically sealed and reach 5 to 10% a year (Clodic et al., 2010). Leakage rates in developing countries are considerably higher and in the range of 14 and 30%, with an average of 20% (UNEP, 2013). End-of-life recovery ranges from 10 to 80% (Armines, 2012), however this is not common practice in developing countries, where the majority of refrigerant is vented into the atmosphere Indirect emissions Energy efficiency can be improved by replacing some components with high efficiency parts. The highest gains can be reached by optimising the heat exchanger and using an inverter compressor to allow for part-load operation. As most chillers only run at full-load for a short period of the year and are generally more efficient when they do not, including an inverter or another means of controlling the capacity (e.g. installing two compressors and being able to switch one off if it is not needed) lead to higher overall energy efficiency. HCs have particular advantages in high ambient environments where energy efficiency improvements in comparison to HCFC-22 chillers of about 15% can be achieved 77. Chillers using HC-290 as refrigerants are up to 10% more efficient (Pedersen, 2012) due to the thermodynamic properties of HCs. Challenges: CO 2 systems for AC chillers are available, but are far less efficient than hydrocarbon or ammonia chiller D.Colbourne: Overview of the use of Hydrocarbon Refrigerants in chillers, UNEP chiller conference, Cairo, September Advansor, personal communication at Atmosphere 2013, 15/10/2013, Brussels. 86
87 Table 12: Energy efficiency measures for chillers Measure Improvement COP Cycle improvements Inverter/variable Speed (flow) 36% max Compressor Heat exchanger Parasitic losses Cycle modifications HC 10 % (Pedersen, 2012) Change in use Part-load controls Right positioning and maintenance 30% (biois,2011) Reducing cooling needs For AC chillers, the same considerations as for UAC apply. Even more cooling needs can be reduced by planning and designing office buildings and hospitals with the minimisation of the cooling load in mind. It is also important to choose the chiller according to the needed capacity. The location where a chiller is installed and general considerations about its operation and maintenance can lead to very high savings in electricity consumption. This includes selecting a place that is not close to other heat sources, choosing the optimum water temperature, managing and cleaning pumps and filters and fine-tuning for partial-load operation (biois, 2011) CO 2 emissions over lifetime Figure 33 shows the lifetime CO 2 emissions for AC chiller in a comparison of the BAU to several mitigation scenarios. AC chillers have very high energy demand so that direct emissions only contribute about 3% to total emissions in industrialised countries and 4.5% in developing countries. Direct emissions are about twice as high in developing countries because of higher leakage rates and little refrigerant collection at the disposal of units. Significant total emission reductions can therefore only be reached by improving energy efficiency or decarbonising electricity generation. For the global reduction of direct refrigerant emissions, chillers play an important role because of their high refrigerant content and relatively high leakage rates and low recovery efficiency. Direct emissions of AC chillers are 20 times higher than those from UACs. A combination of energy efficiency measures and natural refrigerants can reduce total emissions by 40% in industrialised countries and up to 60% in developing countries. The ecodesign study on AC chillers sees a significant reduction potential by switching to an energy efficient natural refrigerant model (Armines, 2012). Process chillers usually operate on lower temperatures and therefore have an even higher energy input resulting in higher indirect emissions than AC chillers. In order to reduce total emissions, it is therefore even more important to increase the energy efficiency of process chillers (biois, 2011). 87

88 Figure 33: CO 2 emissions over lifetime in AC chillers in developing countries (DC) and industrialised countries (IC). An average value has been applied for IC and DC as there are significant differences within those country groups. 6.3 Production and demand Overview Chillers are used for cooling in industrial, commercial as well as residential applications and therefore come with a whole range of different cooling capacities. The cooling capacity of chillers usually depends on the compressor type, but there is some overlapping between them. Chillers can be categorised intro three classes according to the type of compressor they use: positive-displacement (reciprocating, scroll, screw) and centrifugal absorption chillers The following section will focus on the market for positive-displacement and centrifugal chillers. Among the three chiller classes, absorption chillers have the lowest market share 79. Absorption chillers do not use electrical compressors but heat as energy source. They use natural refrigerants, have extremely low COPs and are normally only used when waste heat is available. They represent an extremely small fraction of the market and as such will not be discussed further. The smallest power classes of chillers are chillers with reciprocating and scroll compressors, the latter with a typical cooling capacity of up to 280 kw. Reciprocating chillers are now rarely used for air conditioning but mostly for refrigeration 80. Modular chillers with scroll compressors maintain a stable market share and because of their costeffectiveness they may become an alternative to screw chillers in some applications 81. Screw chillers occupy medium cooling capacity ranges (from around 18 to 1400 kw). In the upper cooling power classes modular set-ups compete with centrifugal chillers (from around 1050 kw) and are becoming an interesting option since they are cheaper.. Centrifugal chillers are used for the highest cooling capacity classes Chiller sales follow trends in the Economic environment. BSRIA Press Release 46/12. China Electric Appliance Manufacturer. (2011). China Air Conditioning Industry 88

89 6.3.2 Demand The demand for chillers is highly influenced by the general economic development. The key drivers of the chiller market are the construction activity besides the refurbishment or replacement of existing chillers. As there was limited access to data on unit sales of chillers, the focus of this section is on the value of the chiller market, which is a common way to describe this market. Unit prices differ considerably depending on the chiller s cooling capacity an type. The total value of the global positive-displacement and centrifugal chiller market was around USD 7.4 billion in , roughly a tenth of the global UAC market. The global market value distribution of 2012 is illustrated in Figure 34. The UAC market (see chapter 4.3) is growing faster than the chiller market. Especially as VRF systems are a competitive alternative to chillers with regard to ease of installation, advantages in maintenance and commissioning, individual zone air-conditioning control and increased energy efficiency. The decision for using VRF instead of a chiller for central air conditioning however is project-dependent and prone to certain initial costs which need to be factored in 83. Figure 34: World positive-displacement and centrifugal chiller market in 2012 by market value 82 JARN s Chiller Special
90 Figure 35: World positive-displacement and centrifugal chiller market in terms of market value. Note: The data presented here is drawn from various sources and reflects the best available information. With the growth of developing and emerging economies, the chiller market is continuously expanding. The distribution of chiller market value by region among key countries is depicted in Figure 35. More than half of the world s market value is located in the Asian and SE Asian economies. China is the largest chiller market and also the largest market for process chillers. Japan is the second largest market in Asia and is turning into a refurbishment market. Indonesia is the largest market in SE Asia and continuing infrastructure development. Expanding construction of commercial and public buildings will lead to growing demand. Thailand sees growth in reconstruction after the flooding in 2011 and demand from commercial and industrial operations is picking up again. Other major markets are the US, the Middle East, and Europe. The US is the second largest AC chiller market globally. Its manufacturers have expertise in centrifugal chillers, which is of great interest in Middle Eastern countries and Saudi Arabia where the demand for district cooling is picking up. In Europe chiller sales are falling due to lacking economic recovery. In markets such as Germany, France, Italy, and Spain, the majority of units sold are scroll chillers with capacities below 100kW. In Europe, the relative global share of chillers is higher than that of UAC units. This is due to the fact that AC for domestic cooling purposes are used to a much lower extent in Europe than in Asia. In comparison, commercial air conditioning by chillers is more widely spread. 90
91 6.3.3 Production Figure 36 presents the countries of key chiller markets with the main national chiller producing companies. Figure 37 shows the activity of manufacturers on the international stage by the locations of their production facilities. Manufacturing of chillers is not as dominated by companies of Asian countries as that of UAC units. Companies come from a range of countries and have also distributed their production sites in diverse countries. As shown in Figure 37 chiller production and sales seems to be directed from regional hubs in specific countries from which distribution may be logistically more effective other than the highly concentrated mass production of UACs (chapter 4.3). Many chillers are still made according to the specifications of the order or customised to the local requirements. Especially in Europe (e.g. Italy), there are many local producers of chillers. 91
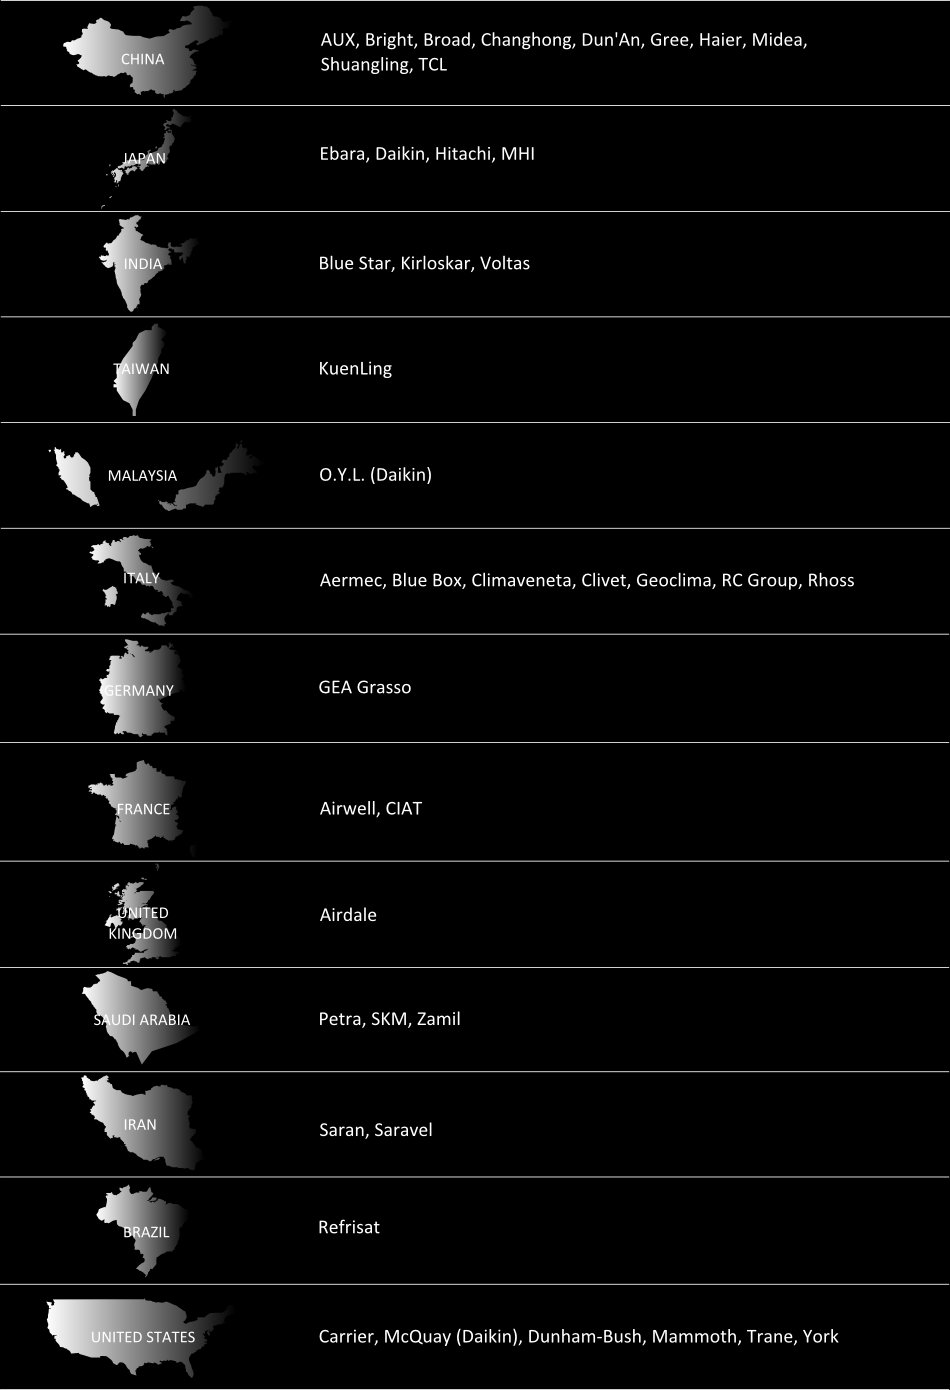
92 92
93 Figure 36: Manufacturers in key chiller-producing countries. Note: Some may act on multi-national level (see next figure). US chiller manufacturers, such as Carrier, York and Trane attempt to diversify their production sites around the world in order to maintain market dominance. Even though US manufacturers increasingly transfer the mass-production to China and other countries, production of core components and high-performance/-efficiency chillers remains in the US. US chiller manufacturers are well positioned in Asia and SE Asia and dominate the local markets. Chiller products manufactured in the US have also a very high popularity in the Middle East. However, Chinese manufacturers, such as Gree, Haier, Midea and Dun An are gaining global market share. In 2011, 12% of total sales of Chinese producers were exported 84. Chinese companies so far mainly export to SE Asia and the Middle East. Japanese manufacturers seem to follow the strategy of US chiller companies, which is to manufacture the bulk in their Chinese factories, but to keep the production of high-performance chillers and parts in Japan. There is strong competition for Japanese chillers from US chillers made in China. Factories in Europe mainly provide small and medium-sized chillers with capacities up to 350 kw. Most of the European chiller production takes place in Italy. Around 75% of these are small air-cooled chillers with capacities lower than 100 kw and a large proportion is going into exports. Both European and Chinese manufacturers compete for market share in the Middle East. 84 China Electric Appliance Manufacturer,
94 Figure 37: Production bases of major positive-displacement and centrifugal chiller manufacturers Note: The scale has no base unit. VRF systems Under certain conditions, which depend on a building s application and planning, VRF systems can be a suitable alternative to small and medium-sized chiller installations. The VRF market in various countries is rapidly expanding and since being comparable to the value of the chiller market (USD 7.4 billion) it will be marginally addressed here. VRFs were initially introduced through Japanese manufacturers. Growth in VRF sales in 2012 could be observed in 94

95 many countries, such as China (8%) and India (5%). In Brazil growth was as high as 50% in the first quarter of 2013 and this seems to be related to the World Cup in 2014 and the Olympic Games in The highest expected growth rates between 2012 and 2015 are 31% in the USA, 19% in Russia, 16% in Turkey, 14% in India and 10% in China 86. The largest market, again, is China, with about half of the total of 850,000 units sold in 2012, followed by Japan and South Korea. Mini-VRF systems have become very popular China and are increasingly used both residentially and commercially. Because of the recent housing construction boom in China and the subsequent installation of mini- VRFs, they now account for 70% of residential central air-conditioning. Figure 38: Estimate of global share of VRF systems by market size in units 6.4 Conclusion The chiller market is relatively small compared to the UAC subsector, but demand is also rising and as more and more building projects include central air conditioning in the planning stage instead of having occupants buy their own UAC at a later stage, it will grow considerably in the future. Whilst China is also the single most important country when it comes to demand, the production of chillers is much more diverse than in the UAC subsector. There are still big international brands with global presence but production is often local and this leaves room for smaller companies with innovative highly energy efficient green cooling technologies using natural refrigerants. Chinese brands are emerging in the global market but are far from dominating. Chinese manufacturers could gain market shares both domestically and abroad with Green Chiller technologies. While MEPS are implemented in some developed countries, they play a far lesser role than in UAC for improving energy efficiency. Because chillers are often made for a specific purpose it is necessary to set a whole range of MEPS, which are difficult to keep track of. Building standards and guidelines for planning energy efficient AC chillers Holley AM, Global Trends in Air Conditioning, BSRIA AHR, 29 th,
Chillventa 2014. The Green Cooling Initiative
 Chillventa 2014 5 th GIZ Proklima International Experts Day The Green Cooling Initiative Bernhard Siegele GIZ Proklima 15 th October 2014, Nuremberg, Germany Seite 1 Deutsche Gesellschaft für Internationale
Engineers Newsletter. HVAC Refrigerants: A Balanced Approach. providing insights for today s hvac system designer. volume 40 2. Refrigerant History
 providing insights for today s hvac system designer Engineers Newsletter volume 40 2 HVAC Refrigerants: A Balanced Approach One of the constant themes throughout the history of the HVAC industry is the
R-32. The next generation refrigerant for air conditioners and heat pumps
 R-32 The next generation refrigerant for air conditioners and heat pumps Daikin is the first company in the world to launch heat pumps and air conditioners charged with R-32. This refrigerant has several
HFCS, REFRIGERATION AND AIR-CONDITIONING: MINIMISING CLIMATE IMPACT, MAXIMISING SAFETY
 HFCS, REFRIGERATION AND AIR-CONDITIONING: MINIMISING CLIMATE IMPACT, MAXIMISING SAFETY HFCS, REFRIGERATION AND AIR-CONDITIONING: MINIMISING CLIMATE IMPACT, MAXIMISING SAFETY The impact of refrigeration
The phase out of R22. Phase out of HCFCs
 The phase out of R22 The Montreal Protocol on Substances that Deplete the Ozone Layer is widely regarded as the world s most successful environment protection agreement. It is the only treaty with universal
The EC Ozone Regulation. Legislative Update and Strategies for HCFC Phase-out
 Information Sheet RAC 8 R22 Phase-out The EC Ozone Regulation Legislative Update and Strategies for HCFC Phase-out 1. Background to HCFC Phase Out The EC Ozone Regulation (EC/2037/2000) provides the legislative
New EU Legislation on F- Gases
 New EU Legislation on F- Gases motivation, objectives, impacts, innovation Arno Kaschl European Commission DG Climate Action Tel Aviv 31 March 2014 Climate Action Relevance of fluorinated gases (F-gases)
E VIRO ME T Council meeting Luxembourg, 14 October 2013
 COU CIL OF THE EUROPEA U IO EN Conclusions on Preparations for the 19th session of the Conference of the Parties (COP 19) to the United ations Framework Convention on Climate Change and the 9th session
HCFC phase-out has started.
 HCFC phase-out has started. 02 HCFC phase-out has started. HCFC phase-out has started. Are you prepared? Global phase-out of HCFCs is already underway. This will impact the availability and pricing of
EU f-gas regulation EN 517/2014.
 F-gas regulation EU f-gas regulation EN 517/2014. Helping you meet your environmental obligations. 02 EU f-gas regulation EU f-gas regulation. Reducing your environmental impact. The updated f-gas regulation
THE F-GAS REGULATION AND ITS IMPLICATIONS IN FIRE SUPPRESSION APPLICATIONS
 THE F-GAS REGULATION AND ITS IMPLICATIONS IN FIRE SUPPRESSION APPLICATIONS Mark L. Robin, Ph.D. DuPont Fluoroproducts P.O. Box 80711, Wilmington, DE 19880-0711 Tel: 302-999-5002; Fax 302-999-2093 mark.l.robin@usa.dupont.com
Guidance for Stationary Refrigeration & Air- Conditioning
 Department for Environment, Food and Rural Affairs Guidance for Stationary Refrigeration & Air- Conditioning The EU Ozone Regulation: Legislative update and strategies for HCFC Phase-out Information Sheet
Fact sheet: STEPPING UP INTERNATIONAL ACTION ON CLIMATE CHANGE The Road to Copenhagen
 Fact sheet: STEPPING UP INTERNATIONAL ACTION ON CLIMATE CHANGE The Road to Copenhagen Introduction Climate change is today widely recognized as one of mankind s greatest challenges in the 21st century.
Annex 5A Trends in international carbon dioxide emissions
 Annex 5A Trends in international carbon dioxide emissions 5A.1 A global effort will be needed to reduce greenhouse gas emissions and to arrest climate change. The Intergovernmental Panel on Climate Change
Environmental and Safety Impacts of HFC Emission Reduction Options for Air Conditioning and Heat Pump Systems
 Environmental and Safety Impacts of HFC Emission Reduction Options for Air Conditioning and Heat Pump Systems William M. Corcoran, George Rusch, Mark W. Spatz, and Tim Vink AlliedSignal, Inc. ABSTRACT
Guidance for Mobile Air Conditioning (MAC) Sectors. Guidance: F Gas and Ozone Regulations Information Sheet MAC 3: Key Obligations
 Sectors. Guidance: F Gas and Ozone Regulations Information Sheet MAC 3: Key Obligations") Department for Environment, Food and Rural Affairs Guidance for Mobile Air Conditioning (MAC) Sectors Guidance: F Gas and Ozone Regulations Information Sheet MAC 3: Key Obligations April 2012 Contents
Department for Environment, Food and Rural Affairs Guidance for Mobile Air Conditioning (MAC) Sectors Guidance: F Gas and Ozone Regulations Information Sheet MAC 3: Key Obligations April 2012 Contents
Guidance for Stationary Refrigeration & Air-Conditioning
 Information Sheet RAC 3 Key Obligations Guidance for Stationary Refrigeration & Air-Conditioning This Information Sheet provides a description of the key obligations under the EC F gas and Ozone Regulations
Six greenhouse gases covered by the United Nations Framework Convention on Climate Change (UNFCCC) and its Kyoto Protocol are:
 and its Kyoto Protocol are:") Fact sheet: The need for mitigation United Nations Framework Convention on Climate Change Along with adaptation, mitigation is one of the two central approaches in the international climate change process.
Fact sheet: The need for mitigation United Nations Framework Convention on Climate Change Along with adaptation, mitigation is one of the two central approaches in the international climate change process.
Industry insight. Refrigerant gases: an industry in transition.
 Industry insight. Refrigerant gases: an industry in transition. Author Jon Black, Global Head of Chemicals and Refrigerants Date June 2012 First Published by CryoGas International, July 2012 Refrigerant
Part A: Fluid properties
 UNEP Ozone Secretariat UNEP Ozone Secretariat Background Workshop Material on HFC for management: HFC Workshop, technical 2015 issues Bangkok, 20 and 21 April 2015 FACT SHEET 15 Glossary of terms and technical
EU F-Gas Regulation Guidance Information Sheet 15: Fire Protection System Contractors
 Information Sheet 15: Fire Protection System Contractors Target audience for this Information Sheet This Information Sheet is aimed at contractors that carry out installation, maintenance and decommissioning
TECHNICAL ANNEX. Alternatives to HCFCs/HFCs in unitary air conditioning equipment at high ambient temperatures. November 2014
 TECHNICAL ANNEX Alternatives to HCFCs/HFCs in unitary air conditioning equipment at high ambient temperatures November 2014 Authors: Bastian Zeiger, Barbara Gschrey, Winfried Schwarz Öko-Recherche, Frankfurt/Main,
Scope 1 describes direct greenhouse gas emissions from sources that are owned by or under the direct control of the reporting entity;
 9 Greenhouse Gas Assessment 9.1 Introduction This chapter presents an assessment of the potential greenhouse gas emissions associated with the Simandou Railway and evaluates the significance of these in
EU F-Gas Regulation Guidance Information Sheet 5: Stationary Air-conditioning and Heat Pumps
 Information Sheet 5: Stationary Air-conditioning and Heat Pumps Target audience for this Information Sheet This Information Sheet is aimed at organisations that are operators (usually the owner) of stationary
History of Chlorofluorocarbons
 History of Chlorofluorocarbons 1928 : Chlorofluorocarbons () were invented. were developed as ideal gases used as refrigerants for refrigerators. Because of their special characteristics, inflammability
NEW ZEALAND. Submission to the ADP. New Zealand s Intended Nationally Determined Contribution. 7 July 2015
 NEW ZEALAND Submission to the ADP New Zealand s Intended Nationally Determined Contribution 7 July 2015 New Zealand hereby communicates its intended nationally determined contribution and the accompanying
Thermo Scientific Ultra-Low Temperature TSX Series Freezers
 Thermo Scientific Ultra-Low Temperature TSX Series Freezers High sample security, low environmental impact White Paper Key Words Cold storage, sustainability, sample security, sample protection, low environmental
Why are developing countries exempt from the emissions targets?
 Kyoto Protocol Overview The Kyoto Protocol is a legally binding, international agreement that sets targets for industrialized countries to limit or reduce their emissions of greenhouse gases (GHG) by the
Latin America and COP20
 ESSAY cities, Latin America and the Caribbean (LAC) increasingly try to engage in global environmental issues, particularly with regards to the challenge of climate change. Latin America and the Caribbean
Resolution: Energy and climate. Year and Congress: November 2009, Barcelona. Category: Environment and Energy. Page: 1. Energy and climate change
 The European Liberal Democrat and Reform Party, convening in, Catalonia on 19th and 20th November 2009: Notes that: The EU is responsible for approximately 10 per cent of global greenhouse gas emissions
The Importance of Mobile Air Conditioning to Climate Protection. Stephen O. Andersen US EPA
 The Importance of Mobile Air Conditioning to Climate Protection Stephen O. Andersen US EPA US & EC Share Climate Concern The United States shares global concern for Climate Change and is taking action
Submission by Norway to the ADP
 Submission by Norway to the ADP Norway s Intended Nationally Determined Contribution 1. Introduction Norway is fully committed to the UNFCCC negotiation process towards adopting at COP21 a protocol, another
DEVELOPMENT OF THE GHG REFRIGERATION
 DEVELOPMENT OF THE GHG REFRIGERATION AND AIR CONDITIONING MODEL FINAL REPORT December 2011 Prepared for the Department of Energy and Climate Change By ICF International Table of Contents Executive Summary...
EU energy and climate policies beyond 2020
 EU energy and climate policies beyond 2020 Policy recommendations EU s energy and climate change policies are in need of reform. They need to be consistent, simplified and set to drive European competitiveness.
Australia s 2030 Emission Reduction Target
 Australia s 2030 Emission Reduction Target Strong, credible, responsible The Australian Government will reduce greenhouse gas emissions to 26 28 per cent below 2005 levels by 2030. Our target is a step
White Paper Life Cycle Assessment and Product Carbon Footprint
 White Paper Life Cycle Assessment and Product Carbon Footprint Fujitsu ESPRIMO E9900 Desktop PC Climate change is one of the most important global challenges that society of the 21st century faces. According
Smart Cities. Smart partners in tomorrow s cities
 DNV KEMA serving the energy industry Smart Cities Smart partners in tomorrow s cities Experience, knowledge and advanced methods & tools for smart city planning and implementation 02 I DNV KEMA SERVING
2010 Report of the Refrigeration, Air Conditioning and Heat Pumps Technical Options Committee (RTOC)
") 2010 Report of the Refrigeration, Air Conditioning and Heat Pumps Technical Options Committee (RTOC) 2010 Assessment Montreal Protocol on Substances that Deplete the Ozone Layer Celebrating 25 years of
2010 Report of the Refrigeration, Air Conditioning and Heat Pumps Technical Options Committee (RTOC) 2010 Assessment Montreal Protocol on Substances that Deplete the Ozone Layer Celebrating 25 years of
EU F-Gas Regulation Guidance Information Sheet 14: Refrigeration, Air-Conditioning and Heat Pump Contractors
 Information Sheet 14: Refrigeration, Air-Conditioning and Heat Pump Contractors Target audience for this Information Sheet This Information Sheet is aimed at contractors that carry out installation, maintenance
Prepared by the Commission on Environment & Energy
 Policy statement Energy efficiency: a world business perspective Prepared by the Commission on Environment & Energy Key messages Energy efficiency is a fundamental element in progress towards a sustainable
ADVANCING FLAMMABLE REFRIGERANT ADOPTION IN NORTH AMERICA
 NEW SCIENCE SUSTAINABLE ENERGY ARTICLE ADVANCING FLAMMABLE REFRIGERANT ADOPTION IN NORTH AMERICA SUMMER 2013 UL.COM/NEWSCIENCE NEW SCIENCE SUSTAINABLE ENERGY OVERVIEW Rising costs, energy efficiency and
GLOBAL WARMING : THE SIGNIFICANCE OF METHANE
 GLOBAL WARMING : THE SIGNIFICANCE OF METHANE 1. CLIMATE CHANGE TARGETS Benjamin DESSUS, Bernard LAPONCHE, Hervé LE TREUT (February 19, 28) * At its meeting on 3 October 27, the EU Environment Council adopted
EXAMPLES OF SUCCESSFUL POLICY TOOLS FOR EMISSION REDUCTION
 Submission of the United Nations Environment Programme (UNEP) Sustainable Building Initiative (SBCI) to the Ad Hoc Working Group on Long-Term Cooperative Action under the Convention (AWG-LCA) 24 April
THE UK CLIMATE CHANGE PROGRAMME AND EXAMPLES OF BEST PRACTICE. Gabrielle Edwards United Kingdom
 Workshop on Best Practices in Policies and Measures, 11 13 April 2000, Copenhagen THE UK CLIMATE CHANGE PROGRAMME AND EXAMPLES OF BEST PRACTICE Gabrielle Edwards United Kingdom Abstract: The UK published
How To Know If Cfc 12 Is Still Needed
 Mobile Air Conditioning James A. Baker Delphi Corporation 19 th OORG Meeting March 2002 Presentation Topics Estimating CFC-12 Needs for Developing Countries The Effectiveness of Refrigerant Recycling Challenges
R-32. The next generation refrigerant for air conditioners and heat pumps. Superior energy efficiency and low GWP
 R-32 The next generation refrigerant for air conditioners and heat pumps Superior energy efficiency and low GWP HFC phase-down and the introduction of R32 The European phase-down of HFCs, which will see
Environmental perspective in intelligent products and processes
 Environmental perspective in intelligent products and processes Climate changes and refrigeration technology Ole M. Daugbjerg, Corporate Vice President Communications & Reputation Management Danfoss Refrigeration
Kyoto Protocol MEMO/04/43. What is the Kyoto Protocol? Bruxelles, 4 March 2004
 MEMO/04/43 Bruxelles, 4 March 2004 Kyoto Protocol What is the Kyoto Protocol? The United Nations Framework Convention on Climate Change (UNFCCC) and its Kyoto Protocol provide the only international framework
Fujitsu Group s Environmental Management: Outline of Environmental Protection Program (Stage IV)
") Fujitsu Group s Environmental Management: Outline of Environmental Protection Program (Stage IV) V Hideru Yamaguchi (Manuscript received March 9, 2005) Environmental activities are an important element
Fujitsu Group s Environmental Management: Outline of Environmental Protection Program (Stage IV) V Hideru Yamaguchi (Manuscript received March 9, 2005) Environmental activities are an important element
PRESS RELEASE. UN Climate Change Conference in Doha kicks off with calls to implement agreed decisions, stick to agreed tasks and timetable
 For use of the media only PRESS RELEASE UN Climate Change Conference in Doha kicks off with calls to implement agreed decisions, stick to agreed tasks and timetable (Doha, 26 November 2012) The UN Climate
The Economics of Climate Change C 175. To Kyoto and Beyond. Spring 09 UC Berkeley Traeger 7 International Cooperation 22
 To Kyoto and Beyond 7 International Cooperation 22 International Cooperation on Climate Change 1988 United Nations General Assembly adopted resolution urging the protection of global climate for present
DANISH DISTRICT ENERGY PLANNING EXPERIENCE
 MOWAT ENERGY, A RESEARCH HUB AT THE MOWAT CENTRE, AT THE REQUEST OF THE ONTARIO MINISTRY OF ENERGY FUTURE INNOVATION IN ENERGY PLANNING: A SPECIAL SESSION TO ADVISE ON ONTARIO S LONG-TERM ENERGY FUTURE
The Voice of European Air-Conditioning, Refrigeration and Heat Pumps Contractors
 The Voice of European Air-Conditioning, Refrigeration and Heat Pumps Contractors Copyright AREA 2014 Who are we? The expert Our contractors design, install, service, maintain, repair and decommission refrigeration,
GLENEAGLES PLAN OF ACTION CLIMATE CHANGE, CLEAN ENERGY AND SUSTAINABLE DEVELOPMENT. 1. We will take forward actions in the following key areas:
 GLENEAGLES PLAN OF ACTION CLIMATE CHANGE, CLEAN ENERGY AND SUSTAINABLE DEVELOPMENT 1. We will take forward actions in the following key areas: Transforming the way we use energy Powering a cleaner future
FACTS ABOUT CLIMATE CHANGE
 FACTS ABOUT CLIMATE CHANGE 1. What is climate change? Climate change is a long-term shift in the climate of a specific location, region or planet. The shift is measured by changes in features associated
Calculating HFC and PFC Emissions from the Manufacturing, Installation, Operation and Disposal of Refrigeration & Airconditioning
 Calculating HFC and PFC Emissions from the Manufacturing, Installation, Operation and Disposal of Refrigeration & Airconditioning Equipment (Version 1.0) Guide to calculation worksheets (January 2005)
Issue. September 2012
 September 2012 Issue In a future world of 8.5 billion people in 2035, the Energy Information Administration s (EIA) projected 50% increase in energy consumption will require true all of the above energy
Planning for the ban on R22 in building air conditioning
 - ACHPI 32 Planning for the ban on R22 in building air conditioning Those responsible for cooling and heating commercial properties are under increased pressure to improve energy efficiency and negotiate
To approve Intended Nationally Determined Contributions of the Republic of Armenia under the UNFCCC according to the following Annex.
 Protocol Decision No 41, 10 September, 2015 Government of the Republic of Armenia On approving the Intended Nationally Determined Contributions of the Republic of Armenia under the UN Framework Convention
F-Gas Compliance. To provide a process for F-Gas Leak Testing in accordance with legislative requirements.
 F-Gas Compliance EMS DOCUMENT TYPE: ENVIRONMENTAL ASPECT: PURPOSE: Operational Control Document Emissions to Air To provide a process for F-Gas Leak Testing in accordance with legislative requirements.
G20 ENERGY EFFICIENCY ACTION PLAN VOLUNTARY COLLABORATION ON ENERGY EFFICIENCY
 G20 ENERGY EFFICIENCY ACTION PLAN VOLUNTARY COLLABORATION ON ENERGY EFFICIENCY 16 NOVEMBER 2014 G20 Energy Efficiency Action Plan 2 1. Executive summary 1.1 Energy efficiency is a priority for G20 members.
Production of R-134a
 Production of R-134a Background In the 1930 s, chlorofluorocarbons (CFC s) were developed as a supposedly safe alternative to ammonia and sulfur dioxide refrigerants. While sulfur dioxide is toxic and
Shipping, World Trade and the Reduction of
 Shipping, World Trade and the Reduction of United Nations Framework Convention on Climate Change International Maritime Organization Marine Environment Protection Committee International Chamber of Shipping
WHY AND HOW THE ENVIRONMENT HAS TO BE TAKEN INTO ACCOUNT AT THE WORLD SUMMIT ON THE INFORMATION SOCIETY, GENEVA 2003 TUNIS 2005
 Document WSIS/PC-2/CONTR/43-E 18 December 2002 English only EPFL Working Group on the impact of ICT on the Environment WHY AND HOW THE ENVIRONMENT HAS TO BE TAKEN INTO ACCOUNT AT THE WORLD SUMMIT ON THE
P08 Köldmedier med låg växthuseffekter
 P08 Köldmedier med låg växthuseffekter Pavel Makhnatch Tranås, 17-18 May Reference: IPCC, 2013 3 4 5 Growth of climate change commitments from HFC banks and emissions Reference: Velders et al. 2014 6
Interview: Aurélie Faure, Financial Analyst at Dexia Asset Management
 Research letter n 09/03 October 2009 http://www.carbonium.fr/pdf/research0903.pdf CONTENTS Interview: Aurélie Faure, Financial Analyst at Dexia Asset Management... p. 1 Hot topics in Copenhagen... p. 3
Questions and Answers on the European Commission Communication: The Paris Protocol A blueprint for tackling global climate change beyond 2020
 European Commission - Fact Sheet Questions and Answers on the European Commission Communication: The Paris Protocol A blueprint for tackling global climate change beyond 2020 Brussels, 25 February 2015
Technical Note: Comparing R407C and R410A as Alternatives for R22. A Technical Note from the Experts in Business-Critical Continuity
 Technical Note: Comparing R407C and R410A as Alternatives for R22 A Technical Note from the Experts in Business-Critical Continuity Purpose The purpose of this document is to provide a brief overview of
Residential & Commercial Sectors Overview CLIMATE
 CLIMATE TECHBOOK Residential and Commercial Emissions in the United States Greenhouse gas (GHG) emissions data can be reported either by economic sector, which includes electric power generation as a separate
Chapter 1.9 Global Environmental Concerns
 Chapter 1.9 Global Environmental Concerns Part I Objective Type Questions 1. The spread of the Stratosphere above the Earth s surface is a) Below 15 km b) 10 to 50 km c) above 50 km d) above 100 km 2.
Commercial refrigeration has been in the environmental. Refrigerant. as a. Basics Considerations PART 1:
 PART 1: CO 2 Commercial refrigeration has been in the environmental spotlight for more than a decade, especially as leakage studies have revealed the true effects of hydrofluorocarbon (HFC) emissions.
Replace Your CFC Air Conditioning Chiller
 Building Owners Save Money, Save the Earth Replace Your CFC Air Conditioning Chiller The Montreal Protocol and Industry Leadership By the 1980s, scientists had concluded that chlorofluorocarbons (CFCs)
Testimony of Jerry Bosworth President, Bosworth Air Conditioning and Heating, Inc., Galveston, Texas And Vice Chairman ACCA The Indoor Environment
 Testimony of Jerry Bosworth President, Bosworth Air Conditioning and Heating, Inc., Galveston, Texas And Vice Chairman ACCA The Indoor Environment and Energy Efficiency Association Board of Directors Chairman
Nuclear power is part of the solution for fighting climate change
 Nuclear power is part of the solution for fighting climate change "Nuclear for Climate" is an initiative undertaken by the members of the French Nuclear Energy Society (SFEN), the American Nuclear Society
Advance unedited version. Decision -/CP.13. Bali Action Plan
 The Conference of the Parties, Decision -/CP.13 Bali Action Plan Resolving to urgently enhance implementation of the Convention in order to achieve its ultimate objective in full accordance with its principles
Low-GWP Refrigerants for Air Conditioning and Refrigeration Applications. Samuel F Yana Motta
 Low-GWP Refrigerants for Air Conditioning and Refrigeration Applications Samuel F Yana Motta Refrigerants for Stationary Applications HONEYWELL CONFIDENTIAL N Series L Series Current Product Reduced GWP
Communicating Your Commitment: Your Guide to Clean Energy Messaging
 Communicating Your Commitment: Your Guide to Clean Energy Messaging Congratulations on your recent purchase of clean energy from Renewable Choice! Whether you ve purchased green power in the form of renewable
Nordea Asset Management. Our Approach on Climate Change
 Nordea Asset Management Our Approach on Climate Change Introduction Scientific fact base The Intergovernmental Panel on Climate Change (IPCC) Fifth Assessment Report concludes that Climate change and
A Performance Comparison of Vapour Compression Refrigeration System Using Eco Friendly Refrigerants of Low Global Warming Potential
 International Journal of Scientific and Research Publications, Volume 2, Issue 9, September 2012 1 A Performance Comparison of Vapour Compression Refrigeration System Using Eco Friendly Refrigerants of
PRESENTATION 2 MAJOR ENVIRONMENTAL PROBLEMS
 UNEP GLOBAL JUDGES PROGRAMME APPLICATION OF ENVIRONMENTAL LAW BY NATIONAL COURTS AND TRIBUNALS PRESENTATION 2 MAJOR ENVIRONMENTAL PROBLEMS OUTLINE OF PRESENTATION A) Major environmental issues B) Responses
Fact sheet: The Kyoto Protocol
 Fact sheet: The Kyoto Protocol The Kyoto Protocol was adopted at the third Conference of the Parties to the UNFCCC (COP 3) in Kyoto, Japan, on 11 December 1997. The Protocol shares the objective and institutions
Business Policy of CEZ Group and ČEZ, a. s.
 Business Policy of CEZ Group and ČEZ, a. s. Contents: Introduction 1. CEZ Group mission and vision 2. Scope of business of CEZ Group 3. Business concept Guiding principles Trade Generation Electricity
ICT SOLUTIONS FOR A SMART LOW-CARBON FUTURE Supporting a solution agenda in Cancun
 ICT SOLUTIONS FOR A SMART LOW-CARBON FUTURE Supporting a solution agenda in Cancun This paper is a result of a public private dialogue in Guadalajara, Mexico, the 8-9th of November 2010, focusing on the
Intervention on behalf of Denmark, Norway and Ireland on the occasion of the Open Working Group on Sustainable Development Goals meeting on
 Intervention on behalf of Denmark, Norway and Ireland on the occasion of the Open Working Group on Sustainable Development Goals meeting on Sustainable Consumption and Production, including Chemicals and
How to Prepare a Good Proposal?
 How to Prepare a Good Proposal? Danmark, 11. juni 2015 Bent Jepsen, NEEMO-ELLE Facts of LIFE 1) There is significant competition for LIFE funds 2 Submission Trend 2007 2014 (Total) CLIMA proposals are
Administrator Lisa P. Jackson Environmental Protection Agency Ariel Rios Building 1200 Pennsylvania Avenue, N.W. Washington, DC 20460.
 Administrator Lisa P. Jackson Environmental Protection Agency Ariel Rios Building 1200 Pennsylvania Avenue, N.W. Washington, DC 20460 May 7, 2010 Re: Petition to Remove HFC-134a from the List of Acceptable
1. Transport challenges in subnational entities and related GHG emissions
 MOBILITY and TRANSPORTS CODATU and FRANCE NATURE ENVIRONNEMENT 1. Transport challenges in subnational entities and related GHG emissions Mobility for people as well as goods is at the heart of issues related
Major Economies Business Forum: Expectations for the Green Climate Fund
 Major Economies Business Forum: Expectations for the Green Climate Fund KEY MESSAGES To mobilize private investments at scale, financial support from the Green Climate Fund (GCF) should crowd-in private
NATIONAL ENERGY EFFICIENCY ACTION PLAN
 NATIONAL ENERGY EFFICIENCY ACTION PLAN Draft Final Report January 2014 FINAL DRAFT Table of Contents 1. Executive Summary... 4 2. Background... 8 2.1 The Institutional Setup and Regulatory Framework on
Capacity Building in the New Member States and Accession Countries on Further Climate Change Action Post-2012
 Capacity Building in the New Member States and Accession Countries on Further Climate Change Action Post-2012 (Service Contract N o 070402/2004/395810/MAR/C2) 29 November 2007 Almost all New Members States
The Development of Heat Pump Water Heaters Using CO 2 Refrigerant
 The Development of Heat Pump Heaters Using CO 2 Refrigerant Shigeharu TAIRA* * DAIKIN Industries, Ltd., 1000-2 Aza-Ohtani, Okamoto-cho, Kusatsu, Shiga 525-8526 Abstract heating consumes about one-third
Shipping, World Trade and the Reduction of
 Shipping, World Trade and the Reduction of United Nations Framework Convention on Climate Change International Maritime Organization International Chamber of Shipping COP 19 WARSAW UNFCCC Must Support
CARIBBEAN HOTEL ENERGY EFFICIENCY ACTION PROGRAM (CHENACT)
") CARIBBEAN HOTEL ENERGY EFFICIENCY ACTION PROGRAM (CHENACT) (RG-T1431) Terms of Reference Project Manager of the Technical Cooperation I. Background 1.1 Due to a lack of naturally available oil, one of
CARIBBEAN HOTEL ENERGY EFFICIENCY ACTION PROGRAM (CHENACT) (RG-T1431) Terms of Reference Project Manager of the Technical Cooperation I. Background 1.1 Due to a lack of naturally available oil, one of
How to implement renewable energy and energy efficiency options
 How to implement renewable energy and energy efficiency options Support for South African local government solar water heaters energy efficient lighting energy efficient buildings public transport How
REPUBLIC OF TURKEY INTENDED NATIONALLY DETERMINED CONTRIBUTION
 REPUBLIC OF TURKEY INTENDED NATIONALLY DETERMINED CONTRIBUTION In accordance with decisions 1/CP.19 and 1/CP.20, the Republic of Turkey hereby presents its Intended Nationally Determined Contribution (INDC)
Participatory Development Programme in Urban Areas (PDP) Project No. 10.2192.2-003.00. Job Vacancy Announcement for the position of
 Project No. 10.2192.2-003.00. Job Vacancy Announcement for the position of") The Deutsche Gesellschaft für Internationale Zusammenarbeit (GIZ) GmbH German Development Cooperation Participatory Development Programme in Urban Areas (PDP) Project No. 10.2192.2-003.00 Job Vacancy Announcement
The Deutsche Gesellschaft für Internationale Zusammenarbeit (GIZ) GmbH German Development Cooperation Participatory Development Programme in Urban Areas (PDP) Project No. 10.2192.2-003.00 Job Vacancy Announcement
International Refrigerant Standards and their Influence on the Global HVAC Industry and Refrigerant Replacement
 International Refrigerant Standards and their Influence on the Global HVAC Industry and Refrigerant Replacement Tom Watson, P.E. Fellow ASHRAE, Life Member President ASHRAE Issues Choosing a refrigerant
GREENHOUSE EFFECT & GLOBAL WARMING - The internet as the primary source of information
 GREENHOUSE EFFECT & GLOBAL WARMING - The internet as the primary source of information - The internet as a resource - Use reputable web sites Government agencies: EPA, NASA, DOE, etc Academic Institutions
Developments and trends shaping the future for Waste-to- Energy technology suppliers
 Developments and trends shaping the future for Waste-to- Energy technology suppliers 21 st October 2015 Copenhagen, Denmark Edmund Fleck ESWET President 2 Contents 1. About ESWET 2. Introduction 3. Modern