Analysis of Student Retention Rates and Performance Among Fall, 2013 Alternate College Option (ACO) Students
|
|
|
- Drusilla Paul
- 8 years ago
- Views:
Transcription
1 1 Analysis of Student Retention Rates and Performance Among Fall, 2013 Alternate College Option (ACO) Students A Study Commissioned by the Persistence Committee Policy Working Group prepared by Jeffrey T. Luftig, Ph.D. and distributed by The Office for Performance Improvement April, 2015

2 2 Table of Contents Purpose & Groups Analysis of Retention Rates Among ACO Students Analysis of Retention Rates ACO vs Non-ACO Students Analysis of Probation & Dismissal Rates ACO vs Non-ACO Students Analysis of Academic Performance ACO vs Non-ACO Students Analysis of Academic Performance Among ACO Groups.. 26 Analysis of Differences in cumulative GPA Variability. 32 Analysis of Differences in cumulative GPA Central Tendency.. 33 Summary of Results: Retention, Probation, and Academic Performance 39 Program and Major Transition Through Time 41 ACO Business Students.. 41 ACO Engineering Students Summary of Results: Student Transitions Through Time... 50

3 3 The purpose of this study was to respond to requests for analyses associated with the relative performance of students admitted to the College of Arts & Sciences (A & S) under the Alternate College Option (ACO). As defined by a 2006 report issued by Perry Sailor and the PBA, these are students who apply to the colleges of business, engineering, or architecture and planning, are not admitted to these colleges, but are offered (and accept) admission to arts and sciences. These students are known as ACOs, for alternate college option. They are typically less prepared academically than. students who are admitted to their chosen colleges. For this study, students in the Fall, 2013 cohort (not including transfer students) who were identified as ACO students were tracked for retention and scholastic performance through the beginning of the Spring, 2015 semester. It should be noted that, although all ACO students in A & S are included in the category of Open Option, there are many more Open Option (Undeclared Major on Entry) students than ACO students. Because there are significant differences among these two groups of students, a conscious decision was made to evaluate the retention and performance of ACO students as a singular group; that is, not combined with other Open Option students. A second study and report will present the results of retention rate and scholastic performance among Open Option students in A & S, excluding ACO students. The data related to students identified as ACO students, and their program affiliation, was provided by Academic Advising Center (AAC) staff, and merged with the Fall 2013 cohort student demographic, retention, and performance data as provided by the CU Boulder Institutional Research (IR) group. For the Fall, 2013 cohort, the ACO students represented 15.9% of the entire cohort, and 23% of the Fall 2013 A & S cohort (not including Open Option / Undeclared Major students):
 admission to arts and sciences. These students are known as ACOs, for alternate college option. They are typically less prepared academically than.")
4 4 Within the ACO Group, the distribution of ACO students appeared as shown in the table and bar graph below: Because the subgroup size for the ACO Music group was so small, subsequent analyses related to retention and performance differences among the ACO student groups omitted the ACO-Music students as a subgroup.

5 5 Analysis of Retention Rates Among ACO Students The cumulative retention rates for the entire Fall, 2013 cohort in all schools and colleges for the first two academic years appeared as shown in the three tables which follow, on the left. The same data, for only A & S, appears in the tables to the right.

6 6 As shown by these tables, A & S retention rates were lower in each of the three semesters following the Fall 2013 semester; additionally, the difference between the overall campus rate and A & S rates increased with each semester through time. These same data can also be evaluated on a semester-by-semester basis; that is, without calculating the cumulative loss in students. These data for the entire campus (to the left) and for only A & S (to the right) follow. Note that the first semester Spring 2014 is not shown because it is unchanged.
 and for only A & S (to the right) follow.")
7 7 Having established that the retention rates for the Fall 2013 cohort in A & S are greater than for the students in the other schools and college on campus (taken on the whole), the next step was to assess the degree of influence that: 1) ACO student retention rates had on the cumulative retention rates recorded for A & S; and to determine 2) Whether significant differences exist in cumulative retention rates among the three ACO groups evaluated. As with many of the analyses we perform for cohort data, there is an issue of whether statistical significance and associated statistical tests of significance can be applied to these data. Classical statistical theory dictates that inferential statistical tests be conducted on data that represent a random sample or subgroup of the research population of interest. Clearly, we are utilizing the entire cohort (N rather than n) for these analyses, so these data cannot be argued to represent a random sample in time. However, many researchers would argue that the cohort, even taken in its entirety, might be interpreted as representing a random sample of cohorts through time (N Tx); and that given this interpretation, inferential statistics may be applied. If the reader is determined to employ the former interpretation, then any observed difference in the descriptive statistics represents a true difference (although it still may not be an important difference; practically speaking). If the reader interprets the data utilizing the latter interpretation of random sampling theory, then the tests of significance presented can assist in determining whether the observed differences are indeed consequential; or simply due to sampling error (chance).

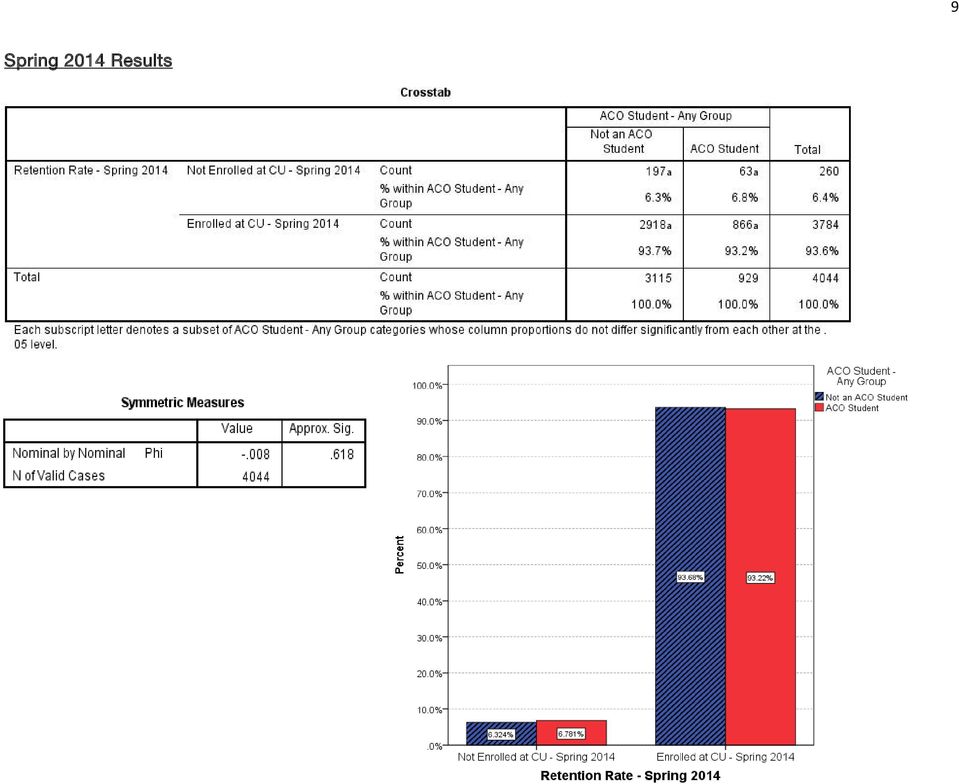
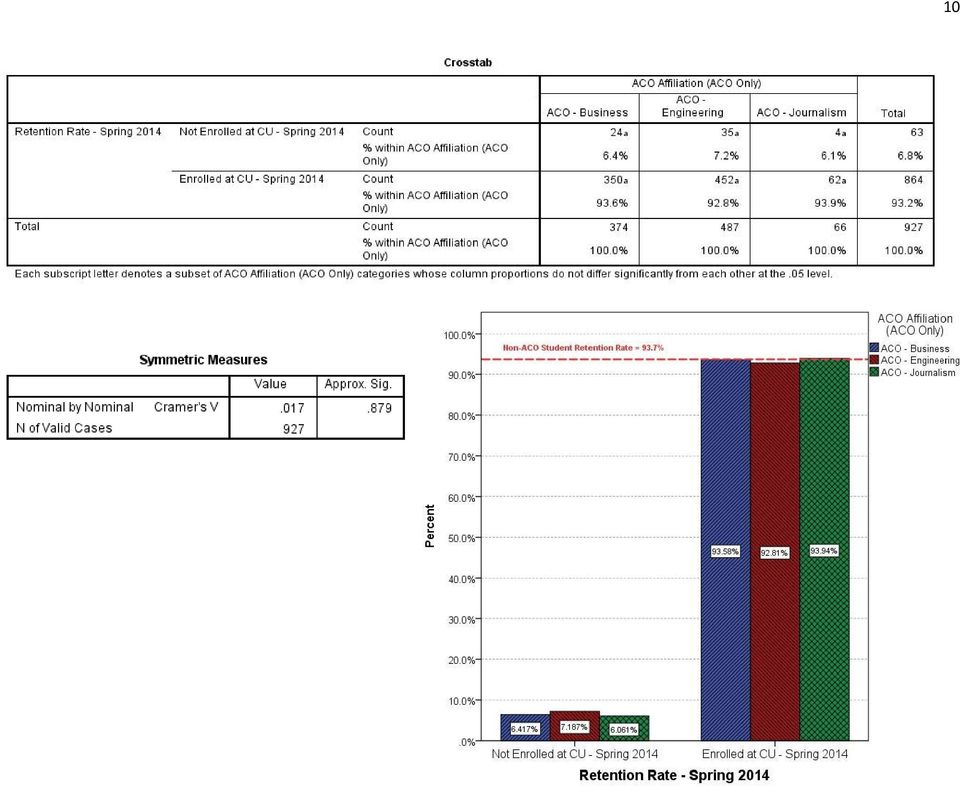
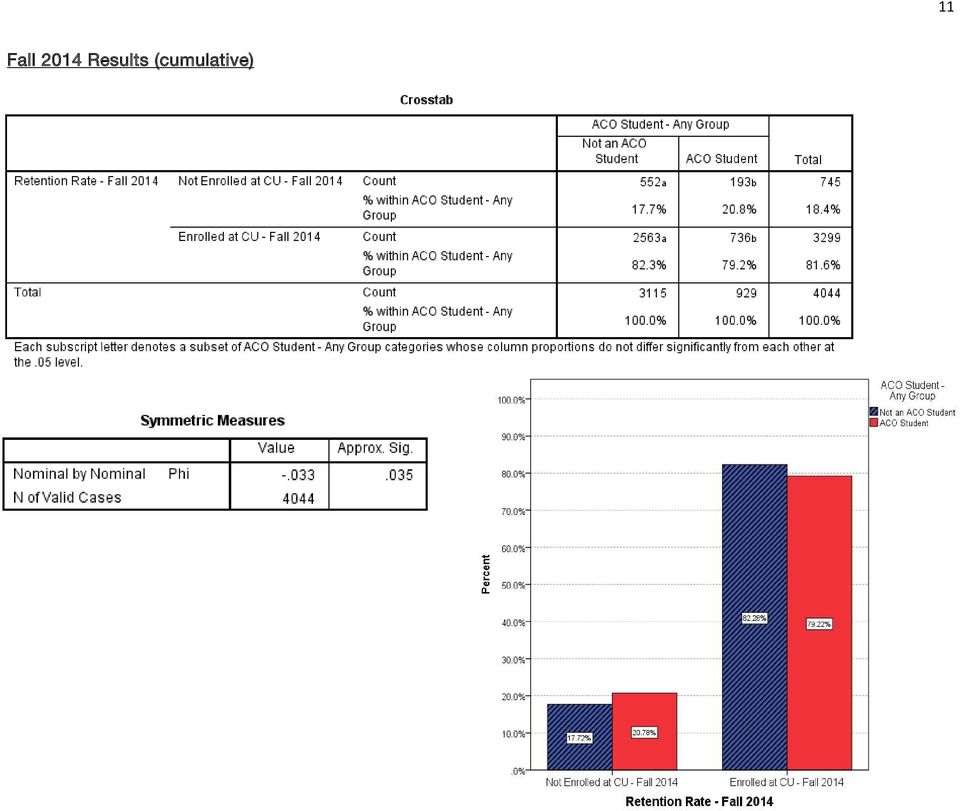
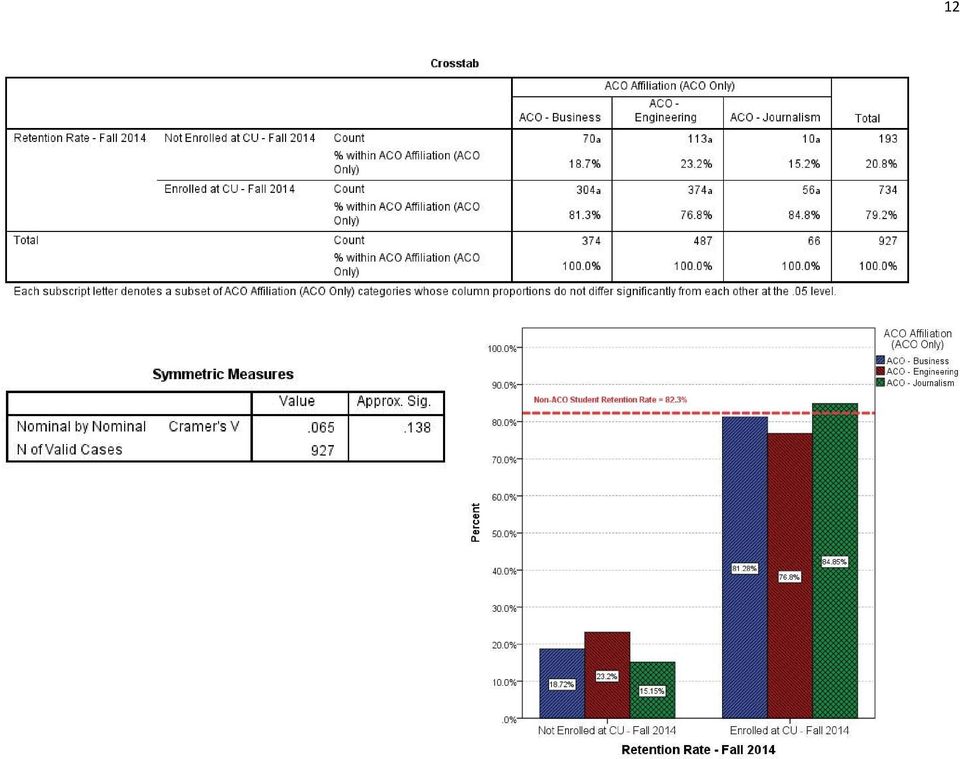
8 8 Analysis of Retention Rate Differences: ACO Students versus All Other Students in A & S The three analyses which follow reflect the cumulative retention rate differences between all ACO students and all other students in A & S, and the differences between the three categories of ACO students in the Fall 2013 cohort. As shown by these results, no significant differences are present in the first semester retention rate (Spring 2014) between ACO and Non-ACO students; or within the ACO student groups. However, significant differences are observed starting with the cumulative retention rates for the Fall 2014 semester; although not from ACO group-to-group. Differences observed in retention rates increase for the cumulative retention rate differences by Spring, 2015; and approach statistical significance when comparing the individual ACO group results. All analyses which follow include only students admitted to A & S in the Fall 2013 cohort as ACO students; as Open Option students, or as students with a declared major in A & S.

9 Spring 2014 Results 9
10 10
11 Fall 2014 Results (cumulative) 11
12 12
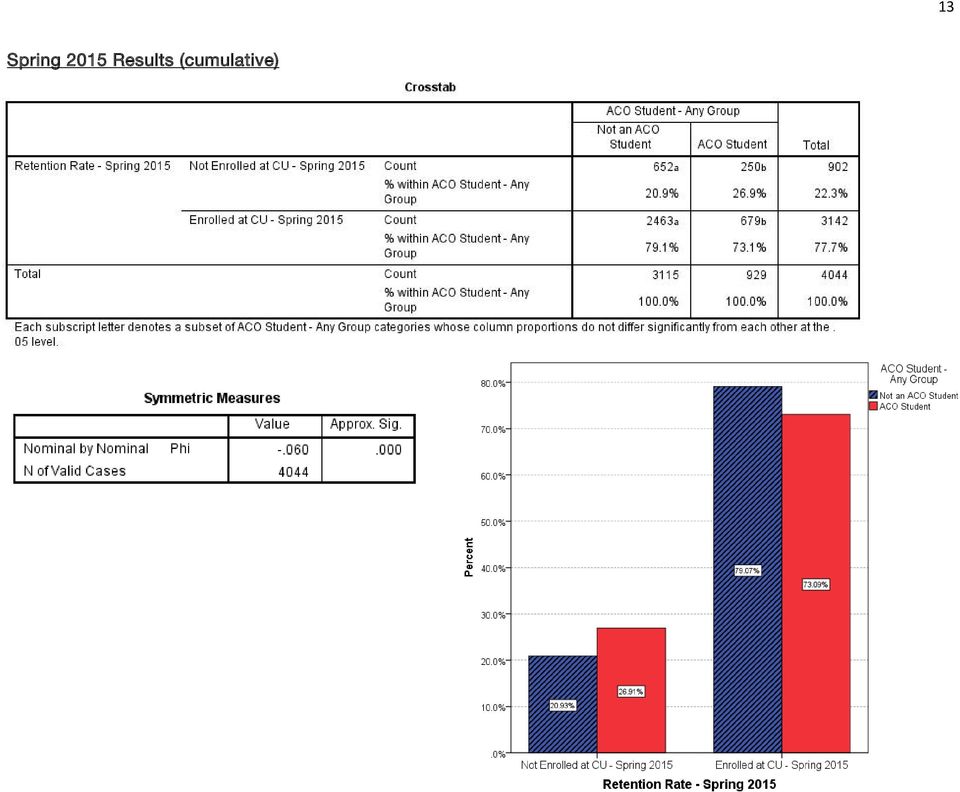
13 Spring 2015 Results (cumulative) 13
14 14

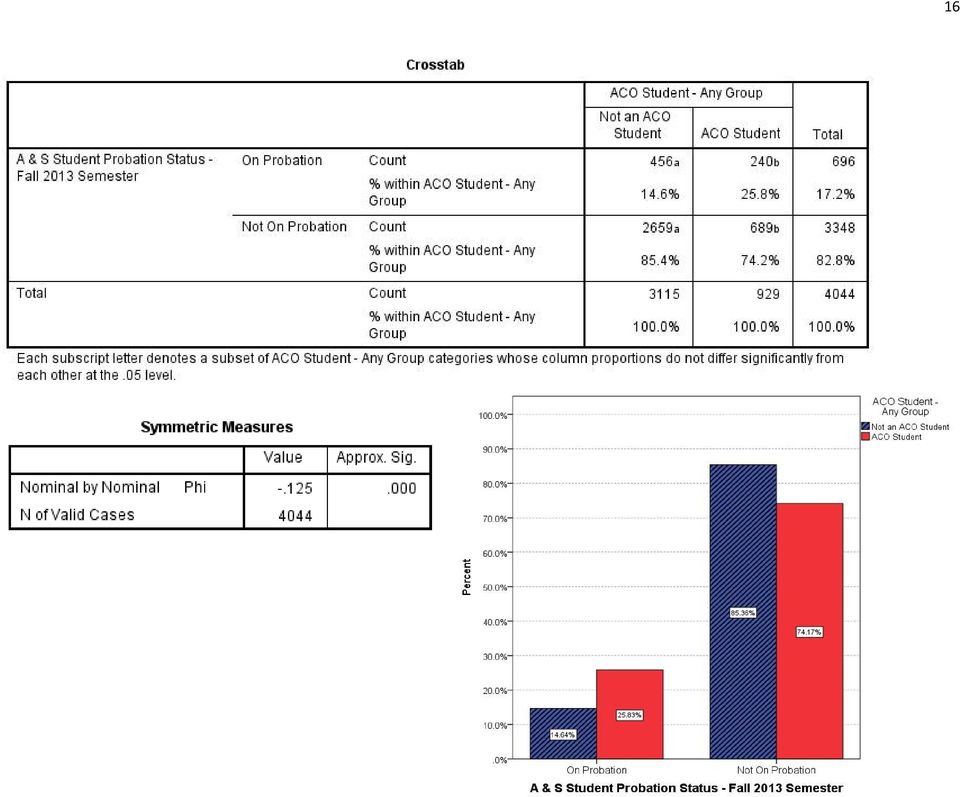
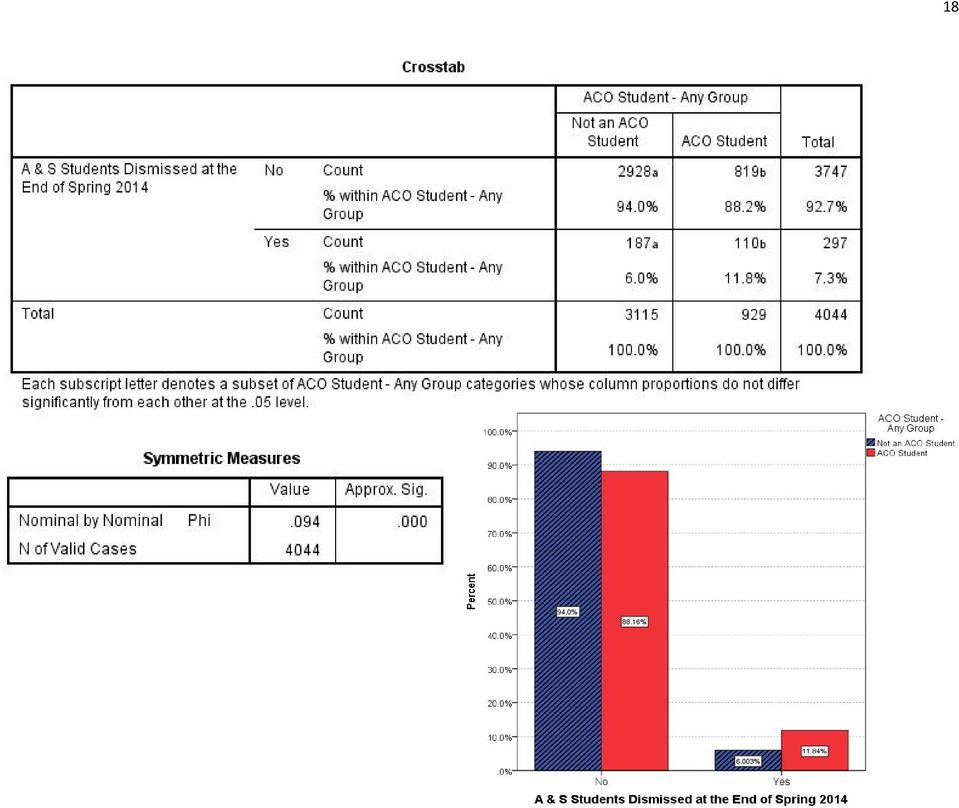
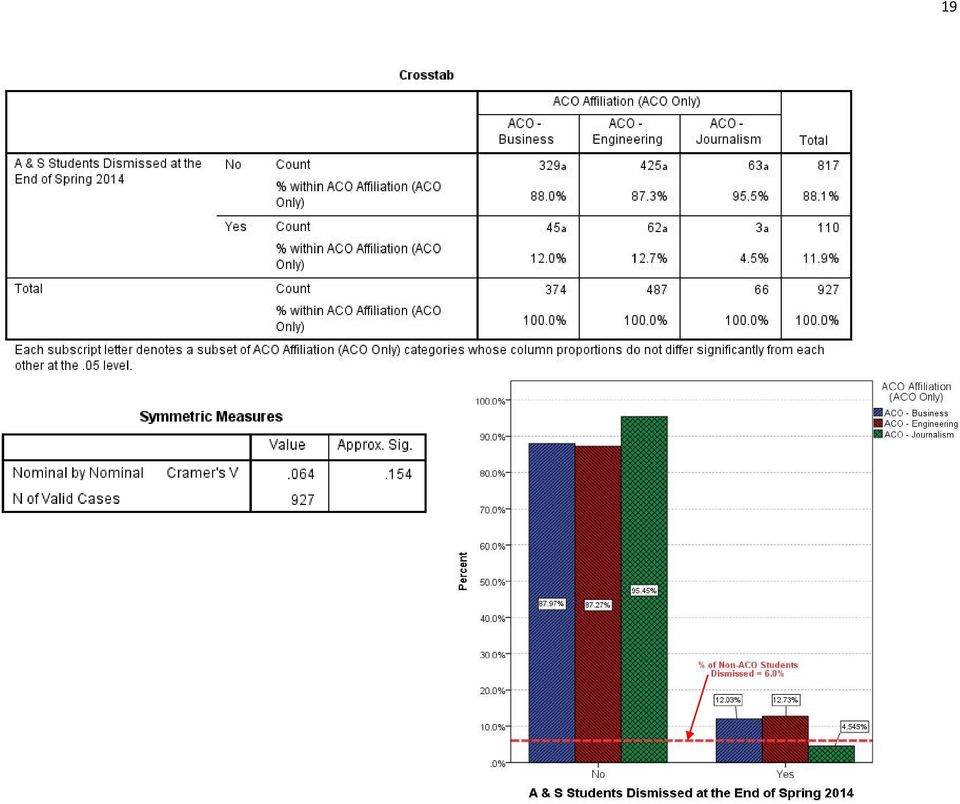
15 15 Analysis of Probation and Dismissal Rate Differences: ACO Students versus All Other Students in A & S The analyses which follow reflect: 1) the first semester probation rate differences between all ACO students and all other students in A & S, and the differences between the three categories of ACO students in the Fall 2013 cohort; and 2) the second semester academic dismissal rate differences between all ACO students and all other students in A & S, and the differences between the three categories of ACO students in the Fall 2013 cohort. As shown by these results, there are statistically significant differences in the first semester probation rate (Fall 2013) and second semester (Spring 2015) academic dismissal rate between ACO and Non-ACO students. Significant differences between the ACO groups are observed for first semester probation rates ( at α = 0.10). For second semester dismissal rates, meaningful differences between the groups are observed; although at the subgroup sizes available, not statistically significant at α = 0.10 ( p = 0.154).
 and second semester (Spring 2015) academic dismissal rate between ACO and")
16 16
17 17

18 18
19 19
20 20 Analysis of Differences in Student Academic Performance: ACO Students versus All Other Students in A & S The next step in assessing the differences in performance between ACO students and A & S students who were not ACO students was to evaluate differences in academic performance as measured by cumulative GPA indices at the end of each of the first 3 semesters available: Fall, 2013, Spring, 2014, and Fall, 2014 (Spring, 2015 results were not available at the time this report was prepared. Two primary comparisons were of interest and requested: 1) Is there a significant difference between ACO student performance and non-aco student performance in A & S? 2) Is there a significant difference in student performance among the three primary ACO student groups? The cumulative GPAs for the groups of students evaluated appeared as follows for the semesters of interest:
 Is there a significant difference between ACO student performance and non-aco student performance in A & S?")
21 21
22 The recorded data may also be viewed for differences in central tendency and variability using Box-and-Whisker plots: 22
23 23 The first step in comparing the two groups is to test for the normality of the two data sets. This is necessary as tests for independent variances are not robust from departure from normality. As expected, the cumulative GPAs for the six groups were uniformly non-normal (cumulative GPAs are almost always found to be negatively skewed and are often not mesokurtic). Fall, 2013 cumulative GPAs ACO_NonACO n Skewness p-value Kurtosis p-value A & S Not ACO 3, * <.02* ACO Student * >.10 Spring, 2014 cumulative GPAs ACO_NonACO n Skewness p-value Kurtosis p-value A & S Not ACO 2, * <.02* ACO Student * * Fall, 2014 cumulative GPAs ACO_NonACO n Skewness p-value Kurtosis p-value A & S Not ACO 2, * <.02* ACO Student * <.02* As a result, Levene s Improved test approach for differences in variability (versus variance) was selected for comparison purposes. This approach conducts a t-test on the mean differences in the Absolute Deviation from Medians for the three pairs of cumulative GPA data.
24 As illustrated by the results above, the variability of cumulative GPA values for the Fall 2013 and Spring 2014 semesters for ACO and non-aco students are equal; statistically speaking. For the Fall, 2014 semester, the variability of the cumulative GPAs for the non-aco students is statistically significantly greater than for the ACO students (all groups combined). 24
25 25 Moving on to the comparison of differences in the average cumulative GPAs for the two groups, within each of the three semesters, we employ the exact (Fisher) t-test for the means for the first two semesters (the exact t-test is robust to departure from normality when sample or subgroups sizes are large), and the approximate t-test for the Fall 2014 semester given the unequal variability observed for the two groups (the exact t-test is not robust from departure from homogeneity of variability when sample sizes are unequal). As shown by the results of the three t-tests, the mean cumulative GPA values recorded by non-aco students were statistically significantly higher than for the ACO students in every one of the three semesters. Additionally, the importance (statistical) of the differences increases with each subsequent semester. The ω 2 values for the differences observed each semester are 4.2%, 5.7%, and 6.0%; respectively.
26 26 Analysis of Differences in Student Academic Performance: Variability Among ACO Student Groups Having established that Non-ACO students perform, academically-speaking, at a superior level than ACO students taken as a single group, the next step in the analysis was to evaluate whether differences existed in performance among the three ACO groups (Business, Engineering, and Journalism). The cumulative GPA indices recorded for students in the three groups for the Fall 2013 semester appeared as follows (the Non-ACO Student results are provided for comparison purposes).
27 27
28 The descriptive statistics for the Spring 2014 and Fall 2014 semesters for the three ACO groups were generated as well, and are presented in the summary table below. Again, the Non-ACO student results are presented for comparative purposes. 28
29 29
30 30
31 31 The same general sequence as was employed and previously illustrated for the two group comparisons was repeated in order to conduct statistical comparisons for the three ACO groups. Testing for the normality of the three populations represented by the ACO subgroups yielded similar results as expected; specifically, that we have sufficient statistical evidence to reject the hypothesis of normality for the cumulative GPA distributions. ACO_Group n Skewness p-value Kurtosis p-value ACO - Business * >.10 ACO Engineering * >.10 ACO - Journalism * * As a result, we employ Levene s Improved test using Absolute Deviations from subgroup Medians (ADMs) to test the comparative variability among the three groups; within each of the three semesters. Instead of a t-test, however, we use Welch s Oneway ANOVA rather than the standard (Fisher) Oneway ANOVA (Fisher s ANOVA is not robust from departure from homogeneity of variability when sample sizes are unequal, and the conservative approach here is to use Welch s ANOVA). If significant differences are identified, the Games-Howell post-hoc tests are applied (unequal variance alternatives to the Tukey tests). For the means analysis, if unequal variability is found in the group comparisons, then Welch s ANOVA is employed, followed by Games-Howell post hoc analyses if necessary`. If the variability among the three goups was inferred to be equal, Fisher s ANOVA was employed for the comparison of the three groups, followed by Tukey tests for post-hoc analyses if required. In order to reduce the probability of a Type II Error ( β ), the Type I Error level was established at α = 0.10.
32 32 Tests for Differences in Variability As shown by these data, the variability of cumulative GPAs varied only for the Spring 2014 semester, with all three groups reflecting a difference in variability. As a reminder, the three standard deviation (s) values for the ACO groups were s Engrg = 0.800; s Bus = 0.704; and s Jour = When comparing the Non-ACO student variability (s Non-ACO = 0.75) in this semester to the three ACO groups, the variability of the Non-ACO student cumulative GPAs was equal to Engineering and Business, and significantly greater than for Journalism (p = 0.008).
33 33 Tests for Differences in Central Tendency (Mean cumulative GPAs) The line graphs which follow reflect the mean (average) cumulative GPAs for the three ACO student groups for each of the three semesters evaluated. Results for A & S students who were not in any of the ACO groups are presented for comparison purposes.
34 34
35 35
36 36 Comparing the three ACO groups only, the results of the analysis reflected no statistically significant difference in the mean cumulative GPAs for the Fall 2013 or Fall 2014 semesters: Given these results, there were no post-hoc analyses justified. On the other hand, when comparing the mean cumulative GPAs for the three ACO groups at the end of the Spring, 2014 semester, statistically significant effects were indeed identified (although due to the relatively high variability associated with the cumulative GPA values, the importance of the mean differences is relatively low, with ω 2 1%):
37 37 Following this Oneway ANOVA with Games-Howell post-hoc tests to identify the source(s) of the variability resulted in the following outcomes: indicating that on a statistical versus observational basis the mean cumulative GPAs in the Spring 2014 semester (i.e. after the first academic year) were equivalent for the ACO Engineering and ACO Business groups; both of which were significantly less (statistically) than for the ACO Journalism group. Of course, when adding the Non-ACO groups to the three semester analyses, all of the ANOVAs reflected significant differences in the mean cumulative GPAs recorded:
38 Utilizing a combination of Tukey and Games-Howell post-hoc tests where each are appropriate, the mean cumulative GPAs in every one of the three semesters are statistically significantly higher for Non-ACO students than for ACO students in any of the three groups: 38
39 39 Summary of Results: Retention, Probation, and Academic Performance Fall 2013 Cohort - Retention rates for all students in the College of Arts & Sciences tend to be lower than for the entire campus, with all schools and colleges combined; - For the first three semesters of their academic experience, retention rates for ACO students in any group were lower than for Non-ACO students in the College of Arts and Sciences, with sequential differences of 0.5%, 3.1%, and 6%, respectively; - Beginning in the Fall 2014, meaningful and statistically significant differences in cumulative retention rates among the ACO Business, ACO Engineering, and ACO Journalism groups become apparent, with: o Journalism (84.8%) > Business (81.3%) > Engineering (76.8%) for Fall 2014, versus a Non-ACO retention rate of 82.3% for the same period; and o Journalism (81.8%) > Business (74.6%) > Engineering (70.8%) for Fall 2014, versus a Non-ACO retention rate of 79.1% for the same period; - First semester (Fall 2013) Probation Rates for ACO students (25.8%) as a singular group were significantly higher than for Non-ACO students (14.6%) in the College of Arts & Sciences; - First semester probation rates between the three ACO groups were all higher than for the Non-ACO students (14.6%), with ACO Business (29.1%) > ACO Engineering (24.64%) > ACO Journalism (16.67%); - Second semester (Spring 2014) academic dismissal rates for ACO students as a singular group (11.8%) were significantly higher than for Non-ACO students (6.0%); - Second semester academic dismissal rates for the ACO Enginnering and ACO Business groups (12.7% and 12.0%, respectively) were significantly higher than for Non-ACO students (6.0%), which was higher than for the ACO Journalism students (4.5%); - Clearly, ACO Engineering and ACO Business student performance in the context of retention, probation, and dismissal rates negatively impact the overall indices for the College of Arts & Sciences, and uniformly so; - Non-ACO students, as compared to the ACO students evaluated as a single group, performed at a superior level of academic performance, as measured by cumulative GPAs in each of the first three semesters, recording mean GPA differences of 0.43, 0.44, and 0.39, respectively;
40 - Observationally, mean cumulative GPAs for the ACO Business and ACO Engineering students were always lower than for the ACO Journalism students, at a statistically significant difference, at the end of the second semester (Spring 2014); finally - Even as compared to the highest of the mean cumulative GPAs recorded by any of the ACO groups (Journalism), Non-ACO students uniformly performed at a significantly higher level than ACO students. 40
41 41 Program and Major Transition Through Time: ACO - Business and ACO Engineering Students Fall 2013 Cohort The final request for analysis as associated with this study was to determine the transitional pattern for students admitted to A & S as ACO students within their first two years at CU Boulder. For this analysis, only the ACO Business and ACO Engineering students were evaluated, as ACO Journalism students no longer exist as an option, so understanding their transitional pattern would provide little useful information insofar as future decisions are concerned. ACO - Business Tracking the 374 students who were admitted to the ACO Business group in the Fall 2013 cohort revealed the following results:
42 As shown by these data, once ACO Business students transitioned to a program outside of A & S, they tended to remain in that school or college. The summary results illustrating the status of the 374 ACO Business students after their first two academic years at CU Boulder are reflected by the bar graph below. 42
43 43 As shown by these summary results, only 11% of the ACO Business students were registered in the Leeds School of Business by Spring 2015; which is less than half the percentage of students from this group who are no longer attending the University (27.8%). For those students still registered in A & S, the distribution of declared / undeclared majors appears as follows:
44 Focusing on the majors that accounted for 2% or more of the students in those categories: 44
45 45 ACO - Engineering Tracking the 487 students who were admitted to the ACO Engineering group in the Fall 2013 cohort revealed the following results:
46 46
47 47 One of the significant differences in the transition patterns of the ACO Engineering group as compared to the ACO Business group is that after transitioning to other schools or colleges, there was more movement by the students; either to different programs, or leaving CU Boulder. The final tally for the current status of the ACO Engineering group after the first two years of their academic career is reflected on the bar chart which follows.
48 48 As compared to the ACO Business group, a higher percentage of ACO Enginnering students are currently enrolled in the CEAS (17.9%) versus the 11% previously identified. On the other hand, a higher percentage of ACO Engineering students have left CU (30.6%) than left from the ACO Business group (27.8%). For those ACO Engineering students still enrolled in A & S for the Spring 2015 semester, the distribution of majors is illustrated on the following bar graph:
49 Focusing on the majors that accounted for 2% or more of the students in those categories: 49
50 50 Summary of Results Program and Major Transition Through Time: ACO - Business and ACO Engineering Students Fall 2013 Cohort - Only 11% of the ACO Business students were registered in the LSB by the beginning of the Spring 2015 semester; % of the ACO Business students had left CU Boulder by the beginning of the Spring 2015 semester; - The most frequently selected majors in the College of A & S for ACO Business students who did not transfer into other schools or colleges were, in order of preference, Communication, Economics, International Affairs, and Psychology; - Only 17.9% of the ACO Engineering students were registered in the CEAS by the beginning of the Spring 2015 semester; % of the ACO Engineering students had left CU Boulder by the beginning of the Spring 2015 semester; and - The most frequently selected majors in the College of A & S for ACO Engineering students who did not transfer into other schools or colleges were, in order of preference, Computer Science, Integrative Psychology, and Environmental Studies.
Research Report No. 2005-5 Nancy K. Scammacca and Barbara G. Dodd
 Research Report No. 2005-5 An Investigation of Educational Outcomes for Students Who Earn College Credit Through the College-Level Examination Program Nancy K. Scammacca and Barbara G. Dodd www.collegeboard.com
How To Check For Differences In The One Way Anova
 MINITAB ASSISTANT WHITE PAPER This paper explains the research conducted by Minitab statisticians to develop the methods and data checks used in the Assistant in Minitab 17 Statistical Software. One-Way
Reporting Statistics in Psychology
 This document contains general guidelines for the reporting of statistics in psychology research. The details of statistical reporting vary slightly among different areas of science and also among different
UNDERSTANDING THE TWO-WAY ANOVA
 UNDERSTANDING THE e have seen how the one-way ANOVA can be used to compare two or more sample means in studies involving a single independent variable. This can be extended to two independent variables
INTERPRETING THE ONE-WAY ANALYSIS OF VARIANCE (ANOVA)
") INTERPRETING THE ONE-WAY ANALYSIS OF VARIANCE (ANOVA) As with other parametric statistics, we begin the one-way ANOVA with a test of the underlying assumptions. Our first assumption is the assumption of
INTERPRETING THE ONE-WAY ANALYSIS OF VARIANCE (ANOVA) As with other parametric statistics, we begin the one-way ANOVA with a test of the underlying assumptions. Our first assumption is the assumption of
MEASURES OF LOCATION AND SPREAD
 Paper TU04 An Overview of Non-parametric Tests in SAS : When, Why, and How Paul A. Pappas and Venita DePuy Durham, North Carolina, USA ABSTRACT Most commonly used statistical procedures are based on the
Examining Differences (Comparing Groups) using SPSS Inferential statistics (Part I) Dwayne Devonish
 using SPSS Inferential statistics (Part I) Dwayne Devonish") Examining Differences (Comparing Groups) using SPSS Inferential statistics (Part I) Dwayne Devonish Statistics Statistics are quantitative methods of describing, analysing, and drawing inferences (conclusions)
Examining Differences (Comparing Groups) using SPSS Inferential statistics (Part I) Dwayne Devonish Statistics Statistics are quantitative methods of describing, analysing, and drawing inferences (conclusions)
Unit 31: One-Way ANOVA
 Unit 31: One-Way ANOVA Summary of Video A vase filled with coins takes center stage as the video begins. Students will be taking part in an experiment organized by psychology professor John Kelly in which
A COMPARISON OF POST-SECONDARY OUTCOMES FOR TECH PREP AND NON-TECH PREP STUDENTS AT SINCLAIR COMMUNITY COLLEGE. October, 2007
 A COMPARISON OF POST-SECONDARY OUTCOMES FOR TECH PREP AND NON-TECH PREP STUDENTS AT SINCLAIR COMMUNITY COLLEGE October, 2007 Office of Research, Analytics and Reporting Sinclair Community College, 444
Description. Textbook. Grading. Objective
 EC151.02 Statistics for Business and Economics (MWF 8:00-8:50) Instructor: Chiu Yu Ko Office: 462D, 21 Campenalla Way Phone: 2-6093 Email: kocb@bc.edu Office Hours: by appointment Description This course
Introduction to Quantitative Methods
 Introduction to Quantitative Methods October 15, 2009 Contents 1 Definition of Key Terms 2 2 Descriptive Statistics 3 2.1 Frequency Tables......................... 4 2.2 Measures of Central Tendencies.................
KSTAT MINI-MANUAL. Decision Sciences 434 Kellogg Graduate School of Management
 KSTAT MINI-MANUAL Decision Sciences 434 Kellogg Graduate School of Management Kstat is a set of macros added to Excel and it will enable you to do the statistics required for this course very easily. To
Online versus Traditional Learning: A Comparison Study of Colorado Community College Science Classes
 Online versus Traditional Learning: A Comparison Study of Colorado Community College Science Classes Introduction Students are currently given more and more options in postsecondary education be it the
Tutorial 5: Hypothesis Testing
 Tutorial 5: Hypothesis Testing Rob Nicholls nicholls@mrc-lmb.cam.ac.uk MRC LMB Statistics Course 2014 Contents 1 Introduction................................ 1 2 Testing distributional assumptions....................
 There are three kinds of people in the world those who are good at math and those who are not. PSY 511: Advanced Statistics for Psychological and Behavioral Research 1 Positive Views The record of a month
When reviewing the literature on
 Erik Cooper Tutoring Center Effectiveness: The Effect of Drop-In Tutoring While tutoring as a whole has been demonstrated to improve student learning across a variety of subjects and age groups, there
The Statistics Tutor s Quick Guide to
 statstutor community project encouraging academics to share statistics support resources All stcp resources are released under a Creative Commons licence The Statistics Tutor s Quick Guide to Stcp-marshallowen-7
Each copy of any part of a JSTOR transmission must contain the same copyright notice that appears on the screen or printed page of such transmission.
 Robust Tests for the Equality of Variances Author(s): Morton B. Brown and Alan B. Forsythe Source: Journal of the American Statistical Association, Vol. 69, No. 346 (Jun., 1974), pp. 364-367 Published
Co-Curricular Activities and Academic Performance -A Study of the Student Leadership Initiative Programs. Office of Institutional Research
 Co-Curricular Activities and Academic Performance -A Study of the Student Leadership Initiative Programs Office of Institutional Research July 2014 Introduction The Leadership Initiative (LI) is a certificate
Descriptive Statistics
 Descriptive Statistics Primer Descriptive statistics Central tendency Variation Relative position Relationships Calculating descriptive statistics Descriptive Statistics Purpose to describe or summarize
Analysis of Variance. MINITAB User s Guide 2 3-1
 3 Analysis of Variance Analysis of Variance Overview, 3-2 One-Way Analysis of Variance, 3-5 Two-Way Analysis of Variance, 3-11 Analysis of Means, 3-13 Overview of Balanced ANOVA and GLM, 3-18 Balanced
Analysis of Variance (ANOVA) Using Minitab
 Using Minitab") Analysis of Variance (ANOVA) Using Minitab By Keith M. Bower, M.S., Technical Training Specialist, Minitab Inc. Frequently, scientists are concerned with detecting differences in means (averages) between
Analysis of Variance (ANOVA) Using Minitab By Keith M. Bower, M.S., Technical Training Specialist, Minitab Inc. Frequently, scientists are concerned with detecting differences in means (averages) between
Descriptive Statistics. Purpose of descriptive statistics Frequency distributions Measures of central tendency Measures of dispersion
 Descriptive Statistics Purpose of descriptive statistics Frequency distributions Measures of central tendency Measures of dispersion Statistics as a Tool for LIS Research Importance of statistics in research
Chapter 7. One-way ANOVA
 Chapter 7 One-way ANOVA One-way ANOVA examines equality of population means for a quantitative outcome and a single categorical explanatory variable with any number of levels. The t-test of Chapter 6 looks
NEW YORK CITY COLLEGE OF TECHNOLOGY The City University of New York
 NEW YORK CITY COLLEGE OF TECHNOLOGY The City University of New York DEPARTMENT: Mathematics COURSE: MAT 1272/ MA 272 TITLE: DESCRIPTION: TEXT: Statistics An introduction to statistical methods and statistical
Evaluation of Fall 1999 Online Classes
 G Evaluation of Fall 1999 Online Classes Andreea Serban, Ph.D. Director Institutional Assessment, Research and Planning March 2000 Table of Contents Executive Summary...2 Introduction...5 Research Design
Statistics Review PSY379
 Statistics Review PSY379 Basic concepts Measurement scales Populations vs. samples Continuous vs. discrete variable Independent vs. dependent variable Descriptive vs. inferential stats Common analyses
Data Analysis, Research Study Design and the IRB
 Minding the p-values p and Quartiles: Data Analysis, Research Study Design and the IRB Don Allensworth-Davies, MSc Research Manager, Data Coordinating Center Boston University School of Public Health IRB
Quantitative Methods for Finance
 Quantitative Methods for Finance Module 1: The Time Value of Money 1 Learning how to interpret interest rates as required rates of return, discount rates, or opportunity costs. 2 Learning how to explain
business statistics using Excel OXFORD UNIVERSITY PRESS Glyn Davis & Branko Pecar
 business statistics using Excel Glyn Davis & Branko Pecar OXFORD UNIVERSITY PRESS Detailed contents Introduction to Microsoft Excel 2003 Overview Learning Objectives 1.1 Introduction to Microsoft Excel
Nonparametric Two-Sample Tests. Nonparametric Tests. Sign Test
 Nonparametric Two-Sample Tests Sign test Mann-Whitney U-test (a.k.a. Wilcoxon two-sample test) Kolmogorov-Smirnov Test Wilcoxon Signed-Rank Test Tukey-Duckworth Test 1 Nonparametric Tests Recall, nonparametric
Cooperative and Concurrent Enrollment and College Retention. Regina Foster Oklahoma State University Institute of Technology ABSTRACT
 Cooperative and Concurrent Enrollment and College Retention Regina Foster Oklahoma State University Institute of Technology ABSTRACT Oklahoma has a unique system of high schools, technology centers and
UNDERSTANDING THE INDEPENDENT-SAMPLES t TEST
 UNDERSTANDING The independent-samples t test evaluates the difference between the means of two independent or unrelated groups. That is, we evaluate whether the means for two independent groups are significantly
How To Get A Degree At Famu
 Florida A&M University Graduate Policies and Procedures Each graduate program has a different mission, and some programs may have requirements additional to or different from those in the Graduate School.
LAB 4 INSTRUCTIONS CONFIDENCE INTERVALS AND HYPOTHESIS TESTING
 LAB 4 INSTRUCTIONS CONFIDENCE INTERVALS AND HYPOTHESIS TESTING In this lab you will explore the concept of a confidence interval and hypothesis testing through a simulation problem in engineering setting.
Learning Equity between Online and On-Site Mathematics Courses
 Learning Equity between Online and On-Site Mathematics Courses Sherry J. Jones Professor Department of Business Glenville State College Glenville, WV 26351 USA sherry.jones@glenville.edu Vena M. Long Professor
Robust t Tests. James H. Steiger. Department of Psychology and Human Development Vanderbilt University
 Robust t Tests James H. Steiger Department of Psychology and Human Development Vanderbilt University James H. Steiger (Vanderbilt University) 1 / 29 Robust t Tests 1 Introduction 2 Effect of Violations
A Comparison of Textbook Prices between Richland s Bookstore and Online Textbook Stores
 A Comparison of Textbook Prices between Richland s Bookstore and Online Textbook Stores Summer 2000 A Project of Math 113 Introduction to Applied Statistics James D Jones Associate Professor of Mathematics
SPSS Tests for Versions 9 to 13
 SPSS Tests for Versions 9 to 13 Chapter 2 Descriptive Statistic (including median) Choose Analyze Descriptive statistics Frequencies... Click on variable(s) then press to move to into Variable(s): list
SAUDI SCHOOL ASSESSMENT SYSTEM FOR PREDICTING ADMISSIONS TO SCIENCE COLLEGES
 SAUDI SCHOOL ASSESSMENT SYSTEM FOR PREDICTING ADMISSIONS TO SCIENCE COLLEGES 1 Khalid Alnowibet, 2 Shafiq Ahmad 1 Department of Statistics and Operations Research, College of Science, King Saud University,
The Influence of a Summer Bridge Program on College Adjustment and Success: The Importance of Early Intervention and Creating a Sense of Community
 The Influence of a Summer Bridge Program on College Adjustment and Success: The Importance of Early Intervention and Creating a Sense of Community Michele J. Hansen, Ph.D., Director of Assessment, University
Summary of Proposed Changes to the Graduate Academic Regulations
 Summary of Proposed Changes to the Graduate Academic Regulations Below is a summary of the significant structural and policy changes in the update of the Graduate Academic Regulations (in effect in Fall
DATA ANALYSIS. QEM Network HBCU-UP Fundamentals of Education Research Workshop Gerunda B. Hughes, Ph.D. Howard University
 DATA ANALYSIS QEM Network HBCU-UP Fundamentals of Education Research Workshop Gerunda B. Hughes, Ph.D. Howard University Quantitative Research What is Statistics? Statistics (as a subject) is the science
Chapter 7 Section 7.1: Inference for the Mean of a Population
 Chapter 7 Section 7.1: Inference for the Mean of a Population Now let s look at a similar situation Take an SRS of size n Normal Population : N(, ). Both and are unknown parameters. Unlike what we used
Introduction to Statistics with GraphPad Prism (5.01) Version 1.1
 Version 1.1") Babraham Bioinformatics Introduction to Statistics with GraphPad Prism (5.01) Version 1.1 Introduction to Statistics with GraphPad Prism 2 Licence This manual is 2010-11, Anne Segonds-Pichon. This manual
Babraham Bioinformatics Introduction to Statistics with GraphPad Prism (5.01) Version 1.1 Introduction to Statistics with GraphPad Prism 2 Licence This manual is 2010-11, Anne Segonds-Pichon. This manual
Please review current Graduate College policies and procedures.
 Ph.D. Degree Requirements and Procedures Summary of Procedures for Ph.D. Students Complete every deficiency course with a grade of B or higher within the first two terms File an approved tentative program
SAMPLING & INFERENTIAL STATISTICS. Sampling is necessary to make inferences about a population.
 SAMPLING & INFERENTIAL STATISTICS Sampling is necessary to make inferences about a population. SAMPLING The group that you observe or collect data from is the sample. The group that you make generalizations
Data analysis process
 Data analysis process Data collection and preparation Collect data Prepare codebook Set up structure of data Enter data Screen data for errors Exploration of data Descriptive Statistics Graphs Analysis
Education & Training Plan Accounting Math Professional Certificate Program with Externship
 University of Texas at El Paso Professional and Public Programs 500 W. University Kelly Hall Ste. 212 & 214 El Paso, TX 79968 http://www.ppp.utep.edu/ Contact: Sylvia Monsisvais 915-747-7578 samonsisvais@utep.edu
MODIFIED PARAMETRIC BOOTSTRAP: A ROBUST ALTERNATIVE TO CLASSICAL TEST
 MODIFIED PARAMETRIC BOOTSTRAP: A ROBUST ALTERNATIVE TO CLASSICAL TEST Zahayu Md Yusof, Nurul Hanis Harun, Sharipah Sooad Syed Yahaya & Suhaida Abdullah School of Quantitative Sciences College of Arts and
The Assumption(s) of Normality
 of Normality") The Assumption(s) of Normality Copyright 2000, 2011, J. Toby Mordkoff This is very complicated, so I ll provide two versions. At a minimum, you should know the short one. It would be great if you knew
The Assumption(s) of Normality Copyright 2000, 2011, J. Toby Mordkoff This is very complicated, so I ll provide two versions. At a minimum, you should know the short one. It would be great if you knew
STATISTICAL ANALYSIS WITH EXCEL COURSE OUTLINE
 STATISTICAL ANALYSIS WITH EXCEL COURSE OUTLINE Perhaps Microsoft has taken pains to hide some of the most powerful tools in Excel. These add-ins tools work on top of Excel, extending its power and abilities
P(every one of the seven intervals covers the true mean yield at its location) = 3.
 = 3.") 1 Let = number of locations at which the computed confidence interval for that location hits the true value of the mean yield at its location has a binomial(7,095) (a) P(every one of the seven intervals
1 Let = number of locations at which the computed confidence interval for that location hits the true value of the mean yield at its location has a binomial(7,095) (a) P(every one of the seven intervals
RARITAN VALLEY COMMUNITY COLLEGE ACADEMIC COURSE OUTLINE MATH 111H STATISTICS II HONORS
 RARITAN VALLEY COMMUNITY COLLEGE ACADEMIC COURSE OUTLINE MATH 111H STATISTICS II HONORS I. Basic Course Information A. Course Number and Title: MATH 111H Statistics II Honors B. New or Modified Course:
Program Handbook Nutrition and Dietetics Major Department of Nutrition and Food Sciences 2014-15
 Program Handbook Nutrition and Dietetics Major Department of Nutrition and Food Sciences 2014-15 Topics: Page: NFS Department and Field of Nutrition and Dietetics 2 Undergraduate Major 3 Admission and
Session S2H. Retention in Engineering and Where Students Go When They Leave Engineering RESULTS AND DISCUSSION
 Gender Trends In Engineering Retention Maura Jenkins 1 and Robert G. Keim 2 Abstract We know that fewer women than men choose to begin college in an engineering major, but is there a difference in the
Fairfield Public Schools
 Mathematics Fairfield Public Schools AP Statistics AP Statistics BOE Approved 04/08/2014 1 AP STATISTICS Critical Areas of Focus AP Statistics is a rigorous course that offers advanced students an opportunity
Study Design and Statistical Analysis
 Study Design and Statistical Analysis Anny H Xiang, PhD Department of Preventive Medicine University of Southern California Outline Designing Clinical Research Studies Statistical Data Analysis Designing
Foundation of Quantitative Data Analysis
 Foundation of Quantitative Data Analysis Part 1: Data manipulation and descriptive statistics with SPSS/Excel HSRS #10 - October 17, 2013 Reference : A. Aczel, Complete Business Statistics. Chapters 1
Ph.D. DEGREE IN ORGANIZATIONAL LEADERSHIP
 Ph.D. DEGREE IN ORGANIZATIONAL LEADERSHIP The Ph.D. degree in Organizational Leadership provides an interdisciplinary approach to the study of topics, theories and research critical to the professional
Analysis of Data. Organizing Data Files in SPSS. Descriptive Statistics
 Analysis of Data Claudia J. Stanny PSY 67 Research Design Organizing Data Files in SPSS All data for one subject entered on the same line Identification data Between-subjects manipulations: variable to
THE UNIVERSITY OF TEXAS AT TYLER COLLEGE OF NURSING COURSE SYLLABUS NURS 5317 STATISTICS FOR HEALTH PROVIDERS. Fall 2013
 THE UNIVERSITY OF TEXAS AT TYLER COLLEGE OF NURSING 1 COURSE SYLLABUS NURS 5317 STATISTICS FOR HEALTH PROVIDERS Fall 2013 & Danice B. Greer, Ph.D., RN, BC dgreer@uttyler.edu Office BRB 1115 (903) 565-5766
Results from the 2014 AP Statistics Exam. Jessica Utts, University of California, Irvine Chief Reader, AP Statistics jutts@uci.edu
 Results from the 2014 AP Statistics Exam Jessica Utts, University of California, Irvine Chief Reader, AP Statistics jutts@uci.edu The six free-response questions Question #1: Extracurricular activities
ANOVA ANOVA. Two-Way ANOVA. One-Way ANOVA. When to use ANOVA ANOVA. Analysis of Variance. Chapter 16. A procedure for comparing more than two groups
 ANOVA ANOVA Analysis of Variance Chapter 6 A procedure for comparing more than two groups independent variable: smoking status non-smoking one pack a day > two packs a day dependent variable: number of
GMAC. Which Programs Have the Highest Validity: Identifying Characteristics that Affect Prediction of Success 1
 GMAC Which Programs Have the Highest Validity: Identifying Characteristics that Affect Prediction of Success 1 Eileen Talento-Miller & Lawrence M. Rudner GMAC Research Reports RR-05-03 August 23, 2005
Comparing Means in Two Populations
 Comparing Means in Two Populations Overview The previous section discussed hypothesis testing when sampling from a single population (either a single mean or two means from the same population). Now we
MTH 140 Statistics Videos
 MTH 140 Statistics Videos Chapter 1 Picturing Distributions with Graphs Individuals and Variables Categorical Variables: Pie Charts and Bar Graphs Categorical Variables: Pie Charts and Bar Graphs Quantitative
HOW TO WRITE A LABORATORY REPORT
 HOW TO WRITE A LABORATORY REPORT Pete Bibby Dept of Psychology 1 About Laboratory Reports The writing of laboratory reports is an essential part of the practical course One function of this course is to
Predicting Student Persistence Using Data Mining and Statistical Analysis Methods
 Predicting Student Persistence Using Data Mining and Statistical Analysis Methods Koji Fujiwara Office of Institutional Research and Effectiveness Bemidji State University & Northwest Technical College
Data Analysis Tools. Tools for Summarizing Data
 Data Analysis Tools This section of the notes is meant to introduce you to many of the tools that are provided by Excel under the Tools/Data Analysis menu item. If your computer does not have that tool
NSSE Multi-Year Data Analysis Guide
 NSSE Multi-Year Data Analysis Guide About This Guide Questions from NSSE users about the best approach to using results from multiple administrations are increasingly common. More than three quarters of
II. DISTRIBUTIONS distribution normal distribution. standard scores
 Appendix D Basic Measurement And Statistics The following information was developed by Steven Rothke, PhD, Department of Psychology, Rehabilitation Institute of Chicago (RIC) and expanded by Mary F. Schmidt,
Master of Public Affairs Graduate Policy Manual
 Master of Public Affairs Graduate Policy Manual Established August 27, 2012 Page 1 Mission Statement The mission of the School of Public & Environmental Affairs Program is to sustain a diverse, collaborative
t Tests in Excel The Excel Statistical Master By Mark Harmon Copyright 2011 Mark Harmon
 t-tests in Excel By Mark Harmon Copyright 2011 Mark Harmon No part of this publication may be reproduced or distributed without the express permission of the author. mark@excelmasterseries.com www.excelmasterseries.com
NCSS Statistical Software
 Chapter 06 Introduction This procedure provides several reports for the comparison of two distributions, including confidence intervals for the difference in means, two-sample t-tests, the z-test, the
Lecture 2: Descriptive Statistics and Exploratory Data Analysis
 Lecture 2: Descriptive Statistics and Exploratory Data Analysis Further Thoughts on Experimental Design 16 Individuals (8 each from two populations) with replicates Pop 1 Pop 2 Randomly sample 4 individuals
Use Data Mining Techniques to Assist Institutions in Achieving Enrollment Goals: A Case Study
 Use Data Mining Techniques to Assist Institutions in Achieving Enrollment Goals: A Case Study Tongshan Chang The University of California Office of the President CAIR Conference in Pasadena 11/13/2008
Minitab Tutorials for Design and Analysis of Experiments. Table of Contents
 Table of Contents Introduction to Minitab...2 Example 1 One-Way ANOVA...3 Determining Sample Size in One-way ANOVA...8 Example 2 Two-factor Factorial Design...9 Example 3: Randomized Complete Block Design...14
HYPOTHESIS TESTING: CONFIDENCE INTERVALS, T-TESTS, ANOVAS, AND REGRESSION
 HYPOTHESIS TESTING: CONFIDENCE INTERVALS, T-TESTS, ANOVAS, AND REGRESSION HOD 2990 10 November 2010 Lecture Background This is a lightning speed summary of introductory statistical methods for senior undergraduate
ANALYSING LIKERT SCALE/TYPE DATA, ORDINAL LOGISTIC REGRESSION EXAMPLE IN R.
 ANALYSING LIKERT SCALE/TYPE DATA, ORDINAL LOGISTIC REGRESSION EXAMPLE IN R. 1. Motivation. Likert items are used to measure respondents attitudes to a particular question or statement. One must recall
Welcome to Utah State University!!!
 Welcome to Utah State University!!! We are excited to have you joining us at Utah State University! As your Admissions letter stated, you have been Provisionally Admitted to USU on warning status. This
Simple Linear Regression Inference
 Simple Linear Regression Inference 1 Inference requirements The Normality assumption of the stochastic term e is needed for inference even if it is not a OLS requirement. Therefore we have: Interpretation
IBM SPSS Statistics 20 Part 4: Chi-Square and ANOVA
 CALIFORNIA STATE UNIVERSITY, LOS ANGELES INFORMATION TECHNOLOGY SERVICES IBM SPSS Statistics 20 Part 4: Chi-Square and ANOVA Summer 2013, Version 2.0 Table of Contents Introduction...2 Downloading the
Mathematics within the Psychology Curriculum
 Mathematics within the Psychology Curriculum Statistical Theory and Data Handling Statistical theory and data handling as studied on the GCSE Mathematics syllabus You may have learnt about statistics and
Statistiek II. John Nerbonne. October 1, 2010. Dept of Information Science j.nerbonne@rug.nl
 Dept of Information Science j.nerbonne@rug.nl October 1, 2010 Course outline 1 One-way ANOVA. 2 Factorial ANOVA. 3 Repeated measures ANOVA. 4 Correlation and regression. 5 Multiple regression. 6 Logistic
MULTIPLE CHOICE. Choose the one alternative that best completes the statement or answers the question.
 STT315 Practice Ch 5-7 MULTIPLE CHOICE. Choose the one alternative that best completes the statement or answers the question. Solve the problem. 1) The length of time a traffic signal stays green (nicknamed
Chapter 5 Analysis of variance SPSS Analysis of variance
 Chapter 5 Analysis of variance SPSS Analysis of variance Data file used: gss.sav How to get there: Analyze Compare Means One-way ANOVA To test the null hypothesis that several population means are equal,
An introduction to using Microsoft Excel for quantitative data analysis
 Contents An introduction to using Microsoft Excel for quantitative data analysis 1 Introduction... 1 2 Why use Excel?... 2 3 Quantitative data analysis tools in Excel... 3 4 Entering your data... 6 5 Preparing
Institute of Actuaries of India Subject CT3 Probability and Mathematical Statistics
 Institute of Actuaries of India Subject CT3 Probability and Mathematical Statistics For 2015 Examinations Aim The aim of the Probability and Mathematical Statistics subject is to provide a grounding in
Name: Date: Use the following to answer questions 3-4:
 Name: Date: 1. Determine whether each of the following statements is true or false. A) The margin of error for a 95% confidence interval for the mean increases as the sample size increases. B) The margin
UNDERGRADUATE STUDIES
 Presidential Brief UNDERGRADUATE STUDIES Eboni J. Pringle, Ph.D. Candidate Interim Dean B.S., Ohio University M.Ed., Kent State University Ph.D. Candidate, Kent State University Job Responsibilities: Administer
COMPARISON OF OUTCOMES ON LIKE EXAMS ADMINISTERED TO IN-RESIDENCE AND ASYNCHRONOUS DISTANCE-BASED PHARM.D. STUDENTS
 COMPARISON OF OUTCOMES ON LIKE EXAMS ADMINISTERED TO IN-RESIDENCE AND ASYNCHRONOUS DISTANCE-BASED PHARM.D. STUDENTS Ronald E. Ragan, R.Ph., Ph.D. Director, Non-Traditional Pharmacy Education The University
Section 13, Part 1 ANOVA. Analysis Of Variance
 Section 13, Part 1 ANOVA Analysis Of Variance Course Overview So far in this course we ve covered: Descriptive statistics Summary statistics Tables and Graphs Probability Probability Rules Probability
The Strategic Priorities Consultation Survey
 Strategic Priorities Consultation Survey #2 Results 2013 Institutional Planning & Analysis Prepared by: Stephanie Klassen, Kristen Hamilton Date: November 15, 2013 Prepared for: Strategic Priorities Advisory
Process Capability Analysis Using MINITAB (I)
") Process Capability Analysis Using MINITAB (I) By Keith M. Bower, M.S. Abstract The use of capability indices such as C p, C pk, and Sigma values is widespread in industry. It is important to emphasize
Process Capability Analysis Using MINITAB (I) By Keith M. Bower, M.S. Abstract The use of capability indices such as C p, C pk, and Sigma values is widespread in industry. It is important to emphasize
Course Catalog. www.airweb.org/academy
 www.airweb.org/academy Course Catalog 2015 Hosted by the Association for Institutional Research, Data and Decisions Academy courses provide self-paced, online professional development for institutional
Evaluation of Online Courses Fall 2000 to Fall 2001
 Evaluation of Online Courses Fall 2000 to Fall 2001 Institutional Assessment, Research and Planning May 2002 Dr. Andreea M. Serban, Director Steven Fleming, Analyst Office Web Site http://www.sbcc.net/rt/ir/institutionalresearch.htm
An Introduction to Statistics using Microsoft Excel. Dan Remenyi George Onofrei Joe English
 An Introduction to Statistics using Microsoft Excel BY Dan Remenyi George Onofrei Joe English Published by Academic Publishing Limited Copyright 2009 Academic Publishing Limited All rights reserved. No
IS THERE WORKING PROFESSIONALS SUPPORT FOR RECOMMENDING STUDENTS DOUBLE MAJOR IN ACCOUNTING AND INFORMATION SYSTEMS?
 IS THERE WORKING PROFESSIONALS SUPPORT FOR RECOMMENDING STUDENTS DOUBLE MAJOR IN ACCOUNTING AND INFORMATION SYSTEMS? Orion Welch, St. Mary s University, owelch@stmarytx.edu Tom Madison, St. Mary s University,