The Socio-Economic Impacts of Ebola in Sierra Leone
|
|
|
- Gavin Horn
- 8 years ago
- Views:
Transcription


1 The Socio-Economic Impacts of Ebola in Sierra Leone Results from a High Frequency Cell Phone Survey Round 1 January 12, 2015

2 This note was prepared by Ning Fu (World Bank Social Protection Global Practice), Rachel Glennerster (MIT), Kristen Himelein (World Bank Poverty Global Practice), Nina Rosas (World Bank Social Protection and Labor Global Practice), and Tavneet Suri (MIT). The data collection was conducted jointly by Statistics Sierra Leone (SSL) and Innovations for Poverty Action (IPA). Very capable research assistance was provided by Shweta Bhogale (MIT and Innovations for Poverty Action) and Ayago Esmubancha Wambile (Poverty Global Practice). In addition, the team benefitted from useful advice and comments from World Bank Group colleagues, including: Kathleen Beegle (Lead Economist, Office of the Chief Economist, Africa Region), Pablo Fajnzylber (Practice Manager, Poverty Global Practice), Markus Goldstein (Practice Leader, Office of the Chief Economist, Africa Region), Johannes Hoogeveen (Senior Economist, Poverty Global Practice), Talip Kilic (Economist, Development Economics Research Group), and Laura Ralston (Economist, Social Protection and Labor Global Practice). Vice President Country Director Makhtar Diop Yusupha Crookes Poverty Senior Director Practice Manager Task Manager Ana Revenga Pablo Fajnzylber Kristen Himelein Social Protection Senior Director Practice Manager Task Manager Arup Banerji Stefano Paternostro Nina Rosas 2
, Pablo")
3 Overview As of January 4, 2015, Sierra Leone had reported nearly 10,000 cases of Ebola Virus Disease (EVD), and nearly 3,000 deaths. While recent World Health Organization (WHO) reports show that the outbreak is stabilizing in Guinea and Liberia, Sierra Leone continues to see an increasing number of cases and deaths, and the virus has now taken hold across all districts and particularly in the capital, Freetown. In an effort to collect timely and robust data on the impacts of EVD, the Government of Sierra Leone, with support from the World Bank Group and in partnership with Innovations for Poverty Action, is conducting mobile phone surveys with the aim of capturing the key socio-economic effects of the virus. Since the proportion of the population that has been infected is small, the largest impacts on household welfare are expected to result from indirect effects of measures taken to restrict disease spread and the general disruption to the economy caused by the outbreak. The results focus mainly on employment and migration, agriculture, food security and prices, remittances, utilization of non-evd health services, as well as trust levels. The results focus predominantly on urban areas where cell phone coverage is highest, but rural areas are covered as much as possible given the sample available. Based on the first round of data collection, it is clear that EVD has had important economic impacts on Sierra Leone. In urban areas, and particularly in Freetown, declines in employment are evident both among wage workers and the non-farm self-employed, with Ebola cited as one of the main reasons for not working. Among household heads, an estimated 9,000 wage workers and 170,000 self-employed workers outside of agriculture are no longer working since the EVD crisis. The percent of households engaged in a non-farm household enterprise that was no longer operating tripled and among households operating these businesses, average revenue decreased by 40 percent. No differences were found in employment impacts across quarantined and non-quarantined districts, further highlighting the importance of economy-wide indirect effects. Also, the data suggest there has not been recent large scale migration. The Ebola outbreak has not shown a significant effect on the ongoing harvest although the unseasonably heavy rains appear to have delayed the harvest. Food insecurity is high in Sierra Leone, but it is unclear the degree to which this is Ebola-related. There is no current evidence to suggest that quarantine restrictions are preventing food from reaching markets, and food insecurity is not higher in the quarantined districts. The poorest households are the most food insecure and are less likely to have access to informal safety nets through remittances. There is some evidence of a decrease in utilization of health services for non-evd conditions in Freetown. A much lower proportion of women in the capital reported post-natal clinic visits than in In the rest of the country, on the other hand, there is little evidence of a decline in usage. This first round of data collection can serve as a reference point to track changes as the Ebola outbreak continues to unfold in Sierra Leone. Subsequent reports are planned monthly going forward in order to help the government and other stakeholders address the most pressing socioeconomic issues as they arise and assist in planning for the eventual crisis recovery. 3

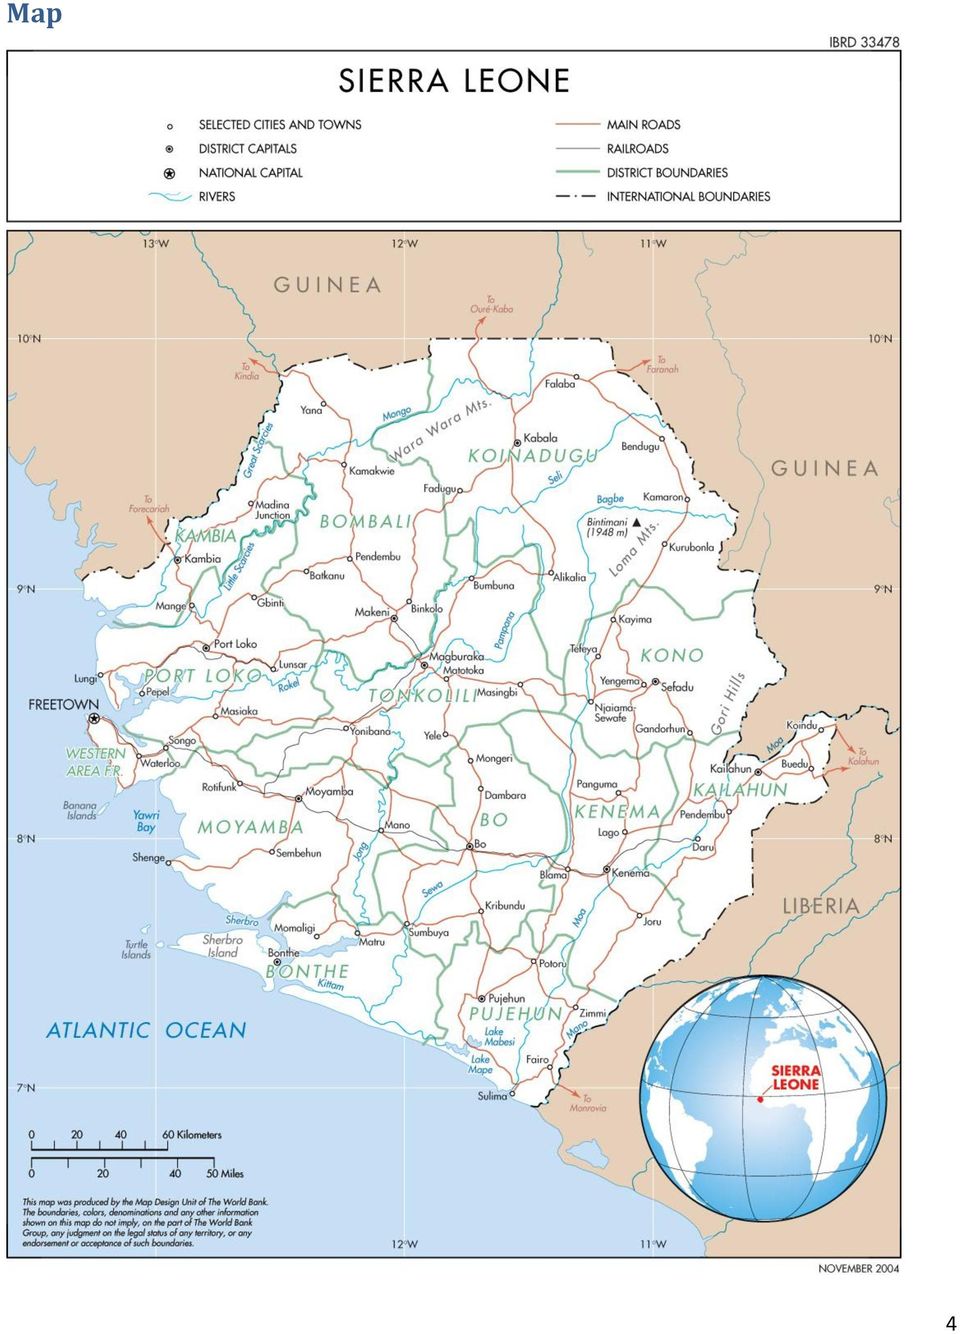
4 Map 4

5 Background and Motivation Since its initial appearance in March 2014 in rural Guinea, the Ebola Virus Disease (EVD) has caused more than 8,000 deaths, with over 20,000 total cases in the region. As of January 4, 2015, Sierra Leone had nearly 10,000 cases and almost 3,000 deaths. While there have been reports from the WHO of the outbreak stabilizing in Guinea and Liberia, Sierra Leone continues to experience an increasing number of cases and deaths. The situation has become even more challenging as the virus has now taken hold across all districts and particularly in the capital, Freetown. Since the outbreak began, the Government of Sierra Leone has taken a number of measures to control the spread of the disease. Schools in affected areas were closed in mid-june, and as the situation continued to deteriorate during the traditional summer break, the decision was taken not to reopen in September. Government instructed social centers to close throughout the country at this time. The two districts most severely affected in the first wave of the outbreak, Kailahun and Kenema, were quarantined from August 1, and an additional three districts Moyamba, Bombali, and Port Loko were quarantined in mid-september, with certain areas of the capital also under isolation. International travel has also been restricted. Many airline carriers stopped flights and some countries have restricted entry from those who were recently in West Africa. Some international nongovernmental organizations, private companies, and aid agencies have evacuated international staff. Figure 1. Geographic spread of Ebola cases over time August 31, 2014 November 12, 2014 Source: Ministry of Health and Sanitation, Sierra Leone. As of June 29, 2014 the start of the Labor Force Survey, there were only 27 cases in Kenema and 153 Kailahun. While direct effects of EVD on employment are likely to be small as the number of cases represents 0.1 percent of the population, indirect channels have the potential to impact a wide variety of socioeconomic outcomes. The combination of government restrictions and fear of infection have led to a reduction in activities that involve large gatherings. This affects the service sector including those working in marketplaces, restaurants, bars, transport, and schools. Increased transportation costs due to the increased number of checkpoints and night time travel restrictions contributes to higher operating costs. General uncertainty about the economic climate may lead businesses to defer investment and could impact credit conditions. Consumers may reduce discretionary spending, and 5

6 micro enterprises owners may be forced to spend operating capital on basic consumption. There is a great need to monitor these impacts in real time both to inform policy responses and to estimate the longer term costs of the epidemic. Objectives and Methodology In an effort to rapidly measure the socioeconomic impacts of the EVD crisis, the Government of Sierra Leone, with support from the World Bank and in partnership with Innovations for Poverty Action (IPA), is conducting high frequency cell phone surveys. The main focus of the data collection is to capture the key socio-economic effects of EVD, including impacts on labor market indicators, agricultural production, food security, migration, and utilization of non-ebola essential health services, as well as trust levels and knowledge of Ebola. The reasoning behind not focusing on EVD itself is fourfold: (i) measurement of direct health indicators is best done by epidemiologists; (ii) collecting health indicators may jeopardize response rates, particularly given the repeated nature of the surveys, (iii) indirect effects may impact many more people than the direct effects, and (iv) there is still a lack of reliable information on the potential magnitude of these indirect effects. The high frequency cell phone survey is designed to provide rapid indicators from a large sample of households across the country at a time when traditional face-to-face surveys are not possible. The survey follows a sample of households for whom cell phone numbers were recorded during the nationally-representative Labor Force Survey (LFS) conducted in July-August Among 4,200 households in the LFS, cell phone coverage was 66 percent overall (2,764 households) and unevenly distributed, with lower coverage Figure 2. Household cell phone coverage (%) and severity of EVD among rural households (43 percent versus 82 percent in urban areas). While there is partial coverage in all districts and statistical adjustments were made (see Methodological Appendix), the results should be interpreted with caution, since households with cell phones tend to be better off. Because cell phone ownership is high in Freetown and other urban areas, there are higher coverage rates in these areas. The results in rural areas should therefore in particular be taken as informative rather than Source: LFS data and November 22, 2014 WHO Situation Report. representative. By re-surveying LFS respondents in the fall of 2014, it is possible to track how labor market outcomes have changed since the EVD crisis began. In the remainder of the sections, the analysis compares the 6
, is conducting high frequency cell phone surveys.")
7 conditions measured in the cell phone survey to the best available comparison survey. A complete list and details provided in the Methodological Appendix. The first round of the cell phone survey was carried out from November 12 to November 25, 2014 and administered to household heads in the subsample of households with cell phones. Response rates were generally high (70 percent) for this type of survey, particularly given the challenging conditions under which it was conducted. The resulting sample comprises 1,896 households that were successfully surveyed. The Methodological Appendix provides details on the data collection and statistical adjustments made to minimize potential bias. Future rounds are planned monthly beginning in mid- January This report is structured in six sections covering employment and migration, agriculture, food security and prices, remittances, utilization of non-ebola health services, and trust. In addition to standard disaggregation, where relevant, results are disaggregated by three areas hypothesized to have been differentially effected by Ebola: (i) Freetown, 1 the capital where approximately one quarter of the population resides and which has a large and rising number of Ebola infections; (ii) five quarantined districts Bombali, Kenema, Kailahun, Moyamba, and Port Loko areas with the highest Ebola caseloads and where the government at some point imposed a cordon or quarantines to slow the spread of the disease; and (iii) all the remaining districts in Sierra Leone where the outbreak has been less severe, although no district has been untouched by EVD. Employment Pre-EVD Structure of the Labor Force At the onset of the EVD crisis, labor force participation was high and unemployment was low. 2 As measured by the Labor Force Survey conducted in July and August 2014, the employment rate was 62 percent of the working-age population, comparable with neighboring countries. The unemployment rate was four percent at the national level, and was primarily an urban phenomenon (seven percent in urban and two percent in rural areas). The inactivity rate, or percentage of the working-age population not in the labor force, was 35 percent. Of the inactive working-age population, 53 percent were in school, and 12 percent were engaged in unpaid household economic activities. Sierra Leone is a largely agricultural economy, particularly in rural areas, while the non-farm household enterprise sector is predominant in urban areas. Prior to the EVD crisis, more than half (56 percent) of the employed population was engaged in agriculture as their main activity, almost all of whom were self-employed. In rural areas the percentage was 68 percent, compared to 13 percent in urban areas. Nearly 70 percent of the employed population spent some hours involved in agriculture at 1 Freetown in this report refers to Western Area Urban. Western Area Rural is classified as non-quarantine. 2 Unemployment in this context is based on three criteria, namely being: (i) without employment in the past week (and not temporarily absent); (ii) available to work in the past week or next two weeks; and (iii) seeking employment. 7

8 some point during the year (83 percent in rural and 20 percent in urban areas). 3 Around 29 percent of the employed was engaged in non-farm household enterprise activities as their main activity. Notably, less than half, 43 percent, of these worked exclusively on the household businesses; while the rest also engaged in farming activities as a secondary source of employment. This phenomenon is particularly marked in rural areas, where among the 21 percent working on non-farm enterprises as their main activity, 81 percent also worked in agriculture. By comparison in urban areas just over half of the employed were non-farm self-employed workers, but only 35 percent in urban areas outside Freetown, and nine percent in Freetown itself, engaged in part-time agriculture. The wage sector is relatively small and concentrated in urban areas. Defining wage work as strictly non-farm wage employment, only six percent of the population worked in the wage sector on a regular basis as their main employment activity, with an additional two percent engaged on a casual basis. This includes wage jobs in the private and public sectors,, as well as a small number of wage jobs in agricultural. The percentage engaged in agricultural wage work and apprenticeships was negligible. Of all reported regular wage work activities, 75 percent were located in the urban areas. The mining sector, a prime driver of macroeconomic growth, did not contribute substantially to employment, with one percent of the employed population working directly in the mining sector as wage workers. 4 The employment situation of household heads differs from the broader population. The November survey tracks mostly heads of households. This group is older and more likely to be male than the general population. 5 The average age of household heads in the LFS was 42, compared to an average age of 32 in the working-age population (ages 15-65). One-third of household heads are youth (defined in Sierra Leone as those ages 15-35), compared to two-thirds in the overall working-age population. Nearly three-quarters of household heads are males, compared with gender parity in the broader working-age population. Household heads are less likely to be in school or engaged in unpaid household activities, and exhibit a higher employment rate and lower inactivity rate. Among the employed household heads, the sectoral breakdown is similar to that of the broader working-age population, with a slightly higher proportion of household heads in the wage sector. Since younger, female individuals are more likely to be in non-farm self-employment than older males, employment effects on household heads may underestimate the impacts on the broader population if the self-employed have experienced larger impacts. On the other hand, if the wage sector was harder hit by the EVD crisis, the results shown here may overstate the impacts on the broader population. 3 Agriculture in this context is defined as own-farm employment. There are a small number of hired farm laborers but they would be considered as wage laborers. 4 The actual percentage of those engaged in the mining sector may be higher than that indicated in the LFS as the LFS covers only the population living in dwellings. Any workers housed in dormitories or other non-dwelling living arrangements would not be captured. 5 A small percent of respondents were not household heads see the Methodological Appendix for details. 8

9 Table 1. Employment indicators, August-July 2014: LFS full sample vs. household heads All working-age Household heads Working-age population (15-65) 3,056, ,244 Labor force participation status Employment rate 62% 88% Freetown 47% 82% Other urban 50% 85% Rural 67% 90% Unemployment rate 4% 2% Inactivity rate 35% 10% In school 19% 1% Unpaid household work 4% 2% Idle 12% 8% Main activities of employed population Wage 9% 12% Freetown 40% 44% Other urban 21% 27% Rural 3% 5% Agricultural SE 56% 55% Freetown 0% 0% Other urban 20% 19% Rural 68% 70% Non-farm SE 29% 27% Freetown 58% 55% Other urban 54% 51% Rural 21% 19% Unpaid workers 6 7% 5% Freetown 3% 1% Other urban 5% 4% Rural 7% 6% Source: Sierra Leone Labor Force Survey (July-August 2014). Impact of EVD on the Labor Force There has been a significant impact of the EVD crisis on employment in urban areas, particularly in Freetown. While overall, employment rates are not statistically different in the Labor Force Survey (82 percent) and the cell phone survey (80 percent), this masks a large decline in urban areas. The urban employment rate decreased from 75 percent to 67 percent. Freetown, the capital and largest urban 6 Includes those working without pay in own or another household s farm or business and unpaid apprentices. 9

10 Other Urban Freetown Rural Overall center, experienced a slightly larger decrease in the employment rate, dropping nine percentage points from 73 percent to 64 percent. Employment in other urban areas decreased from 77 to 69 percent, while employment in rural areas remained steady at 86 percent. In urban areas, the estimated net losses in self-employment jobs in absolute terms are much larger than in wage employment, reaching nearly 170,500 and 8,500 jobs, respectively. This is not surprising given the wage sector represents a small portion of the country s labor market. There were no statistically significant changes in employment rates in either quarantined or non-quarantined districts. This suggests that the EVD impacts are not confined to the most affected EVD areas, and that the quarantines themselves have not had major disruptions on economic activity or that direct effects of the quarantines have been offset by other actions such as bringing in food into quarantined areas and other EVD-related activities. Figure 3. Employment rates Working Not working Baseline 82% 18% Round 1 80% 20% Baseline 86% 14% Round 1 86% 14% Baseline 73% 27% Round 1 64% 36% Baseline 77% 23% Round 1 69% 31% 0% 10% 20% 30% 40% 50% 60% 70% 80% 90% 100% Source: Sierra Leone Labor Force Survey (July-August 2014) and cell phone survey (November 2014). Ebola is cited as one of the main reasons for not currently working. Among those who were not working in the past week in the first round of the cell phone survey, 20 percent reported the absence was due to Ebola, but not directly for health-related issues. Only two respondents reported specifically EVD-related health issues. While EVD-related health issues may well be under-reported, it is indicative that indirect factors were more important in employment losses than direct health effects. The percent who report Ebola as the reason for not working does not differ across Freetown, other urban areas, and rural areas. The most common other reasons for absence include temporary layoffs (15 10


11 percent), lack of capital (11 percent), seasonal work (9 percent) and health reasons (8 percent), which were (statistically) similarly prevalent reasons prior to the crisis. Figure 3. Reasons household non-farm enterprise is no longer operating 1% 9% 9% 39% 4% Ebola Seasonal Closure 33% No Customers Cannot Get Inputs Cannot Transport Goods Illness/Caring for Ill Relative 4% 1% Financial Constraints Other Source: Cell phone survey (November 2014). Note: The category other includes the following reasons: low sales, no customers, no jobs available, no stock, retired, student, or traveling. The EVD crisis is disrupting business operations and reducing revenues among non-farm household enterprises. Among households engaged in non-farm enterprise work, the percent reporting that the business is no longer operating tripled, increasing from four percent to 12 percent. Among households that indicated their business was no longer operating, one-third cited Ebola as the reason. Among enterprises that did continue to operate, average revenues shrunk dramatically, dropping from monthly revenues of Le. 1.4 million (approximately 304 USD) to Le. 850,000 (approximately 182 USD). 7 Due to measurement differences across survey periods, it is not possible to directly estimate the net decrease in the total number of enterprises. Box 1: Migration Data from the cell phone survey show insignificant migration activities into and out of Freetown as well as overall. Approximately eight percent of households reported living in a different location from the LFS. 1 Though a limited sample size prohibits formal statistical tests, quarantine districts were the largest source of out-migrants, but these migrants did not systematically go to Freetown or non-quarantine districts. The majority of migrants within the Western area remained in that region, supporting the results in the employment section below that there has been limited movement into agriculture for those originally in the capital. While the pre-evd data from the LFS are not strictly comparable, they suggest that work is among the main reasons, along with moving to join family and friends and going to school. 7 Business revenues are measured with noise and subject to outliers. The means presented were trimmed at the top percentile of revenues. Alternatively if the top 5 percent are trimmed, revenues in LFS were about 1 million Leones and about 600,000 Leones in November. 11

12 Baseline Baseline Both Freetown and other urban areas exhibit significant employment instability. Around half of individuals followed over the two survey periods in Freetown and other urban areas 8 experienced a labor market transition (i.e., either changing sectors or moving into or out of work), with many of these no longer working. Table 2 presents transition probabilities across the main employment categories. The proportion transitioning is highest in other urban areas at 58 percent, compared to 45 percent in Freetown. While the proportion moving out of work was similar in Freetown and other urban areas, around 20 percent for both, in other urban areas this transition out of work was offset to a larger extent by entry among those not previously working. In Freetown, the majority of sector transitions and entries into work were into non-farm self-employment. This is consistent with the fact that agricultural activities are more limited in Freetown and outward migration from Freetown has been minimal. In other urban areas these transitions were mostly into farming activities. It is difficult to estimate how much of the movement is typical of Sierra Leone s labor market as opposed to induced by the EVD crisis. There is a paucity of data on the labor force prior to the 2014 LFS, as there have been no nationally-representative labor force statistics in approximately 20 years. Thus, while it is possible that some of this reshuffling is in response to EVD, alternatively it may reflect normal employment churning for Sierra Leone, where most jobs are informal or casual. Table 2. Labor market transitions Overall Round 1 Wage Non-ag SE Ag SE Unpaid Not working N Wage 4.4% 1.1% 0.7% 0.2% 2.6% Non-ag SE 1.2% 8.7% 17.1% 1.7% 6.0% Ag SE 0.3% 2.2% 22.7% 3.0% 4.0% Unpaid 0.0% 0.6% 3.2% 0.2% 0.7% Not working 2.1% 1.4% 6.2% 1.0% 8.2% Freetown Round 1 Wage Non-ag SE Ag SE Unpaid Not working N Wage 15.7% 6.0% 0.2% 1.2% 7.5% Non-ag SE 2.5% 19.1% 2.0% 0.4% 12.7% Ag SE 0.0% 0.3% 0.0% 0.0% 0.0% Unpaid 0.0% 0.5% 0.0% 0.5% 0.2% Not working 3.1% 6.1% 1.0% 0.5% 19.4% 8 In rural areas, the small sample size is considered insufficient for analysis of transitions. 12

13 Baseline Baseline Other urban Round 1 Wage Non-ag SE Ag SE Unpaid Not working N Wage 7.9% 1.9% 1.2% 0.4% 6.7% Rural Non-ag SE 3.5% 13.1% 11.5% 1.3% 11.3% Ag SE 0.6% 0.1% 9.2% 0.2% 2.2% Unpaid 0.0% 0.0% 2.0% 0.0% 0.6% Not working 4.4% 2.3% 5.7% 1.4% 11.5% Round 1 Wage Non-ag SE Ag SE Unpaid Not working N Wage 1.3% 0.0% 0.7% 0.0% 0.5% Non-ag SE 0.3% 5.6% 21.5% 2.0% 3.2% Ag SE 0.3% 3.1% 30.7% 4.3% 5.3% Unpaid 0.0% 0.8% 4.2% 0.1% 0.8% Not working 1.3% 0.3% 7.4% 0.9% 5.2% Source: Sierra Leone Labor Force Survey (July-August 2014) and cell phone survey (November 2014). Gender impacts are inconclusive. Due to the limited number of female-headed households (24 percent), the sample of women is not sufficient to detect statistically significant differences in employment transitions between men and women. There are reasons, however, to expect women might be more affected due to the larger share of women involved in non-agricultural selfemployment prior to EVD, which was the hardest hit sector of employment. This view is consistent with evidence from market surveys 9 that traders have been most affected, as women s work prior to the crisis was predominately (91 percent) in smaller stall and market sales in urban areas. Outside of Freetown, workers in both farm and non-farm self-employment are dedicating less hours to work. The overall number of hours (amongst those working) showed a large drop across the economy from 47 hours to 39 hours in the past week, and workers in all sectors except wage work reduced the hours dedicated to work. The number of hours worked in the past week declined substantially in other urban areas, while remaining stable in Freetown, though the number of people working fell more sharply. The largest decline in hours was in rural areas, where workers on average worked 10 hours less (from 47 to 37 hours), with no significant difference in the number of people working. In the agricultural sector specifically, seasonal reductions due to the completion of the 9 Glennerster and Suri, 2014 available at 13
 and cell phone survey (November 2014). Gender impacts are inconclusive.")
14 harvest explain only a small portion of the decline, as there is no significant difference in the hours worked between those that still have rice in the fields to harvest and those that do not (38 versus 34 hours). Figure 4. Hours worked last week among those employed, by area Baseline Round Freetown Other urban Rural Source: Sierra Leone Labor Force Survey (July August 2014) and cell phone survey (November 2014). Agriculture EVD did not impact the main planting season activities of households in Sierra Leone. The planting season for the main annual agricultural crops in Sierra Leone (rice, maize, and sweet potato) is at the start of the summer rains in April or May. As the first few cases of EVD did not occur until May, it would not have affected the area under cultivation or to have restricted access to labor for planting. The other main food crop, cassava, is cultivated continuously with no specific planting period. Cocoa, coffee, and palm oil are important cash crops but are also continuously cultivated. Figure 5. Usual Planting and harvesting seasons for main agricultural crops Jan Feb Mar Apr May Jun Jul Aug Sep Oct Nov Dec Rice clearing planting harvest Cassava continuous harvesting Palm Oil harvest Cocoa harvest harvest Source: Global Information and Early Warning System on Food and Agriculture (GIEWS). 14
. Agriculture EVD did not impact the main planting season activities of households in Sierra Leone.")
15 rainfall (cm) The rice harvest may have been more impacted by 2014 environmental factors rather than EVD. Rice is the main crop in Sierra Leone, both in terms of food security and rural livelihoods, with 93 percent of agricultural households producing rice (SLIHS, 2011). The harvest season usually takes place from late September through December, and is therefore not yet completed for the 2014 agricultural season. Sixty-six percent of agricultural households reported there was still some rice in the field as of the cell phone survey in mid-november. The main reason cited by 72 percent of respondents, was that the rice was not yet ready to be harvested. More than 90 percent of agricultural households report that it is still raining, and rain stations report that rain during October was exceptionally high. If the unseasonably heavy rain continues, it may negatively affect yields. Figure 6. Rainfall by month Historic averages and Jan Feb Mar Apr May Jun Jul Aug Sep Oct Nov Dec Source: Glennerster and Suri (2014) from FEWS-NOAA Collaboration. A small percentage of households cite labor constraints, mainly related to household labor. For households that have some rice still in the field, about 14 percent of respondents indicated that not having enough household labor was their main constraint, but only six percent of those with rice in the field reported a lack of labor available in the community as the reason. Unfortunately there is limited historical information available as to the magnitude of this issue, but areas under quarantine report less (though not significantly less) shortage of labor than those not under quarantine. In addition, more than half of agricultural households hired labor outside the household. As the harvest is not yet complete, this proportion is likely to rise. Traditionally, many agricultural households engage in exchange labor agreements with their neighbors, and therefore the percentage of households employing outside labor likely underestimates the percentage using outside labor. The results suggest that the fear of infection has not had a major impact on hiring practices. Only one respondent reported being unable to harvest due to illness. Given that the rice harvest is ongoing, the impact of EVD remains to be assessed. With the early information that is available, however, there is no evidence that EVD has impacted the main inputs into 15

16 the harvest, namely planting and labor. The next rounds of the cell phone survey will continue to monitor the situation. Cocoa, a major cash crop in affected areas, does not yet show negative impacts from EVD. Cultivation of cocoa is limited to specific geographies with Kailahun and Kenema, the first districts in Sierra Leone to report cases of EVD, among the major producing areas in the country. The 2014 harvest season for cocoa is also ongoing, with 56 percent of cocoa farmers overall saying they have harvested some of their cocoa. A greater percentage of farmers in quarantined areas had harvested their cocoa, 63 percent compared to 45 percent. While the number of observations is too small to test statistical significance, the result indicates that cocoa does not appear to be less likely to be harvested in quarantine areas. Though unlike rice much of which is consumed close to where it is grown, cocoa will need to be sold and transported through the quarantine lines for export. By mid-november, there did not seem to be a statistically discernable difference between quarantine and non-quarantine areas in terms of cocoa growing households ability to sell cocoa crops. Thirty-nine percent of those in quarantine areas who had harvested their cocoa had sold at least some of their crop, compared to 66 percent in nonquarantine areas. It should be noted that there are only 127 responding households in the cell phone survey sample who grow cocoa, and only 59 who have sold cocoa, so these comparisons should be considered with caution. Food Security & Prices More than two-thirds of households experienced food insecurity in the week prior to the survey. At least once in the week previous to the survey, 55 percent of households ate less expensive or less preferred foods, 51 percent of households reduced portion size, 47 percent reduced the number of meals they ate, 36 percent restricted consumption by adults in order for small children to eat, 32 percent had to sell assets to buy food, and 29 percent borrowed food. Overall 71 percent of households took at least one of these six actions in the last week, and more may have taken other actions not specifically included in the questionnaire. It is difficult, however, to gauge the relative impact of EVD as households in Sierra Leone experience high levels of food insecurity even in non-crisis years. In addition, there are no comparable datasets that track food security by month and can be analyzed separately by urban and rural areas. As the cell phone respondents are mainly urban, they are less subject to seasonal fluctuations as they purchase rather than harvest rice and most purchased rice in Sierra Leone is imported (SLIHS, 2011). 16

17 Figure 7. Food insecurity and coping strategies Freetown Quarantine Non-quarantine 80% 70% 60% 50% 40% 30% 20% 10% 0% Source: Cell phone survey (November 2014). Food insecurity is not related to the prevalence of EVD in the area. Households are more likely to take measures in response to food insecurity in non-quarantine areas, where Ebola infection rates are lower. This may in part reflect the success of the Government and international community s response to food insecurity in quarantined areas. Data from 2011 SLIHS suggests the level of food poverty, a similar measure to food insecurity, was lower in Freetown but showed no differences between quarantine and non-quarantine districts. In the cell phone survey, Freetown has the lowest rates of food insecurity, although the differences are small and food insecurity in Freetown is still high. There are also no differences in the coping strategies across quarantine areas and non-quarantine areas, though households in Freetown are less likely to employ all strategies except restricting consumption by adults in order for small children to eat and reducing the number of meals eaten, which they were equally likely to use. Among poor households, rural and agricultural households are no less likely to be food insecure. Households above the median in the wealth index showed lower incidence of having to use one of the six coping strategies in the week prior to the survey. Within each wealth status group (above and below median wealth), there were no significant differences in food security coping strategies based on location, comparing between Freetown, rural, and other urban areas, and between quarantine and nonquarantine areas. Similarly, within wealth groups, there are no differences in food security outcomes by the household head s sector of employment. These findings show that food insecurity is widespread among the poor and that those working in agriculture or living in rural areas are just as likely to experience insecurity as urban non-producers, though this may change as the harvest continues. 17

18 Quarantines do not appear to be preventing food from reaching markets or consumers. Prices paid by households for rice in November 2014, the main staple crop, are marginally lower in quarantine districts (3,134 Leones per kg) than in Freetown (3,482 Leones) and non-quarantine districts (3,359 Leones). There also do not appear to be issues with shortages, as 99 percent of respondents indicated rice was available for sale in their community. These results echo the findings from other work monitoring food prices in markets throughout the country. A high frequency phone survey of 185 randomly selected markets conducted by IPA and the International Growth Center (IGC) found that prices for all staple foods, including domestic and imported rice, are on average similar to those collected from the same survey in previous years. There were some markets where prices were substantially higher than average and there were more of these outlier markets than in previous years. Some of these markets were close to the borders of Guinea and Liberia which have been closed to help prevent the spread of the disease, and some were in quarantined areas. On average, the IPA/IGC market survey did not find higher prices for food in quarantined compared to non-quarantined districts. Results from this current study suggest that the stable food prices in markets are translating into stable food prices for consumers. One caveat is that the current survey, because it only includes people with cell phones, includes few respondents in remote areas. Remittances Remittances have largely been going to wealthier households. Unfortunately as remittance data is usually collected with a 12 month recall period, it is not possible to tell from this data if the level of remittances has increased since the onset of the EVD crisis. Ten percent of households reported receiving remittances from friends or family either domestically or abroad in the last month, but these payments have been going mainly to better off households. About 18 percent of households above the median wealth index reported receiving remittances in the month before the survey, compared to eight percent of households below the median. The amounts of remittances received were also higher in more well-off households. Excluding two outlier observations of transfers more than 2,000 USD, which went to households above the median in Freetown and Kenema, the average amount was more than 50 percent higher for the well-off, 319,902 Le. (74 USD) compared to 151,305 Le. (35 USD). There was, however, no difference in the amounts received between the quarantine and non-quarantine areas outside of Freetown. Health Knowledge of Ebola Ebola information campaigns were largely successful. When asked if they had heard of Ebola virus and if they had received information about how to protect themselves, all respondents answered yes to both questions. The most common sources of information were by radio, interactions with family and neighbors, and through outreach workers. A substantial percentage, more than three-quarters, indicated receiving information from SMS messages, though this statistic is likely over-represented given that all respondents necessarily have cell phones. About 20 percent of respondents indicated receiving 18

19 information through social media, including more than 40 percent of those living in Freetown. In addition, a question was asked as to whether the household was visited during the September lockdown. More than 97 percent of households were visited during this period, and there were no differences across regions or districts. Figure 8. Sources of information regarding EVD 100% 90% 80% 70% 60% 50% 40% 30% 20% 10% 0% Source: Cell phone survey (November 2014). Health facility utilization Usage of health care facilities may have declined in Freetown due to EVD, but in other districts it seems unaffected. A major concern has been that the Ebola outbreak has deterred people from using health facilities for non-ebola related health needs. The baseline for this analysis is the 2013 Demographic and Health Survey (DHS), which was conducted just over one year prior to the cell phone survey. To determine if the usage had declined, the cell phone survey asked questions related to the care received by pregnant women and new mothers. Approximately 78 percent of households with pregnant women indicated they had gone to at least one prenatal visit in the previous two months, and 27 percent of new mothers reported giving birth in a clinic. While these percentages are low compared to international standards, particularly with regard to clinic births, Sierra Leone has had historic problems meeting the demand for maternal health care. The 2013 DHS and the cell phone survey can be compared in terms of the incidence of women seeking postnatal care for babies born within two months of the interview date. Many poorer and more remote rural households may not have cell phones and it is not possible to determine which households in the DHS had cell phones, so this analysis is limited only urban households, where ownership rates are higher. The potential exclusion of poorer urban households though likely causes the cell phone estimates to be higher than actual percentages. The comparison shows some differences for the quarantined and non-quarantined districts, though the sample size of recent births is not sufficient in the cell phone survey to detect statistical significance. There is, however, a significant decrease in 19
.")
20 Freetown despite the potential overestimation in the cell phone survey. This finding could be interpreted in two ways: either there has been a decline in service availability in Freetown due to a shift in health resources to EVD treatment, or it could point to a greater fear of exposure in Freetown than even in the quarantined areas, and an accompanying decline in use of health facilities. Regardless of the cause, the EVD crisis appears to have led to a decline in the use of non-evd related health services. Figure 10. Postnatal visits for babies born within two months of interview date 90% 80% 70% 60% 50% 40% 30% 20% 10% DHS Round 1 0% Freetown Quarantine Non-quarantine Source: Urban only, DHS (2013) and Cell phone survey (November 2014). The cell phone survey also asked questions related to the incidence and treatment of fever in the household. Again looking only at urban areas, of those which reported a child under age 5 with a fever in the previous two weeks, more than 90 percent sought treatment across Freetown, quarantine areas, and non-quarantine areas, which is comparable to rates in the DHS. These results must be caveated, however, with the fact that the fever incidence questions proved to be problematic as the means showed vast differences between the two surveys. Ten percent of households reported a child under 5 with a fever in the previous two weeks in the cell phone survey, compared to 35 percent in the DHS. The change in Freetown was even more severe, dropping below five percent from 37 percent in the baseline. While it is possible that there is a seasonal component of the change or that there have been some improvements in child health occurred just over one year, it is more likely that respondents were afraid to report fever in the household as it is a common symptom of EVD. This then likely led to substantial under-reporting. Trust Reported trust in central government officials did not differ between quarantine and nonquarantine areas. Despite the outbreak of EVD, in November 2014, 72 and 66 percent of respondents in quarantine and non-quarantine areas outside of Freetown, respectively, reported that central government officials could be believed, while 53 percent of those in Freetown said they could be 20

The Socio-Economic Impacts of Ebola in Sierra Leone
 The Socio-Economic Impacts of Ebola in Sierra Leone Results from a High Frequency Cell Phone Survey Round 3 June 15, 2015 This note was prepared by Kristen Himelein (Senior Economist / Statistician, GPVDR),
How To Prepare For An Emergency Food Security Crisis
 Famine Early Warning Systems Network PROJECTED FOOD SECURITY IMPACTS OF EBOLA IN GUINEA, LIBERIA, AND SIERRA LEONE October 8, 2014 Washington, DC Guinea, Liberia, and Sierra Leone are FEWS NET remote monitoring
SIERRA LEONE TRADER SURVEY REPORT April 3, 2015
 Between November 2014 and March 2015, FEWS NET worked with Mobile Accord (GeoPoll) to conduct seven rounds of SMS-based trader surveys in Liberia and Sierra Leone on the status of market activities and
Ebola Virus Disease (EVD) Outbreak and Price Dynamics in Guinea, Liberia and Sierra Leone
 Outbreak and Price Dynamics in Guinea, Liberia and Sierra Leone") Vol. 1, No. 4, 9 November 2014 Ebola Virus Disease (EVD) Outbreak and Price Dynamics in Guinea, Liberia and Sierra Leone Ebola, through its impact on prices, is reducing people s purchasing power and is
Vol. 1, No. 4, 9 November 2014 Ebola Virus Disease (EVD) Outbreak and Price Dynamics in Guinea, Liberia and Sierra Leone Ebola, through its impact on prices, is reducing people s purchasing power and is
UPDATE ON THE ECONOMIC IMPACT OF THE 2014 EBOLA EPIDEMIC ON LIBERIA, SIERRA LEONE, AND GUINEA DECEMBER 2, 2014
 UPDATE ON THE ECONOMIC IMPACT OF THE 2014 EBOLA EPIDEMIC ON LIBERIA, SIERRA LEONE, AND GUINEA DECEMBER 2, 2014 SUMMARY The Ebola epidemic continues to cripple the economies of Liberia, Sierra Leone, and
MALAWI Food Security Outlook July to December 2015. High prices, declining incomes, and poor winter production cause Crisis food insecurity
 MALAWI Food Security Outlook July to December 2015 High prices, declining incomes, and poor winter production cause Crisis food insecurity KEY MESSAGES Current acute food security outcomes, July 2015.
THE CAYMAN ISLANDS LABOUR FORCE SURVEY REPORT SPRING 2015
 THE CAYMAN ISLANDS LABOUR FORCE SURVEY REPORT SPRING 2015 Published September 2015 Economics and Statistics Office i CONTENTS SUMMARY TABLE 1. KEY LABOUR FORCE INDICATORS BY STATUS... 1 SUMMARY TABLE 2.
Study into the Sales of Add-on General Insurance Products
 Study into the Sales of Add-on General Insurance Quantitative Consumer Research Report Prepared For: Financial Conduct Authority (FCA) March, 2014 Authorised Contact Persons Frances Green Research Director
SOCIETY OF ACTUARIES THE AMERICAN ACADEMY OF ACTUARIES RETIREMENT PLAN PREFERENCES SURVEY REPORT OF FINDINGS. January 2004
 SOCIETY OF ACTUARIES THE AMERICAN ACADEMY OF ACTUARIES RETIREMENT PLAN PREFERENCES SURVEY REPORT OF FINDINGS January 2004 Mathew Greenwald & Associates, Inc. TABLE OF CONTENTS INTRODUCTION... 1 SETTING
Household Survey Data Basics
 Household Survey Data Basics Jann Lay Kiel Institute for the World Economy Overview I. Background II. Household surveys Design Content Quality Availability I. Background Not new, household survey data
Household Energy Expenditure: Measures es off Hardship & Changes in Income
 : Measures es off Hardship & Changes in Income By Professor or Sue Richardson Associate Professor or Peter Travers The National Institute of Labour Studies February, 2004 4 Table of Contents HOUSEHOLD
Contents... 2. Executive Summary... 5. Key Findings... 5. Use of Credit... 5. Debt and savings... 6. Financial difficulty... 7. Background...
 CREDIT, DEBT AND FINANCIAL DIFFICULTY IN BRITAIN, A report using data from the YouGov DebtTrack survey JUNE 2013 Contents Contents... 2 Executive Summary... 5 Key Findings... 5 Use of Credit... 5 Debt
Impact of the recession
 Regional Trends 43 21/11 Impact of the recession By Cecilia Campos, Alistair Dent, Robert Fry and Alice Reid, Office for National Statistics Abstract This report looks at the impact that the most recent
Investment Company Institute and the Securities Industry Association. Equity Ownership
 Investment Company Institute and the Securities Industry Association Equity Ownership in America, 2005 Investment Company Institute and the Securities Industry Association Equity Ownership in America,
A POVERTY PROFILE FOR SIERRA LEONE
 A POVERTY PROFILE FOR SIERRA LEONE June 2013 The World Bank Poverty Reduction & Economic Management Unit Africa Region Statistics Sierra Leone Currency Equivalents Currency Unit = Sierra Leonean Leone
Belief Formation in the Returns to Schooling
 Working paper Belief Formation in the Returns to ing Jim Berry Lucas Coffman March 212 Belief Formation in the Returns to ing March 31, 212 Jim Berry Cornell University Lucas Coffman Ohio State U. & Yale
Access to meaningful, rewarding and safe employment is available to all.
 Home Previous Reports Links Downloads Contacts The Social Report 2002 te purongo oranga tangata 2002 Introduction Health Knowledge and Skills Safety and Security Paid Work Human Rights Culture and Identity
HAWAII'S UNEMPLOYMENT RATE DROPS TO 3.7 PERCENT IN July
 DEPARTMENT OF LABO R AND INDUSTRIAL RELATIONS FOR IMMEDIATE RELEASE August 20, 2015 DAVID Y. IGE G OVERNOR LINDA CHU TAKA YAMA DIREC TOR HAWAII'S UNEMPLOYMENT RATE DROPS TO 3.7 PERCENT IN July State s
Regional Profile Labor Force, Employment and Unemployment in Region 5
 Regional Profile Labor Force, Employment and Unemployment in Region 5 For questions regarding content, please contact Brian Rooney at Brian.T.Rooney@state.or.us, (541) 686-7703 www.workinginoregon.org
Rural America At A Glance
 United States Department of Agriculture Rural America At A Glance 2014 Edition Overview While the U.S. economy is now in its sixth year of recovery from the Great Recession of 2007-09, its performance
Location Based Services - The Less Commonly Used
 4% of online Americans use location-based services Kathryn Zickuhr, Web Coordinator Aaron Smith, Senior Research Specialist 11/4/2010 http://pewinternet.org/reports/2010/location-based-services.aspx Pew
NUMBERS, FACTS AND TRENDS SHAPING THE WORLD FOR RELEASE JULY 16, 2015 MEDIA CONTACT FOR THIS REPORT: Dana Page, Communications Manager
 NUMBERS, FACTS AND TRENDS SHAPING THE WORLD FOR RELEASE JULY 16, 2015 MEDIA CONTACT FOR THIS REPORT: Dana Page, Communications Manager 202.419.4372 RECOMMENDED CITATION: Duggan, M., Lenhart, A., Lampe,
TEXAS MANUFACTURING EXPANDS BUT AT A SLOWER PACE
 ust 25, 2014 TEXAS MANUFACTURING EXPANDS BUT AT A SLOWER PACE For this month's survey, manufacturers were asked supplemental questions on health care costs and the impact of the Affordable Care Act. Texas
Quitline Tax Increase. Survey NEW ZEALAND POLICE CITIZENS SATISFACTION RESEARCH (TN/10/19) Six Month Follow Up. Contents
 Six Month Follow Up. Contents") Market Research Proposal Proposal Prepared For New Zealand Police Quitline Tax Increase Research Report Prepared for The Quit Group January 2011 Survey Six Month Follow Up NEW ZEALAND POLICE CITIZENS SATISFACTION
Market Research Proposal Proposal Prepared For New Zealand Police Quitline Tax Increase Research Report Prepared for The Quit Group January 2011 Survey Six Month Follow Up NEW ZEALAND POLICE CITIZENS SATISFACTION
HURRICANE WORKFORCE ANALYSIS HURRICANES ANDREW AND OPAL
 HURRICANE WORKFORCE ANALYSIS HURRICANES ANDREW AND OPAL Florida Agency for Workforce Innovation Labor Market Statistics September 2004 Hurricane Workforce Analysis Hurricanes Andrew & Opal Introduction
For Immediate Release
 Household Income Trends May 2015 Issued July 2015 Gordon Green and John Coder Sentier Research, LLC For Immediate Release 1 Household Income Trends May 2015 Note This report on median household income
2.1 Net enrolment ratio in primary education
 2.1 Net enrolment ratio in primary education GOAL AND TARGET ADDRESSED Goal 2: Achieve universal primary education Target 2.A: Ensure that, by 2015, children everywhere, boys and girls alike, will be able
4. Work and retirement
 4. Work and retirement James Banks Institute for Fiscal Studies and University College London María Casanova Institute for Fiscal Studies and University College London Amongst other things, the analysis
HW 2 Macroeconomics 102 Due on 06/12
 HW 2 Macroeconomics 102 Due on 06/12 1.What are the three important macroeconomic goals about which most economists, and society at large, agree? a. economic growth, full employment, and low interest rates
The National Business Survey National Report November 2009 Results
 The National Business Survey National Report November 2009 Results 1 Executive Summary (1) 2 NBS results from November 2009 demonstrate the continued challenging conditions faced by businesses in England
Evolution of informal employment in the Dominican Republic
 NOTES O N FORMALIZATION Evolution of informal employment in the Dominican Republic According to official estimates, between 2005 and 2010, informal employment fell from 58,6% to 47,9% as a proportion of
Age, Demographics and Employment
 Key Facts Age, Demographics and Employment This document summarises key facts about demographic change, age, employment, training, retirement, pensions and savings. 1 Demographic change The population
DATE: March 25, 2015. found at http://www.fsnnetwork.org/document/food-peace-management-information-system-ffpmis-resources.
 SUBJECT: Amendment No. 01 Guinea, Liberia, and Sierra Leone Emergency Response and Recovery for Ebola Virus Disease (EVD)-Affected Countries USAID/DCHA/FFP Annual Program Statement (APS) No. FFP-15-000001
China s Middle Market for Life Insurance
 China s Middle Market for Life Insurance May 2014 Sponsored by: SOA International Section SOA Marketing & Distribution Section SOA Research Expanding Boundaries Pool The opinions expressed and conclusions
CORRELATIONAL ANALYSIS BETWEEN TEENAGE PREGNANCY AND MATERNAL MORTALITY IN MALAWI
 CORRELATIONAL ANALYSIS BETWEEN TEENAGE PREGNANCY AND MATERNAL MORTALITY IN MALAWI Abiba Longwe-Ngwira and Nissily Mushani African Institute for Development Policy (AFIDEP) P.O. Box 31024, Lilongwe 3 Malawi
Awareness of New Jersey s Family Leave Insurance Program Is Low, Even As Public Support Remains High and Need Persists
 NEW JERSEY S FAMILY LEAVE INSURANCE PROGRAM A CENTER FOR WOMEN AND WORK ISSUE BRIEF OCTOBER 2012 Awareness of New Jersey s Family Leave Insurance Program Is Low, Even As Public Support Remains High and
Grain Stocks Estimates: Can Anything Explain the Market Surprises of Recent Years? Scott H. Irwin
 Grain Stocks Estimates: Can Anything Explain the Market Surprises of Recent Years? Scott H. Irwin http://nationalhogfarmer.com/weekly-preview/1004-corn-controversies-hog-market http://online.wsj.com/news/articles/sb10001424052970203752604576641561657796544
Video calling and video chat
 Video calling and video chat 19% of Americans have tried video calls or video chat or teleconferencing online and on cell phones By Lee Rainie, Director Kathryn Zickuhr, Web Coordinator 10/13/2010 http://pewinternet.org/reports/2010/video-chat.aspx
Danny R. Childers and Howard Hogan, Bureau of the,census
 MATCHING IRS RECORDS TO CENSUS RECORDS: SOME PROBLEMS AND RESULTS Danny R. Childers and Howard Hogan, Bureau of the,census A. INTRODUCTION This project has two principal aims: to investigate the feasibility
75 Washington Ave. Suite 206 Portland, ME 04101. (207) 767-6440 www.marketdecisions.com
 767-6440 www.marketdecisions.com") 75 Washington Ave. Suite 206 Portland, ME 04101 (207) 767-6440 www.marketdecisions.com Comprehensive Report 2014 Vermont Household Health Insurance Survey Vermont Department of Regulation, Insurance Division
75 Washington Ave. Suite 206 Portland, ME 04101 (207) 767-6440 www.marketdecisions.com Comprehensive Report 2014 Vermont Household Health Insurance Survey Vermont Department of Regulation, Insurance Division
WHO: Ebola Response Roadmap Situation Report 1 October 2014
 WHO: Ebola Response Roadmap Situation Report 1 October 2014 OVERVIEW The total number of probable, confirmed and suspected cases (see Annex 1) in the current outbreak of Ebola virus disease (EVD) in West
Discussion Paper: Conceptual difficulties in measuring retirement
 Discussion Paper: Conceptual difficulties in measuring retirement Geoff Bowlby Chief, Analysis and Special Projects, Labour Force Survey Statistics Canada Prepared for the Session on the Aging of the Workforce,
Working After Age 65
 ALTERNATIVE FEDERAL BUDGET 2012 TECHNICAL PAPER Working After Age 65 What is at Stake? Angella MacEwen Highlights The OAS and GIS combined today provide one third of the income of all seniors aged over
The Risk of Losing Health Insurance Over a Decade: New Findings from Longitudinal Data. Executive Summary
 The Risk of Losing Health Insurance Over a Decade: New Findings from Longitudinal Data Executive Summary It is often assumed that policies to make health insurance more affordable to the uninsured would
Survey of Family, Income and Employment Dynamics (Wave 2) September 2004
 September 2004") Embargoed until 10:45 am 04 November 2005 Survey of Family, Income and Employment Dynamics (Wave 2) September 2004 Highlights There were 578,600 people in a one parent with child(ren) family at some stage
Embargoed until 10:45 am 04 November 2005 Survey of Family, Income and Employment Dynamics (Wave 2) September 2004 Highlights There were 578,600 people in a one parent with child(ren) family at some stage
JEFFREY A. LOWE, ESQ. Global Practice Leader - Law Firm Practice Managing Partner - Washington, D.C.
 JEFFREY A. LOWE, ESQ. Global Practice Leader - Law Firm Practice Managing Partner - Washington, D.C. TABLE OF CONTENTS Background... 4 The Survey... 4 Methodology... 5 Statistical Terms Used... 6 Key Findings...
WFP SOUTH SUDAN MARKET PRICE MONITORING BULLETIN
 September 15 HIGHLIGHTS The exchange rate of SSP against the US dollar has reached an all-time low of.3 SSP to 1 US Dollar during the month of September driven by acute shortage of hard currency. This
Marc Cowling Weixi Liu
 BUSINESS GROWTH, ACCESS TO FINANCE, AND PERFORMANCE OUTCOMES IN THE RECESSION Marc Cowling Weixi Liu UNIVERSITY OF EXETER BUSINESS SCHOOL Table of Contents Acknowledgements 4 1 Introduction 5 The Study
Chapter 20: Analysis of Surveillance Data
 Analysis of Surveillance Data: Chapter 20-1 Chapter 20: Analysis of Surveillance Data Sandra W. Roush, MT, MPH I. Background Ongoing analysis of surveillance data is important for detecting outbreaks and
Cameroon CFSVA April/May 2011. Cameroon Comprehensive Food Security and Vulnerability Analysis. April/May 2011. Page 1
 Cameroon CFSVA April/May 2011 Cameroon Comprehensive Food Security and Vulnerability Analysis April/May 2011 Page 1 Cameroon CFSVA April/May 2011 Photo: Jane Howard Food insecurity high despite great agricultural
Christobel Deliwe Chakwana
 DOMESTIC VIOLENCE 5 5. INTRODUCTION Christobel Deliwe Chakwana The 2004 survey represents the first time the Malawi Demographic and Health Survey (MDHS) collected information on domestic. The inclusion
SIPP Core and Topical Modules Organization and Issues
 SIPP Core and Topical Modules Organization and Issues Jason Fields US Census Bureau Session 4: Designs that effectively mix global and detail information to reduce burden and measurement error. June 1-2,
Tablet Ownership 2013
 www.pewresearch.org JUNE 10, 2013 Tablet Ownership 2013 Tablet adoption has almost doubled over the past year. For the first time a third (34%) of American adults now own a tablet computer, including almost
Ebola Virus Disease Preparedness in Saskatchewan. Pacific Northwest Border Health Alliance Annual Workshop April 30, 2015
 Ebola Virus Disease Preparedness in Saskatchewan Pacific Northwest Border Health Alliance Annual Workshop April 30, 2015 Select Milestones Mar 23, 2014 Jul 28, 2014 Jul 29, 2014 Jul 31, 2014 Aug 6, 2014
FEED THE FUTURE LEARNING AGENDA
 FEED THE FUTURE LEARNING AGENDA OBJECTIVE OF THE LEARNING AGENDA USAID s Bureau of Food Security will develop Feed the Future s (FTF) Learning Agenda, which includes key evaluation questions related to
MEASURING INCOME DYNAMICS: The Experience of Canada s Survey of Labour and Income Dynamics
 CANADA CANADA 2 MEASURING INCOME DYNAMICS: The Experience of Canada s Survey of Labour and Income Dynamics by Maryanne Webber Statistics Canada Canada for presentation at Seminar on Poverty Statistics
This PDF is a selection from a published volume from the National Bureau of Economic Research
 This PDF is a selection from a published volume from the National Bureau of Economic Research Volume Title: Fiscal Policy and Management in East Asia, NBER-EASE, Volume 16 Volume Author/Editor: Takatoshi
ICI RESEARCH PERSPECTIVE
 ICI RESEARCH PERSPECTIVE 1401 H STREET, NW, SUITE 1200 WASHINGTON, DC 20005 202-326-5800 WWW.ICI.ORG OCTOBER 2014 VOL. 20, NO. 6 WHAT S INSIDE 2 Introduction 2 Which Workers Want Retirement Benefits? 2
Table 1. Active User Projections for Planned M-Banking Service
 Market Research MARKET SIZING OVERVIEW Market sizing is traditionally defined as estimating the number of buyers of a particular product, or users of a service. Because of the relative newness of mobile
Saving and Investing Among Higher Income African-American and White Americans
 The Ariel Investments 2010 Black Investor Survey: Saving and Investing Among Higher Income African-American and Americans July 21, 2010 1 For further information, contact Merrillyn J. Kosier at Ariel Investments
Population Aging Research Center. University of Pennsylvania. Mexican Migration to the US and Access to Health Care
 Population Aging Research Center University of Pennsylvania Mexican Migration to the US and Access to Health Care Sara Ross, José Pagán, and Daniel Polsky PARC Working Paper Series WPS 05-12 "The authors
Sources of Health Insurance and Characteristics of the Uninsured: Analysis of the March 2012 Current Population Survey
 September 2012 No. 376 Sources of Health Insurance and Characteristics of the Uninsured: Analysis of the March 2012 Current Population Survey By Paul Fronstin, Ph.D., Employee Benefit Research Institute
Learning New Tricks :
 APPSO BGS DACSO DEVSO Learning New Tricks : Midlife Learners from Public Post- Secondary Certificate, Diploma, and Associate Degree Programs Much has been written lately on B.C. s ageing workforce and
HOW BAD IS THE CURRENT RECESSION? LABOUR MARKET DOWNTURNS SINCE THE 1960s
 HOW BAD IS THE CURRENT RECESSION? LABOUR MARKET DOWNTURNS SINCE THE 1960s Executive summary The New Zealand economy experienced a fall in real GDP over the five quarters to March 2009 and further falls
Purpose of the water security outlook
 Water Security Outlook December 2015 Purpose of the water security outlook The Water Security Outlook (WSO) is an annual update to Barwon Water s Water Supply Demand Strategy (WSDS), published in 2012.
STATE OF THE ENVIRONMENT REPORT ON NAMIBIA S INDUSTRIALISATION ENVIRONMENT Final Report: 4 August 1999 D ENERGY INDICATORS
 D ENERGY INDICATORS Energy is a broad input into human settlements and activities. It is strongly linked to a nation s GDP. Energy indicators provide a measure of efficiency and sustainability in production
State of Working Britain
 State of Working Britain Aim is to Gives an up to date assessment of the performance of UK labour market, to highlight recent important developments seeks to describe and understand the major long-term
Chapter 3: Property Wealth, Wealth in Great Britain 2010-12
 Chapter 3: Property Wealth, Wealth in Great Britain 2010-12 Coverage: GB Date: 15 May 2014 Geographical Area: GB Theme: Economy Key Points Aggregate net property wealth for all private households in Great
Progress and prospects
 Ending CHILD MARRIAGE Progress and prospects UNICEF/BANA213-182/Kiron The current situation Worldwide, more than 7 million women alive today were married before their 18th birthday. More than one in three
MONTHLY COFFEE MARKET REPORT
 E MONTHLY COFFEE MARKET REPORT March 2013 Coffee prices stabilized in March 2013, with the monthly average of the ICO composite indicator price essentially unchanged on the previous month. Contrasting
The traditional work schedule for an
 A time to work: recent trends in work and flexible schedules Numerous U.S. workers have work schedules different from the standard 9 a.m.-to-5 p.m., Monday-through-Friday, work ; the demands of the industry
The Rise in Download Rate of Search & Email Use by Adults
 Search and email still top the list of most popular online activities Two activities nearly universal among adult internet users Kristen Purcell, Associate Director for Research, Pew Internet Project August
1 Associate Professor, Charles H. Dyson School of Applied Economics and Management, Cornell University, and
 Marketing Channel Assessment Tool (MCAT) Benchmark Performance Metrics Todd M. Schmit and Matthew N. LeRoux 1 NYFVI Final Report June 2014 Introduction Since 2008, 31 farms small- and medium-sized fruit
RETAIL FINANCIAL SERVICES
 Special Eurobarometer 373 RETAIL FINANCIAL SERVICES REPORT Fieldwork: September 211 Publication: April 212 This survey has been requested by the European Commission, Directorate-General Internal Market
First Home Buyers: The Big Picture
 First Home Buyers: The Big Picture April 2014 Key Points: There has been considerable coverage of late regarding the First Home Buyer (FHB) market share, with the widespread perception that this group
04of 2012. Income Shocks and Household Risk-Coping Strategies: The Role of Formal Insurance in Rural Vietnam POLICY BRIEF: Background
 POLICY BRIEF: 04of 2012 This policy brief is written based on the study entitled Income Shocks and Household Risk- Coping Strategies: The Role of Formal Insurance in Rural Vietnam written by researchers
RETAIL FINANCIAL SERVICES
 Special Eurobarometer 373 RETAIL FINANCIAL SERVICES REPORT Fieldwork: September 211 Publication: March 212 This survey has been requested by Directorate-General Internal Market and Services and co-ordinated
SOCIAL PROTECTION BRIEFING NOTE SERIES NUMBER 4. Social protection and economic growth in poor countries
 A DFID practice paper Briefing SOCIAL PROTECTION BRIEFING NOTE SERIES NUMBER 4 Social protection and economic growth in poor countries Summary Introduction DFID s framework for pro-poor growth sets out
OVERVIEW OF CURRENT SCHOOL ADMINISTRATORS
 Chapter Three OVERVIEW OF CURRENT SCHOOL ADMINISTRATORS The first step in understanding the careers of school administrators is to describe the numbers and characteristics of those currently filling these
By Melissa S. Kearney, Brad Hershbein, and Elisa Jácome The Hamilton Project
 PROFILES OF CHANGE: EMPLOYMENT, EARNINGS, AND OCCUPATIONS FROM 1990-2013 April 20, 2015 By Melissa S. Kearney, Brad Hershbein, and Elisa Jácome The Hamilton Project There has been tremendous focus in recent
Health Status, Health Insurance, and Medical Services Utilization: 2010 Household Economic Studies
 Health Status, Health Insurance, and Medical Services Utilization: 2010 Household Economic Studies Current Population Reports By Brett O Hara and Kyle Caswell Issued July 2013 P70-133RV INTRODUCTION The
Population, Health, and Human Well-Being-- Benin
 Population, Health, and Human Well-Being-- Benin Demographic and Health Indicators Benin Sub- Saharan Africa World Total Population (in thousands of people) 1950 2,046 176,775 2,519,495 2002 6,629 683,782
Prepared by: Andrew Sum Ishwar Khatiwada With Sheila Palma. Center for Labor Market Studies Northeastern University
 The Employment Experiences and College Labor Market Job Characteristics of Young Adult Associate Degree and Bachelor Degree Recipients in Massachusetts and the U.S. Prepared by: Andrew Sum Ishwar Khatiwada
Killed 2013 upper estimate Killed 2013 lower estimate Killed 2013 central estimate 700
 Statistical Release 12 February 2015 Estimates for reported road traffic accidents involving illegal alcohol levels: 2013 (second provisional) Self-reported drink and drug driving for 2013/14 Main findings
Seasonal Workers Under the Minnesota Unemployment Compensation Law
 Seasonal Workers Under the Minnesota Unemployment Compensation Law EDWARD F. MEDLEY* THE PAYMENT of unemployment benefits to seasonal has raised practical and theoretical problems since unemployment compensation
The relationship between insurance coverage and access to a regular source of health care
 The relationship between insurance coverage and access to a regular source of health care The relationship between insurance status and access to and use of health care services has been established in
Composition of Farm Household Income and Wealth
 Composition of Farm Household Income and Wealth Today it is rare for any household to receive all of its from a single source. Even when only one household member is employed, it is possible to earn from
BUILDING RECOVERY IN COMMUNITIES www.nta.nhs.uk
 For the small percentage of under- 18s who get into difficulties with drugs or alcohol, the problems can become significant SUBSTANCE MISUSE AMONG YOUNG PEOPLE 2011-12 BUILDING RECOVERY IN COMMUNITIES
Men retiring early: How How are they doing? Dave Gower
 Men retiring early: How retiring are they doing? early: How are they doing? Dave Gower During the first half of this century, men generally stayed in the labour force until at least age 65. In the second
REMITTANCE TRANSFERS TO ARMENIA: PRELIMINARY SURVEY DATA ANALYSIS
 REMITTANCE TRANSFERS TO ARMENIA: PRELIMINARY SURVEY DATA ANALYSIS microreport# 117 SEPTEMBER 2008 This publication was produced for review by the United States Agency for International Development. It
NATIONAL SURVEY OF HOME EQUITY LOANS
 NATIONAL SURVEY OF HOME EQUITY LOANS Richard T. Curtin Director, Surveys of Consumers Survey Research Center The October 1998 WP51 The 1988, 1994, and 1997 National Surveys of Home Equity Loans were sponsored
What Can We Learn by Disaggregating the Unemployment-Vacancy Relationship?
 What Can We Learn by Disaggregating the Unemployment-Vacancy Relationship? No. 1- Rand Ghayad and William Dickens Abstract: The Beveridge curve the empirical relationship between unemployment and job vacancies
SIERRA LEONE UPDATES FROM THE INSTANBUL PRIORITY AREAS OF ACTION
 SIERRA LEONE UPDATES FROM THE INSTANBUL PRIORITY AREAS OF ACTION 1 OUTLINE OF PRESENTATION Recent Developments Istanbul Priority Areas of Action Poverty Levels Agenda for Prosperity Challenges Conclusion
$10.85 billion. The recommended cost option for recovery & reconstruction. Estimated damage equivalent to 5.8% of Pakistan s 2009/2010 GDP
 Estimated damage equivalent to 5.8% of Pakistan s 29/21 GDP Maximum flood extent Jul. 31 - Sept. 28 Pakistan: Flooding Damage and Needs Overview for Key Humanitarian Sectors $1.85 billion The recommended
71% of online adults now use video sharing sites
 71% of online adults now use video sharing sites Kathleen Moore, Pew Internet Project 7/25/2011 http://pewinternet.org/reports/2011/video sharing sites.aspx Pew Research Center 1615 L St., NW Suite 700
Online Product Research
 Online Product Research 58% of Americans have researched a product or service online September 29, 2010 Jim Jansen, Senior Fellow, Pew Internet Project http://pewinternet.org/reports/2010/online-product-research.aspx
Student Income and Expenditure Survey 2007/08: Welsh-domiciled students
 SB 23/2009 21 April 2009 Student Income and Expenditure Survey 2007/08: Welsh-domiciled students This Bulletin presents summary results for Welsh domiciled students from the 2007/08 Student Income and
USING CURRENT POPULATION SURVEY DATA TO EXAMINE SCHOOL ADMINISTRATORS CAREERS
 Appendix D USING CURRENT POPULATION SURVEY DATA TO EXAMINE SCHOOL ADMINISTRATORS CAREERS The Current Population Survey (CPS) is a monthly household survey conducted by the Bureau of the Census for the
Over the past three decades, the share of middle-skill jobs in the
 The Vanishing Middle: Job Polarization and Workers Response to the Decline in Middle-Skill Jobs By Didem Tüzemen and Jonathan Willis Over the past three decades, the share of middle-skill jobs in the United
FCC Ag Economics: Farm Sector Health Drives Farm Equipment Sales
 FCC Ag Economics: Farm Sector Health Drives Farm Equipment Sales Fall 2015 FCC Ag Economics: Farm Sector Health Drives Farm Equipment Sales 1 Introduction Agriculture is always evolving. Average farm sizes