Cyclical Unemployment, Structural Unemployment
|
|
|
- Miles Paul
- 7 years ago
- Views:
Transcription
1 13TH JACQUES POLAK ANNUAL RESEARCH CONFERENCE NOVEMBER 8 9, 2012 Cyclical Unemployment, Structural Unemployment Peter Diamond Massachusetts Institute of Technology Paper presented at the 13th Jacques Polak Annual Research Conference Hosted by the International Monetary Fund Washington, DC November 8 9, 2012 The views expressed in this paper are those of the author(s) only, and the presence of them, or of links to them, on the IMF website does not imply that the IMF, its Executive Board, or its management endorses or shares the views expressed in the paper.

2 Mundell-Fleming Lecture Cyclical Unemployment, Structural Unemployment Peter Diamond November 8, 2012

3 since the U. S. recession was formally declared ended in June 2009 we see evidence of increased recruiting activity on the part of the business sector together with no apparent decline in the unemployment rate. One interpretation of this recent pattern is that matching jobs with workers has become more difficult in the wake of an exceptionally severe recession. If this is the case, then it is not immediately clear how monetary or fiscal policies might alleviate the problem. Annual Report, Federal Reserve Bank of St. Louis, 2010.

4 The Beveridge Curve (job openings vs. unemployment rate) (Seasonally adjusted)

5 Fitting Beveridge Curves During the Great Recession Source: Evaluating the role of labor market mismatch in rising unemployment Figure 2, by Gadi Barlevy, in 3Q/2011, Economic Perspectives.

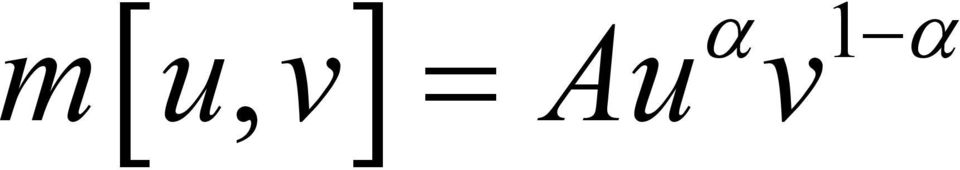
6 m[ u, v] = Au α v 1 α
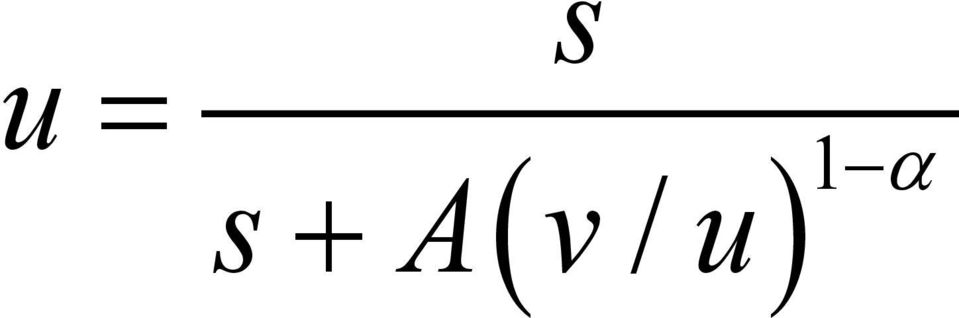
7 u s = s + Av u α ( / ) 1
8 Shift in Aggregate Activity (c) Source: Olivier Blanchard, Peter Diamond The Beveridge Curve Brookings Papers on Economic Activity, Vol No.1., Figure 3.

9 Computing Unemployment Response from Shock to Match Productivity A Source: Evaluating the role of labor market mismatch in rising unemployment Figure 4, by Gadi Barlevy, in 3Q/2011, Economic Perspectives.

10 Implied Match Productivity Using Data on New Hires, Source: Evaluating the role of labor market mismatch in rising unemployment Figure 3, by Gadi Barlevy, in 3Q/2011, Economic Perspectives. 9

11 Average Values of Gross Stocks and Flows for Employment, Unemployment, and Not in the Labor Force, January 1968 May 1986 Source: The Cyclical Behavior of the Gross Flows of U.S. Workers by Olivier Blanchard and Peter Diamond, Brookings Papers on Economic Activity, Vol. 2, 1990, page 92. Stock numbers are from the Current Population Survey (CPS). For flow data, authors used the Abowd-Zellner adjusted gross flow series. The original unadjusted numbers from the CPS appear in parentheses. All numbers are in millions. a. The variables E, U, and N represent employment, unemployment, and not in the labor force respectively. b. The bracketed stock figure for N equals the number of people who want a job.

12 Ratio of Flows into Employment, 1990:2-2012:9 3-Month Moving Average Source: CPS data from Haver Analytics; Flows adjusted using multiplicative factors from Bleakley, Ferris and Fuhrer (1999) 11

13 Ratio of Flows out of Employment, 1990:2-2012:9 3-Month Moving Average Source: CPS data from Haver Analytics; Flows adjusted using multiplicative factors from Bleakley, Ferris and Fuhrer (1999) 12

14 Flows Between Unemployment and Not in Labor Force, 1990:2-2012:9 3-Month Moving Average Source: CPS data from Haver Analytics; Flows adjusted using multiplicative factors from Bleakley, Ferris and Fuhrer (1999)

15 Gross Flows among Labor Market States with EE Flows, 1994 and (percent of population and percent of state in first month, monthly) Source: Bruce Fallick & Charles A. Fleischman, "Employer-to-employer flows in the U.S. labor market: the complete picture of gross worker flows," Finance and Economics Discussion Series , Board of Governors of the Federal Reserve System (U.S.).

16 Total Dominant Job Separations by Non-employment 1998:2 2010:2 (in thousands) Source: Job-To-Job Flows and the Business Cycle, Figure 1a, Henry Hyatt and Erica McEntarfer, U.S. Bureau of the Census, CES 12-04, March Notes: Shaded areas denote NBER recession quarters. Calculated from LEHD microdata, national employment histories for workers in nine states. 15

17 Quits, Layoffs, and Discharges (Seasonally adjusted, in thousands)

18 Employers with no recorded vacancies at month s end account for 45% of aggregate employment. At the same time, establishments reporting zero vacancies at month s end account for 42% of all hires in the following month. The Establishment-Level Behavior of Vacancies and Hiring, p. 2, by Steven J. Davis, R. Jason Faberman, and John C. Haltiwanger

19 Mean Vacancy Duration by Industry Industry Days Natural Resources & Mining 12.8 Construction 8.3 Manufacturing 19.3 Transport, Wholesale, Utilities 19.1 Retail Trade 13.7 Information 32.0 FIRE 29.0 Prof. & Business Services 20.4 Health & Education 35.4 Leisure & Hospitality 14.6 Other Services 18.8 Government 31.4 Source: The Establishment-Level Behavior of Vacancies and Hiring, Figure 3, by Steven J. Davis, R. Jason Faberman, and John C. Haltiwanger

20 Mean Vacancy Duration by Establishment Size Establishment Size Days 0-9 Employees Employees Employees Employees ,000-4,999 Employees ,000+ Employees 38.9 Source: The Establishment-Level Behavior of Vacancies and Hiring, Figure 3, by Steven J. Davis, R. Jason Faberman, and John C. Haltiwanger

21 Mean Vacancy Duration by Worker Turnover Category Industry Days First Quintile (lowest turnover) 87.9 Second Quintile 52.8 Third Quintile 32.8 Fourth Quintile 18.4 Fifth Quintile (highest turnover) 8.7 Source: The Establishment-Level Behavior of Vacancies and Hiring, Figure 3, by Steven J. Davis, R. Jason Faberman, and John C. Haltiwanger
22 Quarterly Job and Worker Flows for the U.S. Private Sector 1990:2-2009:4 (as a percent of employment) Other, e.g. Retirements Quits Layoffs 2 0 JOB CREATION JOB DESTRUCTION HIRES SEPARATIONS Notes: Series drawn from methodology used in Davis, Faberman and Haltiwanger (2010), Labor Market Flows in the Cross Section and Over Time. Series measured from Business Employment Dynamics (BED) and Job Openings and Labor Turnover Survey (JOLTS). Pre-2001:3 Hires, Separations, Layoffs and Quits are Model Based Estimates. Source: John Haltiwanger, personal communication
23 Quits, Layoffs, and Job Destruction Source: Labor Market Flows in the Cross Section and Over Time, Figure 1, by Steven J. Davis, R. Jason Faberman, and John C. Haltiwanger, in 2012, Journal of Monetary Economics
24 Hiring and Job Creation Source: Labor Market Flows in the Cross Section and Over Time, Figure 1, by Steven J. Davis, R. Jason Faberman, and John C. Haltiwanger, in 2012, Journal of Monetary Economics
25 Source: Is Structural Unemployment on the Rise, Figure 3, by Rob Valletta and Katherine Kuang, in , FRBSF Economic Letter
26 Source: Is Structural Unemployment on the Rise, Figure 4, by Rob Valletta and Katherine Kuang, in , FRBSF Economic Letter
Structural Unemployment
 No. 13-6 Structural Unemployment Peter Diamond Abstract: Whenever unemployment stays high for an extended period, it is common to see analyses, statements, and rebuttals about the extent to which the high
Analysis of the U.S. labor market is a difficult
 Openings and Labor Turnover Job Openings and Labor Turnover New tools for labor market analysis: JOLTS As a single, direct source for data on job openings, hires, and separations, the Job Openings and
NBER WORKING PAPER SERIES HIRING, CHURN AND THE BUSINESS CYCLE. Edward P. Lazear James R. Spletzer
 NBER WORKING PAPER SERIES HIRING, CHURN AND THE BUSINESS CYCLE Edward P. Lazear James R. Spletzer Working Paper 17910 http://www.nber.org/papers/w17910 NATIONAL BUREAU OF ECONOMIC RESEARCH 1050 Massachusetts
FRBSF ECONOMIC LETTER
 FRBSF ECONOMIC LETTER 2015-10 March 30, 2015 Majority of Hires Never Report Looking for a Job BY CARLOS CARRILLO-TUDELA, BART HOBIJN, PATRYK PERKOWSKI, AND LUDO VISSCHERS Every month, millions of workers
Which Industries are Shifting the Beveridge Curve?
 FEDERAL RESERVE BANK OF SAN FRANCISCO WORKING PAPER SERIES Which Industries are Shifting the Beveridge Curve? Regis Barnichon Federal Reserve Board of Governors Michael Elsby University of Michigan and
FRBSF ECONOMIC LETTER
 FRBSF ECONOMIC LETTER 010- November 8, 010 Is Structural Unemployment on the Rise? BY ROB VALLETTA AND KATHERINE KUANG An increase in U.S. aggregate labor demand reflected in rising job vacancies has not
WHAT AN INDICATOR OF LABOR DEMAND MEANS FOR U.S. LABOR MARKET ANALYSIS: INITIAL RESULTS FROM THE JOB OPENINGS AND LABOR TURNOVER SURVEY
 WHAT AN INDICATOR OF LABOR DEMAND MEANS FOR U.S. LABOR MARKET ANALYSIS: INITIAL RESULTS FROM THE JOB OPENINGS AND LABOR TURNOVER SURVEY Kelly A. Clark, Bureau of Labor Statistics 2 Massachusetts Ave. NE,
New Evidence on Job Vacancies, the Hiring Process, and Labor Market Flows
 New Evidence on Job Vacancies, the Hiring Process, and Labor Market Flows Steven J. Davis University of Chicago Econometric Society Plenary Lecture 3 January 2010, Atlanta Overview New evidence The role
Dice DFH Measure of National Mean Vacancy Duration, January 2001 to October 2014
 December 2014 Report Eight Job Vacancy Duration and Recruiting Intensity Hold Steady in October The Dice DFH Mean Vacancy Duration Measure stood at 24.5 working days in October, little changed from a revised
Analysis of JOLTS Research Estimates by Size of Firm
 Analysis of JOLTS Research Estimates by Size of Firm Katherine Bauer Klemmer 1 1 U.S. Bureau of Labor Statistics, 2 Massachusetts Ave. NE, Washington DC 2212 Abstract The Job Openings and Labor Turnover
Macroeconomics of the Labor Market
 Macroeconomics of the Labor Market By Christian Merkl CES-Lecture 1: Stylized Facts of the Labor Market Munich, August 2013 Outline 1 Labor markets and the business cycle 1. Stylized facts Descriptive
JOB OPENINGS AND LABOR TURNOVER APRIL 2015
 For release 10:00 a.m. (EDT) Tuesday, June 9, Technical information: (202) 691-5870 JoltsInfo@bls.gov www.bls.gov/jlt Media contact: (202) 691-5902 PressOffice@bls.gov USDL-15-1131 JOB OPENINGS AND LABOR
This article presents a simple framework
 Net flows in the U.S. labor market, 990 200 Except in the most recent recession, net flows were from unemployment to employment (even in previous recessions), from employment to not in the labor force
Recitation 9: Empirical Evidence on Labor Market Dynamics. 1. Unemployment and Vacancies over the Business Cycle
 14.461: Advanced Macroeconomics I Suman S. Basu, MIT Recitation 9: Empirical Evidence on Labor Market Dynamics Part II of 14.461 covers topics in the macroeconomic analysis of labor markets. The purpose
Web Appendix for Business Volatility, Job Destruction, and Unemployment
 **NOT INTENDED FOR PUBLICATION Web Appendix for Business Volatility, Job Destruction, and Unemployment By Steven J. Davis, R. Jason Faberman, John Haltiwanger, Ron Jarmin and Javier Miranda 1 August 2009
THE STATE OF THE ECONOMY
 THE STATE OF THE ECONOMY CARLY HARRISON Portland State University Following data revisions, the economy continues to grow steadily, but slowly, in line with expectations. Gross domestic product has increased,
How should policy respond to higher unemployment? Keywords: unemployment, mismatch, labor supply, unemployment insurance, monetary policy 0.45 0.
 Edward P. Lazear Stanford University, USA, and IZA, Germany Structural or cyclic? Labor markets in recessions How should policy respond to higher unemployment? Keywords: unemployment, mismatch, labor supply,
Top Ten Signs of Declining Business Dynamism and Entrepreneurship in the U.S.* John Haltiwanger University of Maryland and NBER.
 Top Ten Signs of Declining Business Dynamism and Entrepreneurship in the U.S.* By John Haltiwanger University of Maryland and NBER August 2015 * This paper was written for the Kauffman Foundation New Entrepreneurial
How To Calculate Size Class
 Employment dynamics: small and large firms over the business cycle The use of the dynamic-sizing approach to measuring employment growth by size of firm provides information useful in the debate on small
NBER WORKING PAPER SERIES LABOR MARKET FLOWS IN THE CROSS SECTION AND OVER TIME. Steven J. Davis Jason Faberman John C.
 NBER WORKING PAPER SERIES LABOR MARKET FLOWS IN THE CROSS SECTION AND OVER TIME Steven J. Davis Jason Faberman John C. Haltiwanger Working Paper 17294 http://www.nber.org/papers/w17294 NATIONAL BUREAU
This study is an extension of a research
 Business Employment Dynamics data: survival and longevity, II A study that extends previous research on the longevity of businesses shows that survival decreases at a decreasing rate; establishments that
Measuring Innovation: Building a Data Infrastructure
 Measuring Innovation: Building a Data Infrastructure Ron Jarmin Asst. Dir. for Research and Methodology U.S. Census Bureau Prepared for Inside the Black Box Workshop Santa Fe Institute 8/20/2013 Disclaimer:
What Can We Learn by Disaggregating the Unemployment-Vacancy Relationship?
 What Can We Learn by Disaggregating the Unemployment-Vacancy Relationship? No. 1- Rand Ghayad and William Dickens Abstract: The Beveridge curve the empirical relationship between unemployment and job vacancies
San Diego Labor Market and Economic Overview
 San Diego Labor Market and Economic Overview Laura Choi, Federal Reserve Bank of San Francisco April 24, 2013 San Diego Banker CRA Roundtable The views expressed in this presentation are my own and do
Quarterly Economics Briefing
 Quarterly Economics Briefing March June 2015 2016 Review of Current Conditions: The Economic Outlook and Its Impact on Workers Compensation The exhibits below are updated to reflect the current economic
Economic Forecast OUTPUT AND EMPLOYMENT WHAT THE TABLE SHOWS:
 Economic Forecast OUTPUT AND EMPLOYMENT 7 8 9 5 United States Real GDP $ billions (fourth quarter) $,996 $,575 $,5 $,9 $5, $5,5 $5,9 $6,5 $7, % change over the four quarters.9% -.8% -.%.8%.%.%.6%.5%.8%
BUSINESS EMPLOYMENT DYNAMICS FIRST QUARTER 2015
 For release 10:00 a.m. (EST), Wednesday, November 18, 2015 USDL-15-2204 Technical Information: (202) 691-6553 BDMInfo@bls.gov www.bls.gov/bdm Media Contact: (202) 691-5902 PressOffice@bls.gov BUSINESS
Did the Job Ladder Fail After the Great Recession?
 Did the Job Ladder Fail After the Great Recession? Giuseppe Moscarini Yale University and NBER Fabien Postel-Vinay University College London and Sciences Po, Paris February 2015 Abstract We study employment
Labour Market Dynamics in Germany: Hirings, Separations, and Job-to-Job Transitions over the Business Cycle
 Labour Market Dynamics in Germany: Hirings, Separations, and Job-to-Job Transitions over the Business Cycle Ronald Bachmann RWI Essen June 3, 2007 Abstract This paper analyses the cyclical properties of
Unemployment. AS Economics Presentation 2005
 Unemployment AS Economics Presentation 2005 Key Issues The meaning of unemployment Different types of unemployment Consequences of unemployment Unemployment and economic growth Recent trends in UK unemployment
Economic Forecast OUTPUT AND EMPLOYMENT WHAT THE TABLE SHOWS:
 Economic Forecast OUTPUT AND EMPLOYMENT 7 8 9 1 11 1 13 1 15 United States Real GDP $ billions (fourth quarter) $1,996 $1,575 $1,5 $1,9 $15, $15,5 $15,9 $16,51 $17,1 % change over the four quarters 1.9%
Three Challenges in the U.S. Labor Market: Participation, Inequality, and Fluidity. Jason Furman Chairman, Council of Economic Advisers
 Three Challenges in the U.S. Labor Market: Participation, Inequality, and Fluidity Jason Furman Chairman, Council of Economic Advisers World Bank Group January 28, 2016 Overview 1. Strength of the Labor
Economic Forecast OUTPUT AND EMPLOYMENT WHAT THE TABLE SHOWS:
 Economic Forecast OUTPUT AND EMPLOYMENT 7 8 9 1 11 1 13 1 1 United States Real GDP $ billions (fourth quarter) $1,996 $1,7 $1, $1,9 $1, $1, $1,9 $16,1 $17,1 % change over the four quarters 1.9% -.8% -.%.8%.%.%.6%
Hawaii New Business Formation an analysis of business birth, deaths, and survival rates
 an analysis of business birth, deaths, and survival rates November 2014 1 P a g e Table of Contents EXECUTIVE SUMMARY 3 I. INTRODUCTION 7 II. BIRTHS AND DEATHS OF HAWAII BUSINESS ESTABLISHMENTS 10 III.
Variable Compensation. Total Compensation
 VARIABLE COMPENSATION AS A PERCENTAGE OF TOTAL COMPENSATION: Variable compensation as a percentage of total compensation is a measurement that demonstrates how much of an organization s total compensation
Economic Update as of June 30, 2016
 MACRO Report: Review of Wyoming s Economy Economic Update as of June 30, The MACRO Report is a quarterly publication comprised of charts focusing on energy, employment, state revenues, and other indicators
Where Have All the Young Firms Gone?
 BUSINESS DYNAMICS STATISTICS BRIEFING: Sixth in a series of reports using data from the U.S. Census Bureau s Business Dynamics Statistics May 2012 John Haltiwanger University of Maryland Ron Jarmin U.S.
New Jersey Private Sector Employment Up by 57,500 Jobs Over the Past Year Preliminary Data: July Employment Contracts
 Media Contact Amanda Pisano 609-984-2841 EMAIL: MediaCalls@dol.state.nj.us New Jersey Private Sector Employment Up by 57,500 Jobs Over the Past Year Preliminary Data: July Employment Contracts TRENTON,
Discussion of Bacchetta, Benhima and Poilly : Corporate Cash and Employment
 Summary Discussion of Bacchetta, Benhima and Poilly : Corporate Cash and Employment Vivien Lewis (KU Leuven) "New Developments in Business Cycle Analysis : The Role of Labor Markets and International Linkages"
Economic Forecast OUTPUT AND EMPLOYMENT WHAT THE TABLE SHOWS:
 Economic Forecast OUTPUT AND EMPLOYMENT 7 8 9 1 11 1 13 1 United States Real GDP $ billions (fourth quarter) $1,996 $1,575 $1,5 $1,9 $15, $15,5 $15,97 $16,6 % change over the four quarters 1.9% -.8% -.%.8%.%.%.%
Case Study of Unemployment Insurance Reform in North Carolina
 Case Study of Unemployment Insurance Reform in North Carolina Marcus Hagedorn Fatih Karahan Iourii Manovskii Kurt Mitman Updated: March 25, 2014 Abstract In July 1, 2013 unemployed workers in North Carolina
Commonwealth of Virginia Job Vacancy Survey 2011-2012
 a Commonwealth of Virginia Job Vacancy Survey 2011-2012 Prepared for: Virginia Employment Commission Richmond, Virginia Prepared by: Virginia Center for Urban Development and the Survey and Evaluation
Gini in a Bottle: The Mathematics of Income Inequality
 Gini in a Bottle: The Mathematics of Income Inequality Rich Beveridge Clatsop Community College rbeveridge@clatsopcc.edu https://www.clatsopcc.edu/rich-beveridges-homepage Statistics and Social Justice
Wyoming s Economy Today and Beyond
 Wyoming s Economy Today and Beyond Presented by: Buck McVeigh Economic Analysis Division Wyoming State Government Current Economic Conditions Favorable: Energy: production and prices State revenues: primarily
Volume Title: Producer Dynamics: New Evidence from Micro Data. Volume Author/Editor: Timothy Dunne, J. Bradford Jensen, and Mark J.
 This PDF is a selection from a published volume from the National Bureau of Economic Research Volume Title: Producer Dynamics: New Evidence from Micro Data Volume Author/Editor: Timothy Dunne, J. Bradford
The Recent Evolution of the Natural Rate of Unemployment
 D I S C U S S I O N P A P E R S E R I E S IZA DP No. 5832 The Recent Evolution of the Natural Rate of Unemployment Mary Daly Bart Hobijn Rob Valletta July 2011 Forschungsinstitut zur Zukunft der Arbeit
Engrossed Substitute Senate Bill 5373: Professional Employers Organizations A report to the Governor and Legislature December 2010
 Engrossed Substitute Senate Bill 5373: Professional Employers Organizations A report to the Governor and Legislature December 2010 Prepared by the Employment Security Department Budget, Performance & Research
Did the Job Ladder Fail After the Great Recession?
 Did the Job Ladder Fail After the Great Recession? Giuseppe Moscarini Yale University and NBER Fabien Postel-Vinay UCL, IFS and CfM August 2013 Abstract We study employment reallocation across heterogeneous
Economic Forecast OUTPUT AND EMPLOYMENT WHAT THE TABLE SHOWS:
 Economic Forecast OUTPUT AND EMPLOYMENT 7 8 9 1 11 1 1 1 15 United States Real GDP $ billions (fourth quarter) $1,996 $1,575 $1,5 $1,9 $15, $15,5 $15,9 $16,51 $17,1 % change over the four quarters 1.9%
The economic cost of unfilled jobs in the U.S. November 2014. Nearly. $160Bper year
 The economic cost of unfilled jobs in the U.S. November 2014 Nearly $160Bper year The economic costs of unfulfilled jobs in the U.S. Key Findings 2M While total employment has now almost caught up to its
Economics 212 Principles of Macroeconomics Study Guide. David L. Kelly
 Economics 212 Principles of Macroeconomics Study Guide David L. Kelly Department of Economics University of Miami Box 248126 Coral Gables, FL 33134 dkelly@miami.edu First Version: Spring, 2006 Current
Numbers as pictures: Examples of data visualization from the Business Employment Dynamics program. October 2009
 Numbers as pictures: Examples of data visualization from the Business Employment Dynamics program. October 2009 Charles M. Carson 1 1 U.S. Bureau of Labor Statistics, Washington, DC Abstract The Bureau
Labor Market and Unemployment Ing. Mansoor Maitah Ph.D.
 Labor Market and Unemployment Ing. Mansoor Maitah Ph.D. Product and Factor Markets Demand for Goods and Services Market of Goods and Services S D Supply of Goods and Services Households Firms Supply of
Economic Indicators Dashboard
 Dashboard City of Seattle as of 1. Business Income 2010 2011 Change Business income Update (billions, 2010$) $52.1 $53.8 3.3% The Seattle Dashboard reports current and recent data for the following five
Recent years have brought many changes
 Implementing the North American Industry Classification System at BLS This new classification system is a more viable way of classifying industries and tracking new businesses and changes in economic activity;
Online Job Search and Unemployment Insurance during the Great Recession
 Online Job Search and Unemployment Insurance during the Great Recession Ioana Marinescu, University of Chicago Abstract The 2007 2009 U.S. recession led to large increases in the potential duration of
Women and Men in the Recovery: Where the Jobs Are Women Recover Jobs Lost in Recession in Year Five
 IWPR #C426 November 2014 Women and Men in the Recovery: Where the Jobs Are Women Recover Jobs Lost in Recession in Year Five Heidi Hartmann, Ph.D., Elyse Shaw, and Rachel O Connor Overview While the number
Defined Contribution Plan Participants Activities, First Three Quarters of 2014
 ICI RESEARCH REPORT Defined Contribution Plan Participants Activities, First Three Quarters of 2014 FEBRUARY 2015 Copyright 2015 by the Investment Company Institute. All rights reserved. The Investment
What Happens During Recessions, Crunches, and Busts?
 9TH JACQUES POLAK ANNUAL RESEARCH CONFERENCE NOVEMBER 13-14, 2008 What Happens During Recessions, Crunches, and Busts? Stijn Claessens International Monetary Fund and Ayhan Kose International Monetary
LECTURE NOTES ON MACROECONOMIC PRINCIPLES
 LECTURE NOTES ON MACROECONOMIC PRINCIPLES Peter Ireland Department of Economics Boston College peter.ireland@bc.edu http://www2.bc.edu/peter-ireland/ec132.html Copyright (c) 2013 by Peter Ireland. Redistribution
Employment and Unemployment
 Employment and Unemployment A2 Economics, Autumn 2010 Measuring Unemployment A Working Definition of Unemployment People able, available and willing to find work and actively seeking work but not employed
Solving the Retirement Crisis in West Virginia
 Policy Brief www.wvpolicy.org October 2014 Solving the Retirement Crisis in West Virginia Sean O Leary As thousands of West Virginians approach retirement age, workplace retirement plans, along with Social
Last Hired, First Fired? Black-White Unemployment and the Business Cycle
 DISCUSSION PAPER SERIES IZA DP No. 3713 Last Hired, First Fired? Black-White Unemployment and the Business Cycle Kenneth A. Couch Robert Fairlie September 2008 Forschungsinstitut zur Zukunft der Arbeit
FRBSF ECONOMIC LETTER
 FRBSF ECONOMIC LETTER 15-16 May 18, 15 The Puzzle of Weak First-Quarter GDP Growth BY GLENN D. RUDEBUSCH, DANIEL WILSON, AND TIM MAHEDY The official estimate of real GDP growth for the first three months
Grand Challenges Making Drill Down Analysis of the Economy a Reality. John Haltiwanger
 Grand Challenges Making Drill Down Analysis of the Economy a Reality By John Haltiwanger The vision Here is the vision. A social scientist or policy analyst (denoted analyst for short hereafter) is investigating
Data Appendix for Firm Age, Investment Opportunities, and Job Creation
 Data Appendix for Firm Age, Investment Opportunities, and Job Creation Manuel Adelino Fuqua School of Business Duke University Song Ma Fuqua School of Business Duke University September 21, 2015 David
Does Unemployment Insurance Inhibit Job Search?
 Does Unemployment Insurance Inhibit Job Search? July 2010 Report by the U.S. Congress Joint Economic Committee Representative Carolyn Maloney, Chair The principal purpose of the unemployment insurance
U.S. ECONOMIC ACTIVITY. http://www.dallasfed.org
 U.S. ECONOMIC ACTIVITY 1-month % change 1.5 Nominal Personal Consumption Expenditures 1.0 0.5 0.0-0.5-1.0-1.5 Aug-29-release, Jul = 0.33 Source: Bureau of Economic Analysis 1-month % change 1.0 Real Personal
U.S. ECONOMIC ACTIVITY. http://www.dallasfed.org
 U.S. ECONOMIC ACTIVITY Index of Leading Economic Indicators 140 Index 130 120 110 100 90 80 70 1998 1999 2000 2001 2002 2003 2004 2005 2006 Recession Leading Index (Aug-18-release, Jul = 124.3) Source:

Historically, employment in financial
 Employment in financial activities: double billed by housing and financial crises The housing market crash, followed by the financial crisis of the 2007-09 recession, helped depress financial activities
Online job search and unemployment insurance during the Great Recession
 Online job search and unemployment insurance during the Great Recession Ioana Marinescu, University of Chicago [PRELIMINARY; DO NOT QUOTE WITHOUT AUTHOR S PERMISSION.] Abstract The 2007 2009 U.S. recession
Northeast Minnesota Labor Market Trends Pathways 2 Postsecondary Summit October 10, 2014
 Northeast Minnesota Labor Market Trends Pathways 2 Postsecondary Summit October 10, 2014 Cameron Macht Regional Analysis & Outreach Manager Minnesota Dept. of Employment & Economic Development Labor Market
Agenda. Business Cycles. What Is a Business Cycle? What Is a Business Cycle? What is a Business Cycle? Business Cycle Facts.
 Agenda What is a Business Cycle? Business Cycles.. 11-1 11-2 Business cycles are the short-run fluctuations in aggregate economic activity around its long-run growth path. Y Time 11-3 11-4 1 Components
NBER WORKING PAPER SERIES LONG-TERM DAMAGE FROM THE GREAT RECESSION IN OECD COUNTRIES. Laurence M. Ball
 NBER WORKING PAPER SERIES LONG-TERM DAMAGE FROM THE GREAT RECESSION IN OECD COUNTRIES Laurence M. Ball Working Paper 20185 http://www.nber.org/papers/w20185 NATIONAL BUREAU OF ECONOMIC RESEARCH 1050 Massachusetts
Matching effi ciency and business cycle fluctuations
 Matching effi ciency and business cycle fluctuations Francesco Furlanetto Norges Bank Nicolas Groshenny Reserve Bank of New Zealand and CAMA January 212 (Preliminary) Abstract A large decline in matching
I. HEALTH ASSESSMENT B. SOCIOECONOMIC CHARACTERISTICS
 I. B. SOCIOECONOMIC CHARACTERISTICS 1. HOW FINANCIALLY SECURE ARE RESIDENTS OF DELAWARE? Delaware residents median household incomes are lower than comparison communities but higher than national norms.
U.S. ECONOMIC ACTIVITY. http://www.dallasfed.org
 U.S. ECONOMIC ACTIVITY Purchasing Managers Index Index 65 60 55 50 45 40 35 30 Aug-01-release, Jul = 52.6 Source: Institute for Supply Management Real Value of the Dollar March 1973 = 100 120 110 100 90
Determination of the December 2007 Peak in Economic Activity
 Page 1 of 6 This report is also available as a PDF file. Determination of the December 2007 Peak in Economic Activity The Business Cycle Dating Committee of the National Bureau of Economic Research met
CONSUMER EXPENDITURES 2014
 For release: 10:00 a.m. (EDT), Thursday, September 3, 2015 USDL-15-1696 Technical Information: (202) 691-6900 CEXInfo@bls.gov www.bls.gov/cex Media Contact (202) 691-5902 PressOffice@bls.gov CONSUMER EXPENDITURES
Capital Markets Review Q3 2010
 Capital Markets Review Q3 2010 Reviewing the quarter ended June 30, 2010 Ross Marino, CFP, ChFC 210-4 Avondale Ave. Wilmington, NC 28403 www.rossmarino.com Material prepared by Raymond James for use by
Further Discussion of Temporary Payroll Tax Cut During Recession(s) Mark Bils and Pete Klenow, December 12, 2008
 Mark Bils and Pete Klenow, December 12, 2008") Further Discussion of Temporary Payroll Tax Cut During Recession(s) Mark Bils and Pete Klenow, December 12, 2008 We focus on three aspects of a cut in payroll taxes as a stabilizer in a recession: (1)
Further Discussion of Temporary Payroll Tax Cut During Recession(s) Mark Bils and Pete Klenow, December 12, 2008 We focus on three aspects of a cut in payroll taxes as a stabilizer in a recession: (1)
St. Louis Region Labor Market Analysis
 St. Louis Region Labor Market Analysis The St. Louis Region is situated on the east of the State of Missouri and borders the State of Illinois. Included in the St. Louis Region are the counties of Franklin,
The Impact of the Medicare Drug Benefit on Health Care Spending by Older Households
 The Impact of the Medicare Drug Benefit on Health Care Spending by Older Households Dean Baker and Ben Zipperer December 2008 Center for Economic and Policy Research 1611 Connecticut Avenue, NW, Suite
Unemployment and Inflation
 Unemployment and Inflation Unemployment Inflation Costs of Unemployment Personal Cost Loss of income Loss of self-esteem Increase in stress related psychological problems Increase in incidence of crime,
Economic Forecast OUTPUT AND EMPLOYMENT WHAT THE TABLE SHOWS:
 June, Economic Forecast OUTPUT AND EMPLOYMENT 7 8 9 5 United States Real GDP $ billions (fourth quarter) $,996 $,575 $,5 $,9 $5, $5,5 $5,9 $6,5 $7, % change over the four quarters.9% -.8% -.%.8%.%.%.6%.5%.8%
Why Has Japan Been Hit So Hard by the Global Recession?
 IMF STAFF POSITION NOTE March 18, 9 SPN/9/5 Why Has Been Hit So Hard by the Global Recession? Martin Sommer I N T E R N A T I O N A L M O N E T A R Y F U N D INTERNATIONAL MONETARY FUND Why Has Been Hit
FRBSF ECONOMIC LETTER
 FRBSF ECONOMIC LETTER 01-1 April, 01 Commercial Real Estate and Low Interest Rates BY JOHN KRAINER Commercial real estate construction faltered during the 00 recession and has improved only slowly during
US Labour Market Monitor July report set to attract much attention as both employment and growth have slowed in 2016
 Investment Research General Market Conditions 02 August 2016 US Labour Market Monitor July report set to attract much attention as both employment and growth have slowed in 2016 Jobs report preview We
Demographic / Economic Indicators
 Demographic / Economic Indicators D.C. U.S.A. Population, July 1, 2004 estimate 553,523 293,655,404 Population, percent change -3.2% 4.3% (April 1, 2000-July 1, 2004) Persons under 18 years old, 2000 20.1%
Trends In Long-term Unemployment
 MARCH 2015 Trends In Long-term Unemployment Karen Kosanovich and Eleni Theodossiou Sherman Long-term unemployment reached historically high levels following the Great Recession of 2007 2009. Both the number
Discussion Paper Series Number 258
 Edinburgh School of Economics Discussion Paper Series Number 258 The Extent and Cyclicality of Career Changes: Evidence for the U.K. Carlos Carrillo-Tudela (University of Essex, CEPR, CESifo and IZA) Bart
Non Farm Payroll Employment Developments among States during the Great Recession and Jobless Recovery
 Non Farm Payroll Employment Developments among States during the Great Recession and Jobless Recovery Prepared by: Paul E. Harrington and Neeta P. Fogg Center for Labor Markets and Policy, Drexel University
ECONOMIC SNAPSHOT. A Summary of the San Diego Regional Economy UNEMPLOYMENT
 A Summary of the San Diego Regional Economy Brought to you by San Diego Regional EDC analyzes key economic metrics that are important to understanding the regional economy and San Diego s standing relative
Young Businesses, Economic Churning, and Productivity Gains
 TURMOIL AND GROWTH: Young Businesses, Economic Churning, and Productivity Gains June 2008 Steven J. Davis University of Chicago John Haltiwanger University of Maryland Ron Jarmin U.S. Bureau of the Census
Jobs In Maine. Online Job Postings by Industry, Occupation, Skills, and Education
 Jobs In Maine Online Job Postings by Industry, Occupation, Skills, and Education third quarter 2013 December 2013 Online Job Postings by Industry, Occupation, Skills, and Education third quarter 2013
Workforce Last updated: October 2014
 Workforce Last updated: October 2014 Downtown Seattle offers the region's highest concentration of jobs. Downtown Seattle has the highest employment density in Seattle. It also has a large share of jobs.
EQUILIBRIUM IN THE LABOUR MARKET WITH SEARCH FRICTIONS
 EQUILIBRIUM IN THE LABOUR MARKET WITH SEARCH FRICTIONS Prize Lecture, December 8, 2010 by CHRISTOPHER A. PISSARIDES 1 London School of Economics, UK. Research in the economics of the labour market when
FRBSF ECONOMIC LETTER
 FRBSF ECONOMIC LETTER 213-23 August 19, 213 The Price of Stock and Bond Risk in Recoveries BY SIMON KWAN Investor aversion to risk varies over the course of the economic cycle. In the current recovery,
Governor Walker's Tax Reform Initiative. Wisconsin Department of Revenue February 2013
 Governor Walker's Tax Reform Initiative Wisconsin Department of Revenue February 2013 1 Tax Reform Goals Reduce Wisconsin's high tax burden Put more money in people's pockets Make Wisconsin more competitive