ESPON project Study on Urban Functions
|
|
|
- Annabella Taylor
- 11 years ago
- Views:
Transcription

 LATTS Laboratoire Techniques, Territoires, Sociétés Ecole Nationale des Ponts et Chaussées (France) Experts: TSAC Department of Geography,")
1 ESPON project Study on Urban Functions Final Report March 2007 TPG members Lead Partner: IGEAT Institut de Gestion de l Environnement et d Aménagement du Territoire, Université Libre de Bruxelles (Belgium) Partners: IGSO Institute of Geography and Spatial Organization Polish Academy of Sciences (Poland) LATTS Laboratoire Techniques, Territoires, Sociétés Ecole Nationale des Ponts et Chaussées (France) Experts: TSAC Department of Geography, Tourism and Territorial Planning, Oradea University (Romania) 1 Co-financed by the European Community through the Interreg III ESPON Programme
 LATTS Laboratoire Techniques, Territoires, Sociétés Ecole Nationale des Ponts et Chaussées (France) Experts: TSAC Department of Geography,")
2 ESPON project Study on Urban Functions Final Report March

3 This report does not necessarily reflect the opinion of the members of the Monitoring Committee. This basic report exists only in an electronic version. ISBN The ESPON Monitoring Committee and the partners of the projects mentioned. Printing, reproduction or quotation is authorized provided the source is acknowledged and a copy is forwarded to the ESPON Coordination Unit in Luxembourg. 3

4 Table of contents Table of Contents Part 1. Reminder of the project programme... 7 Part 2. Executive Summary... 8 Part 3. Characterization of the Functional Urban Areas First: Identification of the FUAs on the basis of their demographic weight Methodology for the morphological study Second: Characterisation of the FUAs functions Methodology for the Functional study List of the Functional Urban Areas on the morphological base Austria Belgium Bulgaria Cyprus Czech Republic Denmark Estonia Finland France Germany Greece Hungary Ireland Italy Latvia Lithuania Luxemburg Malta The Netherlands Norway Poland Portugal Romania Slovak Republic Slovenia Spain Sweden Switzerland United Kingdom Maps of the European FUAs from the morphological point of view Transborder FUAs Typology of the transborder FUAs The European transborder FUAs Map of the transborder FUAs The Morphological Polycentricity Measuring the morphological polycentricity of the European urban pattern Polycentricity and economic efficiency The Functional measures of the FUAs The functional data The Maps The measure of polycentricity with the functions Part 4. Discussion on the polycentricity issue Part 5. Comments on ESPON final report

5 Table of contents 7. Overview of the comments on the final report ESPON project by the Monitoring Committee and the ECP network Comments by Monitoring Committee Members Comments by the ESPON Contact Points network Criticisms of Espon An unclear scientific position Conceptual issues on polycentricity and functional specialisation Measures Methodological issues Part 6. Conclusion and Propositions for future research General reflection Polycentricity scales and political stakes Recommendations for future researches References List of Figures Figure 1 Figure 2 Functional Urban Areas according to their population FUA distribution inside and outside the poly-fua Figure 3 FUA distribution inside and outside the poly-fua (zoom) Figure 4 type 1 transborder FUA Figure 5 type 2 transborder FUA Figure 6 type 3 transborder FUA Figure 7 type 4 transborder FUA Figure 8 type 5 transborder FUA Figure 9 type 6 transborder FUA Figure 10 type 7 transborder FUA Figure 11 A transborder FUA type without contiguity Figure 12 A city divided by a border transborder type Figure 13 Transborder FUAs and their types Figure 14 Indicator of morphological polycentricity by country Figure 15 Indicator of morphological polycentricity by region Figure 16 Economic growth and monocentrism at the scale of the macro-regions ( ) Figure 17 Economic growth and monocentrism at the scale of the macro-regions ( ) Figure 18 Economic growth by comparison to the national performances in each country and monocentrism at the scale of the macro-regions ( ) Figure 19 The large cities, the metropolises and the MEGAs according to their population Figure 20 The large cities and the metropolises (cities gathered inside the polycentric areas) according to their population Figure 21 The large cities, the metropolises and the MEGAs according to their GDP Figure 22 The large cities and the metropolises (cities gathered inside the polycentric areas) according to their GDP Figure 23 The FUAs according to the functional criteria (Global score) Figure 24 The decision specificity of the FUAs Figure 25 The administrative specificity of the FUAs Figure 26 The knowledge specificity of the FUAs Figure 27 The transport specificity of the FUAs Figure 28 The tourism specificity of the FUAs Figure 29 Bad correlation between morphological and functional polycentricity Figure 30 Belgium Figure 31 France and Germany Figure 32 Western central France

6 Table of contents Figure 33 Relation between the intial indicators and the first two components of the PCA analysis on the major FUA Figure 34 International connections and economic structure of the biggest European FUAs List of Tables Table 1 Methodology to measure the functionality...26 Table 2 Level of polycentricity in the European macro-regions and countries Table 3 Coefficient of correlation between monocentrism and economic growth Table 4 Selected data on Functional Urban Areas (FUAs) Table 5 Ranking of the European MEGAs and polycentric MEGAs according to their population and GDP 243 Table Table 6 Qualitative ranking of the main MEGAs and polycentric MEGAs (Business and Transport international connectivity and heritage) Table 7 Main characteristics of the economic structure of the MEGAs and polycentric MEGAs
...228 Table 5 Ranking of the European MEGAs and polycentric MEGAs according to their population and GDP 243 Table 5.")
7 Reminder of the project programme Part 1. Reminder of the project programme The Espon project was initially organised in 5 main parts: 1. Assessment of the results of Espon Identification and delimitation of the Functional Urban Areas (FUA) in Europe (29 countries) 3. Measure of the Functional Specialization and updating of the typology of the FUAs 4. Discussion on the Polycentricity issue 5. Proposition for further research (Espon II future programme). This project had its kick-off meeting on March and is intended to finish by the end of October
.")
8 Executive Summary Part 2. Executive Summary Espon has produced an exhaustive list of the Functional Urban Areas (FUAs) for 29 European countries. Globally this list appears to be correct but some errors have been made, according to the criticisms made on the final report by the Espon Contact Points. We don t intend - nor have the mission - to establish a new exhaustive list of the FUAs but we have enhanced the methodology to incorporate the Morphological Urban Areas (MUAs) of the cities in the definition of the FUAs. We have thus started to list the European cities on a morphological base by selecting the FUAs (from the Espon list) with more than 50,000 inhabitants and characterizing them at the NUTS-5 level, using the NUTS-5 database developed by Nordregio and IRPUD for the European commission. From this database we have extracted the number of inhabitants and the areas for each NUTS-5 unit and put them on a map of Europe. Creating this list of all the NUTS 5-units contained in each European MUA and in the FUAs of some countries will be our main contribution to the study of the European urban network. By lack of data during the time of the project we haven t been able to define the FUA areas in NUTS-5 units for a majority of countries. Nevertheless this can still be done later and the database can be completed and corrected if necessary. These data can be used to support other studies in the future and allows already further researches on the core cities of the FUAs. It has appeared to us that the characterization of the FUAs should include the chraracterization of the Morphological Urban Areas (MUAs) inside them. Of course, the FUA, which corresponds to the employment pools, is an essential concept in functional terms and imposes itself more and more in a context of suburbanisation and growing mobility of active populations. However, the MUA, as a dense and coherent morphological whole, remains an essential concept: with identical populations, it clearly appears that FUAs which have better opportunities are those having a strong MUA in their centre, especially if the latter has some good quality historical and cultural heritage. This is an important element in the new forms of cross-city competitiveness. We have also included in the study the characterization of the transborder FUAs, which are essential in the European dimension. Finally, in order to stay close to that European perspective we have used the same homogenous criteria for every country (see the morphological areas methodology). MUAs and FUAs delineation Basically a city is organised around a densely populated node, with a true urban landscape and even better a historical core. Therefore, we have approached those characteristics by considering at first all the municipalities (NUTS-5 level) with more than 650 inhab./km2. Then all the contiguous municipalities with this threshold of density, as well as the municipalities not reaching the threshold but enclosed by the others, were added to define central or morphological urban areas. However, in some cases, municipalities have a true urban character but are not reaching the level of 650 inhab./km!, due for instance to some specificities of the delimitation of the municipality (a very large municipal territory; a large part of the territory occupied by a lake, or mountains or forests ). Therefore we have also taken into consideration all the municipalities with more than 20,000 inhabitants, whenever they have a clear concentrated morphological core. Besides their morphological character, cities are also employment cores, surrounded by a labour pool. This functional dimension becomes more and more significative, as commuting 8

9 Executive Summary and suburbanisation are growing. These functional urban regions (FUAs) are in principle defined in ESPON on this base of the labour basins of the morphological urban areas. But in fact, the data provided by the ESPON study don't seem to follow strictly this criteria in many countries, and sometimes truly not. Discussing that point in each national case is one of the main goals of the present study. Here, and only from the point of view of the population of the morphological cores and the FUAs, we will consider two levels, metropolises on one side, small, medium and large cities, on the other side, according to the above theoretical first paragraph of this chapter. The ultimate goal, which will be reached after a quantitative and a qualitative analysis, is to consolidate the characterisation of the European urban pattern, described according to the ESPON terminology in MEGAs (Metropolitan Growth Areas), transnational/national FUAs and regional/local FUAs. For each FUA, we give the population of the morphological core (MUA) and of the FUA (with the comparison to the data given in ESPON 1.1.1). For each European metropolis or polycentric metropolitan area, we provide also with a proxy of the FUA at the NUTS-3 level, which will allow us later to give an estimation of the GDP and the economic structure of the FUA. We have included in the proxy all the NUTS-3 units contiguous to the NUTS-3 including the core and with at least 60% of their population in NUTS-5 units pertaining to the FUA. It is not possible to do accurately this exercise for cities with less than 500,000 inhabitants, due to their size generally much smaller than the one of the NUTS-3 unit in which they are incorporated. The results are presented country by country, except for the transborder FUAs which were gathered in a separate table preceded by a specific typology. The Functional measures of the FUAs We have studied the functional aspects of all the FUAs defined by the morphological study. We have studied 5 functions for which we could gather enough data: the administrative functions, consisting of the national functions (capital city, chief towns, etc) and the international functions (cities hosting headquarters of important european and international institutions) the decision functions, consisting of the localisation of the heaquarters and their subsidiaries of national and international important companies the transport functions that measure the connectivity of a city with the others, consisting of the road and rail connectivity as well as the air traffic and the sea transport the knowledge functions, consisting of the localisation of the most important universities, research centres and high-technology production the tourism functions, consisting of a measure of the touristic activities estimated by the number of beds available and the number of nights spent in the touristic facilities, and by the appreciation reflected by the touristic guides (we did it only with Michelin but it should be done as well with other tourist guides). This criterion should also be completed by other cultural criteria such as the congress cities, and other cultural activities (museums, theatres, festivals, etc). Unfortunately we couldn t find relevant data for the industrial activities at the city level. We have then used the data provided by Espon but these were missing for France, UK and Switzerland, so that we didn t use them to compute our global functional index. 9

10 Executive Summary The morphological polycentricity For this part we have taken into account only the FUAs of more than inhabitants as the data are available at the NUTS-3 level which is usable to qualify these metropolises (see the morphological descriptions above). For smaller FUAs (i.e. more than inhabitants) this analyse could be done too for punctual data but not for the structural indices for the NUTS-3 are too disagragated. This should be done in the future if EUROSTAT can provide data at a lower level than in the present time. A more polycentric urban network, as opposed to monocentrism, is a central objective of the official European policies of planning and dominates its rhetoric (ESDP, 1999). The ESPON report aims to investigate it in depth. More polycentrism - the concept being used as well at the intra-metropolitan level, at the intra-national level and at the European level as a whole - is supposed to help containing urban sprawl, to favour cooperative strategies and networking between the cities, and, at the upper scale, which we intend to examine here, to lead to more efficient economies and at the same time to more equitable regional developments. The polycentric project is now so present in the official documents that questioning the content and the validity of the concept could seems out of place. However, we intend to show that this concept is often unsubstantial, ambiguous, badly defined, used as well from a morphological (the urban pattern) as from a functional point of view (the flows, the effective networks), confusing the geographical scales and more a normative than a scientific one (see also S. Davoudi, 2003). Our main question is thus to examine if it is true, looking at the empiric evidences i.e. morphological polycentrism as a measurable scientific object, and not as a territorial planning political goal -, that more polycentric national and European structures could lead simultaneously to more equity and effective regional development, to less inequalities between the regions and to a more effective, competitive and better integrated European economy, favouring also the sustainable development. As for us, we have computed two measures of the polycentrism on the basis of a sole methodology, the one at the level of the States, the other at the level of more or less similar sized units, i.e. the small and medium-sized countries considered as a single unit, and the biggest countries divided into macro-regions of about 10 millions inhabitants. Our index is computed on the basis of a simple and purely morphological methodology (as approached by the proxies of population data). We have used the cardinal ranking of the following indicators: Part of the main FUA in the total population of the country Part of the main FUA in the population of the whole set of FUAs with more than 250 thousands inhab.poids du 1 dans FUA> Part of the main FUA in the population of the whole set of FUAs with more than 50 thousands inhab. Standard deviation of the population of the FUAs with more than 50 thousands inhab. Average of the differences between the ranked populations of the FUAs until the threshold of 50 thousands inhab. The value of each of these five indicators has been distributed on a scale bounded from 100 (the highest value for the indicator) and 0 (the lowest one). The arithmetic average of these seven indicators gives the cardinal global index (Table 1). We stress that we compute here (the proxy of) an exclusively morphological index of polycentrism, and not a measure of functional polycentrism, decisional functions 10

11 Executive Summary appearing to be much more concentrated in most countries than the urban populations The sole surprise arising from our ranking regarding a qualitative knowledge of the European urban patterns is the position of Hungary, which appears a priori to be very monocentric due to the weight of Budapest. Our index of polycentrism is not linked to the results of any territorial planning policy. It aims first at showing the product of national histories and territorial building, in a very long time perspective. The economic and political developments, sometimes from the Middle Ages, gave rise to different urban patterns, with a whole range of situations between monocentricity and polycentricity: a monocentric pattern combined with a relative sterilization of the rest of the country, for a long time characterised by out migration (ex. : Ireland, for a long time in a quasi-colonial context ; Greece, with the exception of Thessalonica, located at the top of an international corridor) ; a restrained monocentricity, linked to an early national building, but without sterilization of the development outside the capital region (ex. : Denmark and Sweden, where the agrarian revolution played an important role in the initial phases of access to modernity); a strong monocentrism, yet more decisional than morphological, in countries with a very early territorial formation, where the powers are strongly concentrated in the capital, but however with other important cities, possibly also with their own strong historical weight. These cities can have been reinforced, as well as other mediumsized cities and intermediate areas, by regional and equilibrium metropolises policies during the last half-century, even if they remain under the control of the capital. France pertains to this type, which doesn t exclude macro-regional polycentrism, like in the East or the West of the country; a more or less similar situation, but where the decisional supremacy of the capital doesn t exclude big manufacturing conurbations, born during the early phases of a very intense industrial revolution, implying locations on the coalfields or on the proto-industrial manpower basins, or even allows more recent urban-regional developments (ex. : Great-Britain) ; a more or less equilibrated bicephalous pattern, possibly with a more political and a more private economic head (ex. : Spain or Italy, with in this last country very strong inter-regional economic inequalities and more, in the South, regional more or less parasitic primacies, like Naples or to a certain extent Seville, which reflect the long-lasting survival of aristocratic and archaic structures in their rural environment); a mid-european strongly polycentric pattern, with a very dense urbanisation and a very open urban hierarchy, from millionaire cities to a dense network of mediumsized cities, in the context of old urban autonomy tradition. This model includes polynuclear conurbations, even if these don t recover necessarily truly lived identities or spaces of strong planning and economic cooperation (Delta Metropolis in the Netherlands; Rhine-Ruhr; Rhine-Main; the Walloon industrial axis). This polycentrism can be the result of late national unifications and federal systems. However, the German polycentrism doesn t exclude the extreme monocentrism of the North-East of the country, besides not a part of the medieval Germany of cities and merchants ; finally, Switzerland is characterised by a typical mid-european polycentrism, but without big millionaire cities nor conurbations born during the coal based industrialisation period. 11

12 Executive Summary Polycentricity and economic efficiency As we have already seen, European policies assign to polycentricity a normative value of efficiency: it is supposed to favour regional and, through this one, global development, either by adding more performing regional growths or by avoiding diseconomies supposed to affect the biggest agglomerations. What is the evidence? We have computed the correlation between level of polycentricity and three indices of relative dynamics as shown beneath. If it is any, but not significant or slight correlation, it is between the level of development and more monocentrism. To conclude, this statistical link between monocentrism and economic efficiency seems to be consistent with the main present trends towards more globalisation, which favour the main advanced services nodes of the world-wide economy. The brief economic analysis we have achieved does not show any obvious advantage of polycentricity in terms of economic efficiency, measured globally by relative GDP growth compared to the European average: on the contrary, even if a very weak statistical relationship appears (quite insignificant indeed), this rather shows that States or more monocentric macroregions show little better economic behaviours, which can be understood in the framework of a globalization and tertiarisation of the economy benefiting big cities, which are the strongest integration nodes in the world economy. The free play of the dominant globalised economic powers tends to reinforce this situation in favour of the hubs of the world economy. This can naturally impact negatively in terms of cohesion inside national territories (let us think for example of the new member countries in which the opening to market economy and the sudden tertiarisation and internationalisation have very much favoured the growth of capital regions to the detriment of industrial areas. The latter used to be, on the contrary, favoured by planned economy, which had also ensured an administratively balanced distribution of industrial activities on the whole of the national territory, even if command functions were centralized from the capital. The political discourse in favour of polycentrism should be able to rely on a sufficiently refined statistical analysis, specifying which scales are concerned. This report tries to contribute to solve both questions, although it remains an incomplete preliminary draft that should be completed and refined, with increased means, especially if one wishes to add to the analysis the dimension of contribution to sustainable development. In case an accurate analysis of polycentricity and its fitting on different scales fails to be achieved, the polycentrism option will remain an empty political slogan, an auberge espagnole where any partner will bring himself what he wants. Some will bring a line of argument to get regional aid, cohesion funds or public aid. Others inversely, will argue in favour of a laisser-faire policy and competition between urban areas, and a weakening of the regulating power of the States.. In order to be in line with the development aims of world competition, cohesion, and Lisbon criteria and the concept to be operational, the reflection on a polycentric Europe should meet three fundamental questions: - specification and definition of urban areas, as a basis of any reflection on polycentrism; - analysis of the polycentricity scales and its modalities, with impacts at different scales; - examination of the deficiencies of the statistical measure tools and of the tracks to follow. These are discussed at the end of this report. 12

13 Executive Summary Networking report Contacts have been taken with the BBR where Mr Schmidt-Seiwert gave us the geographical database used during this project. Other information where sent by Norderegio as well as Espon Contact Points from different countries. 13

14 Part 3. Characterization of the Functional Urban Areas 1. First: Identification of the FUAs on the basis of their demographic weight Espon has produced an exhaustive list of the FUAs for 29 European countries. Globally this list appears to be correct but some errors have been made, according to the criticisms made on the final report by the Espon Contact Points. We don t intend - nor have the mission - to establish a new exhaustive list of the FUAs but we have enhanced the methodology to incorporate the Morphological Urban Areas (MUAs) of the cities in the definition of the FUAs. We have thus started to list the European cities on a morphological base by selecting the FUAs (from the Espon list) with more than 50,000 inhabitants and characterizing them at the NUTS-5 level, using the NUTS-5 database developed by Nordregio and IRPUD for the European Commission 1. From this database we have extracted the number of inhabitants and the areas for each NUTS-5 unit and put them on a map of Europe. Creating this list of all the NUTS 5-units contained in each European MUA and in the FUAs of some countries will be our main contribution to the study of the European urban network. By lack of data during the time of the project we haven t been able to define the FUA areas in NUTS-5 units for a majority of countries. Nevertheless this can still be done later and the database can be completed and corrected if necessary. These data can be used to support other studies in the future and allows already further researches on the core cities of the FUAs. It has appeared to us that the characterization of the FUAs should include the characterization of the Morphological Urban Areas (MUAs) inside them. Of course, the FUA, which corresponds to the employment pools, is an essential concept in functional terms and imposes itself more and more in a context of suburbanisation and growing mobility of active populations. However, the MUA, as a dense and coherent morphological whole, remains an essential concept: with identical populations, it clearly appears that FUAs which have better opportunities are those having a strong MUA in their centre, especially if the latter has some good quality historical and cultural heritage. This is an important element in the new forms of cross-city competitiveness. We have also included in the study the characterization of the transborder FUAs, which are essential in the European dimension. Finally, in order to stay close to a European perspective we have used the same homogenous criteria for every country (see the morphological areas methodology below). 1 In coooperation with an extensive research consortium, and as part of the DG REGIO Study on Mountain Areas in Europe. This database covered all municipalities of countries with mountain areas. It was then extended to other countries as part of an ESPON project carried out by Nordregio and IRPUD. 14

15 1.1 Methodology for the morphological study Introduction Indeed we have systematically examined the list and the delimitations of the MUAs because of methodological considerations linked to the criticism of the FUAs determined by Espon 111. Our intention never was to substitute the MUAs to the FUAs even if we state that the strength of the FUAs in a polycentric system comes for a good part from their inner MUAs where the most significant functions in the framework of national and international urban networks are concentrated. The identification of the MUAs that is based on the same definition whatever the country, appeared to be an indispensable first step for the consolidation of the FUAs. A tool to assess the FUAs The determination of the MUAs inside the FUAs provides a critical point of view on the FUAs identified by Espon 111. The study of the MUAs is the result of a functional approach of the FUAs : indeed the core cities of the FUAs are the real living poles of the FUAs, nothing would exist without them and the relation between cores and labour pools is a dependence of the second on the first. Should a core start to decline the whole FUA would follow, should a core city enter in some economical growth period the whole FUA would follow immediately. Most of the economical or cultural activities occur in the MUAs and all of the important transport connections (trains, planes, highways, as well as the freight) link cities to other cities. How could we study the urban functions - which means to study activities taking place inside or in the neighbourhood of cities - of the FUAs without knowing what cities are actually in the FUAs? Studying the internal structures of the FUAs (see the typology below) shows that the FUAs must not be merely described by the number of inhabitants. There's a functional difference between a FUA made of a single big city surrounded by a labour pool and another FUA with the same total population but made of several small core cities with a shared labour pool (if the labour pool is not shared, it's not a FUA anymore). The corrections of the Espon 111 list of FUAs based on the comments made by the ECPs only would not have been satisfying as for most cases the comments were not accurate enough and nothing allowed us to consider them as comprehensive nor even correct. These were sometimes general comments with some examples but certainly not a list of errors, and some countries even considered the work done by Espon 111 as not satisfying at all without any other more precise considerations. From that statement and considering that Espon 111 did not use any common methodology for all countries, but rather turned to national experts (which was not possible for us), and considering above all that the same common approach for all countries would better suit the European scope of Espon we have decided to use the morphological urban areas to assess the ESPON 111 FUAs. It is also important to remember here that we did not make our own list of FUAs but stuck to the existing one even if sometimes our MUA identification methodology would have led us to consider differently some cities (see Napoli for example). A quick comparison between the populations of the MUAs and those of the FUAs shows - by calculating for each FUA the quotient of the population values provided by Espon 111 divided by the population of the MUAs - that Espon 111 gives values lower than 1 for around 15 % of them, equal to 1 for around 10 % of them and lower to 1,2 for around 30 15

16 %. Logically there should be more population in the FUA than in the MUA and never less. This shows that the population values of Espon 111 FUAs are problematic and should be improved. The problem is that we don't have sufficient information on the labour pools for each of the 29 countries but we have data (NUTS-5 population and area data provided by Espon) that can be used to compute the population of the MUAs, and considering that a FUA is basically an area centered on a MUA and moreover that exists only because of a MUA, we found that identifying the MUAs would be an essential first step. Besides testing the probability of the Espon 111 values, the determination of the MUAs allowed us to see where the mistakes did come from : especially - but not only - the cases mentioned above where the FUAs and the MUAs have exactly the same population can be explained by the choice by Espon 111 of administrative boundaries instead of labour pool values. An enrichment for the study of the urban functions The identification of the MUAs must be seen as a real starting point for future studies on Urban Functions. The knowledge of the internal structure of the FUAs improves the study of the urban functions by allowing to study the territorial development in relation with the type of local urban network, and hence to better study the polycentricity in Europe. The use of MUAs in the study of the FUAs allowed us to highlight the existence of polycentric areas, sometimes at a higher level than the level of the FUA. In Germany for instance there are polycentric regions divided in FUAs (according to the list of ESPON 111) that can be nevertheless also considered as pure polycentric functional urban areas, since a significant proportion of workers actually commute from one FUA to another. Same for the transborder FUAs. It is now possible to improve the delimitations of the MUAs : should some value appear to be wrong, it would be very easy to find out why. It could be due either to a wrong population number provided for some NUTS-5 or to a wrong selection of NUTS-5. In the first case the only thing to do would be to correct the value in the NUTS -5 database and in the second it should be possible to modify the list. In the same way taking into account new population values will allow an almost automatic adaptation of the MUAs' population numbers as well as for the FUAs that are defined at the NUTS-5 level. The knowledge of the MUAs allows future researches on the evolution of labour pools. The knowledge of the MUAs allows now to better define the limits of the FUAs, according to the interpretation of new or future data (Urban Audit?), indeed the labour basins are defined as a set of municipalities that send workers to a core city (a MUA) that is now defined itself as a set of municipalities. So whenever the data concerning the commuters are updated at the NUTS-5 level (so to say from one municipality to another) the sets of NUTS-5 of the FUAs can be automatically updated too. Note that the identification of the MUAs allowed us also to provide a comprehensive list of transborder FUAs, as well as a typology, which is in strict keeping with the European dimension and for which the FUA approach is not sufficient. These transnational FUAs are mapped below in the report and are detailed in chapter 4. 16

17 1.1.2 The methodology First the criteria are built up to make a clear distinction between two main classes of cities: Small, medium and large cities which are more to be studied in a Christallerian perspective, they are providing services and the basic infrastructural framework for the territory. However, it is clear that many large, or even some medium and small cities, can carry out important specific functions at the European scale, either as specialised cores inside networks, or as more or less specialised satellites of big metropolises. The main metropolises, at a European level, which are for most of them the nodes for the insertion in a competitive international economy. The category of the main metropolises is the most relevant at the point of view of our study, for it drives the future of Europe in the Lisbon perspective. However, even some such cities don't have the qualitative level corresponding to the amount of their population. It will also be discussed later. From the EUROPEAN point of view, it appears to be essential to follow the same criteria for every country, whatever their sizes. We are not working in the point of view of NATIONAL territorial planning. Morphological Urban Areas Basically a city is organised around a densely populated node, with a true urban landscape and even better a historical core. Therefore, we have approached those characteristics by considering at first all the municipalities (NUTS-5 level) with more than 650 inhab./km!. Then all the contiguous municipalities with this threshold of density, as well as the municipalities not reaching the threshold but enclosed by the others, were added to define central or morphological urban areas. The threshold of 650 inhabitants/km2 and the 10 % criteria for the people working in the core city come from the publication "Bulletin du Crédit Communal, 53ème année, N , 1999/1-2, pp Previous studies (GEMACA1 and the Atlas comparatif des villes européennes 2) have shown that a very good approximation of the population volume in morphological agglomerations FUA nodes in other words can be obtained when adding to the central NUTS-5 unit of the FUA all the contiguous NUTS-5 units of more than 650 or 700 inhab./km2, a simple criterion indeed, but a criterion that seems to be confirmed by monographic analyses carried out in different countries and by a comparison with CORINE data, even if some minor adjustments have to be made in order to take account of specific situations (periurban forests, mountains, etc.). In the very densely urbanised areas and in areas close to core cities, FUAs, or even core agglomerations, can be contiguous. What matters in such cases is to decide if contiguous NUTS-5 units belong to one and the same (possibly multipolar) FUA or not.» However, in some cases, municipalities have a true urban character but are not reaching the level of 650 inhab./km!, due for instance to some specificities of the delimitation of the municipality (a very large municipal territory; a large part of the territory occupied by a 17

18 lake, or mountains or forests ). Therefore we have also taken into consideration all the municipalities with more than 20,000 inhabitants, whenever they have a clear concentrated morphological core. The areas less populated but consisting of facilities like airports, seaports or industries, and specific contiguous areas like a forest, a small lake or other natural forms are also considered as part of the cities as well as the populated areas contiguous to them, but separated from the centre of their city only by these specific areas. Sometimes, very densely populated municipalities are in fact very small isolated entities with only a few thousands inhabitants: therefore, we have not considered municipalities or sets of contiguous municipalities not reaching the 20,000 inhabitants threshold, even if they meet the density criteria. In some cases, sets of contiguous municipalities, each reaching the 650 inhab./km! and/or the 20,000 inhabitants threshold, form a very large area which is in fact structured by different nodes, each with a clear identity, which is the case in some large conurbations. We have then identified different cities, but only when the different nodes are clearly separated from a morphological point of view and also identified as such at the upper levels of the urban hierarchy in the national studies of the urban networks. We have used the Espon NUTS-5 database elaborated by Nordregio, from which we have taken the population for 2001, the main area values and the shapefile of the 29 Espon countries. These were quite complete but whenever there was a missing data (population number) we have taken a value elsewhere from the available statistics. To ensure that the statistical information given by the data fits enough with to the morphological reality we ve checked them by viewing satellite images (mainly provided by GoogleEarth from or by So GoogleEarth was used only to fine-tune the selection made on statistical criteria, never to calculate a population number or to decide where to look for. It was a perfectly accurate and convenient tool for this specific job and it helped us to decide where to put the limits between two contiguous cities or to decide whether a slightly distant residential district should be included, and therefore to respect the list of the FUAs provided by ESPON. After looking at them we're not convinced that a tool as the Corine images provided by the European Environmental Agency would have allowed us to find these limits since the images give only spots of colours according to the types of land cover without any limits corresponding to the definition of the MUAs (with respect to their administrative delimitations). For instance whenever two contiguous cities are considered as two FUAs by Espon 111 they might appear on the Corine image as well as in the statistical data as a single urban area and we would not know where to put the limit between the contiguous NUTS-5 if these cities consist of several NUTS-5. Simply think of Milano or Napoli, which are both very widely urbanized regions consisting of many FUAs (according to ESPON 111) and much more MUAs. In some regions the urban areas are contiguous sometimes over a hundred km, like in montaneous areas. Only small details in the urban structure or natural irregularities can lead us to put a reasonable limit between two well known and distinct cities. GoogleEarth gives real details, Corine images in our case is a little bit redundant with the statistical data. Nevertheless it would be interesting to determine a methodology to use these images in relation to the statistical data on an automatic mode but it certainly will not be that trivial and will be time consuming. 18

19 Functional Urban Areas Besides their morphological character, cities are also employment cores, surrounded by a labour pool. This functional dimension becomes more and more significant, as commuting and suburbanisation are growing. These functional urban regions (FUAs) are in principle defined in ESPON on this base of the labour basins of the morphological urban areas. Nevertheless, the data provided by the ESPON study don't seem to follow strictly this criteria in many countries, and sometimes truly not. Discussing that point in each national case is one of the main goals of the present study. Here, and only from the point of view of the population of the morphological cores and the FUAs, we will consider two levels, metropolises on one side, small, medium and large cities, on the other side, according to the above theoretical first paragraph of this chapter. The ultimate goal, which will be reached after a quantitative and a qualitative analysis, is to consolidate the characterisation of the European urban pattern, described according to the ESPON terminology in MEGAs (Metropolitan Growth Areas), transnational/national FUAs and regional/local FUAs. Metropolises From a quantitative point of view, the population of the FUA is more than 500,000 inhabitants. Polycentric Metropolitan areas In some cases, we have to consider the situation where different metropolises, with the centre of their cores distant from less than 60 km, are contiguous, or are only separated one from the other by other cities, with their own labour pool, or yet are bordered by other large, medium or small cities, distant from less than 30 km, also with their own individualised manpower basin. In these cases, we have identified conurbations of POLYCENTRIC METROPOLITAN AREAS (poly-fuas). We have also considered as forming a POLYCENTIRC METROPOLITAN AREA two large cities distant one from the other less than 30 km and reaching together the level of 500,000 inhabitants. For the rest, we don t have considered as being a polycentric metropolitan area two or more large, medium or small cities with contiguous manpower basins, even if they reach together the threshold of 500,000 inhabitants. So to form a poly-fua structure we must have either : 2 metropolises (> inh.) with their centres less than 60 km apart, and labour basins touching each other 2 large cities (> inh.) with their centres less than 30 km apart, and labour basins touching each other 1 metropolis and 1 large or medium city (> inh.) with their centres less than 30 km apart, and labour basins touching each other 2 metropolises with their centres less than 60 km apart, labour basins separated only by the labour basin of a smaller fua touching the both of them 19

20 Other cities In this category, which is more relevant at a national scale planning than from the European point of view, we can yet consider three sublevels, i.e. large, medium and small cities. LARGE FUAs MEDIUM FUAs SMALL FUAs the population of the FUA is more than 250,000 inhabitants. the population of the FUA is more than 100,000 inhabitants. the population of the FUA is more than 50,000 inhabitants. We have thus not considered morphological cities that would have more than 20,000 inhabitants but with less than 50,000 in the whole FUA. If medium or small morphological cores don t have a clear individual FUA and are also incorporated inside the labour pool of Metropolitan areas or even large cities, they are not considered as such. The population of their own secondary FUA is included in the population of the main FUA, but they are however named as secondary cores inside the principal FUA Presentation of the data In next chapter for each FUA, we give the population of the FUAs and of their morphological cores (MUAs) (with the comparison to the data given in ESPON 1.1.1). For each European metropolis or polycentric metropolitan area, we provide also with a proxy of the FUA at the NUTS-3 level, which will allow us later to give an estimation of the GDP and the economic structure of the FUA. We have included in the proxy all the NUTS-3 units contiguous to the NUTS-3 including the core and with at least 60% of their population in NUTS-5 units pertaining to the FUA. It is not possible to do accurately this exercise for cities with less than 500,000 inhabitants, due to their size generally much smaller than the one of the NUTS-3 unit in which they are incorporated Summary of the thresholds FUA = morphological area (MUA) + labour pool (LP) Criteria for the classification of the FUAs: population number (minimum 50,000) density of the NUTS-5 units (> 650 inhab./km 2 ) Criteria for the morphological area (MA) Population number (> 20,000) identification: Contiguity (possible inclusions) Identity (possibly FUAs with several MA) 20


, the Belgian central metropolitan area (type 3) and the big London")
 inside the FUA.")
21 1.1.5 Summary of the FUA types The following diagrams summarize for instance four different situations in a high-density area, implying quite different realities as regards functions, economy, management of mobility and territorial planning, but which could be confused if the analysis did not sufficiently explicit the definitions used. Even if these four patterns are purely theoretical, they are respectively globally based on the situation of an old coal basin for the first (type 1), the Ile-de-France Region for the second (type 2, with new cities functionally not much independent from Paris), the Belgian central metropolitan area (type 3) and the big London metropolitan area (type 4), where secondary centres of the external fringe of the FUA have more decisional autonomy and are moreover doubled by a belt of important or specialized cities (cf. Cambridge, Oxford) inside the FUA. Type 1 Type 2 Type 3 Type 4 21
22 2. Second: Characterisation of the FUAs functions 2.1 Methodology for the Functional study We have gathered information to measure the functions of the 1221 FUAs of our list. Our categories are the same as those of Espon except that we couldn t find relevant data on the industrial sector and that we had to decide to ignore this criterion instead of producing an inappropriate result. Nevertheless we have computed a second indicator that takes into accont the industry, using the Espon data in which unfortunately France, the United Kingdom and Switzerland are missing The methodology and the data used to measure the functionality The methodology used is detailed below in table 1 As always the limitations are due to the lack of available data or the too large scale covered by the available data (nuts-3, nuts-2). In particular industry data should be available at the city level, the nuts-3 level being far too large to make the assumption that the region value could be applied to any of its cities. Same for the employement data that are provided at nuts-2 level by eurostat but we have used nevertheless considering that applying its values to the FUAs was acceptable. Regarding the culture and tourism criterion we had only data about tourism, we would have used also data on the cities that have congress facilities, which should be possible with a little bit more time. 22
23 Criteria Data Value Significance Source and geographical scale Comments > 4 7 pts > 2 6 pts > 1 5 pts Population FUA population (million inhab.) Main MUA population (inhab.) > pts > pts > pts > pt > 1 3 pts > pts > pt Espon nuts5 database for all the MUAs and for some FUAs depending on the country, otherwise national data on labour basins when available, otherwise Espon data. These two values are added to obtain a score between 1 and 10. The MUA size emphasizes the importance of a big core to strengthen the FUA. A FUA with one single big core is stronger than a FUA with many small cores. Number of headquarters of the top-2000 biggest world companies located in the European FUAs (523 in total) > n/2 3 pts > n/4 2,5 pts > n/8 2 pts > n/16 1,5 pt > n/32 1 pt > n/64 0,5 pt > n/2 3 pts > n/4 2,5 pts > n/8 2 pts > n/16 1,5 pt > n/32 1 pt > n/64 0,5 pt > n/2 2 pts Forbes, 2005 Core city level. n is the max value among all the FUAs international Decision Globalization and World Cities (GaWC) Prop. Highest Connectivities Number of headquarters of the main (3000) European national companies selected in each country so that they weigh together 50 % of the > n/4 1,5 pt > n/8 1 pt national added value. > n/16 0,5 pt Number of sub-headquarters > n/2 2 pts of the top-200 bigger world > n/4 1,5 pt companies located in the > n/8 1 pt European FUAs > n/16 0,5 pt Connectivity of the cities in the world-wide advanced services network. Core city level. Van Dijk database Core city level. n is the max value among all the FUAs national Forbes 2000 and systematic search of all the subsidiaries. Core city level. n is the max national value among all the FUAs of the country considered (it varies upon the countries) 23
24 Criteria Data Value Significance National administrative functions country capital Chief town of region with real autonomy 8, if national population > 20 mio 7, if national population < 20 mio 6, if national population < 2 mio 5, if regional pop > 5 mio 4, if regional pop < 5 mio Source and geographical scale Core city level. Administration International administrative functions Chief town in decentralised countries Administr. 1 chief town UE headquarter 3 pts UE secondary HQ 2 pts UE agency 0,5 pt 3, if regional pop > 5 mio 2, if regional pop < 5 mio Core city level. International institutions 1 pt 24 Comments Exception : Bonn (4 pts), Amsterdam (3,5 pts) Regional capitals in federal countries, and Catalonia and Basque Country, Scotland, Wales and Northern Ireland Regions in France, Italy, Spain, Madeira, Acores. 1,5 pts for British regions. Level of the Kreis not taken into consideration. Ex : ECB, NATO, IRCC, Council of Europe, UNESCO, UN, IOC, IWO, etc.
25 Criteria Data Value Significance Source and geographical level Comments Transport Road connectivity Max 2 pts Rail connectivity Max 3 pts Air traffic Max 3 pts Sea ports global fret in millions of tons Sea ports containers fret in TEU. > 75 1 pt > 20 0,75 pt > 10 0,5 pt > 5 0,25 pt > 3 1 pt > 1 0,75 pt > ,5 pt > ,25 pt Espon : based on the average value of three variables («Daily population accessible by car» + «Potential accessibility by road in ESPON space» + «Accessibility time to market by road»). Nuts-3 level. Espon : based on the average value of two variables ( Potential accessibility rail» + «Accessibility time to market by rail»). Nuts-3 level. Igeat data : Average between the number of destinations and the number of seats on regular flights. Core city level. Eurostat, mar_go_qm_2005 Core city level. Eurostat, mar_go_qm_c2004 Core city level. Sea traffic 25
26 Criteria Data Value Significance Source and geographical level Comments Knowledge Top-500 European universities Top-100 Research Centres Annual data on employment in high-technological and knowledge-intensive sectors in the services (%) Annual data on employment in high-technological and knowledge-intensive sectors in manufacturing (%) (501 pos) / 500 Position in the ranking (101 Class of percentage pos) / 100 Max 5 pts Max 2,5 pts Max 1,875 pt Max 0,625 pt Core city level Eurostat, htec_emp_reg_2005 Nuts-2 level Nr of beds and nr of nights Max 5 pts 3 stars 3 pts 2 stars 2 pts 1 star 1 pt Culture and > 2 pages 5 pts tourism Tourist appreciation > 1 page 4 pts * 5/8 > 1/2 page 3 pts > 1/4 page 2 pts just mentioned 1 pt Michelin guide for Europe Core city level Estimation for some cities where one of the series was not available on the basis of data for the other set and/or on the situation of similar cities. Industry No data available We have nevertheless provided a functional index with the industry value produced by Espon included but the methodology is unclear and it doesn t include data for UK, France and Switzerland which count for about 20 % of the FUAs and not the less. Nuts-3 level. Table 1 Methodology to measure the functionality 26
27 2.1.2 Global values All of our main categories have received a score on 10 points, except the administration that got only 5 points because its influence would have been too important in the total. Three global values were then obtained for each FUA by calculating a weighted average of all the scores as following: Global score: Total of all the scores, except industry, divided by 5,5 Functional score: Total of all the scores, except industry and population, divided by 4,5 Global score including industry: Total of the 7 scores divided by 6,5 Then we have calculated a specificity value for our 5 function scores by dividing each of these by the Functional score in order to highlight the cities that would have a specific function. The results are shown in the maps below. 27
28 3. List of the Functional Urban Areas on the morphological base The countries are classified by alphabetical order. All the transborder FUAs are detailed in chapter Austria Criticism of the ESPON FUAs ESPON data for Austrian FUAs are clearly wrong and definitely underestimate the level of urbanisation of this country. In fact, ESPON only considers as population of the socalled FUAs the population of its central municipality. Therefore, some so-called FUAs have a population even inferior to the population of the only MUA, as suburbs have not been included or have been considered as separate FUAs! It is the case for Vienna, Graz, Linz, Salzburg and Innsbruck, the biggest five Austrian cities. In fact, due to the presence of quite big cities clearly separated from each other by more rural or mountainous regions, the FUAs of the main Austrian cities, computed on the basis of our criteria, are quite large. Krems an der Donau does not reach the threshold of 50 thousand inhab. for the FUA The Austrian urban pattern: population data The lines in yellow show the FUAs that are integrated in the poly-fua described in the preceding white line, so every white line preceding a yellow one describes a poly-fua. FUAs and poly-fuas Population Espon Population MUAs MUA's populati on NUTS-3 proxys Population Metropolises Wien (a) Wien Baden Wiener Neustadt AT112, AT122, AT125, AT126, AT127, AT Linz-Wels- Steyr 926 n.c. Linz Wels Steyr AT312, AT313, AT Linz (b) Linz 234 Wels Wels 56 Steyr Steyr 39 Graz Graz 232 AT221, AT Salzburg (c) Salzburg 154 AT Large cities Innsbruck Innsbruck 128 Klagenfurt Klagenfurt 90 28
29 Medium cities Sankt-Pölten Sankt-Pölten 49 Villach Villach 57 Bregenz (d) Bregenz 60 Feldkirch Feldkirch 29 Dornbirn- Lustenau (d) Small cities Dornbirn Lustenau Leoben Leoben 26 Kapfenberg/Br ück an der Mur Kapfenberg/Br ück an der Mur 36 Amstetten Amstetten 23 Wolfsberg Wolfsberg 25 (a) ESPON considers Klosterneuburg, Mödling, which are inside the MUA of Wien, as two separate FUAs (with only their municipal population, respectively 25 and 20 thousand inhab.). It also considers separately the Baden and Wiener Neustadt (with respectively 25 and 38 thousand inhab. for their FUAs), which are secondary cores inside Wien's FUA. (b) Linz FUA according to ESPON alone. ESPON considers Traun and Leonding, which are inside the MUA of Linz, as two separate FUAs (with only their municipal population, respectively 23 and 22 thousand inhab.), as well as Wels and Steyr, which are in fact cores at the fringe of Linz' FUA, with partially their own FUA but less than 30 km from the centre of Linz. (c) Austrian side only. See transborder FUAs chapter. (d) Austrian side only. See transborder FUAs chapter. With the Swiss side, Dornbirn-Lustenau can be considered as a medium FUA Conclusions The Austrian network is characterised by the strong dominance of Vienna, yet more from a functional point of view, while Linz, Graz and even Salzburg, Innsbruck and Klagenfurt appear to be more important cities than sometimes thought, due to their very large labour pools, in the absence of significant small or medium cities in their surroundings. As for the rest, the Vorarlberg is characterised by a dense network of small cities, much interrelated and with strong cross-border connections with Switzerland, Germany (and Liechtenstein): three main nodes, even if they remain small cores, appear in this network (Feldkirch, Dornbirn and Bregenz). The two main corridors along which urbanisation is organised are the west-east Germany-Linz-Vienna-Hungary-Slovakia corridor, and the eastern northsouth corridor between the Czech and the Slovak Republics-Vienna-Graz and the Adriatic coast. Besides, Salzburg, Innsbruck but also Villach and Klagenfurt are important places on the north-south transalpine links. 29
30 3.2 Belgium Criticism of the ESPON FUAs The fundamental mistake in the Espon FUAs delineation for Belgium is the wrong definition of Brussels' labour pool: the authors have only considered the Brussels-Capital federated Region, which is much smaller than Brussels' morphological area itself, not to mention the FUA. In fact, for all FUAs, they have exclusively considered the administrative divisions at NUTS-3 level incorporating the urban cores, without examining the true extent of the labour pools. In fact, Brussels' labour basin, as defined on the basis of 10% or more of the occupied active population commuting towards an employment core Brussels being the main commuting direction covers the whole central part of Belgium, i.e. the two provinces of Walloon and Flemish Brabant (with the exception of the area surrounding Leuven), the Eastern part of Oost Vlaanderen, the north of Hainaut and some municipalities of the provinces of Namur and Liège. This is due to the weight of Brussels as first employment core in Belgium, to a very early tradition of commuting and to a strong suburbanisation, in a small country with a very dense transport network and weak urban planning regulations. In fact, Brussels' labour basin is nearly three times more populated than that proposed by ESPON ESPON has also used too narrow delimitations (based on administrative limits) for the other big Belgian FUAs. As a consequence, the population in the FUAs of the smaller employment cores surrounding Brussels is very much overestimated in ESPON It is the case for Leuven, Mechelen, Sint-Niklaas. As another consequence of the same mistake, ESPON considers Aalst as a labour pool in itself, but even if this city is a morphological and an employment core, it is also included in the Brussels' labour pool. ESPON does not consider transborder pools: many municipalities of the province of Luxembourg are clearly included in the Luxembourg labour pool, including Arlon, the capital of the province, which is also an employment core in itself. Comines belongs to Lille's labour pool, whereas other municipalities make part of Aachen s, Maastricht s, Eindhoven s or Tilburg s labour pools. ESPON failed to consider two smaller FUAs with more than 50,000 inhabitants and with a morphological core of more than 20,000 inhabitants, i.e. Turnhout and Sint-Truiden, which we have added to the list. The other FUAs do not gather 50,000 inhabitants and/or their morphological centre does not reach a population of 20,000 inhabitants. 30
31 3.2.2 The Belgian urban pattern: population data The lines in yellow show the FUAs that are integrated in the poly-fua described in the preceding white line, so every white line preceding a yellow one describes a poly-fua. FUAs and poly-fuas Population Espon Population MUAs MUA's populati on NUTS-3 proxys Population Metropolitan and polynuclear metropolitan areas Belgian central metropolitan region ( Vlaamse ruit + Bruxelles/ Brussel, Flemish diamond ) 5103 n.c. Bruxelles/ Brussel Antwerpen Gent Aalst Leuven Mechelen Waregem Sint-Niklaas Oudenaarde Herentals BE100,BE211,BE212,BE 231, BE232,BE233,BE234,BE 235, BE236,BE241,BE242,BE 257,BE310 (h) 5025 Bruxelles/ Brussel (a) Bruxelles/Bruss el Aalst BE100,BE231,BE232,BE 241, BE310 (h) 2325 Antwerpen (b) Antwerpen Mechelen BE211, BE Gent (c) Gent Oudenaarde BE233,BE234,BE235,BE Leuven Leuven 89 BE242 (i) 458 Sint-Niklaas Sint-Niklaas 68 BE Euroregio MAHL (belgian part) (d) 1538 n.c. Liège Hasselt-Genk Verviers Sint-Truiden BE331,BE332,BE333,BE 334, BE221,BE222,BE Liège Liège 451 BE331,BE332,BE Hasselt-Genk Hasselt-Genk 131 BE221,BE222,BE Verviers Verviers 67 BE Sint-Truiden 66 n.c. Sint-Truiden 37 included in Hasselt-Genk Aachen s FUA (e) Maastricht s FUA (e) 52 n.c. included in Verviers 44 n.c. included in Hasselt-Genk Charleroi- Centre 714 n.c. Charleroi La Louvière BE322,BE325,BE326,BE
32 Charleroi Charleroi 314 BE322,BE326,BE La Louvière La Louvière 142 BE Belgian side of Lille metropolis (f) 524 n.c. Kortrijk Tournai Mouscron Ieper BE253,BE254,BE324,BE Kortrijk Kortrijk 151 BE Tournai Tournai 67 BE Ieper Ieper 35 BE Mouscron Mouscron 52 BE Lille s FUA (e) 18 n.c. included in Mouscron Large cities Mons-Borinage Mons-Borinage 193 Brugge Brugge 117 Medium cities Namur Namur 105 Turnhout 161 n.c. Turnhout 49 Roeselare Roeselare 92 Oostende Oostende 82 Waregem 119 n.c. Waregem 73 Others Luxembourg s FUA (e) Eindhoven s FUA (e) Tilburg s FUA (e) 146 n.c. Arlon Aubange (g) 41 n.c. 2 n.c (a) ESPON data relate to the Brussels-Capital Region population only. (b) Including in ESPON thousand inhab. for a separate Mechelen s FUA, which is in fact the population of Mechelen s arrondissement. Even if Mechelen is an employment core, most of the municipalities of the arrondissement are included in Antwerp s FUA. Data on Antwerp s FUA thus include the population of the small FUAs of Mechelen, considered as a secondary centre, as well as Herentals. (c) Data for Gent s FUA include those for the small FUA of the secondary centre of Oudenaarde. (d) Belgian side of the Euregio MAHL only. See transborder FUAs chapter for the whole polynuclear transborder metropolis. (e) Belgian side only. (f) See transborder FUAs chapter for the whole polynuclear Lille metropolitan region. (g) Belgian part of the transborder MUA Longwy-Rodange-Aubange. (h) Due to the strange delineation of the arrondissement of Soignies, it is not possible to include the arrondissement of Ath in Brussels FUA proxy (as well as should be incorporated the north of the arrondissement of Soignies). (i) The proxy is less than 60% of the population of the FUA, but the rest of the area of the proxy is for the most part included in Brussels FUA. 32
33 3.2.3 Conclusions Belgium is a country with a very dense polycentric urban pattern and a very strong process of suburbanisation, in a context of loose planning and scattered settlements. This pattern is dominated by a central metropolitan region, which gathers half the country s population. But at the same time, Belgium s urban network is strongly dominated, from a functional point of view, by Brussels. One can say the Belgian urban pattern is rather morphologically than functionally polycentric. Three Belgian urban sub-systems are clearly marked by effective or at least potential transborder characteristics: the East is included in the Euroregio network with the South of Dutch Limburg and Aachen s area in Germany, and the South-West could be polarized by Lille in France. While these two transborder sub-systems may be quite potential from the point of view of effective cooperation, the South-East is conversely more and more effectively polarized by Luxembourg through strong and growing commuting flows. 33
34 3.3 Bulgaria Criticism of the ESPON FUAs ESPON data relate to municipalities only (ESPON has however made a clear mistake for Plovdiv, confusing data for the municipality with data for the department). Meanwhile, Bulgarian municipalities have a very big size. Considering the fact that suburbanization was nearly unknown for decades, data are perhaps not too much incorrect to describe Bulgarian FUAs, but accurate information about the labour pools should be useful for the future. We have estimated a correction for Plovdiv, Varna and Burgas only, and we have added to the population of the very municipality the population of the neighbouring municipalities. This rectification was not made for Sofia, as the territory of the capital is very large and clearly extends beyond morphological limits The Bulgarian urban pattern: population data FUAs and poly-fuas Population Espon Populatio n MUAs MUA's populati on NUTS-3 proxys Population FUAs FUA's population Espon Populatio n Cores MUA's population NUTS-3 proxys Population Metropolises Sofia Sofia 1174 BG Large cities Plovdiv Plovdiv 341 Varna Varna 322 Medium cities Burgas Burgas 210 Ruse (a) Ruse 182 Stara Zagora Stara Zagora 169 Pleven Pleven 150 Sliven Sliven 137 Pazardzhik Pazardzhik 129 Pernik Pernik 105 Shumen Shumen 105 Dobrich Dobrich 100 Haskovo Haskovo 100 Small cities Veliko Tarnovo Veliko Tarnovo 91 34
35 Vraca Vraca 86 Yambol Yambol 83 Kazanlak Kazanlak 82 Blagoevgrad Blagoevgrad 78 Vidin (b) Vidin 78 Gabrovo Gabrovo 75 Kyustendil Kyustendil 71 Karlovo Karlovo 71 Kardzhali Kardzhali 70 Asenovgrad Asenovgrad 68 Dimitrovgrad Dimitrovgrad 65 Targovishte Targovishte 65 Lovech Lovech 63 Silistra (b) Silistra 62 Montana Montana 62 Razgrad Razgrad 59 Petrich Petrich 58 Gorna Oriahovitsa 54 n.c. Gorna Oriahovitsa 54 Doupnitsa 52 n.c. Doupnitsa 52 (a) Bulgarian side only. See transborders FUAs chapter for the transborder FUA with Giurgiu. (b) Due to the lack of a bridge on the Danube, we have not considered the Vidin-Calafat and Silistra-Calarasi pairs as transborder FUAs Conclusions As in some other former socialist countries, like Romania, the urban network is characterised by the strong primacy of the capital, and for the rest by a quite equilibrated pattern of second-level cities, corresponding to the willingness of the former planned economy to disperse industry on the whole country, following the administrative hierarchy. Plovdiv, Varna and Burgas are clearly the most important cities after Sofia. Ruse-Giurgiu appears as a very big transborder FUA, quite exceptional in this part of Europe, but since borders between countries were quite close during the communist period, it seems that twin cities could rather be neighbour cities, on both banks of the Danube, than a true integrated transborder agglomeration. 35
36 3.4 Cyprus Criticism of the ESPON FUAs Data provided by ESPON for the FUAs seem to be quite coherent with the MUAs populations, if one corrects the ESPON report's mistake, i.e. the inversion of the data for Larnaka and Lemessos (the municipality of Lemessos alone has a population of 94 thousand inhab., which is more than the amount given by ESPON for the whole FUA!). Taking this correction into account, ESPON data are also coherent with the population of the administrative districts, a bit larger than the FUAs (respectively 273 thousand, 197 thousand, 115 thousand and 66 thousand for the districts of the four mentioned cities, the last district, Famagusta, being smaller, with only 38 thousand inhab.). However, if we accept ESPON data for the FUAs, Pafos is excluded from the list of FUAs at a pan-european level: the MUA reaches, with 35 thousand inhab., the threshold, but not the FUA with only 47 thousand inhab The Cyprus urban pattern: population data FUAs and poly-fuas Population Espon Population MUAs MUA's populati on NUTS-3 proxys Population Large city Lefkosia (Nicosia) Lefkosia 192 Medium city Lemessos (Limassol) Small city Lemessos (Limassol) 150 Larnaka Larnaka Conclusions The urban pattern of Cyprus is quite polycentric, with a trend to a much quicker coastal development (including Pafos). N.B.: the Northern part of the island, under Turkish occupation, is not considered. 36
37 3.5 Czech Republic Criticism of the ESPON FUAs Due to the lack of commuting data, the ESPON report has clearly used administrative data, in general at the level of the districts, the first administrative level above the municipalities, more or less with the same size as the Kreise in Germany. However, ESPON data are totally wrong for the second Czech FUA, as they give for Ostrava and the surrounding industrial cities a population above the whole kraj province. We have followed and implemented the methodology using districts as proxys of the FUAs, however extending the FUAs of the biggest towns to their surrounding districts, and thus considering Kladno as a secondary core inside Praha's FUA. However, this methodology seems to overestimate the true FUAs for the smallest cities, located in the less urbanised parts of the country. Therefore, we have suppressed from the list all the cities with less than 25 thousand inhabitants isolated in their district. It is indeed not probable that such very small cities would be so attractive to many commuters that their FUA would be more than 50 thousand people. Even doing so, it is probable that the FUAs of the cities between 25 and 50 thousand inhab. remain overestimated. Therefore, we have arbitrarily limited the population of these FUAs to twice the population of the corresponding MUA The Czech urban pattern: population data FUAs and poly-fuas Population Espon Population MUAs MUA's populatio n NUTS-3 proxys Population Metropolitan and polynuclear metropolitan areas Praha (a) (b) Praha Kladno Ostrava (d) (e) Ostrava Frydek-Mistek Karvina Trinec Orlova Novy Jicin Cesky Tesin Koprivnice CZ010,CZ020 (c) 2297 CZ Brno (f) Brno 376 CZ062 (g) 1137 Large city Plzen (h) Plzen 165 Medium cities Liberec (i) Liberec Jablonec nad Nisou
38 Olomouc Olomouc 103 Karlovy Vary (j) Karlovy Vary Sokolov Zlin Zlin 104 Opava Opava 61 Ceske Budejovice Ceske Budejovice 112 Pardubice Pardubice 91 Hradec Kralove Hradec Kralove 97 Decin Decin 53 Teplice Teplice 64 Chomutov Chomutov 72 Usti nad Labem Usti nad Labem 101 Most Most Litvinov Jihlava Jihlava 51 Small cities Prostejov Prostejov 48 Prerov Prerov 48 Mlada Boleslav Mlada Boleslav 45 Tabor 88 n.d. Tabor 44 Trebic 78 n.d. Trebic 39 Ceska Lipa 78 n.d. Ceska Lipa 39 Znojmo 72 n.d. Znojmo 36 Pribram 72 n.d. Pribram 36 Cheb 66 n.d. Cheb 33 (a) Districts of Praha, Beroun, Kladno, Melnik, Praha-vychod, Praha-zapad. (b) Including 71 thousand inhab. attributed by ESPON to a separate Kladno's FUA. (c) The NUTS-3 units are quite inadequate as proxys for Praha metropolitan area. CZ010 alone is too narrowly limited to the MUA and CZ020 is too big as a proxy of the suburban parts of the FUA. (d) Districts of Ostrava, Frydek-Mistek, Karvina and Novy Jicin. Czech side only. For considering the transborder area with the Polish side (Cieszyn at a large scale; the whole Upper Silesian basin at a small scale), see further transborder FUAs chapter. (e) Including 226 thousand inhab. attributed by ESPON to a separate Frydek-Mistek's FUA, 86 thousand to a separate Havirov's FUA and 65 thousand inhab. to a separate Karvina's FUA. The total value of 1535 thousand inhab. given by ESPON is totally improbable, as it is nearly 270 thousand more than the whole Moravoskosleszky kraj! (f) Districts of Brno and Brno-venkov. (g) The NUTS-3 unit is too large as a good proxy for Brno. Its population is more than twice that of the FUA. (h) Districts of Plzen, Plzen-sever, Plzen-jih and Rokycany. (i) Districts of Liberec and Jablonec nad Nisou. (j) Districts of Karlovy Vary and Sokolov. 38
39 3.5.3 Conclusions The Czech urban pattern could appear as quite polycentric, but the functional weight of Praha is however overwhelming, insofar as the Ostrava metropolitan area is a conurbation of badly structured urban settlements, with strong environmental problems to be solved. It is quite the same in the urban, mining and industrial range in crisis extending along the north-western border of the country along the Erzgebirge from Karlovy Vary-Sokolov to Liberec-Jablonec nad Nisou. Even if lacking really large cities, except for Prague, the urban system is characterized by a regular, well developed (also in terms of urban character) network of medium-size and small towns. Brno and Plzen have a strong historical core and are in a better situation as for their development, as they are well located on two main corridors, to Austria and southern Germany. Brno and Ceske Budejovice develop a strong willingness of transborder cooperation, respectively with Vienna and Linz. However, according to our criteria, these two cities are too far from their transborder partner to be considered as parts of true polynuclear transborder metropolitan areas. The same is true at another scale for Usti nad Labem towards Dresden. Inversely, one can consider a big transborder polycentric metropolitan area at a small scale associating the Polish Upper Silesian basin with the Ostrava metropolitan area (see further, transborder FUAs chapter ). Inside this transborder polynuclear metropolitan area, a transborder MUA links Cesky Tesin and Cieszyn. 39
40 3.6 Denmark Criticism of the ESPON FUAs The list of FUAs, as identified in ESPON 1.1.1, is complete and generally corresponds with the urban network and the labour pools as identified in other sources of scientific, planning and statistical nature. However, to respect the European-wide criteria, we have excluded 11 small FUAs considered by ESPON 1.1.1, with populations between only 35 and 23 thousand inhabitants. When only FUAs above the 50,000 inhabitants threshold are considered, their list almost fully complies with the map of important urban centres produced by the Danish Ministry of Environment and Energy in 1999, except of Aabenraa. The only centres appearing on this map but not included among the FUAs are parts of the larger metropolitan area of Copenhague, either included in Copenhague's morphological area (Roskilde), or as secondary cores (Helsingor, Hillerod, Koge). Fredericia (with Middelfart) can be considered as a secondary core inside the Kolding's FUA. Due to their big size, Danish municipal cores don't reach the 650 inhab./km 2 threshold, except in the Copenhague metropolitan area: it is even true for the second and the third most important Danish cities, Aarhus and Odense The Danish urban pattern: population data FUAs and poly-fuas Population Espon Population MUAs MUA's populatio n NUTS-3 proxys Population Metropolis Kobenhavn (a) Kobenhavn Helsingor Koge Hillerod DK001, DK002, DK003, DK Large cities Aarhus Aarhus 287 Odense Odense 184 Aalborg Aalborg 162 Medium cities Kolding Kolding Fredericia Vejle Vejle 55 Esbjerg Esbjerg 83 Randers Randers 62 Holbaek Holbaek 34 Slagelse Slagelse 37 Herning Herning 58 40
41 Naestved Naestved 47 Small cities Viborg Viborg 42 Horsens Horsens 57 Holstebro Holstebro 41 Haderslev Haderslev 32 Silkeborg Silkeborg 53 Sönderborg Sönderborg 30 Hjörring Hjörring 35 Aabenraa Aabenraa 22 Svendborg Svendborg 43 Nyköbing Falste Nyköbing Falste 25 Frederikshavn Frederikshavn 35 Skive Skive 28 (a) Danish side only. See transborder FUAs chapter for the links with Malmö, in the framework of an Öresund polycentric transborder metropolis Conclusions The Danish urban system appears strangely in the light of the ESPON report as one of the most polycentric in Europe. It should be noted, however, that with regard to one of the basic polycentricity criteria, i.e. the size distribution of urban places, but also its functional hierarchy, its structure is highly skewed in favour of Copenhague s metropolitan area. It is true that for the rest, Danish cities are quite small and properly cover the territory (with a slight underrepresentation in Southern and Western Jutland), sometimes forming networks of specialised cities, like in Central Jutland. Urbanisation is organised along two main axes: the Western Jutland South-North axis, from Aabenraa to Frederikshavn, and the West-East axis, linking the first one to Copenhague through Odense. Aarhus, with the most dynamic growth among Danish cities, Odense, Aalborg and Esbjerg have been designated as national centres by the Danish spatial planning authorities. Two other multipolar so-called national centres have recently been designated: Herning-Holstebro and Kolding-Fredericia-Vejle. 41
42 3.7 Estonia Criticism of the ESPON FUAs Some small towns identified as FUAs in ESPON are clearly not of European-wide importance, with their FUAS populations from only 37 to 22 thousand inhabitants and their cores populations under 20 thousand (and in decline, but this is also the case of bigger cities, due to the emigration of non-estonians after 1991, a negative natural balance and the decline of the Soviet-time heavy industry). For the rest, the 5 remaining FUAs fit with the criteria and generally correspond to the urban hierarchy identified for the purpose of the National Planning Document Estonia 2010 and by the document The Estonian urban System produced by Rivo Noorkoiv for Interreg IIC project on Urban Systems in the Baltic Sea Region. It is understandable that FUAs are defined in terms of economic linkages of various kinds, not necessarily only involving daily commuting. However, if the estimations of FUAs populations given by ESPON are not very higher than morphological cores populations, they seem to be likely, if one takes into account the low population densities, the size of some NUTS-5 areas and the low level of suburbanization which characterized the centrally planned economies. We will thus consider ESPON populations as correct for the retained FUAs The Estonian urban pattern: population data FUAs and poly-fuas Population Espon Population MUAs MUA's populati on NUTS-3 proxys Population Metropolis Tallinn Tallinn 416 EE Medium city Tartu Tartu 101 Small cities Narva (a) Narva 68 Kohtla-Järve Kohtla-Jarve 47 Pärnu Pärnu 45 (a) Estonian side of the Narva-Ivangorod transborder FUA. Population for the Russian side of the MUA: 11 thousand inhab., unknown for the FUA. See transborders FUAs chapter. 42
43 3.7.3 Conclusions Tallinn is clearly the only Estonian city of European-wide importance, even if it remains a small capital city. More than one third of the Estonian population lives in Tallinn's FUA, which strongly dominates the Estonian urban network. Tartu is clearly the second pole in the Estonian urban network, even if it appears as a quite small city at the European scale. It is also the only inland FUA. Narva and Kothla-Järve are located in an industrialized and urbanized area situated in the north-eastern corner of the country. Narva is on the border with Russia and, as an industrialized city, does not perform any important central-place functions. Narva is also a transborder city, but we don't have data for the Russian side of the Ivangorod FUA. Nearly half of the Estonian population lives in the five FUAs. 43
44 3.8 Finland Criticism of the ESPON FUAs The list of FUAs in Finland, as presented in the ESPON final report, is a too complete representation of the set of towns in that country. It includes very small FUAs, with less than 50 thousand inhabitants. Excluding these small FUAs, the whole set of the cores of the towns proposed as FUAs have populations above the threshold of 20 thousand inhabitants (at least at municipal level, even if a part of the population may not live in the very urban part of the municipality, so that most of the core municipalities don't reach the level of 650 inhab./km!). Even if the Finnish conditions are quite specific, due to the generally low population densities, it remains fully coherent and justified to use the European-wide criteria. We have thus excluded 12 so-called FUAs considered as such in ESPON Kemi and Tornio are considered as a single labour pool, as suggested by Statistics Finland. The remaining FUAs give an image very similar to the one proposed by the Interreg IIC project on Urban systems in the Baltic area, and more generally by the geographical literature. We argue that ESPON FUAs fit with the labour pools defined by Statistics Finland in 1998 and thus the populations of the FUAs are coherent with our European-wide definition. Moreover, examining the ratio between FUAs' populations provided by ESPON and cores' populations gives plausible results. This is why we have used the ESPON data as such The Finnish urban pattern: population data FUAs and poly-fuas Population Espon Population MUAs MUA's population NUTS-3 proxys Population Metropolis Helsinki Helsinki 1065 FI Large cities Turku Turku 218 Tampere Tampere 269 Medium cities Oulu Oulu 123 Lahti Lahti 118 Jyvaskyla Jyvaskyla 80 Kuopio Kuopio 87 Pori Pori 76 Vaasa Vaasa 57 Small cities Kouvola Kouvola 52 Joensuu Joensuu 52 Lappeenranta Lappeenranta 58 44
45 Hameenlinna Hameenlinna 46 Kotka Kotka 55 Rauma Rauma 37 Seinajoki Seinajoki 31 Kemi-Tornio (a) Kemi Tornio Rovaniemi Rovaniemi 35 Mikkeli Mikkeli 33 Kajaani Kajaani 36 Salo Salo 25 Kokkola Kokkola 36 (a) Data for the Finnish side. Kemi-Tornio is considered as a single labour pool by Statistics Finland, even if the two cores are separated. In addition, the morphological centre of the Swedish municipality of Haparanda is only separated from the morphological core of Tornio by a river, crossed by a bridge, forming a transborder FUA. See transborder s FUAs chapter Conclusions Finland remains less urbanised than the other Nordic countries. The Finnish urban pattern is strongly dominated by the capital-city region, including the new towns of Espoo and Vantaa. Helsinki appears to be the only metropolis in Finland. The strong internationalisation of the Finnish economy has still accentuated this trend. The only two other large cities are Turku and Tampere, the last one also with its important satellite city of Nokia. The Finnish urban system is organised along three axes of urban trajectory, the two most important crossings at Helsinki. The first one stretches along the Southern coast from Turku to Kotka and the Russian boundary towards St. Petersburg. The second one stretches South-North from Helsinki to Tampere. Another more secondary axis of urban trajectory hugs the coast from Vaasa to the Swedish border at Kemi-Tornio. Even when excluding the smallest FUAs which were considered by ESPON 1.1.1, the Finnish urban network seems to support quite well local development and welfare services in the less densely populated regions of the central and Eastern parts of the country. However, the rural areas still lose inhabitants to the advantage of provincial cities, which in turn send people to the biggest cities, mainly Helsinki metropolitan region, but also Turku, Tampere and, to a lesser extent, Oulu. 45
46 3.9 France Criticism of the ESPON FUAs ESPON data fit perfectly with the very good labour pools data (the aires urbaines ) computed by the INSEE, i.e. the urban cores and the set of surrounding municipalities where 40% of the active population work in the aire urbaine as a whole. Even if it not exactly our definition, results should be more or less similar. We have excluded some FUAs proposed by ESPON but with less than 50 thousand inhab. in the FUA and/or less than 20 thousand in the core The French urban pattern: population data The lines in yellow show the FUAs that are integrated in the poly-fua described in the preceding white line, so every white line preceding a yellow one describes a poly-fua. FUAs and poly-fuas Population Espon Population MUAs MUA's population NUTS-3 proxys Population Metropolitan and polynuclear metropolitan areas Paris Paris Melun Mantes-la-Jolie Meaux Fontainebleau Chantilly Rambouillet Etampes FR101, FR102, FR103, FR104, FR105, FR106, FR107, FR Lille-Bassin minier (a) 2591 n.c. Lille Lens Douai Somain-Aniche Bruay-la- Buissière Béthune Valenciennes Denain Arras Armentières Cambrai FR301 (partim, arrondissements of Cambrai, Douai, Lille, Valenciennes), FR302 (partim arrondissements of Arras, Béthune, Lens) (b) 2854 Lille (a) Lille 953 FR 301 (arr. Lille) Douai-Lens Lens Douai Somain-Aniche Valenciennes Valenciennes Denain FR 301 (arr. Douai), FR302 (arr. Lens) FR 301 (arr. Valenciennes) 46
47 Béthune Bruay-la- Buissière Béthune FR302 Béthune) (arr. Arras Arras 77 FR302 (arr. Arras) Armentières Armentières 41 included in FR301 (arr. Lille) Cambrai Cambrai 45 FR301 (arr. Cambrai) Lyon metropolitan area 1787 n.c. Lyon Bourgoin- Jallieu/L'Isled'Abeau Givors Villefranchesur-Saône Vienne FR Lyon (c) Lyon Bourgoin- Jallieu/L'Isled'Abeau Givors Villefranchesur-Saône Villefranchesur-Saône 49 Vienne Vienne 37 Marseille-Aixen-Provence (d) Marseille Aix-en- Provence Vitrolles Fos/Martigues Gardanne La Ciotat FR Nice-Côte d'azur (e) 1082 n.c. Nice Cannes Antibes Fréjus Monaco Menton FR Nice Nice Cannes Antibes Monaco- Menton (e) Monaco Menton Fréjus Fréjus 77 Bordeaux Bordeaux 652 FR Toulouse Toulouse 588 FR623 (f) 1067 Nantes Nantes 536 FR Strasbourg (g) Strasbourg 417 FR421 (h) 1039 Rouen-Elboeuf Rouen 419 FR232 (partim,
48 (i) arr. Rouen) (j) Grenoble Grenoble Voiron FR714 (partim arr. Grenoble) (k) 493 Toulon Toulon 410 Rennes Rennes 252 Large cities Montpellier Montpellier 323 Metz Metz Hagondange Clermont- Ferrand Ferrand 261 Saint-Etienne Saint-Etienne Saint-Chamond Tours Tours 242 Caen Caen 195 Orléans Orléans 243 Nancy Nancy Meurthe Angers Angers 185 Avignon Avignon Carpentras Cavaillon Dijon Dijon 228 Brest Brest Clermont- Dombasle-sur- Mulhouse- Thann (l) Mulhouse 211 Le Havre Le Havre 236 Le Mans Le Mans 171 Reims Reims 213 Dunkerque Dunkerque 159 Amiens Amiens 154 Medium cities Limoges Limoges 149 Nîmes Nîmes 133 Chambéry Chambéry Aix-les-Bains Perpignan Perpignan 124 Besançon Besançon 128 Pau Pau 135 Bayonne Bayonne
49 Annemasse (m) Annemasse 69 Poitiers Poitiers 101 Annecy Annecy 125 Lorient Lorient 110 Montbéliard Montbéliard 113 Saint-Nazaire Saint-Nazaire 111 Troyes Troyes 117 La Rochelle La Rochelle 102 Valence Valence 101 Thionville (n) Thionville 138 Angoulême Angoulême 84 Avold (o) Forbach 76 Forbach-Saint- Boulogne-sur- Mer Châlon-sur- Saône Boulogne-sur- Mer Châlon-sur- Saône Chartres Chartres 86 Calais Calais 83 Niort Niort 57 Béziers Béziers 75 Bourges Bourges 81 Saint-Brieuc Saint-Brieuc 82 Quimper Quimper 63 Vannes Vannes 52 Cherbourg Cherbourg 83 Maubeuge Maubeuge 64 Blois Blois 53 Colmar Colmar 74 Tarbes Tarbes 70 Compiègne Compiègne 50 Charleville- Mézières Mézières 59 Roanne Roanne 56 Belfort Belfort 72 Saint-Quentin Saint-Quentin 66 Laval Laval Charleville- Bourg-en- Bresse Bourg-en- Bresse 41 49
50 Nevers Nevers 44 Small cities Beauvais Beauvais 55 Creil Creil 72 La Yon Roche-sur La Roche-sur- Yon 49 Evreux Evreux 55 Agen Agen 45 Saint-Omer Saint-Omer 34 Périgueux Périgueux 44 Châteauroux Châteauroux 58 Epinal Epinal 56 Le Creusot- Montceau-les- Mines Mines Le Creusot Alès Alès n.c. Montceau-les- Brive-la- Gaillarde Gaillarde 56 Macon Macon 45 Auxerre Auxerre 38 Saint-Louis (p) Saint-Louis 29 Carcassonne Carcassonne 44 Dieppe Dieppe 35 Vichy Vichy Brive-la- Châlons-en- Champagne Champagne 53 Montluçon Montluçon 46 Ajaccio Ajaccio 53 Bastia Bastia 38 Montauban Montauban 52 Cholet Cholet 54 Albi Albi 59 Bergerac Bergerac 26 Narbonne Narbonne 47 Saint-Malo Saint-Malo Châlons-en- Thonon-les- Bains Thonon-les- Bains 29 Châtelleraut Châtelleraut 34 Montargis Montargis 35 Sète Sète 64 50
51 Le Puy-en- Velay Romans-sur- Isère Le Puy-en- Velay Romans-sur- Isère Rodez Rodez 24 Alençon Alençon 36 Soissons Soissons 36 Cluses Cluses 33 Haguenau Haguenau 50 Montélimar Montélimar 31 Moulins Moulins 39 Dreux Dreux 43 Sens Sens 27 Saint-Dizier Saint-Dizier 33 Aurillac Aurillac 31 Mont-de- Marsan Marsan 30 Arcachon Arcachon Mont-de- Lons-le- Saunier Saunier 23 Arles Arles 50 Saintes Saintes Lons-le- Salon-de- Provence Salon-de- Provence 37 Luxembourg 41 n.c. Longwy (n) 35 Luxembourg n.c. Villerupt (q) 18 (q) Donostia-San Sebastian n.c. Hendaye (r) 13 (r) Genève n.c. Fernay-Voltaire (s) 7 (s) (a) French side only. See transborder FUAs chapter for the transborder polycentric metropolitan area with the Belgian side and the small Belgian part of Lille's own FUA. (b) The whole departments of Nord (FR301) and Pas-de-Calais (FR302) can not be used as proxys. It should be necessary to revise the NUTS3 division in this area, or to provide more data at the NUTS4 level. (c) Including the FUA of Bourgoin-Jallieu. (d) Including the FUA of Fos-sur-Mer. (e) French side only (including Monaco). See transborder FUAs chapter for the Italian side. (f) It could be better to exclude the arrondissement of Saint-Gaudens (73 thousand inhab.) from the proxy if data were provided at the NUTS4 level. (g) French side only. See transborder FUAs chapter. (h) The department of Bas-Rhin is a bit too large as proxy for Strasbourg. If more data were available at NUTS4 level, it should be better to exclude the arrondissements of Saverne, Haguenau and Wissembourg, with respectively 88, 64 and 121 thousand inhab. (i) Including Elboeuf's FUA, which is a part of the MUA of Rouen. (j) The whole department of Seine-Maritime (1224 thousand inhab.) is too large to be used as proxy. Data at NUTS4 level should be necessary. (k) The whole department of Isère (1108 thousand inhab.) is too large to be used as proxy. Data at NUTS4 level should be necessary. 51
52 (l) See transborder FUAs chapter for the transborder polycentric metropolis with Basel. (m) French side of the southern part of the Geneva FUA. See transborder FUAs chapter for the transborder metropolis of Geneva as a whole. (n) French side only. Thionville and Longwy basins can also be considered as two parts of the Luxembourg basin. See transborder chapter. Moreover, Longwy's MUA is a part of a transborder MUA with Pétange (Luxemburg) and Aubange (Belgium). (o) French side only. We have added the FUAs of Saint-Avold and Forbach, but Saint-Avold doesn't reach the threshold for being an individual MUA. See transborder FUAs chapter for the links with Saarbrücken. (p) French side of Basel's FUA. See transborder FUAs chapter. (q) French part of Esch-sur-Alzette's MUA only. See transborder FUAs chapter. (r) French part of Irun-Hendaye's MUA only. See transborder FUAs chapter. (s) French part of the north of Geneva's MUA only. See transborder FUAs chapter Conclusions For centuries, the French urban system has been very macrocephalic, strongly dominated by Paris. However, due to a policy of development of métropoles d'équilibre from the 60s and to a weaker growth of the Parisian basin from the 90s, a set of regional metropolises emerges, whereas, more generally, French urbanisation was very dynamic after World War 2. However, these metropolises have much difficulty to impose themselves as main cores at the European level, due to the functional concentration in Paris. Even if the whole population of the Lille-Bassin minier polycentric metropolis is more numerous than the population of Lyon's metropolitan area, the latter benefits from a stronger urban structure. Secondary cities, mainly in the west and the south of the country, benefit from the very dynamic growth of the last two decades. Outside the main corridor Lille/Le Havre-Paris-Lyon-Marseille and the north-eastern border area, the French urban system remains characterised by FUAs isolated from each other by rural areas, footprint of the situation which prevailed until the end of World War 2, when France was still predominantly agricultural on the largest parts of its territory. Rural exodus continues in deep rural areas outside the limits of the FUAs, even if these are expanding. 52
53 3.10 Germany Criticism of the ESPON FUAs Generally, data provided by ESPON underestimate the size of German FUAs very much, as they often limit a FUA to the sole Kreisfreistadt located at its centre. We have used German commuting data, allowing the application of our criteria at the threshold of 10% of the active population commuting to a centre, considering the main commuting direction. Some very small FUAs considered by ESPON 1.1.1, but which do not reach the 50 thousand inhab. threshold, have been excluded (Rendsburg, Singen, Wolfen, Greiz, Bühl, Freiberg, Riesa, Eisenach) The German urban pattern: population data The lines in yellow show the FUAs that are integrated in the poly-fua described in the preceding white line, so every white line preceding a yellow one describes a poly-fua. The lines in light blue are also poly-fuas but integrated themselves in a super-poly-fua described in the preceding white line. FUAs and poly-fuas Population Espon Population MUAs MUA's population NUTS-3 proxys Population Metropolitan and polynuclear metropolitan areas Rhein-Ruhr n.c. see beneath DEA23,DEA24,DEA27, DEA2B,DEA22,DEA2C, DEA11,DEA1C,DEA1D, DEA12,DEA14,DEA15, DEA1E,DEA52,DEA5C, DEA13,DEA16,DEA17, DEA31,DEA32,DEA36, DEA51,DEA55,DEA1A, DEA56,DEA53,DEA54, DEA18,DEA19,DEA33, DEA35,DEA of which Rhein- Süd 3070 n.c. see beneath DEA23,DEA24,DEA27, DEA2B,DEA22,DEA2C 2729 Köln Köln Troisdorf Bergheim Pulheim Gummersba ch Brühl Siegburg Leichlingen (Rh) DEA23,DEA24,DEA27, DEA2B 1853 Bonn Bonn 306 DEA22,DEA2C
54 Sankt Augustin Meckhenhei m Euskirchen Euskirchen 54 included in DEA27 of which Rhein- Nord 3073 n.c. see beneath DEA11,DEA1C,DEA1D, DEA12,DEA14,DEA15, DEA1E 2840 Düsseldorf Düsseldorf Langenfeld (Rh) Monheim am Rhein Mettman DEA11,DEA1C,DEA1D 1519 Duisburg Duisburg 758 DEA Krefeld Krefeld Willich DEA Mönchen- Gladbach Gladbach 263 DEA15,DEA1E 563 Viersen 77 n.c. Viersen 77 included in DEA1E Dormagen 63 n.c. Dormagen 63 included in DEA1D of which Ruhr 5376 n.c. see beneath DEA52,DEA5C,DEA13, DEA16,DEA17,DEA31, DEA32,DEA36,DEA51, DEA55,DEA1A,DEA56, DEA53,DEA54,DEA18, DEA Dortmund Dortmund Unna Bergkamen Kamen DEA52,DEA5C Mönchen- Essen- Oberhausen Essen- Oberhausen 986 DEA13,DEA16,DEA Bottrop-Marl Gelsenkirchen- 946 n.c. Gelsenkirch en-bottrop Marl Oer- Erkenschwi ch DEA31,DEA32,DEA Bochum-Herne Bochum- Herne 804 DEA51,DEA Wüppertal Wüppertal Wülfrath DEA1A,DEA Hagen Hagen 291 DEA Hamm Hamm 184 DEA Remscheid 197 n.c. Remscheid 119 DEA Solingen 165 n.c. Solingen 165 DEA
55 Iserlohn Iserlohn 99 not included in the proxy Velbert- Heiligenhaus 118 n.c. Velbert- Heiligenhau s 118 included in DEA1C of Münster which Münster 267 DEA33,DEA35,DEA Rhein-Main 4149 n.c. Frankfurt am Main- Offenbach- Hanau Darmstadt Wiesbaden Mainz Rüsselshei m Aschaffenb urg Bad Nauheim DE712,DE713,DE718, DE71A,DE71C,DE719, DE71E,DE261,DE264, DE269,DE711,DE716, DE717,DE714,DE71D, DEB35,DEB3B,DEB3J 4237 Frankfurt Main (a) am Frankfurt am Main- Offenbach- Hanau Rüsselshei m Aschaffenb urg Bad Nauheim DE712,DE713,DE718, DE71A,DE71C,DE719, DE71E,DE261,DE264, DE Darmstadt Darmstadt 407 DE711,DE716,DE Wiesbaden Wiesbaden 277 DE714,DE71D 453 Mainz Mainz 194 DEB35,DEB3B,DEB3J 501 Berlin (b) Berlin 3776 DE301,DE302,DE München- Augsburg 3271 n.c. München Augsburg Freising DE212,DE217,DE21C, DE21H,DE21L,DE21A, DE21B,DE218,DE21F, DE216,DE271,DE275, DE München München Freising DE212,DE217,DE21C, DE21H,DE21L,DE21A, DE21B,DE218,DE21F, DE Augsburg Augsburg 371 DE271,DE275,DE Hamburg Hamburg 2123 DE600,DE933,DE939, DEF06,DEF09,DEF0D, DEF0F 3067 Rhein-Neckar 2931 n.c. Mannheim Karlsruhe Heidelberg DE122,DE123,DE125, DE126,DE128,DEB34, DEB38,DEB39,
56 Ludwigshaf en am Rhein Pforzheim Neustadt an der Weinstrasse Speyer Landau (Pfalz) DEB33,DEB3H, DEB36,DEB3I,DEB3C, DEB3E,DE129,DE12B Karlsruhe Karlsruhe 440 DE122,DE Mannheim Mannheim 508 DE125,DE126,DE Ludwigshafen am Rhein Ludwigshaf en am Rhein 265 DEB34,DEB38,DEB39, DEB33,DEB3H,DEB36, DEB3I,DEB3C,DEB3E 901 Heidelberg Heidelberg 269 included in Mannheim Pforzheim Pforzheim 124 DE129,DE12B 309 Landau (Pfalz) Landau (Pfalz) 41 included in Ludwigshafen Neustadt der Weinstrasse an Neustadt an der Weinstrasse 54 included in Ludwigshafen Speyer Speyer 50 included in Ludwigshafen Stuttgart Metropolitan area 2665 n.c. Stuttgart Tübingen Reutlingen DE111,DE112,DE113, DE114,DE115,DE116, DE141,DE Stuttgart Stuttgart 1735 DE111,DE112,DE113, DE114, DE115,DE Tübingen Tübingen 82 DE Reutlingen Reutlingen 41 DE Nürnberg-Fürth metropolitan area (c) Nürnberg- Fürth Erlangen DE254,DE255,DE253, DE252,DE258,DE259, DE257,DE25B,DE248, DE251,DE Nürnberg-Fürth (c) Nürnberg- Fürth Erlangen DE254,DE255,DE253, DE252, DE258,DE259,DE257, DE25B, DE Ansbach Ansbach 40 DE251,DE Leipzig-Halle 1214 n.c. Leipzig Halle/Saale DED31,DED32,DED34, DED35,DEE21,DEE Leipzig Leipzig 516 DED31,DED32,DED34, DED Halle/Saale Halle/Saale 243 DEE21,DEE
57 Merseburg 37 Bielefeld- Detmold 1173 n.c. Bielefeld Bad Oeyenhaus en Herford Detmold DEA41,DEA42,DEA43, DEA Bielefeld Bielefeld 419 DEA41,DEA Detmold Detmold 74 DEA Bad Oeynhausen Bad Oeynhause n 91 DEA Herford Herford 86 included in DEA43 Bremen Bremen 709 DE501,DE936,DE Braunschweig- Wolfsburg 1004 n.c. Braunschwe ig Wolfsburg Salzgitter Peine DE911,DE918,DE913, DE914,DE917,DE912, DE91A 1036 Braunschweig Braunschwe ig 246 DE911,DE Wolfsburg Wolfsburg 122 DE913,DE914,DE Salzgitter Salzgitter 112 DE Peine Peine 49 DE91A 132 Hannover 997 (h) 997 Hannover 747 DE921,DE Saarbrücken (d) 959 (h) 959 Saarbrücke n 552 DEC01,DEC03,DEC04, DEC05, DEC Aachen Metropolitan area (Euroregio MAHL s german side) (d) 907 n.c. Aachen Herzogenra th Düren Eschweiler DEA21,DEA25,DEA29, DEA Aachen (d) Aachen Herzogenra th Eschweiler DEA21,DEA25,DEA Düren Düren 92 DEA Dresden Dresden 697 DED21,DED25,DED27, DED2A 879 Chemnitz- Zwickau 875 n.c. Chemnitz Zwickau Aue DED11,DED15,DED1A, DED13,DED1C,DED1B 879 Chemnitz- Zwickau (e) Chemnitz Zwickau DED11,DED15,DED1A, DED13,DED1C 737 Aue Aue 37 DED1B 142 Freiburg im Freiburg im 263 DE131,DE132,DE
58 Breisgau Breisgau Kassel Kassel 255 DE731,DE Large cities Osnabrück Osnabrück 164 Kiel Kiel 266 Magdeburg Magdeburg Schönebeck /Elbe Regensburg Regensburg 139 Ulm (f) Ulm 169 Koblenz Koblenz 124 Erfurt (g) Erfurt Weimar Würzburg Würzburg 164 Heilbronn Heilbronn 176 Lübeck Lübeck 237 Göttingen Göttingen 124 Ingolstadt Ingolstadt 117 Paderborn Paderborn 141 Rostock Rostock 199 Oldenburg Oldenburg 156 Siegen Siegen 141 Kaiserslautern Kaiserslaut ern 100 Giessen Giessen 89 Medium cities Trier Trier 100 Fulda Fulda 63 Bamberg Bamberg 73 Schweinfurt Schweinfurt 62 Hildesheim Hildesheim 104 Rosenheim Rosenheim 77 Bremerhaven Bremerhave n 119 Schwerin Schwerin 100 Strasburg - Offenburg (d) Offenburg Kehl (j) Offenburg Offenburg 58 Kehl (d) 54 n.c. Kehl 34 Minden Minden 83 58
59 Bayreuth Bayreuth 75 Marburg an der Lahn Marburg an der Lahn 78 Passau Passau 51 Flensburg Flensburg 84 Landshut Landshut 60 Emden Emden 51 Celle Celle 72 Jena Jena 101 Schwäbisch Gmünd Schwäbisch Gmünd 68 Gera Gera 110 Lüneburg Lüneburg 68 Cottbus Cottbus 106 Hameln Hameln 59 Wilhelmshaven Wilhelmsha ven 85 Hof Hof 51 Kleve (d) Kleve 49 Coburg Coburg 48 Weiden (Oberpfalz) Weiden (Oberpfalz) 43 Bautzen Bautzen 43 Dessau Dessau 81 Wetzlar Wetzlar 53 Kempten (Allgau) Kempten (Allgau) 62 Neumünster Neumünste r 87 Rheine Rheine 76 Amberg (Oberpfalz) Amberg (Oberpfalz) 44 Plauen Plauen 71 Straubing Straubing 44 Basel (d) 127 n.c. Lörrach Rheinfelden / Baden Lörrach -Weil (a) Rheinfelden/ Baden Lörrach - Weil 46 n.c. Rheinfelden / Baden Lippstadt Lippstadt 67 59
60 Neubrandenburg Neubranden -burg 72 Limburg Limburg 44 Goslar Goslar 44 Arnsberg Arnsberg Halberstadt Halberstadt 41 Gotha Gotha 49 Wittenberg Wittenberg 48 Stendal Stendal 39 Lingen Lingen 51 Bocholt Bocholt 73 Pirmasens Pirmasens 45 Nordhorn (d) Nordhorn 52 Nordhausen Nordhausen 45 Small cities Görlitz (d) Görlitz 60 Bad Hersfeld Bad Hersfeld 31 Stralsund Stralsund 60 Deggendorf Deggendorf 31 Altenburg Altenburg 41 Neumarkt Neumarkt 39 Suhl Suhl 47 Kaufbeuren Kaufbeuren 42 Frankfurt an der Oder (d) Frankfurt an der Oder 70 Brandenburg Brandenbur g Hoyerswerda Hoyerswerd a Dillenburg Dillenburg 25 Greifswald Greifswald 54 Memmingen Memminge n Bad Kreuznach Bad Kreuznach Baden-Baden Baden- Baden Villingen- Schwenningen Villingen- Schwenning en 82 60
61 Wismar Wismar 47 Saalfeld Saalfeld 30 Ibbenbüren Ibbenbüren 49 German side of Salzburg's FUA (d,h ) n.c. 81 Konstanz (d) Konstanz 79 Cuxhaven Cuxhaven 53 Ravensburg Ravensburg 72 Menden (Sauerland) 71 n.c. Menden (Sauerland) 59 Naumburg Naumburg 30 Eberswalde- Finow Garmisch- Partenkirchen Eberswalde -Finow Garmisch- Partenkirch en Heidenheim Heidenheim 51 Rudolstadt Rudolstadt 28 Bregenz 46 (h) n.c. Lindau (d) 32 Enschede - Hengelo 45 (h) n.c. Gronau (d) 45 (a) Offenbach, Hanau and Aschaffenburg are considered by ESPON as separate FUAs, with only the population of their Kreisfreistadt for the two first. Rüsselsheim is also considered as a separate FUA by ESPON 1.1.1, with the population of the municipality only. These cities are in fact included in Frankfurt's FUA ; Offenbach and Hanau even in Frankfurt's MUA. (b) Potsdam is considered as a separate FUA by ESPON 1.1.1, with only the population of the Kreisfreistadt. It is included in Berlin's MUA and FUA using our criteria. (c) Fürth is included in Nürnberg's MUA. It is considered by ESPON as a separate FUA, with only the population of the Kreisfreistadt. Erlangen is also considered as a separate FUA by ESPON (d) German side only. See transborder FUAs chapter (e) According to the German commuting statistics, Zwickau is included in the FUA of Zwickau. (f) Neu-Ulm is included in Ulm's MUA. It is considered by ESPON as a separate FUA. (g) Weimar is considered as a separate FUA by ESPON 1.1.1, with a population of 66 thousand inhabitants, that is, the population of the Kreisfreistadt only. ESPON mentions a population of 205 thousand inhab. for the sole FUA of Erfurt. (h) Estimation Conclusions The German urban network is perhaps the strongest and the most truly polycentric in Europe, as it is also the most polycentric from the functional point of view. But the German polycentricity is organised mainly in the west and the south of the country around very large conurbations, the Rhine-Ruhr area being globally of the same size as London and Paris metropolitan regions (even if not with the same weight regarding the location of the headquarters of transnational firms). In fact, German polycentricity can be recognised at two levels: a global polycentricity at the level of Germany as a whole; a regional 61
62 polycentricity inside the most important metropolitan areas (Rhine-Ruhr, Rhine-Main, Rhine-Neckar, Stuttgart metropolitan area, Nürnberg-Fürth, Leipzig-Halle, Bielefeld- Detmold, Braunschweig-Wolfsburg, Chemnitz-Zwickau), with the exception of Berlin, München and Hamburg. The urban network is less dense and more a Christallerian one in the north-east and in the south-east, outside Nürnberg and München metropolitan areas. Berlin is clearly opposed to the Rhineland area: on one side, an heritage of a royal and imperial political construction at the mid of an empty medieval frontier area; on the other, the result of the development of the industrial revolution, on the basis of a dense network of small historical merchant cities, in one of the most densely populated parts of Europe. 62
63 3.11 Greece Criticism of the ESPON FUAs ESPON has strictly considered as FUAs the NUTS-3 corresponding units for the two main cities and the municipalities (NUTS 5) for all the others (with the only exceptions of Patrai where four municipalities were gathered, and Alexandroupolis, where three were gathered, exactly on the same basis as we have used for our own delineation of the MUAs). However, due to the character of small cities at the centre of generally quite low densely populated rural areas of most of the Greek cities outside the two main ones, and due to the characteristics of the often partitioned topography and to the size of the Greek municipalities, this approximation is perhaps not too bad. The FUAs of Athens and Thessaloniki extend however presumably further than the NUTS-3 borders, for instance around Athens until Korinthi, which should then be considered as a secondary core inside Athens' FUA, with 37 thousand inhabitants. More work remains thus to examine more indepth the geography of the labour pools in Greece. Until now, it is not possible to use better data than ESPON We have nevertheless added Kozani to the list, as it fits the 50,000 inhabitants threshold and is recognized as second-level place in the Greek urban hierarchy by the official Greek planning sources. A more in-depth analysis of the labour pools should perhaps add to the list of the more than 50 thousand inhabitants FUAs some small centres with less than this population size in the central municipality but presumably polarizing neighbour municipalities on their island, like Kerkyra and Mytilini. Conversely, the core's populations are presumably in general a bit smaller than the one we have proposed hereafter on the basis of the municipal data. The exception is Volos, where we have added a second municipality which pertains the density threshold The Greek urban pattern: population data FUAs and poly-fuas Population Espon Population MUAs MUA's populatio n NUTS-3 proxys Population Metropolises Athinai Athinai Korinthi (a) Megara GR Thessaloniki Thessaloniki 777 GR Medium cities Patrai Patrai 198 Iraklion Iraklion 155 Larisa Larisa 126 Small cities Volos Volos 85 Ioannina Ioannina 70 Kavalla Kavalla 63 Lamia Lamia 59 63
64 Kalamata Kalamata 58 Katerini Katerini 56 Serrai Serrai 56 Drama Drama 56 Agrinion Agrinion 54 Rhodos Rhodos 54 Khalkis Khalkis 54 Khania Khania 53 Alexandroupolis Alexandroupolis 53 Komotini Komotini 53 Kozani 52 n.c. Kozani 47 Xanthi Xanthi 52 Trikala Trikala 52 (a) Korinthi is presumably a secondary centre inside Athens' FUA, but is located outside the limits of our (too restricited) proxy for the FUA Conclusions The Greek urban network is extremely polarized around Athens and Thessaloniki, the two metropolises. The level of the large cities is empty, and the other cities are local centres, often more or less of the same size, mainly organized along two axes, the first between Athens and Thessaloniki, the second from Athens to Patras (Patrai). Heraklion (Iraklion) is clearly the main centre in Kriti. Some polycentric urban systems are proposed by the Greek planning authorities (Karditsa-Trikkala-Larisa-Volos; in Thraki between Serrai and Alexandroupolis), but as it concerns small cities and since we lack more empirical data, it is uneasy to know if they are true functional systems or rather seem to be planning aims only. 64
65 3.12 Hungary Criticism of the ESPON FUAs ESPON data for the Hungarian FUAs seem to be quite coherent with population data for the MUAs. The main problem appears around Budapest, where ESPON has considered as separate FUAs localities which are clearly, according to commuting data, secondary centres inside a big Budapest FUA, or even true morphological parts of the capital, at the fringe of the agglomeration. As to the rest, we have used ESPON data (with the only exception of the twin city Tatabanya-Tata). We have however excluded some small FUAs whose core does not reach the threshold of 20 thousand inhab. (Nagykata, Kisvarda, Mateszalka, Berettyoujfalu, Szerencs, Kiskoros, Kalocsa, Puspolkladany), as well as twenty FUAs proposed by ESPON but with less than 50,000 thousand inhab. Even so, the number of small cities remains remarkable The Hungarian urban pattern: population data FUAs and poly-fuas Population Espon Population MUAs MUA's population NUTS-3 proxys Population Metropolis Budapest (a) Budapest Vac Gödöllo Szentendre Monor Large cities HU101, HU Debrecen Debrecen 209 Miskolc Miskolc 184 Medium cities Nyiregyhaza Nyiregyhaza 119 Szeged Szeged 165 Pecs Pecs Komlo Györ Györ 128 Bekescsaba Bekescsaba 66 Kecskemet Kecskemet Nagyköros Szekesféhervar Szekesféhervar Varpalota Kaposvar Kaposvar 68 Szolnok Szolnok Torokszentmikl os
66 Cegled Cegled 38 Szombathely Szombathely 82 Dunaujvaros Dunaujvaros 55 Zalaegerszeg Zalaegerszeg 61 Small cities Eger Eger 58 Sopron (b) Sopron 54 Szekszard Szekszard 36 Tatabanya Tatabanya Tata Jaszbereny Jaszbereny 29 Veszprem Veszprem 60 Nagykanizsa Nagykanizsa 53 Baja Baja 38 Karcag Karcag 23 Gyöngyös Gyöngyös 34 Özd Özd 42 Mosonmagyarovar (c) 30 Salgotarjan Salgotarjan 47 Kazincbarcika Kazincbarcika 34 Oroshaza Oroshaza 33 Papa Papa Mosonmagyarovar Hodmezovasarhely 49 Ajka Ajka Hodmezovasarhely Hajduboszormeny 32 Hatvan Hatvan 24 Esztergom (c) Esztergom 29 Mohacs Mohacs Hajduboszormeny Kiskunfelegyhaza Kiskunfelegyhaza 33 Mako Mako 26 Paks Paks 21 Komarno 40 n.c. Komarom (d) 20 (a) Without the so-called individual FUAs considered by ESPON for Budaors (125 thousand inhab.), Rackeve (118), Gyal (98), Pilisvorosvar (86) which are in fact incorporated in the MUA of Budapest, and the FUAs of the small secondary centres inside the Budapest metropolitan region (Szentendre, with a so-called FUA of 69 thousand inhab.; Gödöllo, 116; Vac, 75; Monor, without any FUA identified by ESPON 1.1.1; Dunakeszi, 61, with less than 20,000 inhab. in its core. Including all those FUAs, the ESPON sum for Budapest should be 2523 thousand inhab. 66
67 (b) Sopron is too far from Vienna to be considered as a part of a transborder metropolitan area, even if Sopron is strongly developing cooperation with the Austrian side. (c) Hungarian side only. See chapter on transborder FUAs. (d) Hungarian side only. Population of the FUA estimated on the basis of twice the population of the MUA. See chapter on transborder FUAs Conclusions The Hungarian urban pattern is very strongly dominated by Budapest. The capital-city is surrounded by a belt of small secondary centres, which are more and more linked to the capital with a growing trend to suburbanisation. For the rest, the Hungarian urban system is very polycentric, and well distributed on the whole territory: it is in fact a pattern of medium and small cities, most of them originating from the big rural agglomerations which were founded in the Hungarian plain following the reconquest on the Ottoman Empire, or being small historical cities which survived on the frontier of the Habsburgian territoires, sometimes after having been wrecked or submitted to a more or less long period of Ottoman occupation or pressure. 67
68 3.13 Ireland Criticism of the ESPON FUAs Irish FUAs in general and Dublin's FUA in particular are clearly underestimated by ESPON For Dublin, ESPON only considers the population of the NUTS-3 unit, even less than the morphological area alone. Irish literature identifies surrounding small cities, none of which reaching the threshold of 20 thousand inhabitants (except Bray and Drogheda which are included in the Dublin morphological area), as located inside the labour pool of Dublin and becoming more and more dormitory cities. We have mapped the labour pool of Dublin, as well as those of Cork, Limerick, Galway, Waterford and Dundalk, using maps of the Travel to Work Patterns 2002, based on data provided by CSO POWSAR, at the level of 10% of the active resident population commuting to the core, exactly our criteria. For Tralee, we have excluded the southern part of the so-called basin, which is oriented towards Killarney, not dissociated from Tralee by the Irish document. As a proxy of the FUA of Dublin, one has to consider not only the NUTS-3 unit IE021, but also the surrounding unit IE022, gathering the counties of Meath, Kildare and Wicklow. The population of this region grows very quickly, and is thus higher now than the data used beneath (1661 in 2006, against 1497 with our 2000 data) The Irish urban pattern: population data FUAs and poly-fuas Population Espon Population MUAs MUA's population NUTS-3 proxys Population Metropolis Dublin Dublin 1070 IE021, IE Large cities Cork Cork 149 Limerick Limerick 69 Medium city Galway Galway 65 Waterford Waterford 24 Small cities Dundalk Dundalk 40 Tralee Tralee Conclusions The urban pattern of the Republic of Ireland is very monocentric, strongly concentrated on Dublin, with its quickly growing suburban fringe. As for the rest, the south of the Republic is more urbanised than the north, but cities, and esp. their cores, remain quite small, with the exception of Cork and to a lesser extent Limerick. 68
69 3.14 Italy Criticism of the ESPON FUAs An accurate description of the Italian urban system, having strict regard for our commuting flows criteria, is very difficult, even if the general overview we can produce gives a good idea of the very dense and polycentric Italian urban system. The reasons for these difficulties are as follows: The Italian urban system is so developed and small cities so close to each other in some regions (like in the Plain of the Pô, in Emilia-Romagna or along the Adriatic coast, not to mention Lombardy and Campania), that it is very difficult to isolate labour pools from each other; In other regions, like Puglia or Sicily, municipalities are very large and centred around former rural cities, with a clear urban landscape in the agglomerated part of the municipality, but weak urban functions. Now, using our criteria, many such municipalities have to be considered perhaps abusively as secondary cores inside other FUAs; Italian statistics do not provide us with true employment cores and with the most important direction of commuting for neighbouring municipalities, but with SLL (sistemi locali del lavoro) areas, covering the whole territory of the country. These were defined in 1991 on the basis of commuting flows but sometimes merging different small employment cores, or even sometimes dividing into different units the commuting basin of the most important metropolises. ESPON used SSL from We have used SSL from 2001, with some redefinitions of the areas; To define MUAs, it is difficult in some very densely populated regions, in particular around Milano and Napoli, to define the limits between one MUA and its neighbours (for instance, between Milano, Busto Arsizio and Como, or between Napoli and Torre Annunziatia/Castellamare di Stabia, densities are always very high and the right place to determine the lowest threshold is difficult to find. Therefore we were obliged not to cut inside those large urban areas). For all these reasons and even if we have estimated minor corrections, it is sometimes very debatable to define so-called FUAs, quite important in population using SSL statistics, but in fact corresponding more to regions with a dense scattered system of small interlinked cities, inside a semi-urbanised landscape. It is often the case in the Plaine of the Pô. We have used 2001 data instead of 1991 data used by ESPON and suppressed some small FUAs with less than 50 thousand inhab. and/or centres with less than 20 thousand inhab. (Sondrio, Lanciano, Domodossola, Oderzo, Desenzano del Garda, Sciacca, San Bonifacio, Salo, Cossato, Iseo, Guastalla, Darfo Boario Terme, Manerbio, Palmi, Luino, Montichiari, Castelvetrano, Nardo, Feltre, Cirie, Chiari, Portotolle, Gallipoli, Terracina, Avigliana, Santa Croce sull'arno, Lonigo, Suzzara). All these data and analyses have been achieved in collaboration with ERVET from Bologna, Emilia Romagna ( 69
70 The Italian urban pattern: population data The lines in yellow show the FUAs that are integrated in the poly-fua described in the preceding white line, so every white line preceding a yellow one describes a poly-fua. FUAs and poly-fuas Population Espon Population MUAs MUA's population NUTS-3 proxys Population Metropolitan and polynuclear metropolitan areas Milano polycentric metropolitan area (a) 5963 n.c. see beneath ITC15,ITC41,IT C42,ITC43, ITC45,ITC46,IT C48,ITC Milano Busto Arsizio Como (b) Milano Busto Arsizio Como Gallarate- Sestocalende Vigevano Abbiategrasso ITC42,ITC Bergamo Bergamo Palazzolo sull'oglio Treviglio ITC Lecco Lecco 112 ITC Varese Varese 194 ITC Novara Novara 102 ITC Pavia Pavia 71 ITC Lodi Lodi 40 ITC Crema Crema 33 not included in the proxy Borgomanero Borgomanero 22 not included in the proxy Napoli polycentric metropolitan area 3714 n.c. see beneath ITF31,ITF Napoli - Castellamare di Stabia-Torre Annunziata - Nola Napoli Castellamare di Stabia-Torre Annunziata Giugliano in Campania San Giuseppe Vesuviano ITF
71 Nola Vico Equense Caserta Caserta Mondragone ITF Aversa Aversa 200 included in ITF31 Nocera Inferiore Nocera Inferiore 164 not included in the proxy Sorrento Sorrento 57 included in ITF33 Roma Roma Guidonia Montecelio Tivoli Pomezia Monterotondo Albano Laziale Marino Cerveteri Ladispoli Ardea ITE Torino polycentric metropolitan area 1716 n.c. see beneath ITC Torino Torino Chieri Carmagnola Chivasso Pinerolo Pinerolo 33 Venezia- Padova polycentric metropolitan area 1401 n.c. see beneath ITD34,ITD35,IT D Venezia Venezia 483 ITD Padova Padova 370 ITD Treviso Treviso 80 ITD Firenze polycentric metropolitan area 1090 n.c. see beneath ITE13,ITE14,ITE Firenze Firenze 525 ITE Prato Prato 234 ITE Pistoia Pistoia 84 ITE Empoli Empoli San Miniato partially included in ITE14 71
72 Palermo Palermo Partinico Monreale Carini Misilmeri ITG Genova polycentric metropolitan area 859 n.c. see beneath ITC32,ITC Genova Genova 611 ITC Savona Savona 66 ITC Rapallo 46 n.c. Rapallo 39 included in ITC33 Catania Catania Paterno Giarre Belpasso Bologna Bologna Vignola Bari Bari Bitonto Terlizzi Mola di Bari Noicattaro Palo del Colle Giovinazzo ITG ITD ITF42 (c) 1581 Verona Verona 320 ITD Large cities Cagliari Cagliari Capoterra Taranto Taranto Martina Franca Massafra San Giorgio Ionico Brescia Brescia 327 Salerno Salerno Battipaglia Eboli Latina Latina Anzio-Nettuno Aprilia Cisterna di Latina Sezze Pescara Pescara Chieti Modena Modena
73 Reggio nell Emilia Castelfranco Emilia Reggio nell Emilia Scandiano Correggio Parma Parma 156 Vicenza Vicenza 125 Messina Messina 237 Udine Udine 116 Medium cities Frosinone Frosinone Alatri Ceccano Trieste Trieste 223 Lecce Lecce San Cataldo Reggio di Calabria Reggio di Calabria 179 Cosenza Cosenza 119 Pordenone Pordenone 79 Siracusa Siracusa Augusta Floridia Rimini Rimini 176 Ancona Ancona Osimo Cittadella- Castelfranco Veneto Cittadella Castelfranco Veneto Perugia Perugia 149 Foggia Foggia 146 Sassari Sassari 134 Piacenza Piacenza 95 La Spezia La Spezia Sarzana Brindisi Brindisi Mesagne Livorno Livorno 148 Terni Terni 104 Pisa Pisa San Giuliano Terme
74 Vittorio Veneto- Conegliano Vittorio Veneto Conegliano Ferrara Ferrara 130 Bisceglie Bisceglie 165 Trento Trento 112 Bassano del Grappa Bassano del Grappa 67 Ravenna Ravenna 138 Biella Biella 82 Agrigento Agrigento Licata Palma di Montechiaro Favara Barletta (d) Barletta 91 Bolzano Bolzano 93 Cuneo Cuneo 52 Lucca Lucca 120 Avellino Avellino 64 Massa-Carrara Massa Carrara Sassuolo Sassuolo 99 Mantova Mantova 46 Alessandria Alessandria 82 Potenza Potenza 69 Catanzaro Catanzaro 94 Forli Forli 108 Cassino Cassino 33 Asti Asti 71 Monfalcone (e) Monfalcone 38 Marsala Marsala Mazara del Vallo Trapani Trapani Erice Viterbo Viterbo 57 Benevento Benevento 61 Cremona Cremona 69 Arezzo Arezzo 92 Lugo Lugo 89 Montebelluna Montebelluna 34 74
75 Pesaro Pesaro 111 Carpi Carpi 61 Montevarchi 111 n.c. Montevarchi 39 Cesena Cesena 89 Crotone Crotone 51 Campobasso Campobasso 47 Portogruaro Portogruaro 24 Viareggio Viareggio Camaiore Massarosa Arzignano Arzignano 56 Ventimiglia (f) (f) San Remo 101 Caltanisetta Caltanisetta 61 San Remo- Montecatini- Terme Montecatini- Terme 29 Putignano 106 n.c. Putignano Conversano San Benedetto del Tronto San Benedetto del Tronto 81 Ascoli Piceno Ascoli Piceno 50 Ivrea Ivrea 29 Modica Modica Scicli Fano Fano 57 San Dona di Piave San Dona di Piave 35 Gela Gela Niscemi Siena Siena 49 Small cities Altamura 99 n.c. Altamura Gravina in Puglia Chiavari Chiavari 45 Velletri Velletri 49 Thiene Thiene 35 Lamezia Terme Lamezia Terme 71 Pontedera Pontedera 26 Alba Alba 30 Formia-Gaeta Formia-Gaeta 57 75
76 Avezzano Avezzano 37 Rosetto degli Abruzzi - Giulianova Rosetto degli Abruzzi Giulianova Andria 92 n.c. Andria 92 Rieti Rieti 41 Grosseto Grosseto 70 L Aquila L Aquila 63 Mirandola 90 n.c. Mirandola 21 Belluno Belluno 35 Gioia del Colle Gioia del Colle Santeramo in Colle Sessa Aurunca 88 n.c. Sessa Aurunca 23 Ragusa Ragusa 68 Civitanova March 86 n.c. Civitanova March 38 Vasto Vasto 35 Rovigo Rovigo 48 Imola Imola 64 Vittoria Vittoria Comiso Milazzo Milazzo 37 San Severo San Severo 56 Nuoro Nuoro 36 Vibo Valentia Vibo Valentia 35 Bagheria Bagheria 60 Faenza Faenza 53 Termoli Termoli 30 Casale Monferrato Casale Monferrato 35 Fossano Fossano 24 Fidenza Fidenza 23 Lentini Lentini 24 Foligno Foligno 49 Teramo Teramo 48 Voghera Voghera 38 Oristano Oristano 29 Schio Schio Valdagno Colleferro 73 n.c. Colleferro 20 76
77 Gorizia (e,g ) Gorizia 35 Novi Ligure Novi Ligure 27 Jesi Jesi 39 Matera Matera 57 Civitavecchia Civitavecchia 47 Vercelli Vercelli 45 Corato 70 n.c. Corato Ruvo di Puglia Fermo Fermo 35 Avola-Noto 70 n.c. Avola Noto Legnago 70 n.c. Legnago 24 Casarano Casarano 20 Macerata Macerata 41 Lumezzane Lumezzane 33 Aosta Aosta 34 Isernia 68 n.c. Isernia 21 Barcellona Pozzo di Gotto Barcellona Pozzo di Gotto 44 Merano Merano 33 Rovereto Rovereto 33 Cecina 66 n.c. Cecina 26 Alcamo Alcamo 42 Cento 65 n.c. Cento 29 Corigliano Calabrese 64 n.c. Corigliano Calabrese 37 Sora Sora 36 Cerignola Cerignola 57 Fasano 61 n.c. Fasano 38 Manduria 61 n.c. Manduria 31 Galatina 61 n.c. Galatina 28 Poggibonsi Poggibonsi 27 Iglesias Iglesias 59 Adrano Adrano 56 Monopoli 59 n.c. Monopoli 49 Senigallia Senigallia 41 Olbia Olbia 41 Caltagirone Caltagirone 37 Termini Imerese Termini Imerese 26 77
78 Ginosa Ginosa 22 Manfredonia Manfredonia 57 Tortona Tortona 25 Piombino Piombino 34 Sarno 53 n.c. Sarno 31 Imperia Imperia 47 Canicatti 52 n.c. Canicatti 32 Fabriano 52 n.c. Fabriano 30 Bra 52 n.c. Bra 28 Sulmona Sulmona 25 Verbania Verbania 32 Mondovi 50 n.c. Mondovi 22 (a) Italian side only. See transborder FUAs chapter for the incorporation of the Swiss side of the Como FUA. (b) Desio, considered as a separate FUA by ESPON 1.1.1, is included in Milano's MUA. In the present table, we have added date for the SLL of Milano, Viggevano, Busto Arsizio, Seste Calende and Como (In ESPON 1.1.1, Milano, Desio, Como, Busto Arsizio, Viggevano and Sesto Calende). The total data are slightly less than the corresponding MUA, due to the difficulty of delineation of the last one, extending in fact on other SLLs. In fact, a part of the population of the surrounding SLLs should be attributed to central Milano's FUA. (c) Too large proxy. (d) We have considered ESPON data and not the Italian SLL, which gives a disproportionate 307 thousand inhab. data, due to the merging of different big municipalities in one unit. (e) We have used ESPON data for Gorizia and Monfalcone, which seem to give a more correct view of the urban pattern than the SLL. (f) ESPON considers San Remo and Ventimiglia separately. Italian side of the Nice-Côte d'azur polycentric metropolis. See transborder FUAs chapter. (g) For Gorizia, Italian side only. See transborder FUAs chapter for adding the Slovenian side Conclusions Italy is characterised by a very dense and strongly polycentric urban pattern. Roma appears only at the third place of the metropolitan areas, after Milano and Napoli, even if the latter metropolitan region is much less important than Roma from a functional point of view. Outside the main cities, small and medium cities are very numerous, very close to each other and host many activities, in particular networks of SMEs in the Pô region, in Tuscany, along the Adriatic coast and even until Puglia. Urbanisation is mainly organised along some corridors: Torino Milano Venezia with a continuation towards the east; Milano Via Emilia range Adriatic coast range; the Milano Firenze Rome Napoli corridor. In the South, the population of many cities is high in comparison to the quality of their urban functions, as a heritage of past rural cities. Urbanisation is weaker in mountains (Alps and Apennine range) and in Sardinia, where Cagliari has an overwhelming weight. 78
79 3.15 Latvia Criticism of the ESPON FUAs The ESPON FUAs have been identified following rigorous criteria, taking into account labour pools and population thresholds, and give an accurate view of the national urban system. This explains why, while the structure of the urban systems of Latvia and Estonia are quite similar, ESPON proposed more FUAs in Estonia, in spite of the fact that its total population represents less than 60% of Latvia s population. However, compared to the ESPON list, we have excluded Valmiera and Jekabpils, which have morphological cores around 28 thousand inhabitants but FUAs under 40 thousand inhabitants. Inversely, we have kept Rezekne, which is just under the FUA limit (49,480 inhab.) and is considered a national city by Latvian geographers, as well as the other FUAs considered, with the exception of any other city. ESPON 1.1.1's list of FUAs quite rightly excludes the cities of Jurmala, a seaside residential city, Ogre and Salaspils, because of their inclusion in the Riga's labour pool; but with populations of respectively 56, 26 and 21 thousand inhabitants, they can be considered as secondary morphological cores inside Riga's FUA The Latvian urban pattern: population data FUAs and poly-fuas Population Espon Population MUAs MUA's population NUTS-3 proxys Population Metropolis Riga Riga Jurmala Ogre Salaspils Medium cities LV Daugavpils Daugavpils 115 Liepaja Liepaja 89 Small cities Jelgava Jelgava 64 Ventspils Ventspils 44 Rezekne Rezekne Conclusions The Latvian urban network is very strongly dominated by Riga, the largest city in the Baltic states and a metropolitan area with nearly half of the country's population living in its FUA. The recent evolution of most Latvian cities, including Riga in particular, was characterised during the nineties by a decline in population due to international migration, especially towards the rest of the former USSR. Nowadays Riga's morphological core loses population, migrating towards the suburban area, but also towards smaller cities of the Latvian urban network, linked to the conversion of the biggest concentrated industrial plants of the Soviet period. 79
80 3.16 Lithuania Criticism of the ESPON FUAs Lithuanian ESPON 1.1.1's FUAs have been rather correctly selected, though their delineation raises doubts. However, we have excluded Marijampole and Telsiai from the list, their FUAs counting less than 50 thousand inhabitants (respectively 49 and 33 thousand). The populations of the FUAs have clearly been defined by ESPON as the ones of the core cities in their administrative boundaries. This is most likely due to the lack of data on commuting to work. As the densities of population are generally quite low outside the cities, this restriction doesn't lead to too big underestimations for the smallest FUAs. Nevertheless, on the basis of an analysis of the Lithuanian settlement pattern, it is clear that the effective FUAs of the biggest three Lithuanian cities, Vilnius, Kaunas and Klaipeda, include surrounding municipalities. Therefore, considering the districts of Vilnius-city, Vilnius-rural and Trakai-urban seems to be a better proxy of Vilnius' FUA than only the population of the municipality; considering the districts of Kaunas-urban, Kaunas-rural and Jonava (with the latter as a secondary morphological core) seems to better adjust the Kaunas' FUA and the districts of Klaipeda-city, Klaipeda-rural and Kretinga better adjust Klaipeda's FUAs. This kind of correction is not so easy for smaller cities, but it is possible that Panevezys and Sialiai's FUAs are more populated than shown in the table. A more in-depth work remains to be done by national experts, on the basis of adequate statistics on commuting. Some clearly free-standing cities between 50 and 20 thousand inhabitants have not been considered as FUAs by ESPON 1.1.1, presumably due to a too narrow labour pool. It is the case of Mazeikiai, Utena, Kedainiai, Taurage, Visaginas, Ukmerge, Plunge and Radviliskis. As already said, Jonava and Kretinga are secondary cores inside larger FUAs The Lithuanian urban pattern: population data FUAs and poly-fuas Population Espon Population MUAs MUA's population NUTS-3 proxys Population Metropolises Vilnius Vilnius 554 LT00A 896 Kaunas Kaunas Jonava Large city Klaipeda Klaipeda Kretinga Medium cities LT Sialiai Sialiai 134 Panevezys Panevezys 120 Small city Alytus Alytus 71 80
81 Conclusions As the other two Baltic states, Lithuania is characterised by quite low population densities and most of the cities are small cities of local importance, more or less evenly distributed throughout the country. But about half the population lives in the six FUAs. Contrary to the other two Baltic countries, the head of the urban network is bicephal, since the capital city, Vilnius, is not much bigger than Kaunas and is located in a more peripheral location, only 35 km from the border. From the European perspective, the urban system is organised on two main axes, crossing in Kaunas: one from the port of Klaipeda towards Vilnius and Minsk, in Belarus, the second being the Via Baltica, the main North-South axis through the Baltic countries, from Warsaw to St. Petersburg, via Marijampole and Panevezys. 81
82 3.17 Luxemburg Criticism of the ESPON FUAs In this small country, ESPON identifies two FUAs, those of Luxembourg (city) and of Esch-sur-Alzette, with respectively and strangely 125 and 135 thousand inhabitants. It seems very questionable to define Esch's FUA as more important than Luxembourg's, insofar as the economy of the country has strongly changed from a former metallurgical economy (based around Esch) toward a financial and services economy largely based in Luxembourg (city). In fact, the works of the Grande Région and labour statistics show that Luxembourg (city) labour pool is now streching far across the borders, incorporating many Belgian, French and German municipalities. Inside this main labour pool, some smaller cities appear as secondary centres with their own labour pool and economic specificity. Some of those secondary centres are also transborder morphological areas The Luxemburg urban pattern: population data FUAs and poly-fuas Population Espon Population MUAs MUA's population NUTS-3 proxys Population Large city Luxembourg (a) 376 (b) 260 (c) Luxembourg Esch-sur- Alzette (a) Pétange (a) (a) Luxemburg's side only. See further transborder FUAs chapter. (b) We have used as a (quite restrictive) proxy for the population of Luxembourg-Esch's FUA the population of the two southern districts of Luxembourg and Grevenmacher. (c) ESPON considers the FUAs of Luxembourg (125 thousand inhab.) and Esch-sur-Alzette (135 thousand) separately Conclusions Also following statistical information provided by CEPS/INSTEAD, we have definitely opted for considering Luxembourg (city) as the core of a vast labour pool, extending on the territories of the three neighbour countries. The metallurgical district of Esch appears more and more as a secondary centre inside this vast manpower basin, with people commuting from far away to work in the finance and services sector in Luxembourg (city). Data provided here only relate to the Luxemburg's part of this transborder basin (see further chapter on transborder FUAs ). 82
83 3.18 Malta Criticism of the ESPON 1.1.1's FUAs ESPON proposes for the population of the FUA the whole population of the State. We have used the sole island of Malta (thus excluding Gozo) as a proxy for the FUA and we propose a delimitation of the MUA using our usual criteria and Google Earth views The Maltese pattern: population data FUAs and poly-fuas Population Espon Population MUAs MUA's population NUTS-3 proxys Population Large city Valletta Valletta Conclusions Valletta s agglomeration is the only MUA and is located on the north-eastern coast of the island of Malta. 83
84 3.19 The Netherlands Criticism of the ESPON FUAs If FUAs seem to have been quite correctly identified by Espon 1.1.1, population data for FUAs appear to be quite restrictive in general, by comparison with the labour pools definition supposed to be used. We have used data provided by the Atlas van Nederland, providing maps on the basis of 15% of the active population at the place of residence working in the core. For the smallest cores, not examined in the atlas, we have considered as pertaining to the FUA only the population of the municipality in which the core was identified on the basis of the Google Earth observation. This does not seem to lead to many errors, since Dutch municipalities are very big in size and these smallest cores have evidently also the smallest FUAs. We have been confronted with a quite difficult problem. ESPON has considered each important core in the Randstad and around Eindhoven, Arnhem and Nijmegen as the centre of a specific FUA. Inversely, they have considered Enschede, Hengelo and Almelo as a single FUA. In fact, the Dutch literature and the Atlas van Nederland consider properly that even if each main core has its own FUA, one should also consider polycentric cities, because commuting is very important between some FUAs. The Atlas van Nederland identifies eight polycentric cities (Amsterdam, with Haarlem, Velsen-Ijmuiden, Alkmaar, Hilversum and Almere; Den Haag, with Leiden and Delft; Rotterdam, with Dordrecht and Gouda; Utrecht, with Amersfoort; Eindhoven, with Helmond; Heerlen, with Geleen-Sittard and Maastricht; Arnhem and Nijmegen; Enschede, with Hengelo and Almelo). Besides, the first four ones are contiguous, forming the so-called Randstad Holland or Delta Metropolis. Delta Metropolis perfectly corresponds to our criteria to be recognized as a Polycentric metropolitan area. However, four polycentric sub-systems can be identified inside the Randstad. It also appears that Noord-Brabant s main FUAs fit our criteria to be considered as a polycentric metropolitan system (large cities distant from less than 30 km to each other) The Dutch urban pattern: population data The lines in yellow show the FUAs that are integrated in the poly-fua described in the preceding white line, so every white line preceding a yellow one describes a poly-fua. The lines in light blue are also poly-fuas but integrated themselves in a super-poly-fua described in the preceding white line. FUAs and poly-fuas Population Espon Population MUAs MUA's population NUTS-3 proxys Population Metropolitan and polynuclear metropolitan areas Randstad Holland (Delta metropolis) (a) see beneath (blue lines) NL310,NL322,NL3 23,NL324,NL325, NL326,NL327, NL331,NL332, NL333,NL334, NL335, NL
85 Randstad Holland Noord (a) Amsterdam Hilversum Haarlem Alkmaar Almere Velsen Purmerend Hoorn Edam- Volendam Castricum Hillegom NL322,NL323,NL3 24,NL325,NL326, NL Amsterdam (b) Amsterdam Purmerend Hoorn Edam- Volendam NL325,NL Alkmaar Alkmaar 161 NL Haarlem Haarlem Hillegom NL Hilversum Hilversum 202 NL Velsen- Ijmuiden Velsen Castricum NL Almere Almere 143 Randstad Holland Zuid (a) Rotterdam Dordrecht Gouda Hellevoetsluis Gorinchem Maasluis Oud-Beijerland NL334, NL335, NL336 (c) 2073 Rotterdam Rotterdam Hellevoetsluis Maasluis Oud-Beijerland Dordrecht Dordrecht Gorinchem NL NL Gouda Gouda 111 NL334 (c) 322 Randstad Holland West (a) Den Haag Leiden Zoetermeer Delft Alphen aan den Rijn Naaldwijk Noordwijk Lisse Pijnacker Monster NL331, NL332, NL333 (c) 1337 Den Haag (d) Den Haag 589 NL
86 Zoetermeer Naaldwijk Monster Leiden (e) Leiden Alphen aan den Rijn Noordwijk Lisse Delft 141 (d) Delft Pijnacker NL331 (c) 386 NL Randstad Holland Oost (a) Utrecht Amersfoort Zeist Soest Woerden Nijkerk Houten Culemborg Baarn NL Utrecht Utrecht Zeist Woerden Houten Culemborg Amersfoort Amersfoort Soest Nijkerk Baarn NL included in NL310 Noord-Brabant polycentric metropolitan area (f) (a) Eindhoven Tilburg Breda Den Bosch Roosendaal Osterhout Waalwijk Zevenbergen Valkenswaard Boxtel Sint- Michielsgestel Dongen Vucht NL411, NL412, NL413 NL Tilburg (f) Tilburg Waalwijk Boxtel Dongen Eindhoven (f) Eindhoven Valkenswaard Den Bosch Den Bosch Sint- Michielsgestel NL NL NL
87 Vught 25 Breda Breda Oosterhout Zevenbergen Helmond 211 n.c. Helmond Deurne Nuenen c.a NL included in NL414 Roosendaal Roosendaal 77 included in NL411 Oss 66 n.c. Oss 66 included in NL413 Bergen op Zoom Bergen op Zoom 65 included in NL411 Gelderland polycentric metropolitan area (f) (a) Nijmegen Arnhem Appeldoorn Ede Veenendaal Barneveld Rheden Wageningen Epe Renkum NL Arnhem (f) Arnhem Rheden Renkum NL Nijmegen Nijmegen 216 included in NL223 Ede (f, h) Ede Veenendaal Barneveld Wageningen Appeldoorn Appeldoorn Epe included in NL223 n.a. (g) South Limburg polycentric metropolitan area (Euroregio MAHL s dutch side) (f) (a) Heerlen Maastricht Geleen NL Heerlen Heerlen 217 included in NL423 Maastricht (f) Maastricht 142 included in NL423 Geleen-Sittard Geleen 89 included in NL423 Large cities Enschede- Almelo (f) Enschede- Hengelo Enschede Almelo Oldenzaal Borne (i) Enschede Oldenzaal Borne
88 Almelo 191 (i) Almelo 94 Groningen Groningen Sappemeer Medium cities Leeuwaarden Leeuwaarden 89 Emmen Emmen 107 Hoogezand- Middelburg- Vlissingen 176 n.c. Middelburg Vlissingen Goes Deventer Deventer Raalte Zwolle Zwolle 107 Venlo 131 n.c. Venlo 91 Small cities Lelystad Lelystad 65 Den Helder Den Helder 60 Assen Assen 59 Hoogeveen 53 n.c. Hoogeveen 53 Smallingerland 52 n.c. Smallingerland 52 (a) Computed by adding ESPON data for each constituent unit. ESPON does not propose data for the Randstad or parts of the Randstad as a whole. (b) ESPON considers separately the FUAs of Amsterdam (1379) and Hoorn (66). The latter is in fact included in Amsterdam's labour pool. (c) The NUTS-3 unit NL334 is in reality more or less divided into two equal parts between the Eastern and Southern sides of the Randstad. However, the main city in this area is located in the Southern part (Gouda). (d) Delft is supposed to have been included in Den Haag's FUA by ESPON (e) ESPON considers the FUAs of Leiden (328) and Alphen aan den Rhein (71) separately, the latter appearing rather as a secondary core inside a single labour pool. (f) Dutch side only. See transborder FUAs chapter. (g) NL221 unit is too large to be a good proxy. (h) ESPON considers separately the FUAs of Ede (104) and Veenendaal (61), which actually seem to be strongly interrelated. (i) ESPON considers Enschede, Hengelo and Almelo as a single pool Conclusions The Netherlands are a very densely populated and urbanised country. As land planning regulations are quite restrictive, urban sprawl is strongly contained: this is why individual cores are sharply delimited and in the different FUAs many secondary cores can be individualised (using satellite images), whereas in other countries only one core with a large suburban fringe should prevail. 44% of the country's population live in Randstad Holland, simultaneously a big European polycentric metropolitan area and a set of four polycentric metropolises, as each part of this whole is organized around Amsterdam, Den Haag, Rotterdam and Utrecht, each with quite clear specialisations. Even if traffic flows and inter-linkage are very strong in all directions inside this single metropolitan area, political bodies, regulations, planning and economic 88
89 competition between the main cores imply that it remains understandable to consider at least the four separate sub-systems, if not the different cities inside each of them. The South and the East of the country are also much urbanized, but on the basis of a set of large or medium cities organized in polycentric systems, with contiguous and inter-linked labour pools. So, the province Noord-Brabant appears as strongly polycentric, with four large cities organizing its territory. The Twente district, Arnhem-Nijmegen and the South of Limburg are also characterized by polycentric macro-fuas. Twente and mainly the South of Limburg also have cross-border contiguities. The North-East and Zeeland appear to be less urbanized and are also less densely populated. 89
90 3.20 Norway Criticism of the ESPON FUAs Using the European-wide criteria and also considering the very low densties of population of many Kommune where the smallest FUAs are located, we have excluded from the ESPON list of FUAs 17 small FUAs with less than 50 thousand inhabitants, as well as Kongsvinger, with a population of the FUA just at the level of 50 thousand, but a core with only 17 thousand inhabitants. The remaining 18 FUAs are a number very coherent with the population size of the country. For the rest, the populations proposed by ESPON for the FUAs seem to be likely The Norwegian urban pattern: population data FUAs and poly-fuas Population Espon Population MUAs MUA's population NUTS-3 proxys Population Metropolis Oslo Oslo 712 NO011, NO Large cities Bergen Bergen 231 Stavanger Stavanger 163 Medium cities Trondheim Trondheim 150 Drammen Drammen 55 Frederikstad Frederikstad 68 Skien Skien 83 Kristiansand Kristiansand 73 Tonsberg Tonsberg 35 Small cities Haugesund Haugesund 31 Hamar Hamar 27 Larvik Larvik 41 Alesund Alesund 39 Arendal Arendal 40 Gjovik Gjovik 27 Tromsö Tromsö 60 Molde Molde 24 Moss Moss 27 90
91 Conclusions The urban system of Norway is dominated by Oslo metropolitan area and the urban system of South-Eastern Norway. Outside this region, only three cities are important on the Western coast, Bergen, Stavanger and Trondheim. This does not mean that smaller municipalities, even with FUAs under 50 thousand inhabitants, do not play important roles in providing services to local populations in regions with very low densities. 91
92 3.21 Poland Criticism of the ESPON FUAs The precise identification and delineation of FUAs in Poland is hampered by the lack of current journey-to-work statistics (the last comprehensive survey was conducted in 1988 and those data are no longer relevant). Hence, any delineation of the FUAs has to be based on proxy variabilities, in addition to expert knowledge. The procedures adopted in the framework of the ESPON project were inadequate, to say the least. The main fault was oversimplification. FUAs identification and delineation were based on poviats administrative districts of subregional level. These spatial units are too large (and too few) to capture city- hinterland relations. Poviats are formally classified as NUTS-4 units, while their statistical aggregates the 45 subregions, are NUTs-3 units. The cities that for the purpose of ESPON were selected as FUA cores were the citypoviats. There are 66 such cities in Poland (out of a total of 373 poviats), but some of them are territorially contiguous with (bordering on) other cities (this concerns in particular the Upper Silesian conurbation). As a result, only 48 FUA cores were identified. To each of the cores the neighbouring, or surrounding poviats were subordinated automatically as functionally linked zones. Such an assumption might have been defendable (though still representing an oversimplification) in the case of the large cities only. For the middle-sized towns the FUA areas are generally much overbounded. These rules applied, the resulting FUA population statistics still contain some errors. Thus, the city (city-poviat) of Tarnobrzeg (51 thousand inhabitants), together with the surrounding landed Tarnobrzeski poviat (56 thousand), 107 thousand altogether, is omitted from the list. The Cz"stochowa FUA gives population figures for the city (city-poviat) only: 256 thousand. Together with the Cz!stochowski poviat (135 thousand inhabitants), its population figures amount to 390 thousand inhabitants. Similarly, the Wa#brzych FUA is represented by the city (city-poviat) population only. When adding the landed Wa"brzyski poviat, the FUA population figures amount to 197 thousand inhabitants. A completely new identification and delineation of FUAs has been conducted here. Most importantly, gmina were adopted as the basic spatial units. Gmina (townships, municipalities) are the local administrative units, classified as NUTS-5 units. There are 2486 gmina in Poland, among which 306 are city-gmina (or urban gmina). All the large cities and middle-sized towns (306 out of the total number of 880) have in fact the administrative status of gmina. In the case of the 66 major cities, this status is combined with the status of poviat. Among the remaining gmina, 564 are urban-rural, i.e. there are incorporated (small) towns situated within their territory, while 1606 are rural gmina. To bring the set of FUAs for Poland in line with those identified for most of the other countries in the ESPON project, all towns above 20,000 inhabitants were considered as potential FUA cores. Spatially contiguous territory composed of two or more towns (cities), i.e. urban gmina, was considered a single FUA core. Such a core area included also other neighbouring gmina which met the population density criterion of at least 650 inhabitants per km!, possibly adapted using Google Earth images. These were typically suburban gmina, formally of rural, or urban-rural status. In the absence of recent, comprehensive data on journey-to-work, proxy variables were used in the delineation of the commuting areas related to individual FUA cores. These variables included in particular: the share of non-agricultural employment and an index of local business activity (number of firms per 1000 inhabitants). The data were dawn from the Population and Housing Census of In addition, expert knowledge of the team members concerning functional linkages, travel-to-work patterns and local transportation networks, was extensively used. The lack of journey-to-work data inside the Katowice area did not allow isolating possible different employment cores inside this morphological area. Therefore, Katowice's data are 92
93 quite comparable to those for a region like the German Ruhr area as a whole. The only secondary cores identified in the Katowice FUA are isolated in the external part of the FUA. As a result 88 FUAs with more than 50 thousand inhabitants were identified, all of them having cores with more than 20,000 inhabitants. Two more cities, Zgorzelec and Slubice, have been taken into consideration, as parts of transborder FUAs. N.B.: 1) MUAs population data are computed on the ESPON NUTS-5 database (2001). Conversely, our FUAs population data are based on 2002 data. 2) NUTS-3 units are not very good proxys for the metropolises of Lodz, Krakow, Gdansk and Poznan where they are too small (adding the surrounding NUTS-3 units should inversely lead to much too large areas). On the contrary, the NUTS-3 proxy is much too large in the case of Szczecin (and to a lesser extent for Wroclaw). A more in-depth analysis should be achieved in the future using NUTS 4 data The Polish urban pattern: population data The lines in yellow show the FUAs that are integrated in the poly-fua described in the preceding white line, so every white line preceding a yellow one describes a poly-fua. FUAs and poly-fuas Population Espon Population MUAs MUA's population NUTS-3 proxys Population Metropolitan and polynuclear metropolitan areas Upper Silesian polycentric metropolitan area (a) 4311 n.c. Katowice (b) Bielsko-Biala Rybnik Jastrebie-Zdroj Zory Raciborz Zawiercie Olkusz Chrzanow Wodzislaw Sl. Oswiecim Knurow Cieszyn Laziska Gorne Pyskowice PL225, PL227 PL226, 4230 Katowice Katowice (b) Zawiercie Olkusz Chrzanow Oswiecim Knurow Laziska Gorne Pyskowice 2279 (a) PL Bielsko-Biala Bielsko-Biala 223 PL Rybnik Rybnik Jastrebie-Zdroj Zory Wodzislaw Sl PL
94 Raciborz 109 n.c. Raciborz 63 included in PL227 Cieszyn (a) 63 n.c. Cieszyn 38 included in PL225 Warszawa Warszawa Zyrardow Minsk Mazow. Nowy Dwor PL073,PL Lodz Lodz 919 PL Krakow Krakow Bochnia Gdansk Gdansk Gdynia PL PL0B3 755 Poznan Poznan 679 PL0F5 576 Wroclaw Wroclaw Olawa Szczecin Szczecin Swinoujscie Large cities PL013,PL PLOG Bydgoszcz Bydgoszcz 383 Lublin Lublin 354 Bialystok Bialystok 286 Czestochowa Czestochowa 254 Kielce Kielce 210 Rzeszow Rzeszow 162 Radom Radom 231 Opole Opole 129 Tarnow Tarnow 121 Medium cities Walbrzych Walbrzych 176 Torun Torun 205 Olsztyn Olsztyn 174 Plock Plock 131 Gorzow Wielkopolski Gorzow Wielkopolski 126 Zielona Gora Zielona Gora 119 Koszalin Koszalin 111 Konin Konin 83 Pila 147 n.c. Pila 77 Slupsk Slupsk 102 Elblag Elblag
95 Wloclawek Wloclawek 123 Kalisz Kalisz 108 Jelenia Gora Jelenia Gora 92 Nowy Sacz Nowy Sacz 84 Stalowa Wola 128 n.c. Stalowa Wola 71 Ostrow Wielkopolski 127 n.c. Ostrow Wielkopolski 75 Legnica Legnica 109 Sandomierz 120 n.c. Tarnobrzeg Sandomierz Grudziadz Grudziadz 102 Tarnobrzeg- Kiedzierzyn- Kozle Kozle 69 Lubin 114 n.c. Lubin 82 Inowroclaw 112 n.c. Inowroclaw 79 Piotrkow Trybunalski Piotrkow Trybunalski 81 Krosno Krosno 49 Leszno Leszno 63 Pulawy 100 n.c. Pulawy 54 Przemysl Przemysl 68 Small cities 98 n.c. Dzierzoniow Bielawa 98 n.c. Ostrowiec Swietokrzyski 96 n.c. Tomaszow Mazowiecki Siedlce Siedlce 77 Chelm Chelm 71 Zamosc Zamosc 69 Lomza Lomza 65 Stargard Szczecinski 82 n.c. Stargard Szczecinski 74 Gniezno 78 n.c. Gniezno 72 Glogow 78 n.c. Glogow 74 Swidnica 76 n.c. Swidnica n.c. Kiedzierzyn- Bielawa- Dzierzoniow Ostrowiec Swietokrzyski Tomaszow Mazowiecki Skarzysko- Kamienna 76 n.c. Skarzysko- Kamienna 53 Suwalki Suwalki 69 Mielec 73 n.c. Mielec 64 95
96 Ostroleka Ostroleka 56 Starachowice 72 n.c. Starachowice 56 Belchatow 71 n.c. Belchatow 61 Tczew 71 n.c. Tczew 61 Debica 71 n.c. Debica 49 Biala Podlaska Biala Podlaska 59 Elk 66 n.c. Elk 57 Nowy Targ 65 n.c. Nowy Targ 35 Nysa 64 n.c. Nysa 61 Skierniewice Skierniewice 49 Starogard Gdanski 62 n.c. Starogard Gdanski 51 Jaroslaw 61 n.c. Jaroslaw 42 Sanok 61 n.c. Sanok 41 Zdunska Wola 61 n.c. Zdunska Wola 46 Radomsko 59 n.c. Radomsko 51 Kolobrzeg 57 n.c. Kolobrzeg 48 Kutno 57 n.c. Kutno 50 Chojnice 55 n.c. Chojnice 41 Brzeg 54 n.c. Brzeg 40 Sieradz 54 n.c. Sieradz 46 Jaslo 54 n.c. Jaslo 39 Boleslawiec 53 n.c. Boleslawiec 44 Nowa Sol 53 n.c. Nowa Sol 42 Ciechanow 52 n.c. Ciechanow 47 Zary 51 n.c. Zary 40 Görlitz 41 n.c. Zgorzelec (c) 35 Frankfurt an der Oder 20 n.c. Slubice (c) 20 (a) Polish side only. See further transborder FUAs chapter for the links with the Ostrava's basin. (b) If one considers individual places inside the Katowice morphological area, the main municipalities are Katowice (338), Sosnowiec (240), Gliwice (208), Bytom (200), Zabrze (196), Ruda Slaska (153), Tychy (130), Dabrowa Gornicza (130), Chorzow (120). Nine other municipalities have less than 100 thousand inhabitants. (c) Data for the Polish side. See further transborder FUAs chapter Conclusions Owing to history and despite a rapid process of urbanization during the 50s and the 70s, the urban system of Poland is characterized by a regular spacing of towns, as well at the upper as at the lower levels of the urban hierarchy. The main cities are however smaller in the Eastern part of the country. The partition of Poland by the three neighbouring Empires 96
97 (Russia, Austria and Germany) at the end of the 18 th Century and the development of the Upper Silesian coal basin during the 19 th Century explain why Warszawa's FUA contains only 7% of the Polish population and is exceeded by the Upper Silesian metropolis, at least from a demographic point of view, but not from a functional point of view. In the same way, the main links between the nodes of the Polish urban system do not describe radiuses around the capital. If the main West-East axis goes through Warsaw, it crosses the main North- South axis, from Gdansk to Katowice, in Lodz. Outside the Upper Silesian basin, the other metropolises, or even a bit smaller cities like Bydgoszcz, Lublin or Byalistok, form a balanced network of high-level administrative and economic centres. During the last decade, Warszawa strongly reinforced its economic hierarchical position, as well as at a lower level, Poznan, Krakow, Wroclaw, Gdansk, Sczeecin and Bydgoszcz. The situation was worse for the Katowice area, where heavyy industry reconversion is difficult and the upper-level tertiary sector weaker. The old industrial textile city of Lodz is undergoing a strong process of industrial reconversion: it has recently become a major centre for export-oriented household equipment industries. 97
98 3.22 Portugal Criticism of the ESPON FUAs For the two metropolises, ESPON used as a proxy for their FUAs the limits of the metropolitan regions of Lisbon and Porto, association of municipalities created in the late 80s and mainly inspired by daily commuting flows. For the other FUAs, ESPON used a study published in 1991 by Quaternaire Portugal. All these estimations appear in general to be quite good proxys of the reality, at least for isolated cities. However, difficulties arise in the northern regions around Porto and Braga. The surroundings of these two cities present a very exceptional structure: a mix of agricultural and industrial activities, very high population densities (often more than 650 inhab./ km!), scattered residential and industrial settlements, dominance of small and medium enterprises mainly employing local manpower. Such a situation is very difficult to describe using our criteria and is also badly described by ESPON Using our criteria, a morphological agglomeration is developed around Guimaraes, not very far from Braga, reaching as much as 203 thousand inhab., which is nearly twice the population attributed to this FUA by ESPON 1.1.1, but without any true urban centrality like that of the historical city of Braga. Another morphological agglomeration of 131 thousand inhab. appears, following our criteria in the Rebardosa- Freamunde region, east of Porto, but these two places are not even mentioned as forming a FUA by ESPON 1.1.1, which only mentions a small FUA of 41 thousand inhab. (Pacos de Ferreira) inside this big loose agglomeration. We have chosen the debatable solution to identify as secondary cores the contiguous sets of NUTS5 units with more than 650 inhab./km!, even if they do not constitute true cities, and to consider as population for their FUAs the population of the corresponding concelhos, taking into account the local character of the manpower used and lacking any other information. We have thus also maintained the two neighbour FUAs of Paredes and Penafiel proposed by ESPON 1.1.1, with their spatial structure not very different from that of the Rebordosa-Freamunde area, but here without any morphological core reaching our criteria, as well as, in the same conditions, the FUAs of Ovar and Santa Maria de Feira. All those concelhos are in a radius of less than 30 km from Porto. As for the rest, we have suppressed many small FUAs proposed by ESPON but with less than 50 thousand inhab. (Agueda, Torres Vedras, Evora, Portimao, Viana do Castelo, Figueira da Foz, Felgueiras, Oliveira de Azemeis, Vila Real, Fafe, Santarem, Covilha, Castelo Branco, Caldas da Rainha, Guarda, Albufeira, Peniche, Beja, Silves, Torres Novas, Chaves, Sao Joao da Madeira, Braganca). 98
99 The Portuguese urban pattern: population data The lines in yellow show the FUAs that are integrated in the poly-fua described in the preceding white line, so every white line preceding a yellow one describes a poly-fua. FUAs and poly-fuas Population Espon Population MUAs MUA's population NUTS-3 proxys Population Metropolitan and polynuclear metropolitan areas PT171, PT PT114 (a) 1235 PT Lisboa Lisboa Setubal Porto's region 1778 n.c. Porto Rebordosa- Pacos de Ferreira- Freamunde Povoa de Varzim Feira Santo Tirso Famalicao Porto 1245 (b) 1231 (b) Porto Povoa de Varzim Rebordosa- Pacos de Ferreira- Freamunde Santa Maria de Feira (c) Rebordosa- Pacos de Ferreira- Freamunde Santa Maria de Feira Paredes- Penafiel (d) - - Santo Tirso Santo Tirso 40 Ovar Medium cities Guimaraes 235 (e) 127 Guimaraes 203 Funchal 168 (f) 103 Funchal 139 Braga Braga 122 Coimbra Coimbra 93 Faro (g) Faro Loulé Barcelos Barcelos 28 Leiria-Marinha Grande Leiria Marinha
100 Grande Aveiro-Ilhavo (h) Aveiro 43 Vila Nova de Famalicao Small cities Vila Nova de Famalicao 30 Ponta Delgada Ponta Delgada 25 Viseu Viseu 34 (a) At the level of the concelhos, a better proxy of the Porto's metropolitan region should be to add to the Porto's NUTS-3 unit the concelhos of Santo Tirso (72 thousand inhab.), Pacos de Ferreira and Lousada (53 and 45 thousand), Paredes and Penafiel (83 and 72 thousand), Santa Maria de Feira (136 thousand) and Ovar (55 thousand). The total proxy population of Porto's metropolitan region should then be 1761 thousand inhab. (b) Povoa de Varzim is included in Porto's FUA. (c) ESPON considers Pacos de Ferreira only. (d) ESPON considers Paredes and Penafiel as two separate FUAs, with respectively 63 and 24 thousand inhab. (e) Total of the three concelhos of Guimaraes, Fafe and Vizela. (f) ESPON considers only the concelho of Funchal as the FUA. The morphological agglomeration is in fact bigger. Therefore, we have considered as a proxy of the FUA the three concelhos of Funchal, Camara de Lobos and Santa Cruz. (g) ESPON considers Faro, Loulé and Olhao as three separate FUAs, with respectively 47, 46 and 33 thousand inhab. (h) ESPON considers Aveiro and Ilhavo as two separate FUAs, with respectively 67 and 36 thousand inhab. Ilhavo is very close to Aveiro but doesn't reach the threshold of 20 thousand inhab. to be considered as a MUA in itself Conclusions It is clear that the Portuguese urban network is strongly dominated by two metropolitan areas, Lisbon and Porto. For the rest, any precise description is quite difficult. Around Porto and Braga, and to a lesser extent along the central coastal region, densities of population are very high, semi-rural landscapes associate agriculture and a dense network of scattered settlements and industries, without strong historical urban cores (except for Leiria, Coimbra, Aveiro). A linear process of loose urbanisation is developed along the coastal region, from Braga to Lisbon, along the main highway and railway corridor. Inversely, some small historical cities in the empty interior and the south of the country have a well defined morphological and historical core with more than 20 thousand inhab., but are excluded from our list, due to the absence of FUA important enough to reach the threshold of 50 thousand inhab. It is for instance the case of Braganca, Viseu, Castelo Branco, Evora, Beja. 100
101 3.23 Romania Criticism of the ESPON FUAs It appears clearly that Espon data are only the data for the MUAs, and even only for the core municipality of the MUA in the case of the (rare, only four, Bucuresti, Constanta, and two industrial agglomerations, Petrosani and Vulcan) MUAs gathering more than one municipality. We have slightly rectified the population of the MUAs (for example including Voluntari in the Bucuresti s MUA, and not considering it as ESPON as a separate FUA). Fortunately, data for the MUAs possibly do not underestimate too much the data for the FUAs, since suburbanisation was nearly unknown in Romania until the last decade. However, it is possible that some MUAs just under the 50 thousand inhab. threshold, and thus not taken into account, are in fact the core of FUAs just above this threshold and that, globally, data are a bit underestimated. On the contrary, due to the lack of consolidation of municipal data, ESPON has not considered Vulcan, an industrial agglomeration, as a FUA The Romanian urban pattern: population data FUAs and poly-fuas Population Espon Population MUAs MUA's population NUTS-3 proxys Population Metropolis Bucuresti Bucuresti 2064 RO Large cities Constanta Constanta 364 Iasi Iasi 349 Cluj-Napoca Cluj-Napoca 332 Timisoara Timisoara 328 Galati Galati 325 Craiova Craiova 311 Brasov Brasov 307 Medium cities Ploiesti Ploiesti 248 Braila Braila 231 Oradea Oradea 221 Bacau Bacau 207 Pitesti Pitesti 186 Arad Arad 183 Sibiu Sibiu 167 Tirgu Mures Tirgu Mures 163 Baia Mare Baia Mare
102 Buzau Buzau 145 Satu Mare Satu Mare 130 Botosani Botosani 127 Piatra Neamt Piatra Neamt 124 Rimnicu Vilcea Rimnicu Vilcea 120 Suceava Suceava 117 Drobeta-Turnu Severin Small cities Drobeta-Turnu Severin 116 Tirgu Jiu Tirgu Jiu 98 Tirgoviste Tirgoviste 98 Focsani Focsani 97 Tulcea Tulcea 95 Resita Resita 93 Bistrita Bistrita 86 Slatina Slatina 86 Roman Roman 81 Hunedoara Hunedoara 78 Vaslui Vaslui 78 Birlad Birlad 78 Petroseni Petroseni 78 Calarasi (b) Calarasi 77 Deva Deva 75 Giurgiu (c) Giurgiu 72 Alba Iulia Alba Iulia 72 Zalau Zalau 70 Sfintu Gheorghe Sfintu Gheorghe 66 Vulcan 63 n.c. Vulcan 63 Medias Medias 62 Turda Turda 60 Onesti Onesti 60 Alexandria Alexandria 57 Slobozia Slobozia 55 (a) Data based on MUAs populations. (b) Due to the lack of a bridge, we have not considered Calarasi-Silistra as a transborder FUA. (c) Romanian side only. See transborder FUAs chapter for the transborder FUA with Rousse. 102
103 Conclusions Except the strong primacy of Bucuresti, the other main Romanian cities design a quite equilibrated urban pattern, inherited from the communist period, when the planned economy wanted to disperse industry onto the country, following the hierarchy of the administrative pattern. At the third and the lower levels of the hierarchy, the urban pattern remains weak. 103
104 3.24 Slovak Republic Criticism of the ESPON FUAs The identification of FUAs in Slovakia by ESPON seems to be haphazard and lacking rationality. The population size of administrative districts was sometimes taken as the basis, but not systematically. As a result, ESPON 1.1.1's list of FUAs includes some units focused on small urban places, lacking major functions. At the same time, several relatively important centres, even if only small cities, attracting commuting flows, have been omitted. Due to the lack of good commuting data and considering the importance of the administrative structures for the management of the economy in the former socialist period, we have taken the same rule as for the Czech Republic, also following a paper by P. Hurbanek, using the administrative districts as proxys for the FUAs, with the exception of small MUAs surrounded by too large districts, and thus limiting the population s proxy of the FUA to twice the population of the morphological core. We have excluded the small cities of Topolcany, Ziar nad Hronom, Bardejov, Trebisov, Tvrdosin, Skalica, Svidnik, to which ESPON attributes a FUA with less than 50 thousand inhabitants. Neither have we taken into consideration the small city of Partizanske (less than 50 thousand inhab. for its district). Conversely, we have added six small cities, not considered by ESPON 1.1.1, for which the FUA could be more than 50 thousand inhab. using the rule of twice the population of the MUA (Spisska Nova Ves, Zvolen, Humenne, Komarno, Ruzomberok, Piestany). Our corrections provide a rough view of the Slovakian urban pattern, but this image should be further refined if good commuting data were available The Slovak urban pattern: population data FUAs and poly-fuas Population Espon Population MUAs MUA's population NUTS-3 proxys Population Metropolises Bratislava (a,f) Bratislava 444 SK Large cities Kosice (b) Kosice 239 Medium cities Nitra (c) Nitra 88 Presov (c) Presov 91 Zilina (c) Zilina 90 Trencin (d) Trencin Banovce Bebravo nad Trnava (c) Trnava 69 Banska Bystrica (c) Banska Bystrica 84 Poprad (c) Poprad 60 Prievidza (e) Prievidza
105 Small cities Martin (c) Martin 67 Nove Zamky (e) Nove Zamky 42 Michalovce (e) Michalovce 40 Spisska Nova Ves (e) 76 n.c. Spisska Nova Ves 38 Levice (e) Levice 36 Zvolen (c) 68 n.c. Zvolen 36 Povazska Bystrica (c) Povazska Bystrica 43 Humenne (c) 65 n.c. Humenne 35 Liptovsky Mikulas (e) Liptovsky Mikulas 32 Komarno (e,f) 58 n.c. Komarno 29 Lucenec (e) Lucenec 28 Ruzomberok (e) 56 n.c. Ruzomberok 28 Piestany (e) 54 n.c. Piestany 27 Esztergom Sturovo (e,f) 11 (a) Proxy for the FUA: Region of Bratislava and district of Dunajska Streda (b) Proxy for the FUA: Districts of Kosice-city and Kosice-land. (c) Proxy for the FUA: the corresponding district. (d) Proxy for the FUA, according to Slovak expert Dr. Vladimir Szekely, the two districts of Trencin and Banovce nad Bebravo, the latter small city being considered as a separate FUA by ESPON (e) Proxy for the FUA: limited to twice the population of the MUA. (f) Slovakian side only. See also chapter on transborder FUAs Conclusions Slovakia remains a country of medium and small cities. The only two important cities, even if not very big at the European scale, are Bratislava and Kosice. However, being located about 60 km from Vienna, and partly using the same airport, Bratislava could be considered as forming an (at least potential) transborder polynuclear metropolis with the Austrian capital. 105
106 3.25 Slovenia Criticism of the ESPON FUAs The main cities, Ljubljana, Maribor and Celje, seem to have been overestimated by ESPON report, by comparison to data provided by Slovenian experts on the basis of our criteria (cf. D. Bole, D. Josipovic, GIAM, GURS, 2005). This is due to the fact that ESPON report linked the FUA of Kranj with Ljubljana, Ptuj with Maribor and Velenje with Celje. Novo Mesto, with a FUA of 50 thousand inhab., reaches the threshold with our data (47 thousand, according to ESPON 1.1.1). Domzale can be identified as a secondary centre in the FUAs of Ljubljana. Even if Ljubljana is just under the threshold to be considered as a metropolis, we have given its proxy, due to its particular status of capital city The Slovenian urban pattern: population data FUAs and poly-fuas Population Espon Population MUAs MUA's population NUTS-3 proxys Population Large city Ljubljana (a) Ljubljana Medium cities Domzale SI00E 490 Maribor Maribor 115 Celje Celje 49 Small cities Kranj 80 (a) Kranj 52 Koper Koper 48 Nova Gorica (b) Nova Gorica 36 Novo Mesto Novo Mesto 41 (a) Kranj seems to have been included in Ljubljana's FUA by ESPON (b) Slovenian side only. See transborder FUAs chapter for Gorizia-Nova Gorica Conclusions Slovenia is characterized by a balanced network of cities, even if these are small by comparison to European standards, including the capital city, just under the threshold to be considered fully as a metropolis. Ljubljana, Maribor, but also Koper, due to its importance as a maritime gateway for Central Europe, are the three cities identified at the upper level of the urban network by the Slovenian literature and in the planning documents. Celje is also an important central place on one of the two main corridors crossing at Ljubljana, the Koper-Maribor corridor to Austria and Hungary. The other corridor is the Villach/Klagenfurt- Ljubljana-Zagreb corridor. Nova Gorica is a part of a transborder core, with more or less the same importance on both sides of the border, which was quite closed until some years ago but with now a more and more integrated labour pool, the Slovenian workers commuting to 106
107 the Italian side. The other cities identified as central places in the Slovenian planning documents, like Velenje, Ptuj and Murska Sobota, are surely polarizing cities at the Slovenian level, but too small to be included in a European-wide list. 107
108 3.26 Spain Criticism of the ESPON FUAs ESPON defined the Spanish FUAs using some case studies based on commuting flows and even sometimes provinces (or mancomunidades in Catalonia) or municipalities as proxys. Globally, FUAs proposed by ESPON seems to fit quite well the data given by the literature and are coherent with our cores populations, even if the definition used for the FUAs seems to be a bit too restrictive when only municipal territories are considered (but it must be taken into account that some Spanish municipalities have a big size so that their FUAs are more or less limited to the territory of the municipality itself - and that they are sometimes surrounded by quite empty areas). Corrections consist mainly in merging some so-called FUAs which are in fact suburbs of Madrid or Barcelona with the main FUA, taking into account the polycentric pattern of the Asturian FUA around Oviedo The Spanish urban pattern: population data The lines in yellow show the FUAs that are integrated in the poly-fua described in the preceding white line, so every white line preceding a yellow one describes a poly-fua. FUAs and poly-fuas Population Espon Population MUAs MUA's population NUTS-3 proxys Population Metropolitan and polynuclear metropolitan areas Madrid (a) Madrid 4955 ES Barcelona metropolitan region 4251 n.c. Barcelona Mataro ES Barcelona (b) Barcelona 3659 Mataro Mataro 107 Valencia- Sagunto 1499 n.c. Valencia Sagunto ES Valencia Valencia 1318 Sagunto Sagunto 60 Sevilla 1262 n.c. Sevilla Utrera ES Sevilla Sevilla 1082 Utrera Utrera 46 Bilbao Bilbao 822 ES Malaga 844 n.c. Malaga 753 ES
109 Velez Malaga 56 Malaga Malaga 534 Velez Malaga Velez Malaga 56 Oviedo-Gijon- Aviles (c) 844 n.c. Gijon Oviedo Aviles Langreo Mieres ES Oviedo Oviedo Langreo Mieres Gijon Gijon 269 Aviles Aviles 106 Alicanta-Elche (d) 793 n.c. Alicanta Elche Elda ES521 (e) 1417 Alicanta Alicanta 339 Elche Elche 198 Elda Elda 81 Las Palmas de Gran Canarias 640 (f) 588 Las Palmas de Gran Canarias 365 ES Zaragoza Zaragoza 611 ES Murcia- Orihuela 623 n.c. Murcia Orihuela ES620 (g) 1125 Murcia Murcia 476 Orihuela Orihuela 56 Large cities Granada Granada 330 Palma de Mallorca 433 (f) 432 Palma de Mallorca 433 Vigo Vigo 287 Cadiz Cadiz 288 Santa Cruz de Tenerife Donostia-San Sebastian (h) Santa Cruz de Tenerife Donostia-San Sebastian Irun (h) Zarautz La Coruna La Coruna 311 Valladolid Valladolid 318 Tarragona Tarragona 205 Cordoba Cordoba
110 Pamplona Pamplona 263 Castellon de la Plana Medium cities Castellon de la Plana 147 Santander Santander 222 Alzira Alzira 87 Cartagena Cartagena 199 Vitoria-Gasteiz Vitoria-Gasteiz 219 Algeciras Algeciras Linea de la Concepcion Huelva Huelva 141 Salamanca Salamanca 170 Almeria Almeria 171 Jerez de la Frontera Jerez de la Frontera 196 Leon Leon 162 Jaen Jaen 111 Burgos Burgos 166 Logrono Logrono 132 Albacete Albacete 150 Ferrol Ferrol 80 Lerida Lerida 113 Girona Girona 101 Pontevedra Pontevedra 101 Badajoz Badajoz 136 La Orotava- Puerto de la Cruz Santiago de Compostella La Orotava- Puerto de la Cruz Santiago de Compostella Orense Orense 109 Benidorm Benidorm 72 Gandia Gandia 68 Blanes Blanes 67 Manresa Manresa 64 Marbella Marbella 111 Torrelavega Torrelavega 56 Vic Vic 33 Guadalajara Guadalajara
111 Small cities Lugo Lugo 32 Palencia Palencia 81 Toledo Toledo 69 Denia Denia 32 Caceres Caceres 82 Motril Motril 51 Lorca Lorca 77 Arrecife Arrecife 46 Torrevieja Torrevieja 59 Talavera de la Reina Talavera de la Reina 76 Linares Linares 58 Ponferrada Ponferrada 63 Vilagarcia de Arousa Vilagarcia de Arousa 34 Alcoy Alcoy 60 Igualada Igualada 43 Sanlucar de Barramed Santa Lucia de Tirajana Sanlucar de Barramed Santa Lucia de Tirajana Ciudad Real Ciudad Real 61 Xativa Xativa 26 Zamora Zamora 66 Ibiza Ibiza 35 Ceuta Ceuta 74 Roquetas de Mar Roquetas de Mar 48 Eibar Eibar 46 Segovia Segovia 54 Melilla Melilla 69 Vilafranca del Penedès Vilafranca del Penedès 31 Ubeda Ubeda 33 Puertollano Puertollano 50 Merida Merida 57 Mondragon o Arrasate Mondragon o Arrasate 23 Don Benito Don Benito
112 Lucena Lucena 37 El Ejido El Ejido 56 La Vall d'uixo La Vall d'uixo 29 Ontinyent Ontinyent 33 Vinaros Vinaros 23 Andujar Andujar 38 Figueres Figueres 34 Durango Durango 25 Cieza Cieza 33 Alcazar de San Juan Alcazar de San Juan 26 Aranjuez Aranjuez 40 Montilla Montilla 23 Avila Avila 48 (a) Incl. the FUA of Collado Villado (176 thousand inhab.), considered as a separate FUA by ESPON 1.1.1, but included in the morphological area of Madrid. (b) Incl. the FUAs of Granollers (160 thousand inhab.) and Vilanova i La Geltru (156 thousand), considered as separate FUAs by ESPON 1.1.1, but included in the morphological area of Barcelona. (c) ESPON considers as separate FUAs Oviedo (426 thousand inhab.), Gijon (279 thousand) and Aviles (139 thousand), but, using our criteria, these cities form a common polycentric FUA and strongly cooperate. (d) ESPON considers Alicanta and Elche as two separate FUAs, with respectively 380 and 265 thousand inhab. Elda is another FUA, but less than 30 km from Elche, with a contiguous labour pool. (e) For Alicanta, the population of the FUA is less than 60% of the population of the proxy. (f) At least the population of the MUA. (g) For Murcia, the population of the FUA is less than 60% of the population of the proxy. Moreover, Orihuela is not located in the province of Murcia. (h) Spanish side only. See transborder FUAs chapter for adding Hendaye on the French side Conclusions Spain has two very large metropolises, each with a strong functional weight, Madrid and Barcelona, and a set of nine regional metropolises. For the rest, the urban network is well developed on the whole country, with a strong concentration along the coasts, reflecting the population concentration pattern. More or less three quarters of the country's population live in FUAs. 112
113 3.27 Sweden Criticism of the ESPON FUAs When examining the accuracy of FUAs in Sweden, it is always necessary to take into account the very big size of the Swedish municipalities, often much larger than the area occupied by the morphological core. But at the same time, the municiplaity reform of 1974 has formed the new municipalities on the basis of each local labour market, so that they fit very well with most of the FUAs. Therefore, peripheral municipalities with more than 20,000 inhabitants but less than 50,000 should not be examined as possible centres of FUAs. But surely in many other cases, the agglomerated population should be quite less than the so-called core population given below. We have thus excluded from our list 14 FUAs proposed by ESPON but with FUA's populations between 48 and 23 thousand inhabitants only. We have also excluded as FUA the island of Visby, with more than 50 thousand inhabitants, but a density of population of only 18 inhab./ km!, because the whole area of the island is only one municipality of 3145 km!, the very city of Visby counting only 24 thousand inhabitants. Södertälje and Norrtälje can be considered as secondary cores inside Stockholm's FUA, and this is also true of Lund, inside Malmö's FUA. Varberg, which is considered as an independent FUA by ESPON 1.1.1, looks more like a secondary centre inside a bigger Göteborg (-Varberg) FUA. The situation is a bit more difficult for Helsingborg, which seems to be a FUA independent from Malmö, but at a transborder scale; Helsingborg and Malmö can be considered as two parts of the Swedish side of a transborder metropolitan area Copenhague-Malmö, even if Helsingborg is only directly linked by ferry to the Danish bank. The small municipality of Haparanda can be considered as the Swedish bridge-head of the Finnish FUA of Kemi-Tornio The Swedish urban pattern: population data FUAs and poly-fuas Population Espon Population MUAs MUA's population NUTS-3 proxys Population Metropolises Stockholm Stockholm Uppsala Södertälje Norrtälje Göteborg Göteborg Varberg Malmö (b) Malmö Helsingborg Lund Large cities Medium cities SE SE0A2a (a) 759 SE044a (c) 824 Linköping Linköping 134 Örebrö Örebrö 125 Vaesteraas Vaesteraas 128 Kristianstad Kristianstad
114 Nörrköping Nörrköping 123 Boraas Boraas 97 Luleaa Luleaa 72 Falun Falun 55 Skövde Skövde 49 Jönköping Jönköping 118 Gävle Gävle 91 Umeaa Umeaa 105 Karlstad Karlstad 81 Växjö Växjö 74 Kalmar Kalmar 60 Sundsvall Sundsvall 93 Halmstad Halmstad 86 Trollhättan Trollhättan 53 Eskilstuna Eskilstuna 89 Small cities Karlskrona Karlskrona 61 Östersund Östersund 58 Uddevalla Uddevalla 49 Skelleftaa Skelleftaa 72 Nyköping Nyköping 49 Örnsköldsvik Örnsköldsvik 55 Lidköping Lidköping 37 Kemi - Tornio Haparanda (d) 10 (a) As a proxy, we haven t taken the whole NUTS-3 unit Västra Götaland, but only the Swedish county of Bohus. (b) Swedish FUAs only. See further the transborder FUAs chapter for considering the transborder metropolitan area with Kobenhavn. (c) As a proxy, we haven t taken the whole NUTS-3 unit Skana län, but only the Swedish county of Malmö. (d) Swedish side only. See also the transborder FUAs chapter Finland for considering the transborder FUA Conclusions Stockholm, Göteborg and Malmö are by far the most important cities in the Swedish urban network, two other FUAs only having more than 250 thousand inhab. (Linköping nearly reaches this level). Malmö and Helsingborg are parts of a transborder metropolitan area, on the two banks of the Öresund, with now an easy link by bridge to Copenhague. In the southern part of the country and also along the coast of the Gulf of Bothnia, the Swedish urban network can be considered as an archipelago of urban-islands, well-equipped service centres, each with its own differentiated labour markets. 114
115 3.28 Switzerland Criticism of the ESPON FUAs If data provided by ESPON for Swiss FUAs are coherent by comparison to our own estimation of the MUAs populations (but these are from the 1990s), ESPON report considers however the FUA concept in a very restrictive understanding. ESPON has considered very small cores as centres of individual FUAs, which are in fact only secondary subcentres inside metropolitan basins, considered as such in the Swiss planning documents, like the Monitoring de l espace urbain suisse. Some of the so-called centres of the ESPON report are not even true employment cores, as they send more workers outside than they receive from their so-called FUA. We have thus aggregated the populations given for some small FUAs to the population of the metropolitan FUA to which they pertain. On the basis of our criteria, we can however not entirely follow some choices made by the Monitoring de l espace urbain suisse when they consider as single metropolitan areas some non- contiguous FUAs (like Bern-Biel, Bern-Thun, Zürich-Schaffhausen, Genève- Lausanne...), when they use commuting between agglomerations (with a low thereshold of 8.3%) to define the metropolitan areas and when they don't consider the level and the first direction of commuting in the areas surrounding the agglomerations. Meanwhile, the Monitoring de l espace urbain suisse was a very useful basis for preparing our table. Some small cores proposed as FUAs by ESPON or by the Monitoring de l espace urbain suisse have been excluded, since they neither reach the threshold of 50 thousand inhabitants for the FUA, nor the threshold of 20 thousand inhabitants for the core (La Chaux-de-Fonds, Brig-Visp, Yverdon, Grenchen, Wil, Amriswil, Monthey, Interlaken, Davos, St. Moritz, Bulle, Délémont, Langenthal, Martigny, Schwyz). We have not followed the Monitoring de l espace urbain suisse, which considers Buchs Schaans Vaduz as a transborder FUA of 54 thousand inhab. with Liechtenstein, since there is no MUA of at least 20 thousand inhab. in that area The Swiss urban pattern: population data FUAs and poly-fuas Population Espon Population MUAs MUA's population NUTS-3 proxys Population Metropolitan and polynuclear metropolitan areas Zürich (b) Zürich Wintherthur Zug Baden Wadenswill- Freienbach Brugg Rapperswill- Jona CH040, CH
116 Frauenfeld Bremgarten 21 Large cities Genève (c) Genève 388 CH Basel (c) (d) Basel Liestal CH031, CH Bern (e) Bern 225 Lausanne Lausanne 244 Medium cities Sankt-Gallen (f) Sankt-Gallen Rorschach Luzern (g) Luzern 173 Lugano Lugano 73 Olten-Zofingen (h) Olten Zofingen Biel Biel 74 Small cities Bellinzona (i) Locarno Bellinzona Fribourg Fribourg 60 Thun Thun 66 Sion-Sierre (j) Sion 27 Locarno- Vevey- Montreux Vevey- Montreux 51 Aarau Aarau 59 Neuchâtel Neuchâtel 60 Solothurn Solothurn 61 Chur Chur 33 Schaffhausen Schaffhausen 48 Milano - Busto Arsizio - Como Dornbirn - Lustenau Chiasso- Mendrisio (k) Heerbrugg- Altstätten (l) Konstanz Kreuzlingen (m) 18 (a) By comparison with ESPON 1.1.1, revised with 2000 data provided by the Recensement fédéral de la population. Also incorporating the agglomerations of Einsiedeln, Wohlen and Lenzburg to the Zürich metropolitan area's FUA and Lyss to Biel's FUA. (b) ESPON considers as specific FUAs Wintherthur (115 thousand inhab. in the FUA for ESPON 1.1.1), Baden (81 thousand), Zug (71 thousand), Wetzikon-Pfaffikon (48 thousand), Pfäffikon-Lachen (36 thousand), Brugg (25 thousand), Frauenfeld (25 thousand), Lenzburg (24 thousand), Rapperswil-Jona (23 thousand). (c) Swiss side only. Basel and Geneva are only large cities, considering the Swiss side alone. But, including the transborder developments, they are metropolises, and even for Basel a part of a transborder metropolitan system including Mulhouse (see further chapter on transborder FUAs ). 116
117 (d) ESPON considers Liestal as a specific FUA (38 thousand inhab. in the FUA). The Monitoring de l'espace urbain suisse clearly identifies Liestal as a part of the FUA of Basel. If not, Liestal alone doesn't reach the threshold of 50 thousand inhab. (e) ESPON considers Burgdorf as a specific FUA (27 thousand inhab. in the FUA). It can be included in the FUA of Bern, as done by the Monitoring de l'espace urbain suisse. If not, Burgdorf alone doesn't reach the threshold of 50 thousand inhab. (f) ESPON considers as a specific FUA Arbon Rorschach (42 thousand inhab. in the FUA). It can be included in the FUA of St. Gallen. If not, Arbon Rorschach alone doesn't reach the threshold of 50 thousand inhab. (g) ESPON considers as a specific FUA Stans (22 thousand inhab. in the FUA). It can be included in the FUA of Luzern, as done by the Monitoring de l'espace urbain suisse. If not, Stans alone doesn't reach the threshold of 50 thousand inhab. (h) ESPON considers Zofingen as a specific FUA (39 thousand inhab. in the FUA). The Monitoring de l'espace urbain suisse identifies the twin cities as forming a single FUA. (i) ESPON considers Bellinzona as a specific FUA (41 thousand inhab. in the FUA). The Monitoring de l'espace urbain suisse identifies the twin cities as forming a single FUA. If not, Locarno's FUA alone doesn't reach the threshold of 50 thousand inhab. (j) ESPON considers as a specific FUA Sierre (23 thousand inhab. in the FUA). The Monitoring de l'espace urbain suisse identifies the twin cities as forming a single FUA. If not, Sion's FUA alone doesn't reach the threshold of 50 thousand inhab. (k) Swiss side of the FUA of Como only. See further the transborder FUAs chapter. Neither Chiasso, nor Mendrisio reach the threshold of 20,000 inhab. for their MUA. (l) Swiss side of a common FUA with Dornbirn-Lustenau only. See further the transborder FUAs chapter. (m) Swiss side of the FUA of Konstanz only. See further the transborder FUAs chapter. Kreuzlingen itself does not reach the threshold of 20,000 inhab. for its MUA Conclusions Despite of our substantial process of aggregation, the image of a polycentric Swiss urban network remains strong, very coherent with the one described in the Monitoring de l espace urbain suisse. The Swiss urban network is organized along a range of urban centres, most of them medium or small cities, along the Plateau suisse Mittelland from Genève to Sankt-Gallen and Basel. Even the most important metropolitan region, Zürich, has a quite modest size compared to European standards for most of the centres of such worldwide scope. Two of the three main cities are at the centre of transborder metropolitan regions. The transport system appears to be very efficient along this row and inside the main urbanised triangle Base-Zürich-Bern, as well as along the so-called métropole lémanique, between Genève and Vevey-Montreux. As a consequence, commuting and the main cores of the urban system (Zürich, Basel, Bern, Genève-Lausanne, South of Ticino) are more and more reinforced. Outside this main range of cities, the number of FUAs is small in the mountainous part of the country, except for the urbanised south of Ticino, where Locarno-Bellinzona and Lugano are strongly turned toward Milano s metropolitan area. Even Chiasso and Mendrisio form the Swiss part of the FUA of Como, which is incorporated into the big Milano polynuclear metropolitan area. 117
118 3.29 United Kingdom Criticism of the ESPON FUAs Delineating and even defining the British urban areas is a very difficult exercise, insofar as statistical divisions often change, and even sometimes the names of the units. Moreover, it is also due to the nature of the British urbanisation: not only a matter of (historical) cities, but mainly a pattern of former industrial conurbations and more recent residential estates, organised in suburban dense housing districts more or less isolated and very strictly separated from each other by small rural tracks, not to mention the suburbanisation around London where big cities with their own labour pool are also included in the commuting area of the capital. However, ESPON data seem to be very inaccurate. The report generally strongly underestimates the population of the FUAs, which are often even less than the MUA only and possibly limited to a central administrative unit of the latter. Many MUAs aren t either identified by ESPON (even those with more than 100 thousand inhabitants, or secondary centres inside bigger FUAs, or those with their own labour pool). To delineate the MUAs, we have used, as usual, the basic statistical NUTS-5 units, but since wards are often very small, their population densities need to be interpreted by means of an in-depth examination of the Google Earth images. For the FUAs, we used the official TTWA (Travel-to-Work Areas), and we sometimes merged some TTWAs around the main metropolitan areas. However, TTWAs are not exactly FUAs according to our criteria, as they cover the whole territory. Therefore, we have limited to twice the population of the MUA the population of some large TTWAs around small cities. In Northern Ireland, TTWAs do not exist. We have estimated the FUAs on the basis of the population of the administrative units surrounding the MUAs. Due to the lack of true commuting data (it could be possible to get them, but with a specific query to the Statistical Office), it was not possible to define sub-pools inside the main metropolitan areas. 118
119 British urban pattern: population data FUAs and poly-fuas Population Espon Population MUAs MUA's population NUTS-3 proxys Population Metropolitan and polynuclear metropolitan areas London London 7652 Bracknell 289 Luton/Dunstabl e 221 Reading 213 Southend 159 Guildford 117 Slough 111 Maidstone 91 Crawley 88 Basingstoke 78 Stevenage 76 Harlow 75 Aylesbury 58 London Southend Chatham Luton/Dunstabl e Reading Aldershot/ Farnborough Woking Basildon Slough High Wycombe Crawley Bracknell/Ascot Harlow Chelmsford Hemel Hampstead Maidstone Maidenhead St. Albans Basingstoke Aylesbury Stevenage Sittingbourne Wokingham Turnbridge Wells Sandhurst/Yate ley Guildford Windsor Bishop's Stortford Letchworth Horsham East Grinstead Burgess Hill Sevenoaks Haywards Hitchin Tonbridge UKI11, UKI12, UKI21, UKI22, UKI23, UKJ11, UKJ13, UKJ23, UKJ41, UKJ42, UKH21, UKH23, UKH31, UKH32, UKH Birmingham 3683 Birmingham Birmingham UKG13, UKG31,
120 metropolitan area 966 Wolverhampton 433 Coventry 299 Warwick 78 Dudley 192 Cannock 96 Kidderminster 55 Wolverhampto n Coventry Nuneaton Warwick/ Leamington Redditch Bromsgrove Tamworth UKG32, UKG33, UKG34, UKG35 Manchester metropolitan area 2556 Manchester 2207 Bolton 139 Rochdale 94 Manchester Macclesfield UKD31, UKD Leeds-Bradford metropolitan area 2302 Leeds 424 Bradford 289 Huddersfield 144 Wakefield 74 Harrogate 66 Leeds Bradford Huddersfield Halifax/ Queensbury Wakefield Castleford/ Pontefract Harrogate Dewsbury UKE41, UKE42, UKE Liverpool/ Birkenhead metropolitan area 2241 Liverpool 482 Wigan 192 Warrington 83 Chester 80 Liverpool/ Birkenhead Wigan/Ashton Warrington Widness/Runco rn Chester Southport Port Ellesmere Ormskirk Skelmersdale UKD21, UKD22, UKD51, UKD52, UKD53, UKD Tyneside metropolitan area 1599 Newcastle 886 Sunderland 183 Newcastle Sunderland Blyth/Cramlingt on Peterlee Ashington Seaham Chester-le- Street UKC22, UKC Sheffield metropolitan area 1569 Sheffield 553 Barnsley 75 Doncaster 72 Sheffield Rotherham Doncaster Darfield Chesterfield Barnsley UKE31, UKE Portsmouth/ Southampton metropolitan 1547 Southampton 210 Portsmouth Portsmouth Southampton Bognor Regis UKJ31, UKJ32, UKJ
121 area 175 Salisbury Winchester Andover Nottingham- Derby metropolitan area 1534 Nottingham 270 Derby 224 Mansfield 72 Nottingham Derby Mansfield Ilkeston Newark Alfreton UKF11, UKF13, UKF14, UKF15, UKF Glasgow 1395 Glasgow 1323 Kilmarnock 81 Glasgow Kilbride Cumbernauld Kilmarnock Dumbarton UKM31, UKM34, UKM35, UKM Cardiff and South Wales valleys metropolitan area 1097 Cardiff 272 Newport 116 Cardiff Newport Merthyr Tydfil Pontypridd Caerphilly Bridgend Ebbw Vale UKL15, UKL16, UKL21, UKL Bristol metropolitan area 1041 Bristol 408 Bath 85 Weston-super- Mare 69 Bristol Weston-super- Mare Bath Clevedon UKK11, UKK Belfast 799 Belfast 675 Lisburn 111 Bangor 64 Belfast Bangor UKN01, UKN Edinburgh 782 Edinburgh 533 Edinburgh Livingston UKM23, UKM25, UKM Brighton/ Worthing/Little hampton 769 Brighton 221 Eastbourne 95 Brighton/Worth ing Eastbourne Littlehampton UKJ21, UKJ Leicester 745 Leicester 319 Leicester Loughborough Coalville Hinckley UKF21, UKF Middlesborough 656 Middlesborough 231 Hartlepool 87 Darlington 87 Middlesborough Darlington Hartlepool UKC11, UKC12, UKC Bournemouth/ Poole 531 Bournemouth 155 Poole 138 Bournemouth/ Poole 390 UKK21,UKK Large cities Swansea Swansea Port Talbot/Neath
122 Stoke Stoke 359 Hull Hull 284 Blackburn/Burn ley 391 Blackburn 106 Burnley 75 Blackburn Burnley Norwich Norwich 193 Preston Preston/ Leyland 249 Plymouth Plymouth 228 Aberdeen Aberdeen 183 Blackpool Blackpool 239 Northampton Northampton 220 Cambridge Cambridge 142 Milton Keynes Milton Keynes 136 Swindon Swindon 144 Exeter Exeter Exmouth Medium cities Oxford Oxford 122 Ipswich Ipswich 120 York York 135 Torbay Torbay 178 Peterborough Peterborough 127 Dundee Dundee 150 Telford Telford 105 Bedford Bedford 108 Colchester Colchester 95 Lincoln Lincoln 99 Grimsby 174 n.c. Grimsby 123 Gloucester Gloucester 134 Hastings/ Bexhill Hastings/ Bexhill 103 Cheltenham Cheltenham 82 Kirkcaldy Kirkcaldy Glenrothes Buckhaven Worcester Worcester 82 Scunthorpe Scunthorpe Hatfield/ Welwyn Lancaster 148 n.c. Lancaster/ Morecombe
123 Bay Falkirk Falkirk 141 Corby 140 n.c. Kettering Corby Londonderry Londonderry 77 Dunfermline Dunfermline 75 Irvine Irvine 71 Rushden 135 n.c. Rushden 67 Thanet Thanet 105 Crewe/ Nantwich Burton on Trent Kettering Crewe/ Nantwich Burton on Trent Swadlincote/ Ashby-de-la- Zouche Lowestoft Lowestoft 58 Canterbury 110 n.c. Canterbury 55 Portland/ Weymouth 104 n.c. Portland/ Weymouth 55 Ayr Ayr 51 Small cities Great Yarmouth Great Yarmouth 46 Taunton Taunton 46 Shrewsbury Shrewsbury 45 Alloa-Stirling Alloa Stirling Newbury 90 n.c. Newbury 45 Ashford Ashford 44 Inverness Inverness 47 Clacton 86 n.c. Clacton 49 Greenock Greenock 67 Scarborough 84 n.c. Scarborough 43 Rugby Rugby 49 Lurgan/ Portadown Lurgan/ Portadown 62 Perth 80 n.c. Perth Stanley Folkestone 75 n.c. Folkestone 38 Carlisle Carlisle 38 Braintree 72 n.c. Braintree
124 Stafford Stafford 35 Dover 66 n.c. Dover 33 Barrow-in- Furness 61 n.c. Barrow-in- Furness 31 Dumfries 60 n.c. Dumfries 30 St. Austell 60 n.c. St. Austell 30 Whitehaven 54 n.c. Whitehaven 27 Hereford 54 n.c. Hereford 27 Ballymena 51 n.c. Ballymena Conclusions Britain is a much urbanised country. The urban pattern densely covers the whole country, with the exception of the (very) few densely populated peripheral regions: Highlands, Southern Uplands of Scotland, far-north of England, Wales, with the exception of the southern coast. The urban network is also weaker in East Anglia and in the south-west. As for the rest, densities of population and urbanisation are strong in the London basin and along two axes from London to the north: from London to Liverpool and Lancaster on the west, from London to Tyneside east of the Pennines. The other much urbanised region is the Scottish Lowlands. In spite of its dense urbanisation and the importance of as much as 12 metropolitan areas with more than 1 million inhab., Britain is quite monocentric from a functional point of view, an important part of the command functions remaining concentrated in London's area. London's metropolitan area is the main European metropolitan region, around a very strong core, like the Paris area. But a difference with Paris is that a network of strong peripheral cities describes a circle inside the FUA: though included in London's FUA, those cities are more autonomous and concentrate more high level functions than the Parisian new towns toward Paris. Moreover, another circle of FUAs, external to London's FUA, completes the pattern: Cambridge, Milton Keynes, Oxford, Portsmouth-Southampton, Brighton, Ashford. From a morphological point of view, British polycentricity can be observed on two scales: on a small scale, metropolitan areas, large, small and medium cities are very numerous; on a large scale, inside metropolitan areas and large cities, urbanisation is often organised in residential estates, sometimes even separated from each other by rural tracts. Paradoxically for a country as urbanised as Britain, the central cores are quite weak by comparison to the size of such urban areas and often lack a strong urban character, with the exception of some historical cities (but urbanisation was weak in Britain before the industrial revolution, which explains these characteristics of the British urban pattern). As a conclusion, on a small scale, British polycentricity is hampered by the functional primacy of London. On a large scale, inside metropolitan regions (outside London metropolitan area), polycentricity reflects some weaknesses of the urban heritage. 124

125 3.30 Maps of the European FUAs from the morphological point of view Figure 1 Functional Urban Areas according to their population 125

126 Figure 2 FUA distribution inside and outside the poly-fua 126
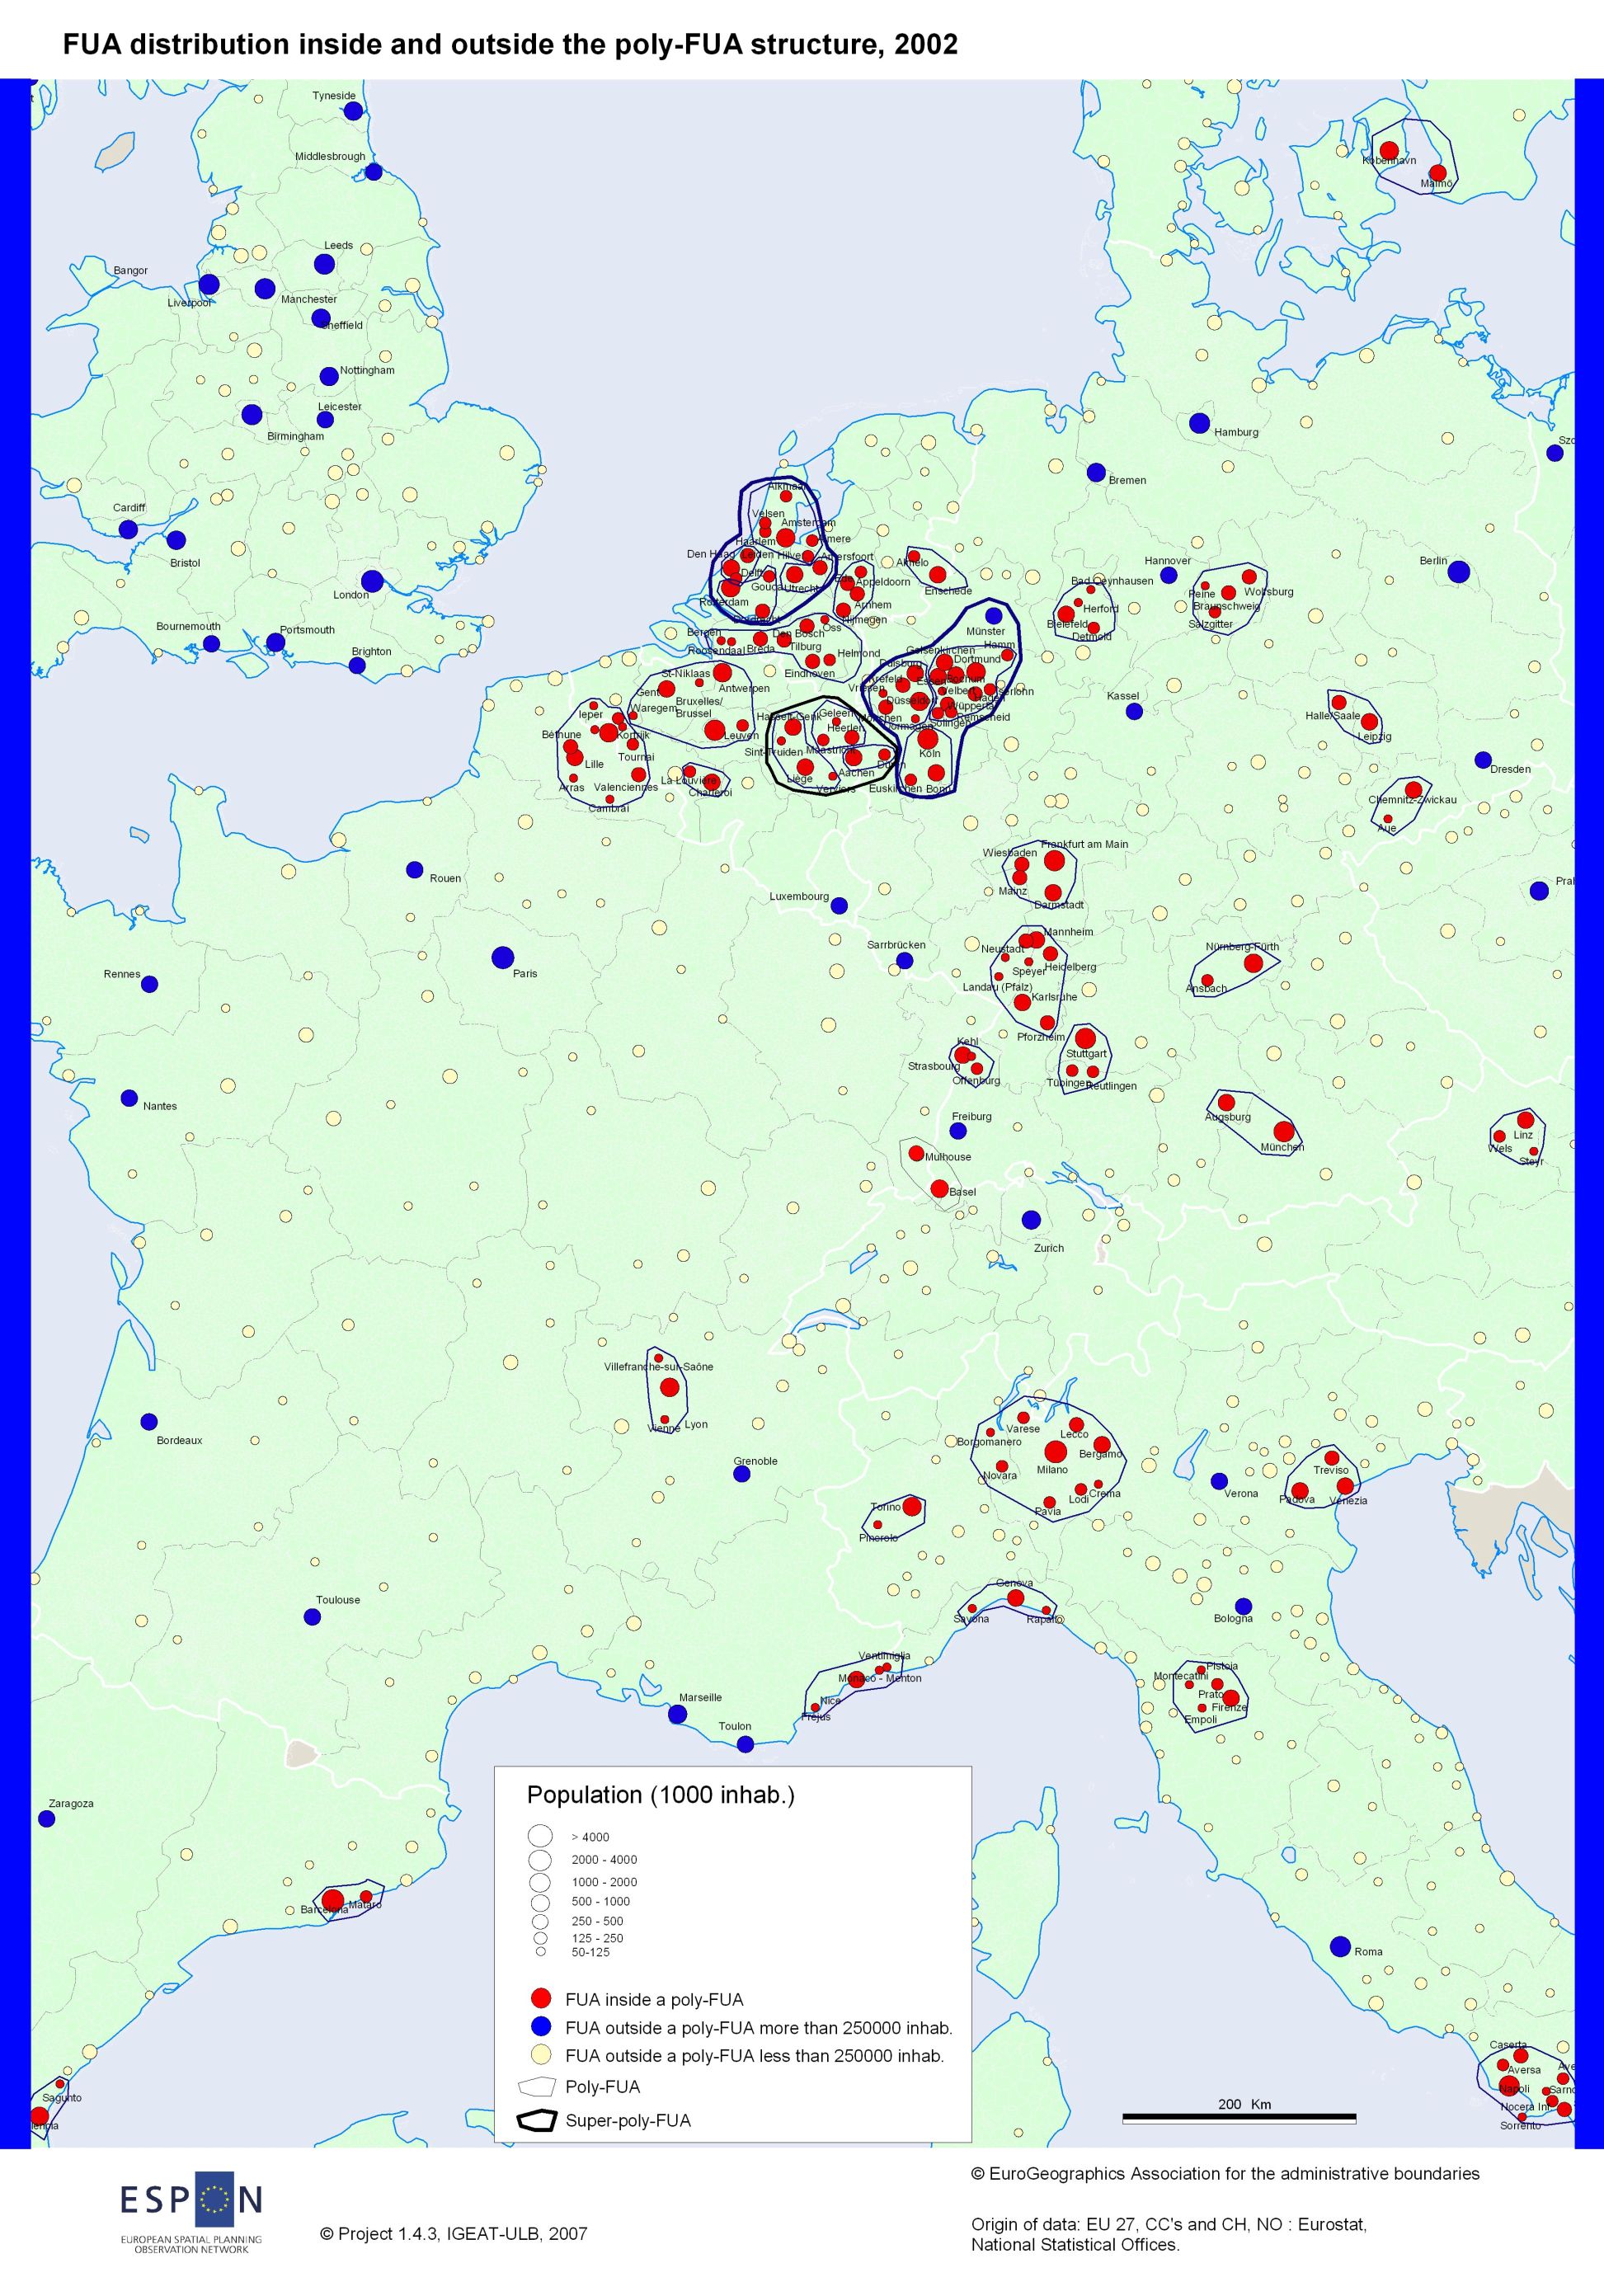
127 127
128 Figure 3 FUA distribution inside and outside the poly-fua (zoom) 128

129 4. Transborder FUAs 4.1 Typology of the transborder FUAs Type 1: twin-cities, generally quite small, sometimes a former single city, cut by a border, each with their own FUA even if some transborder commuting is present. Figure 4 type 1 transborder FUA Type 2: a metropolis or large city, with a morphological area extending across the border in the neighbour country, through suburban areas or small cities, more included in the FUA of the main city. Figure 5 type 2 transborder FUA 129


130 Type 3: a metropolis or large city, with a contiguity in the neighbour country to smaller cities with their own FUA or sending quite few commuters to the main city in the other country. Figure 6 type 3 transborder FUA Type 4: a small transborder urban area with a quite well integrated common commuting basin. Figure 7 type 4 transborder FUA 130

131 Type 5: a metropolis or a large city, with its FUA extending in the neighbour country, possibly with a scattered network of secondary centres. Figure 8 type 5 transborder FUA Type 6: two metropolises or large cities, on each side of the border, with tangential MUAs. Figure 9 type 6 transborder FUA 131


132 Type 7: two or more metropolises or large cities, on each side of the border, with tangential FUAs. Figure 10 type 7 transborder FUA Two other types are not considered here: first the case of a city divided by a border, without or with very few contacts between the two sides of the border, so without any transborder functionality. It was the case of Berlin before the reunification or Nicosia today. Second, the case of metropolises or large cities quite close to each other and cooperating possibly across the border, but without contiguity between their FUAs. Figure 11 A transborder FUA type without contiguity 132

133 Figure 12 A city divided by a border transborder type 4.2 The European transborder FUAs The lines in yellow show the FUAs that are integrated in the transborder FUAs described in the preceding white line, so every white line preceding a yellow one describes a transborder FUA. FUAs Population Type of transbord er aera (classifica -tion attempt) MUAs MUA's population NUTS-3 proxys Populati on Metropolitan and polynuclear metropolitan areas Milano polycentric metropolitan area (IT- CH) see beneath ITC15,ITC41, ITC42,ITC43, ITC45,ITC46, ITC48,ITC of which Italian side of which Swiss side 48 - Milano Busto Arsizio Como (IT-CH) Milano Busto Arsizio Como Gallarate- Sestocalende Vigevano Abbiategrasso Chiasso - Mendrisio Bergamo (IT) Bergamo Palazzolo sull'oglio Treviglio ITC42,ITC ITC Lecco (IT) Lecco 112 ITC
134 Varese (IT) Varese 194 ITC Novara (IT) Novara 102 ITC Pavia (IT) Pavia 71 ITC Lodi (IT) Lodi 40 ITC Crema (IT) Crema 33 not included in the proxy Borgomanero (IT) 89 - Borgomanero 22 not included in the proxy Silesian-Moravian polycentric metropolitan area (PL- CZ) see beneath PL225,PL226,PL227, CZ of which Polish side of which Czech side Katowice (PL) Katowice Zawiercie Olkusz Chrzanow Oswiecim Knurow Laziska Gorne Pyskowice PL Ostrava-Cieszyn (CZ- PL) Ostrava (CZ) Karvina (CZ) Cieszyn-Cesky Tesin (PL-CZ) Frydek-Mistek (CZ) Trinec (CZ) Orlova (CZ) Novy Jicin (CZ) Koprivnice (CZ) CZ Bielsko-Biala (PL) Bielsko-Biala 223 PL Rybnik (PL) Rybnik Jastrebie-Zdroj Zory Wodzislaw Sl PL Raciborz (PL) Raciborz 63 included in PL227 Wien-Bratislava metropolitan area (AT-SK-HU) see beneath AT112,AT122,AT125, AT126,AT127, AT130, SK of which Austrian side of which Slovak side of which Hungarian side 73 - Wien (AT) Wien Baden Wiener AT112,AT122,AT125, AT126,AT127,
135 Neustadt AT130 Bratislava (SK) Bratislava 444 SK Mosonmagyarovar (HU) Lille transborder metropolitan area 73 1 Mosonmagyaro var 30 not included in the proxy see beneath FR301 (partim, arrondissements of Cambrai, Douai, Lille, Valenciennes), FR302 (partim arrondissements of Arras, Béthune,Lens),BE25 3, BE254,BE324,BE327 of which French side of which Belgian side Lille (FR-BE) /7 Lille 953 FR 301 (arr. Lille) Douai-Lens (FR) Lens Douai Somain-Aniche FR 301 (arr. Douai), FR302 (arr. Lens) 576 Valenciennes (FR) Valenciennes Denain FR 301 (arr. Valenciennes) 350 Béthune (FR) Bruay-la- Buissière Béthune FR302 (arr. Béthune) 281 Kortrijk (BE) Kortrijk 151 BE Tournai (BE) Tournai 67 BE Arras (FR) Arras 77 FR302 (arr. Arras) 302 Ieper (BE) 87 7 Ieper 35 BE Mouscron (BE) 62 5/7 Mouscron 52 BE Armentières (FR) 59 (4) Armentières 41 included in FR301 (arr. Lille) Cambrai (FR) 58 - Cambrai 45 FR301 (arr. Cambrai) 159 Euroregio MAHL (BE- DE-NL) see beneath DEA21,DEA25,DEA2 9, DEA26,NL423,BE331, BE332,BE333,BE334, BE221,BE222,BE223 of which Belgian side of which German side of which Dutch side Liège (BE) Liège 451 BE331,BE332,BE Aachen (DE-BE) 724 5/6/7 Aachen Herzogenrath Eschweiler DEA21,DEA25,DEA2 9 Hasselt-Genk (BE) Hasselt-Genk 131 BE221,BE222,BE Heerlen (NL) 308 6/7 Heerlen 218 NL Düren (DE) Düren 92 DEA
136 Maastricht (NL-BE) 230 6/7 Maastricht 142 included in NL423 Geleen-Sittard (NL) Geleen 89 included in NL423 Verviers (BE) 106 (6) Verviers 67 BE Sint-Truiden (BE) 66 - Sint-Truiden 37 included in Hasselt- Genk Öresund metropolitan area (DK-SE) /7 see beneath DK001,DK002,DK003, DK004,SE044 (partim county Malmö) 2624 of which Danish side of which Swedish side Kobenhavn (DK) /7 Kobenhavn Helsingor Koge Hillerod DK001,DK002, DK003,DK Malmö (SE) 667 6/7 Malmö Lund SE044 (partim county Malmö) 824 Helsingborg (SE) Helsingborg 119 included in SE044 (partim county Malmö) Noord-Brabant polycentric metropolitan area (NL-BE) see beneath NL411,NL412,NL413 NL of which Dutch side of which Belgian side 43 - Tilburg (NL-BE) 467 (5) Tilburg Waalwijk Boxtel Dongen Eindhoven (NL-BE) Eindhoven Valkenswaard Den Bosch (NL) Den Bosch Sint-Michielsgestel Vught Breda (NL) Breda Oosterhout Zevenbergen Helmond (NL) Helmond Deurne Nuenen c.a NL NL NL NL included in NL414 Roosendaal (NL) 75 - Roosendaal 75 included in NL411 Oss (NL) 66 - Oss 66 included in NL413 Bergen op Zoom (NL) 65 - Bergen op Zoom 65 included in NL411 Gelderland polycentric metropolitan area (NL- DE) see beneath NL223,DEA1B 991 of which Dutch side of which German side
137 Arnhem (NL) Arnhem Rheden Renkum NL Nijmegen (NL) Nijmegen 216 included in NL223 Ede (NL) Ede Veenendaal Barneveld Wageningen Appeldoorn (NL) Appeldoorn Epe included in NL223 n.a. Kleve (DE) Kleve 49 DEA1B (a) 298 Nice-Côte d'azur-san Remo (FR-IT-MC) of which French side (+Monaco) see beneath FR823,ITC (b) of which Italian side Nice (FR) Nice Cannes Antibes FR San Remo-Ventimiglia (IT) San Remo- Ventimiglia 101 ITC31 (a) 216 Monaco-Menton (FR-MC) 67 1 Monaco Menton included in FR823 Fréjus (FR) 83 - Fréjus 77 included in FR823 Saarbrücken - Forbach (DE-FR) /5 Saarbrücken Forbach DEC01,DEC02,DEC03, DEC04,DEC05,DEC06, FR413(partim arr. Forbach) 1089 of which German side of which French side Luxembourg metropolitan area (LU- DE-FR-BE) LU000,BE341,BE342, BE345,FR411(partim arr. Briey), FR413(partim arr. Thionville est et ouest),deb21,deb of which Luxembourg side of which German side of which French side of which Belgian side Luxembourg (LU-BE-FR) Luxembourg (LU) Trois frontières agglomeration (FR-BE-LU) Esch-sur-Alzette- Villerupt (LU) Arlon LU000,BE341,BE342, BE345,FR411(partim arr. Briey) 738 Trier (DE) 245 5/7 Trier 100 DEB21,DEB Thionville (FR) 156 5/7 Thionville 138 FR413(partim arr. Thionville est et ouest)
138 Basel-Mulhouse metropolitan area (CH- FR-DE) see beneath CH031,CH032,DE139, FR422(partim arr. Mulhouse et Thann) 1046 of which Swiss side of which French side of which German side Basel (CH-DE-FR) 680 2/7 Basel-Lörrach-St. Louis Liestal CH031,CH032,DE Mulhouse-Thann (FR) Mulhouse 211 FR422 (partim arr. Mulhouse et Thann) 382 Strasbourg-Offenburg (FR-DE) FR421 (a), DE134 (a) 1446 of which French side of which German side Strasbourg-Kehl 661 3/7 Strasbourg (FR)- Kehl (DE) 451 FR421 (a) 1039 Offenburg Offenburg (DE) 58 DE134 (a) 407 Genève-Annemasse (CH-FR) Genève- Annemasse 456 CH013, FR718 (partim, arr. St. Julien) 539 of which Swiss side of which French side Twente-Nordhorn metropolitan area (NL- DE) see beneath NL213,DE of which Dutch side of which German side Enschede-Hengelo (NL) - Gronau (DE) Enschede Gronau Oldenzaal Borne NL Almelo (NL) Almelo 90 included in NL213 Nordhorn (DE) Nordhorn 52 DE Large cities Salzburg (AT-DE) Salzburg 154 of which Austrian side 366 of which German side 81 Donostia-San Sebastian- Hendaye (ES-FR) (for Irun- Hendaye) Donostia-San Sebastian (ES) Irun-Hendaye (ES-FR) Zarautz (ES) of which Spanish side 393 of which French side 13 Ruse-Giurgiu (BG-RO) Ruse(BG)-Giurgiu (RO) 254 of which Bulgarian side
139 of which Romanian side 72 Medium cities Dornbirn-Heerbrugg (AT-CH) Dornbirn (AT) Heerbrugg- Alstätten (CH) Lustenau (AT) of which Austrian side 99 of which Swiss side 46 Görlitz-Zgorzelec PL) (DE of which German side of which Polish side Gorizia-Nova Gorica (IT- SI) 135 1/4 Gorizia(IT)-Nova Gorica(SI) 71 of which Italian side 72 of which Slovenian side 63 Bregenz-Lindau (AT-DE) Bregenz (AT) Lindau (DE) of which Austrian side 117 of which German side Frankfurt an der Oder- Slubice (DE-PL) Frankfurt an der Oder (DE)-Slubice (PL) 90 of which German side of which Polish side Konstanz (DE-CH) Konstanz (DE) 79 of which German side 79 of which Swiss side 25 Small cities Komarno-Komarom (SK-HU) 98 1 Komarno (SK) -Komarom (HU) 49 of which Slovak side 58 of which Hungarian side Narva-Ivangorod (EE- RU) Narva- Ivangorod (EE- RU) 79 of which Estonian side 73 of which Russian side Esztergom-Sturovo (HU-SK) of which Hungarian side 11 (c) 78 1 Esztergom (HU)-Sturovo (SK)
140 of which Slovak side 22 Haparanda (FI-SE) Kemi-Tornio Kemi (FI) Tornio- Haparanda (FI- SE) of which Finnish side 61 of Swedish side 10 (a) The NUTS-3 unit is too large (the FUA is less than 60% of the population of the NUTS-3 unit) (b) 1266 including data for Monaco. (c) MUA only. 140

141 4.3 Map of the transborder FUAs Figure 13 Transborder FUAs and their types 141
142 5. The Morphological Polycentricity For this part we have taken into account only the FUAs of more than inhabitants as the data are available at the NUTS-3 level which is usable to qualify these metropolises (see the morphological descriptions above). For smaller FUAs (i.e. more than inhabitants) this analyse could be done too for punctual data but not for the structural indices for the NUTS-3 are too disaggregated. This should be done in the future if EUROSTAT can provide data at a lower level than in the present time. 5.1 Measuring the morphological polycentricity of the European urban pattern A more polycentric urban network, as opposed to monocentrism, is a central objective of the official European policies of planning and dominates its rhetoric (ESDP, 1999). The ESPON report aims to investigate it in depth. More polycentrism - the concept being used as well at the intra-metropolitan level, at the intra-national level and at the European level as a whole - is supposed to help containing urban sprawl, to favour cooperative strategies and networking between the cities, and, at the upper scale, which we intend to examine here, to lead to more efficient economies and at the same time to more equitable regional developments. The polycentric project is now so present in the official documents that questioning the content and the validity of the concept could seems out of place. However, we intend to show that this concept is often unsubstantial, ambiguous, badly defined, used as well from a morphological (the urban pattern) as from a functional point of view (the flows, the effective networks), confusing the geographical scales and more a normative than a scientific one (see also S. Davoudi, 2003). Our main question is thus to examine if it is true, looking at the empiric evidences i.e. morphological polycentrism as a measurable scientific object, and not as a territorial planning political goal -, that more polycentric national and European structures could lead simultaneously to more equity and effective regional development, to less inequalities between the regions and to a more effective, competitive and better integrated European economy, favouring also the sustainable development. As for us, we have computed two measures of the polycentrism on the basis of a sole methodology, the one at the level of the States, the other at the level of more or less similar sized units, i.e. the small and medium-sized countries considered as a single unit, and the biggest countries divided into macro-regions of about 10 millions inhabitants. Our index is computed on the basis of a simple and purely morphological methodology (as approached by the proxies of population data). We have used the cardinal ranking of the following indicators: Part of the main FUA in the total population of the country Part of the main FUA in the population of the whole set of FUAs with more than 250 thousands inhab. 142
143 Part of the main FUA in the population of the whole set of FUAs with more than 50 thousands inhab. Standard deviation of the population of the FUAs with more than 50 thousands inhab. Average of the differences between the ranked populations of the FUAs until the threshold of 50 thousands inhab. The value of each of these five indicators has been distributed on a scale bounded from 100 (the highest value for the indicator) and 0 (the lowest one). The arithmetic average of these seven indicators gives the cardinal global index (Table 1). We stress that we compute here (the proxy of) an exclusively morphological index of polycentrism, and not a measure of functional polycentrism, decisional functions appearing to be much more concentrated in most countries than the urban populations (C. Vandermotten & al., 1999). 143
144 Macro-region our country value Macro-region our country value Italy (NorthEast) 94,6 Poland (North) 67,8 Germany 93,4 Norway 66,4 Netherlands 90,8 France (CentralEast) 64,6 Poland (East) 89,6 United Kingdom 63,8 Germany (RhinelandWestfalia) 88 Finland 63,6 Germany (Saxony-Thuringia) 87,8 Poland (SouthWest) 63,6 Spain (North) 87,4 United Kingdom (Scotland) 63,6 France (West) 86,6 France 62,4 Italy 86,2 Italy (NorthWest) 58,2 Spain (South) 86 Italy (Centre,incl.Abruzze-Molise) 57,8 Poland 85,6 Austria 56,8 France (NorthEast) 83,8 Slovenia 56,8 United Kingdom (North of England) 80,2 Denmark 56,6 Spain 77,6 Hungary 54,8 Romania 77,2 Portugal 54,4 Switzerland 75,4 Cyprus 51,4 Slovakia 74,8 Spain (East) 50,8 Czech Republic 74,2 Poland (SouthEast) 49,8 Italy (South) 74,2 United Kingdom (Midlands) 48,8 France (SouthWest) 73,8 Ireland 45,8 Bulgaria 73,2 Poland (Centre) 45,8 Lituania 72 Estonia 45,6 Sweden 71,8 Greece 38,6 France (SouthEast) 71,6 United Kingdom (Wales) 34,8 Poland (NorthWest) 71,6 Latvia 32,2 Germany (Baden-Wurtemberg) 70 United Kingdom (NorthernIreland) 31,2 Germany (North) 70 Spain (Centre) 21,4 Belgium 69,6 United Kingdom (South) 20,2 Germany (Hessen-Pfalz-Saarland) 68,4 Germany (NorthEast) 17,8 Germany (Bavaria) 68 France (Parisian basin) 16,8 France (North) 67,8 Table 2 Level of polycentricity in the European macro-regions and countries The sole surprise arising from our ranking regarding a qualitative knowledge of the European urban patterns is the position of Hungary, which appears a priori to be very monocentric due to the weight of Budapest. Our index of polycentrism is not linked to the results of any territorial planning policy. It aims first at showing the product of national histories and territorial building, in a very long time perspective. The economic and political developments, sometimes from the Middle 144
145 Ages, gave rise to different urban patterns, with a whole range of situations between monocentricity and polycentricity: a monocentric pattern combined with a relative sterilization of the rest of the country, for a long time characterised by out migration (ex.: Ireland, for a long time in a quasi-colonial context ; Greece, with the exception of Thessalonica, located at the top of an international corridor) ; a restrained monocentricity, linked to an early national building, but without sterilization of the development outside the capital region (ex.: Denmark and Sweden, where the agrarian revolution played an important role in the initial phases of access to modernity); a strong monocentrism, yet more decisional than morphological, in countries with a very early territorial formation, where the powers are strongly concentrated in the capital, but however with other important cities, possibly also with their own strong historical weight. These cities can have been reinforced, as well as other mediumsized cities and intermediate areas, by regional and equilibrium metropolises policies during the last half-century, even if they remain under the control of the capital. France pertains to this type, which doesn t exclude macro-regional polycentrism, like in the East or the West of the country; a more or less similar situation, but where the decisional supremacy of the capital doesn t exclude big manufacturing conurbations, born during the early phases of a very intense industrial revolution, implying locations on the coalfields or on the proto-industrial manpower basins, or even allows more recent urban-regional developments (ex.: Great-Britain) ; a more or less equilibrated bicephalous pattern, possibly with a more political and a more private economic head (ex.: Spain or Italy, with in this last country very strong inter-regional economic inequalities and more, in the South, regional more or less parasitic primacies, like Napoli or to a certain extent Sevilla, which reflect the longlasting survival of aristocratic and archaic structures in their rural environment); a mid-european strongly polycentric pattern, with a very dense urbanisation and a very open urban hierarchy, from millionaire cities to a dense network of mediumsized cities, in the context of old urban autonomy tradition. This model includes polynuclear conurbations, even if these don t recover necessarily truly lived identities or spaces of strong planning and economic cooperation (Delta Metropolis in the Netherlands; Rhine-Ruhr; Rhine-Main; the Walloon industrial axis). This polycentrism can be the result of late national unifications and federal systems. However, the German polycentrism doesn t exclude the extreme monocentrism of the North-East of the country, besides not a part of the medieval Germany of cities and merchants ; finally, Switzerland is characterised by a typical mid-european polycentrism, but without big millionaire cities nor conurbations born during the coal based industrialisation period. 145

146 Figure 14 Indicator of morphological polycentricity by country 146
147 Figure 15 Indicator of morphological polycentricity by region 147
148 5.2 Polycentricity and economic efficiency As we have already seen, European policies assign to polycentricity a normative value of efficiency: it is supposed to favour regional and, through this one, global development, either by adding more performing regional growths or by avoiding diseconomies supposed to affect the biggest agglomerations. What is the evidence? We have computed the correlation between level of polycentricity and three indices of relative dynamics as shown beneath. If it is any, but not significant or slight correlation, it is between the level of development and more monocentrism. Relation Period Correlation coefficient r Relative dynamics of the GDP/inhab. vs. European average (2002 index 1980 index, EU15 = 100) ,39 Relative dynamics of the GDP by inhab. vs. European (2002 index 1995 index, EU15 = 100) ,24 Relative dynamics of the GDP./inhab. vs. National average (2002 index 1995 index, national average = 100) ,10 Table 3 Coefficient of correlation between monocentrism and economic growth 148
.")
.")
149 Figure 16 Economic growth and monocentrism at the scale of the macro-regions ( ). Figure 17 Economic growth and monocentrism at the scale of the macro-regions ( ). 149

150 Figure 18 Economic growth by comparison to the national performances in each country and monocentrism at the scale of the macro-regions ( ) To conclude, this statistical link between monocentrism and economic efficiency seems to be consistent with the main present trends towards more globalisation, which favour the main advanced services nodes of the world-wide economy. 150

151 5.2.1 The maps Figure 19 The large cities, the metropolises and the MEGAs according to their population 151
 according to their")
152 Figure 20 The large cities and the metropolises (cities gathered inside the polycentric areas) according to their population 152
153 Figure 21 The large cities, the metropolises and the MEGAs according to their GDP 153
 according to their")
154 Figure 22 The large cities and the metropolises (cities gathered inside the polycentric areas) according to their GDP 154
155 6. The Functional measures of the FUAs As explained in chapter 2 we have studied the functional aspects of all the FUAs defined by the morphological study. We have studied 5 functions for which we could gather enough data: the administrative functions, consisting of the national functions (capital city, chief towns, etc) and the international functions (cities hosting headquarters of important european and international institutions) the decision functions, consisting of the localisation of the heaquarters and their subsidiaries of national and international important companies the transport functions that measure the connectivity of a city with the others, consisting of the road and rail connectivity as well as the air traffic and the sea transport the knowledge functions, consisting of the localisation of the most important universities, research centres and high-technology production the tourism functions, consisting of a measure of the touristic activities estimated by the number of beds available and the number of nights spent in the touristic facilities, and by the appreciation reflected by the touristic guides (we did it only with Michelin but it should be done as well with other tourist guides). This criterion should also be completed by other cultural criteria such as the congress cities, and other cultural activities (museums, theatres, festivals, etc). Unfortunately we couldn t find relevant data for the industrial activities at the city level. We have then used the data provided by Espon but these were missing for France, UK and Switzerland, so that we didn t use them to compute our global functional index. Global score: Average of all the scores, except industry. Functional score: Average of all the scores, except industry and population. Global score including industry: Average of the 7 scores. Then we have calculated a specificity value for our 5 function scores by dividing each of these by the Functional score in order to highlight the cities that would have a specific function. The results are shown in the maps below. The results are shown on next pages in alphabetical order of the country code. 155
156 6.1 The functional data Austria (AT) fua name global score functional score function al score with industry population administration decision transport knowledge tourism industry Amstetten 0,56 0,46 1, ,44 0, Bregenz 1,96 2,17 2, ,11 1,25 3,4 4 Dornbirn - Lustenau 1,25 1,08 1, ,5 3,11 1, Feldkirch 0,97 0,97 1, ,11 1, Graz 3,82 3,78 4, ,5 2,67 5,42 6,4 6 Innsbruck 3,14 3,17 3, ,5 2,89 3,96 4,9 4 Kapfenberg/Brück an der Mur 0,67 0,6 1, ,44 1, Klagenfurt 1,93 1,69 2, ,69 3,13 0,8 4 Leoben 0,67 0,6 1, ,44 1, Linz 4,06 4,08 4, ,42 5,42 4,5 6 Salzburg 3,25 3,3 3, ,11 1,25 6,5 4 Sankt-Pölten 1,15 0,96 1, ,67 0, Steyr 0,67 0,6 1, ,44 1, Villach 1,05 0,84 1, ,44 0,63 0,7 4 Wels 1,08 0,87 1, ,5 2,17 1, Wien 8,07 7,87 8,06 9 9,5 8,5 5,61 8, Wolfsberg 0,56 0,46 0, ,44 0,
157 Belgium (BE) fua name global score functional score function al score with industry population administration decision transport knowledge tourism industry Antwerpen 5,47 5,12 5, ,5 6,28 4,38 6,4 8 Brugge 2,97 2,97 3, ,58 1,88 6,4 4 Bruxelles/Brussel 8,23 8,05 7, ,53 7, Charleroi 1,92 1,24 2, ,31 1, Gent 3,83 3,57 4, ,56 5,21 5,8 6 Hasselt-Genk 1,81 1,32 2, ,56 1, Ieper 1,13 1,16 1, ,33 1, Kortrijk 1,44 1,32 2, ,5 3,56 1, La Louvière 1,24 1,07 1, ,56 1, Leuven 2,96 3,18 3, ,5 3,56 6,04 3,7 4 Liège 3,54 3,21 3, ,5 3,78 4,58 4,1 6 Mons-Borinage 1,51 1,18 1, ,56 1, Mouscron 1,06 1,07 1, ,56 1, Namur 2,58 2,71 2, ,56 2,92 3,7 2 Oostende 1,36 1,21 1, ,58 1, Roeselare 1,31 1,16 1, ,33 1, Sint-Niklaas 1,17 1,21 1, ,56 1, Sint-Truiden 1,17 1,21 0, ,56 1, Tournai 1,95 1,94 1, ,78 1,25 3,7 2 Turnhout 1,35 1,21 1, ,56 1, Verviers 1,06 1,07 1, ,56 1, Waregem 1,17 1,21 0, ,56 1,
158 Bulgaria (BG) fua name global score functional score functional score with industry population administration decision transport knowledge tourism industry Asenovgrad 0,41 0,28 0, ,61 0, Blagoevgrad 0,61 0,52 0, ,5 0,61 1, Burgas 1,24 1,08 1, ,11 0,63 1,6 2 Dimitrovgrad 0,41 0,28 0, ,61 0, Dobrich 0,29 0,14 0, , Doupnitsa 0,52 0,41 0, ,61 1, Gabrovo 0,79 0,74 0, ,61 0,63 2,1 2 Gorna Oriahovitsa 0,43 0,3 0, ,72 0, Haskovo 0,77 0,72 0, ,5 0,61 0, Kardzhali 0,41 0,28 0, ,61 0, Karlovo 0,53 0,43 0, ,61 0,63 0,7 2 Kazanlak 0,53 0,43 0, ,61 0,63 0,7 2 Kyustendil 0,52 0,41 0, ,61 1, Lovech 0,68 0,61 0, ,61 0, Montana 0,59 0,5 0, ,5 0,61 0, Pazardzhik 0,59 0,28 0, ,61 0, Pernik 0,52 0,41 0, ,61 1, Petrich 0,52 0,41 0, ,61 1, Pleven 0,59 0,28 0, ,61 0, Plovdiv 2,1 1,68 2, ,61 0,63 4,8 2 Razgrad 0,31 0,16 0, , Ruse 0,7 0,41 0, ,72 0, Shumen 0,31 0,16 0, , Silistra 0,31 0,16 0, , Sliven 0,59 0,28 0, ,61 0, Sofia 5,32 4,72 5, ,61 3,75 6,4 4 Stara Zagora 0,59 0,28 0, ,61 0, Targovishte 0,31 0,16 0, , Varna 1,76 1,26 1, ,5 1,36 0 2,3 2 Veliko Tarnovo 1,19 1,23 1, ,72 0,63 4,2 2 Vidin 0,43 0,3 0, ,72 0, Vraca 0,41 0,28 0, ,61 0, Yambol 0,41 0,28 0, ,61 0,
159 Switzerland (CH) fua name global score functional score functional score with industry population administration decision transport knowledge tourism industry Aarau 1,49 1,6 NA ,33 1,88 0 NA Basel 5,67 5,82 NA 5 5 7,5 4,36 5,21 6,6 NA Bern 4,68 5,05 NA 3 8 4,5 3,11 5,42 5,7 NA Biel 1,16 1,19 NA ,11 1,25 0 NA Chur 1,21 1,25 NA ,39 1,25 0 NA Fribourg 2,23 2,5 NA 1 4 0,5 2,89 3,75 2,1 NA Genève 5,74 6,13 NA 4 7 6,5 5,33 6,04 6,2 NA Lausanne 4,58 4,93 NA ,89 6,88 4,9 NA Locarno - Bellinzona 1,69 1,84 NA 1 0 0,5 3,11 1,88 2,8 NA Lugano 2,2 2,24 NA 2 0 0,5 3,11 1,88 4,6 NA Luzern 2,85 3,04 NA ,11 1,25 5,3 NA Neuchâtel 2,22 2,49 NA ,89 2,92 3,4 NA Olten - Zofingen 1,07 1,08 NA 1 0 0,5 3,11 1,25 0 NA Sankt-Gallen 2,16 2,19 NA ,11 3,75 0 NA Schaffhausen 1,34 1,41 NA ,11 1,25 0 NA Sion - Sierre 1,32 1,39 NA ,39 1,88 0 NA Solothurn 1,34 1,41 NA ,11 1,25 0 NA Thun 0,97 0,97 NA ,11 1,25 0 NA Vevey-Montreux 1,32 1,39 NA 1 0 1,5 2,89 1,88 0 NA Zürich 7,25 7,3 NA 7 4 8,5 6,33 8,54 7,5 NA Cyprus (CY) fua name global score functional score functional score with industry population administration decision transport knowledge tourism industry Larnaka 1,21 1,25 1, ,25 1, Lefkosia 2,95 2,94 2, ,71 1,5 0 Lemessos 1,89 1,86 1, ,5 0,5 1,
160 CZECH REPUBLIC (CZ) fua name global score functional score Functional score with industry population administration decision transport knowledge tourism industry Brno 3,79 3,52 3, ,5 2,39 5,63 5,8 2 Ceska Lipa 0,6 0,51 0, ,67 0, Ceske Budejovice 1,65 1,58 1, ,44 1,46 3,7 2 Cheb 0,98 0,98 0, ,67 0,63 2,1 0 Chomutov 0,91 0,67 1, ,39 0, Decin 0,91 0,67 1, ,39 0, Hradec Kralove 0,96 0,73 1, ,17 0, Jihlava 0,69 0,62 0, ,67 0, Karlovy Vary 1,55 1,44 1, ,67 0,63 3,7 2 Liberec 1,11 0,92 1, ,5 1,67 1, Mlada Boleslav 0,69 0,62 0, ,17 0, Most 0,73 0,67 0, ,39 0, Olomouc 1,42 1,29 1, ,39 0,63 2,3 2 Opava 1,03 0,81 1, ,39 1, Ostrava 2,66 2,14 2, ,39 3, Pardubice 1,1 0,9 1, ,92 0, Plzen 2,02 1,8 2, ,5 1,67 3,13 2,3 2 Praha 7,39 7,26 6, ,5 5,36 7, Prerov 0,73 0,67 0, ,39 0, Pribram 0,69 0,62 0, ,17 0, Prostejov 0,73 0,67 0, ,39 0, Tabor 0,94 0,93 0, ,44 0,63 2,1 0 Teplice 0,91 0,67 1, ,39 0, Trebic 0,6 0,51 0, ,67 0, Usti nad Labem 1,28 1,34 1, ,5 2,39 0, Zlin 1,04 0,83 1, ,89 0,63 0,7 2 Znojmo 0,73 0,67 0, ,39 0, Aachen 3,11 2,69 3, ,5 3,56 6,
161 Germany (DE) fua name global score functional score functional score with industry population administration decision transport knowledge tourism industry Altenburg 1,09 1,11 1, ,11 1, Amberg (Oberpfalz) 1,07 0,86 1, ,61 1, Ansbach 1,31 1,16 1, ,83 1, Arnsberg 1,17 1,21 1, ,06 1, Aue 0,88 0,86 1, ,61 1, Augsburg 2,91 2,45 3, ,11 5, Bad Hersfeld 1,08 1,1 1, ,06 1, Bad Kreuznach 1,04 1,05 1, ,83 1, Bad Oeynhausen 1,13 1,16 1, ,33 1, Baden-Baden 1,51 1,62 1, ,33 1,88 2,1 2 Bamberg 2,12 2,15 2, ,06 2,92 3,7 4 Bautzen 0,93 0,7 1, ,89 1, Bayreuth 2,35 2,42 2, ,83 4, Berlin 8,24 7,85 8, ,5 6,08 8, Bielefeld 3,14 2,73 3, ,5 3,56 5, Bocholt 1,17 1,21 1, ,56 1, Bochum-Herne 3,27 2,66 3, ,5 4,28 5, Bonn 4,85 4,81 4, ,78 6, Brandenburg 0,88 0,86 1, ,61 1, Braunschweig 1,76 1,48 2, ,28 1, Bremen 4,72 4,21 4, ,81 6,04 5,1 6 Bremerhaven 1,86 1,83 1, ,92 2,71 1,6 2 Celle 1,17 0,99 1, ,5 3,33 0, Chemnitz-Zwickau 2,91 2,44 3, ,5 3,11 6, Coburg 1,03 0,81 1, ,39 1, Cottbus 1,29 1,13 1, ,17 2, Cuxhaven 0,6 0,51 0, ,67 0, Darmstadt 3,63 3,33 3, ,78 7, Deggendorf 0,69 0,62 0, ,17 0, Dessau 1,16 0,97 1, ,61 1, Detmold 1,44 1,32 2, ,56 1, Dillenburg 1,17 1,21 1, ,56 1, Dormagen 1,21 1,26 1, ,78 1, Dortmund 4,3 3,7 4, ,5 5,28 6, Dresden 4,76 4,48 4, ,5 3,86 5,42 6,4 6 Duisburg 2,69 1,96 3, ,28 3, Düren 1,35 1,21 1, ,56 1, Düsseldorf 6,1 5,68 6, ,5 6,53 6,
162 Germany (DE) fua name global score functional score functional score with industry population administration decision transport knowledge tourism industry Erfurt 3,35 3,43 3, ,5 3,61 6,04 3,3 4 Essen-Oberhausen 3,21 2,59 3, ,5 4,28 1, Euskirchen 1,35 1,21 1, ,56 1, Flensburg 0,94 0,71 1, ,5 1,44 1, Frankfurt am Main 7,02 6,58 6, ,28 6,04 6,8 6 Frankfurt an der Oder 1,2 1,24 1, ,67 2, Freiburg im Breisgau 3,17 2,76 3, ,5 3,11 5,42 2,9 4 Fulda 1,44 1,32 1, ,5 3,56 1, Garmisch- Partenkirchen 1,38 1,46 1, ,89 1,88 2,8 2 Gelsenkirchen- Bottrop 2,39 1,59 2, ,28 1, Gera 1,18 1 1, ,61 1, Giessen 2,23 2,06 2, ,56 5, Goslar 1,73 1,9 1, ,56 1,88 2,1 2 Gotha 1,04 1,05 1, ,83 1, Greifswald 0,82 0, ,22 2, Gˆrlitz 0,89 0,65 1, ,67 1, Göttingen 3,09 3,11 3, ,28 7, Hagen 1,85 1,37 2, ,28 1, Halberstadt 0,88 0,86 1, ,61 1, Halle/Saale 1,7 1,41 1, ,11 1,25 0,5 2 Hamburg 7,69 7,39 7, ,5 7,83 8,54 7,4 8 Hameln 1,33 1,18 1, ,5 3,56 1, Hamm 1,35 1,21 2, ,56 1, Hannover 4,9 4,66 5, ,03 5, Heidelberg 3,94 3,93 3, ,56 7,71 4,4 4 Heidenheim 1,24 1,29 1, ,5 3,06 1, Heilbronn 1,57 1,25 1, ,56 2, Herford 1,17 1,21 1, ,56 1, Hildesheim 1,46 1,34 1, ,78 1, Hof 1,07 0,86 1, ,61 1, Hoyerswerda 0,71 0,65 0, ,67 1, Ibbenbüren 1,17 1,21 1, ,56 1, Ingolstadt 1,66 1,37 2, ,61 3, Iserlohn 1,39 1,26 2, ,78 1, Jena 1,79 1,74 1, ,61 5, Kaiserslautern 2,44 2,32 2, ,56 6, Karlsruhe 3,78 3,5 4, ,5 4,06 7, Kassel 2,91 2,44 3, ,5 3,78 5,
163 Germany (DE) fua name global score functional score functional score with industry population administration decision transport knowledge tourism industry Kempten (Allgau) 0,93 0,7 1, ,89 1, Kiel 2,45 2,1 2, ,5 2,39 4, Kleve 1,35 1,21 1, ,56 1, Koblenz 1,93 1,7 1, ,56 1,88 1,7 2 Konstanz 1,43 1,52 1, ,11 3, Krefeld 1,76 1,26 2, ,78 1, Köln 6,74 6,24 6, ,5 6,28 9,38 6,4 6 Landau (Pfalz) 1,08 1,1 1, ,06 1, Landshut 1,32 1,16 1, ,5 2,61 0, Leipzig 4,01 3, ,11 5, Limburg 1,35 1,21 1, ,5 3,06 1, Lingen 0,92 0,91 1, ,83 1, Lippstadt 1,35 1,21 2, ,56 1, Ludwigshafen am Rhein 1,81 1,32 2, ,5 3,56 1, Lübeck 2,2 2,02 2, ,86 1, Lüneburg 1,13 0,94 1, ,11 0, Magdeburg 2,94 2,93 2, ,11 4,58 3,5 2 Mainz 3,14 3,17 3, ,5 3,56 5, Mannheim 3,51 2,96 3, ,5 3,78 6, Marburg an der Lahn 2,11 2,13 2, ,56 6, Memmingen 1,22 1,27 2, ,83 1, Menden (Sauerland) 1,21 1,26 1, ,78 1, Minden 1,31 1,16 1, ,33 1, Mönchen-Gladbach 1,85 1,37 2, ,78 1,88 0,5 4 München 7,99 7,77 6, ,5 6,58 9, Münster 3,69 3,4 3, ,06 6,04 4,7 4 Naumburg 0,97 0,97 1, ,11 1, Neubrandenburg 0,74 0,46 0, ,44 0, Neumarkt 0,84 0,81 1, ,39 1, Neumünster 1,03 0,81 1, ,39 1, Neustadt an der Weinstrasse 1,26 1,32 1, ,56 1, Nordhausen 1 1 1, ,61 1, Nordhorn 0,92 0,91 1, ,83 1, Nürnberg-Fürth 4,94 4,48 5, ,03 6,04 5,1 6 Offenburg - Kehl 1,24 1,07 1, ,56 1, Oldenburg 1,56 1,24 1, ,5 3,33 1, Osnabrück 2,03 1,81 2, ,56 4, Paderborn 2,32 2,17 2, ,5 4,06 5,
164 Germany (DE) fua name global score functional score functional score with industry population administration decision transport knowledge tourism industry Passau 1,76 1,71 1, ,39 2, Peine 1,28 1,34 1, ,78 1, Pforzheim 1,53 1,21 1, ,56 1, Pirmasens 1,09 1,11 1, ,11 1, Plauen 1,18 1 1, ,61 1, Ravensburg 1,09 1,11 1, ,11 1, Regensburg 2,58 2,49 3, ,11 4, Remscheid 1,48 1,37 1, ,28 1, Reutlingen 1,27 1, ,11 1, Rheine 1,35 1,21 1, ,56 1, Rosenheim 1,27 1,11 1, ,11 1, Rostock 1,97 1,74 1, ,19 3,13 2,5 2 Rudolstadt 0,96 0,95 1, ,39 1, Saalfeld 0,96 0,95 1, ,39 1, Saarbrücken 3,41 2,84 3, ,5 4,06 5, Salzgitter 1,67 1,59 2, ,5 4,78 1, Schweinfurt 1,15 0,96 1, ,06 1, Schwerin 1,6 1,51 1, ,17 0, Schwäbisch Gmünd 1,31 1,16 1, ,33 1, Siegen 1,99 1,76 2, ,56 4, Solingen 1,48 1,37 1, ,28 1, Speyer 1,17 1,21 1, ,56 1, Stendal 0,8 0,76 0, ,17 1, Stralsund 0,5 0,39 0, ,11 0, Straubing 0,91 0,67 1, ,39 0, Stuttgart 5,73 5,01 6, ,5 6,28 6, Suhl 0,96 0,95 1, ,39 1, Trier 2,61 2,75 2, ,5 3,06 5,42 2,9 2 Tübingen 2,16 2,19 2, ,33 6, Ulm 2,87 2,84 3, ,5 3,56 5,21 2,5 4 Velbert-Heiligenhaus 1,3 1,37 1, ,28 1, Viersen 1,21 1,26 1, ,78 1, Villingen-Schwenningen 1,01 1,02 1, ,33 1, Weiden (Oberpfalz) 1,03 0,81 1, ,39 1, Wetzlar 1,35 1,21 1, ,56 1, Wiesbaden 3,08 2,88 3, ,56 1, Wilhelmshaven 1,16 0,98 1, ,14 1, Wismar 0,6 0,51 0, ,67 0,
165 Germany (DE) fua name global score functional score functional score with industry population administration decision transport knowledge tourism industry Wittenberg 0,84 0,81 1, ,39 1, Wolfsburg 1,67 1,38 2, ,33 1, Wüppertal 2,48 2,15 3, ,28 4, Würzburg 2,75 2,7 2, ,56 4,
166 Denmark (DK) fua name global score functional score functional score with industry population administration decision transport knowledge tourism industry Aabenraa 0,75 0,69 0, ,22 1, Aalborg 1,93 1,7 2, ,75 4, Aarhus 3,36 3,21 3, ,58 6, Esbjerg 0,91 0,66 1, ,11 1, Frederikshavn 0,61 0,53 0, ,5 1, Haderslev 0,75 0,69 0, ,22 1, Herning 0,63 0,55 0, ,61 1, Hjörring 0,61 0,53 0, ,5 1, Holbaek 0,91 0,66 1, ,11 1, Holstebro 0,63 0,55 0, ,61 1, Horsens 0,75 0,69 0, ,22 1, Kobenhavn 7,45 7,33 7,23 8 7,5 8,5 5,81 8,54 6,4 6 Kolding 1,02 0,8 1, ,72 1, Naestved 0,75 0,69 1, ,22 1, Nyköbing Falste 0,75 0,69 0, ,22 1, Odense 1,84 1,58 2, ,22 4,38 1,5 4 Randers 0,95 0,71 1, ,33 1, Silkeborg 0,77 0,71 0, ,33 1, Skive 0,61 0,53 0, ,5 1, Slagelse 0,73 0,66 1, ,11 1, Svendborg 0,75 0,69 1, ,22 1, Sönderborg 0,75 0,69 0, ,22 1, Vejle 1,02 0,8 1, ,22 1, Viborg 0,71 0,64 1, ,5 1,
167 Estonia (EE) fua name global score functional score functional score with industry population administration decision transport knowledge tourism industry Kohtla-Jarve 0,5 0,39 0, ,5 1, Narva 0,45 0,33 0, ,25 1, Pärnu 0,59 0,5 0, ,5 1, Tallinn 4,3 4,15 3, ,25 2,92 4,5 2 Tartu 1,23 1,06 1, ,5 3,
168 Spain (ES) fua name global score functional score functional score with industry population administration decision transport knowledge tourism industry Albacete 0,57 0,25 0, , Alcazar de San Juan 0,29 0,14 0, , Alcoy 0,54 0,44 0, ,33 0, Algeciras 1,01 0,78 1, ,83 0 0,7 4 Alicanta 2,37 1,79 2,93 5 1,5 0 3,33 3, Elche 1,29 0,92 1, ,83 2, Almeria 0,76 0,49 0, ,86 0, Alzira 0,72 0,44 1, ,33 0, Andujar 0,25 0,08 0, , Aranjuez 0,8 0,76 0, ,17 1, Arrecife 0,3 0,14 0, , Avila 0,38 0,25 0, , Aviles 0,52 0,2 0, ,25 0, Badajoz 0,95 0,72 1, ,25 2,5 0 2 Barcelona 7,35 6,76 7, ,5 6,17 6, Benidorm 0,72 0,44 1, ,33 0, Bilbao 3,98 3,53 4,29 6 1,5 4 3,83 5,21 2,1 6 Blanes 0,9 0,66 1, ,72 1, Burgos 1,55 1,45 1, ,72 0 5,3 4 Caceres 0,32 0,17 0, , Cadiz 1,26 0,65 1, ,58 0, Cartagena 0,57 0,25 1, , Castellon de la Plana 0,97 0,52 1, ,22 0, Ceuta 0,48 0,36 0, , Cieza 0,25 0,08 0, , Ciudad Real 0,38 0,25 0, , Cordoba 2,36 2 2, ,61 1,67 6,2 4 Denia 0,54 0,44 0, ,33 0, Don Benito 0,23 0,06 0, , Donostia-San Sebastian 1,98 1,54 2, ,83 1,88 2,7 6 Durango 0,77 0,71 0, ,33 1, Eibar 0,25 0,08 0, , El Ejido 0,25 0,08 0, , Elda 0,72 0,44 1, ,33 0, Ferrol 0,56 0,24 1, , Figueres 0,76 0,7 1, ,22 1,25 0,7 4 Gandia 0,86 0,6 1, ,08 0, Gijon 1,02 0,36 1, ,
169 Spain (ES) fua name global score functional score functional score with industry population administration decision transport knowledge tourism industry Girona 2,06 2,08 2, ,22 2,92 3,7 4 Granada 2,76 2,49 2, ,36 3, Guadalajara 0,38 0,25 0, , Huelva 0,66 0,36 1, , Ibiza 0,61 0,53 1, ,97 0 1,4 4 Igualada 0,8 0,76 0, ,17 1, Jaen 0,52 0,19 1, , Jerez de la Frontera 0,79 0,3 1, , La Coruna 1,59 1,06 1, ,58 1, La Orotava-Puerto de la Cruz 0,48 0,14 1, , La Vall d'uixo 0,43 0,3 0, ,72 0, Las Palmas de Gran Canarias 3,04 2,38 3,19 6 1, , Leon 0,74 0,46 1, ,75 0, Lerida 1,1 0,9 1, ,61 2, Linares 0,25 0,08 0, , Logrono 0,77 0,5 1, ,61 0, Lorca 0,25 0,08 0, , Lucena 0,29 0,14 0, , Lugo 0,59 0,28 0, , Madrid 8,53 8,2 8, ,5 9,5 4,92 8, Malaga 2,66 1,92 3, ,33 2,5 2,3 6 Manresa 1,03 1,04 0, , Marbella 0,63 0,55 1, ,08 0 1,4 4 Mataro 0,99 0,76 1, ,17 1, Melilla 0,59 0,5 0, , Merida 0,41 0,28 0, , Mondragon o Arrasate 0,86 0,82 1, ,83 1, Montilla 0,29 0,14 0, , Motril 0,25 0,08 0, , Murcia 1,18 1,22 1, ,5 2 4 Ontinyent 0,54 0,44 0, ,33 0, Orense 0,52 0,19 0, , Oviedo 1,93 1,47 2, ,5 1 3, Palencia 0,4 0,27 0, , Palma de Mallorca 3,15 2,96 3, ,72 2,5 6,1 4 Pamplona 1,93 1,47 2, ,86 3, Ponferrada 0,27 0,11 0, , Pontevedra 0,65 0,35 1, ,
170 Spain (ES) fua name global score functional score functional score with industry population administration decision transport knowledge tourism industry Puertollano 0,29 0,14 0, , Roquetas de Mar 0,25 0,08 0, , Salamanca 1,98 1,98 1, ,61 2,5 5,3 2 Sanlucar de Barramed 0,38 0,24 0, , Santa Cruz de Tenerife 1,78 1,29 2,12 4 1,5 0 2,75 2, Santa Lucia de Tirajana 0,3 0,14 0, , Santander 1,55 1,45 1, ,86 1, Santiago de Compostella 2,5 2,61 2, ,83 2,5 6,4 4 Segovia 1,28 1,34 1, ,72 0 4,8 2 Sevilla 4,48 3,7 4, ,5 2,08 4,17 6,4 6 Talavera de la Reina 0,29 0,14 0, , Tarragona 2,11 1,92 2, ,5 1,47 1,25 4,9 6 Toledo 1,35 1,42 1, ,61 0 4,8 2 Torrelavega 0,25 0,08 0, , Torrevieja 0,54 0,44 0, ,33 0, Ubeda 0,25 0,08 0, , Valencia 4,92 4,24 5, ,33 5,63 5,1 8 Valladolid 2,05 1,62 2, ,97 3, Vic 0,8 0,76 1, ,17 1, Vigo 1,56 1,02 2, ,08 2,5 0 6 Vilafranca del PenedËs 0,8 0,76 0, ,17 1, Vilagarcia de Arousa 0,38 0,24 0, , Vinaros 0,43 0,3 0, ,72 0, Vitoria-Gasteiz 1,18 1 1, ,61 1, Xativa 0,54 0,44 0, ,33 0, Zamora 0,4 0,27 0, , Zaragoza 2,56 1,8 3, ,97 3, Velez Malaga 0,97 0,96 0, , Orihuela 0,91 0 0, Utrera 0,92 0,91 1, ,
171 FINLAND (FI) fua name global score functional score functional score with industry population administration decision transport knowledge tourism industry Hameenlinna 0,66 0,58 0, ,25 1, Helsinki 7,32 7,17 7, ,97 9,38 6,4 8 Joensuu 1,13 1,16 1, ,25 3,75 0,7 2 Jyvaskyla 1,4 1,27 1, , Kajaani 0,5 0,39 0, , Kemi - Tornio 0,52 0,42 1, , Kokkola 0,66 0,58 0, ,25 1, Kotka 0,68 0,61 1, , Kouvola 0,45 0, ,25 1, Kuopio 1,06 1,07 1, ,92 1,4 4 Lahti 0,73 0,44 1, ,25 1, Lappeenranta 0,75 0,7 1, ,97 1, Mikkeli 0,55 0,44 0, ,25 1, Oulu 1,54 1,44 2, ,25 5,21 0,5 6 Pori 0,66 0,58 1, ,25 1, Rauma 0,61 0,53 0, ,5 1, Rovaniemi 1,04 1,05 1, ,25 1,88 2,1 2 Salo 0,52 0,42 1, , Seinajoki 0,61 0,53 0, , Tampere 2,34 1,97 2, ,5 6, Turku 1,96 1,73 2, ,25 6, Vaasa 1,01 1,01 1, ,5 0 3,
172 France (FR) fua name global score functional score functional score with industry population administration decision transport knowledge tourism industry Agen 0,7 0,64 NA ,11 1,25 0 NA Ajaccio 0,79 0,74 NA ,25 0 2,1 NA Albi 1,12 1,15 NA ,61 1,25 2,8 NA Alençon 0,8 0,76 NA ,67 1,25 0 NA Alès 0,8 0,76 NA ,17 1,25 0 NA Amiens 2,11 1,91 NA ,33 1,25 3 NA Angers 2,31 2,16 NA 3 1,5 0 2,89 2,08 4 NA Angoulême 0,88 0,64 NA ,11 1,25 0 NA Annecy 1,78 1,73 NA ,89 2,08 2,3 NA Annemasse 1,12 0,92 NA ,89 1,25 0 NA Arcachon 1,12 1,15 NA ,83 1,25 2,1 NA Arles 1,42 1,52 NA ,17 1,25 3,4 NA Armentières 1,19 1,23 NA ,28 1,25 0 NA Arras 1,53 1,65 NA ,56 1,25 2,1 NA Aurillac 0,73 0,66 NA ,61 1,88 0 NA Auxerre 0,84 0,81 NA ,89 1,25 0 NA Avignon 2,24 2,07 NA ,67 1,25 4,9 NA Bastia 0,36 0,22 NA ,5 0 0 NA Bayonne 1,26 1,09 NA ,36 1,25 2,3 NA Beauvais 1,45 1,55 NA ,11 1,25 2,1 NA Belfort 0,93 0,92 NA ,39 1,25 0 NA Bergerac 0,61 0,52 NA ,11 1,25 0 NA Besançon 1,48 1,36 NA ,39 1,25 1,5 NA Blois 1,19 1,23 NA ,67 1,25 2,1 NA Bordeaux 3,57 3,03 NA ,58 1,25 5,8 NA Boulogne-sur-Mer 1,24 1,07 NA ,56 1,25 0 NA Bourg-en-Bresse 0,93 0,92 NA ,39 1,25 0 NA Bourges 1,47 1,57 NA ,92 1,25 3,4 NA Brest 1,15 0,74 NA ,25 2,08 0 NA Brive-la-Gaillarde 0,5 0,39 NA ,11 0,63 0 NA Béthune 1,42 1,07 NA ,56 1,25 0 NA Béziers 0,99 0,76 NA ,17 1,25 0 NA Caen 2,46 2,34 NA ,67 3,75 4,1 NA Calais 1,33 1,18 NA ,06 1,25 0 NA Cambrai 1,19 1,23 NA ,28 1,25 0 NA Carcassonne 1,23 1,28 NA ,22 1,25 2,8 NA Chambéry 1,58 1,49 NA ,64 1,25 2,3 NA Charleville-Mézières 0,97 0,97 NA ,61 1,25 0 NA 172
173 France (FR) fua name global score functional score functional score with industry population administration decision transport knowledge tourism industry Chartres 1,16 0,97 NA ,61 1,25 0 NA Cherbourg 0,67 0,6 NA ,44 1,25 0 NA Cholet 0,93 0,92 NA ,89 1,25 0 NA Châlon-sur-Saône 1,12 0,92 NA ,89 1,25 0 NA Châlons-en- Champagne 1,07 1,08 NA ,61 1,25 0 NA Châteauroux 0,8 0,76 NA ,67 1,25 0 NA Châtelleraut 0,76 0,71 NA ,94 1,25 0 NA Clermont-Ferrand 2,72 2,43 NA 4 2 0,5 1,94 2,71 4,8 NA Cluses 0,93 0,92 NA ,89 1,25 0 NA Colmar 1,69 1,84 NA ,11 1,88 2,8 NA Compiègne 1,13 1,15 NA ,11 2,08 0 NA Creil 0,97 0,97 NA ,11 1,25 0 NA Dieppe 0,96 0,95 NA ,39 1,88 0 NA Dijon 2,26 2,1 NA ,39 1,25 4,8 NA Douai-Lens 2,05 1,4 NA ,03 1,25 0 NA Dreux 0,88 0,86 NA ,61 1,25 0 NA Dunkerque 1,73 1,45 NA ,28 1,25 0 NA Epinal 0,93 0,92 NA ,39 1,25 0 NA Evreux 0,96 0,95 NA ,89 1,88 0 NA Forbach - Saint-Avold 1,24 1,07 NA ,56 1,25 0 NA Fréjus 0,74 0,68 NA ,83 1,25 0 NA Grenoble 3,57 3,25 NA 5 1 1,5 2,89 6,25 3,5 NA Haguenau 1,22 1,26 NA ,81 1,88 0 NA La Roche-sur-Yon 0,7 0,64 NA ,11 1,25 0 NA La Rochelle 0,93 0,69 NA ,36 1,25 0 NA Laval 0,8 0,76 NA ,67 1,25 0 NA Le Creusot - Montceau-les-Mines 0,84 0,81 NA ,39 1,25 0 NA Le Havre 1,92 1,68 NA ,89 1,88 1,8 NA Le Mans 1,45 1,1 NA ,39 2,08 0 NA Le Puy-en-Velay 1,39 1,47 NA ,44 1,88 2,8 NA Lille 4 3,33 NA 7 2,25 2 5,03 2,92 3,9 NA Limoges 1,38 1,24 NA ,11 1,46 2 NA Lons-le-Saunier 0,89 0,87 NA ,17 1,25 0 NA Lorient 0,79 0,52 NA ,11 1,25 0 NA Lyon 5,54 4,99 NA 8 4 2,5 5,08 7,08 5,8 NA Macon 1,03 1,03 NA ,89 1,25 0 NA Marseille 4,11 3,47 NA ,42 2,08 5,1 NA Maubeuge 1,19 1,23 NA ,28 1,25 0 NA 173
174 France (FR) fua name global score functional score functional score with industry population administration decision transport knowledge tourism industry Metz 2,01 1,79 NA ,81 1,25 2 NA Monaco-Menton 1,31 1,38 NA ,17 1,25 2,8 NA Mont-de-Marsan 0,72 0,66 NA ,22 1,25 0 NA Montargis 0,88 0,86 NA ,61 1,25 0 NA Montauban 0,74 0,68 NA ,33 1,25 0 NA Montbéliard 1,03 0,81 NA ,39 1,25 0 NA Montluçon 0,79 0,74 NA ,44 1,88 0 NA Montpellier 2,74 2,46 NA ,67 2,92 4,5 NA Montélimar 0,8 0,76 NA ,17 1,25 0 NA Moulins 0,88 0,85 NA ,44 1,88 0 NA Mulhouse - Thann 2,13 1,94 NA ,36 1,88 2,5 NA Nancy 2,3 2,15 NA ,58 2,08 3,5 NA Nantes 3,4 2,82 NA ,69 2,92 5,1 NA Narbonne 0,63 0,55 NA ,22 1,25 0 NA Nevers 0,8 0,76 NA ,67 1,25 0 NA Nice 3,45 3,1 NA ,17 4,58 4,7 NA Niort 0,9 0,66 NA ,22 1,25 0 NA Nîmes 1,62 1,54 NA ,17 1,25 3 NA Orléans 2,13 1,93 NA ,61 2,08 3 NA Paris 9,57 9,47 NA 10 9,5 10 8,5 9,38 10 NA Pau 1,03 0,82 NA ,11 2,08 0 NA Perpignan 0,9 0,66 NA ,22 1,25 0 NA Poitiers 1,82 1,78 NA ,94 2,08 3 NA Périgueux 0,7 0,64 NA ,11 1,25 0 NA Quimper 1,15 1,19 NA 1 1 0,5 1 1,25 2,1 NA Reims 2,12 1,92 NA ,61 1,25 4,8 NA Rennes 2,85 2,37 NA ,42 3,75 3,5 NA Roanne 0,89 0,87 NA ,67 1,25 0 NA Rodez 0,61 0,52 NA ,61 1,25 0 NA Romans-sur-Isère 0,8 0,76 NA ,17 1,25 0 NA Rouen - Elboeuf 2,5 2,17 NA ,39 1,88 3,5 NA Saint-Brieuc 0,7 0,64 NA ,11 1,25 0 NA Saint-Dizier 0,84 0,81 NA ,39 1,25 0 NA Saint-Etienne 1,62 1,09 NA ,67 1,25 0,5 NA Saint-Malo 1,42 1,52 NA ,17 1,25 3,4 NA Saint-Nazaire 0,94 0,71 NA ,94 1,25 0 NA Saint-Omer 1,06 1,07 NA ,56 1,25 0 NA Saint-Quentin 0,92 0,91 NA ,83 1,25 0 NA Saintes 0,61 0,52 NA ,11 1,25 0 NA 174
175 France (FR) fua name global score functional score functional score with industry population administration decision transport knowledge tourism industry Salon-de-Provence 0,8 0,76 NA ,17 1,25 0 NA Sens 0,75 0,7 NA ,89 1,25 0 NA Soissons 0,92 0,91 NA ,83 1,25 0 NA Strasbourg 3,87 3,62 NA ,81 1,88 5,1 NA Sète 0,8 0,76 NA ,17 1,25 0 NA Tarbes 0,63 0,55 NA ,72 1,25 0 NA Thionville 1,24 1,07 NA ,56 1,25 0 NA Thonon-les-Bains 0,93 0,92 NA ,89 1,25 0 NA Toulon 1,62 0,87 NA ,83 2,08 0 NA Toulouse 3,6 3,06 NA 6 2 0,5 3,44 3,75 5,1 NA Tours 2,01 1,79 NA ,17 2,08 3,3 NA Troyes 1,53 1,43 NA ,39 1,25 2,3 NA Valence 1,08 0,87 NA ,17 1,25 0 NA Valenciennes 1,57 1,26 NA 3 0,25 0 4,28 1,25 0 NA Vannes 1,08 1,1 NA ,11 1,25 2,1 NA Vichy 0,79 0,74 NA ,44 1,88 0 NA Vienne 0,93 0,92 NA ,89 1,25 0 NA Villefranche-sur- Saône 1,01 1,02 NA ,33 1,25 0 NA 175
176 Greece (GR) fua name global score functional score functional score with industry population administration decision transport knowledge tourism industry Agrinion 0,23 0,06 0, , Alexandroupolis 0,23 0,06 0, , Athinai 7,69 7,4 7, ,06 6,25 9,5 8 Drama 0,23 0,06 0, , Ioannina 0,47 0,35 0, ,25 0, Iraklion 1,27 1,1 1,38 2 1,5 0 0,25 1,67 2,3 2 Kalamata 0,2 0,02 0, , Katerini 0,23 0,06 0, , Kavalla 0,23 0,06 0, , Khalkis 0,25 0,08 0, , Khania 0,18 0 0, Komotini 0,47 0,35 0, ,25 0, Kozani 0,32 0,17 0, , Lamia 0,34 0,19 0, , Larisa 0,5 0,17 0, , Patrai 0,91 0,67 1, ,86 1, Rhodos 1,24 1,29 1, ,5 0 4,8 2 Serrai 0,25 0,08 0, , Thessaloniki 2,69 1,73 2, ,47 3, Trikala 0,23 0,06 0, , Volos 0,27 0,11 0, , Xanthi 0,23 0,06 1, ,
177 Hungary (HU) fua name global score functional score functional score with industry population administration decision transport knowledge tourism industry Ajka 0,52 0,41 0, ,22 0, Baja 0,52 0,41 0, ,22 0, Bekescsaba 0,7 0,41 0, ,72 0, Budapest 7,61 7,3 7, ,5 5,11 8, Cegled 0,76 0,71 0, ,94 1, Debrecen 0,99 0,55 1, ,72 1, Dunaujvaros 0,56 0,46 0, ,44 0, Eger 0,72 0,66 0, ,22 1, Esztergom 0,64 0,56 0, ,89 0, Gyöngyös 0,63 0,55 0, ,22 1, Györ 0,87 0,62 1, ,67 0, Hajduboszormeny 0,54 0,44 0, ,72 1, Hatvan 0,63 0,55 0, ,22 1, Hodmezovasarhely 0,43 0,3 0, ,72 0, Jaszbereny 0,63 0,55 0, ,22 1, Kaposvar 0,81 0, ,72 1, Karcag 0,63 0,55 0, ,22 1, Kazincbarcika 0,63 0,55 0, ,22 1, Kecskemet 0,79 0,52 0, ,22 0, Kiskunfelegyhaza 0,52 0,41 0, ,22 0, Mako 0,43 0,3 0, ,72 0, Miskolc 1,6 1,29 1, ,22 2, Mohacs 0,5 0,39 0, ,5 1, Mosonmagyarovar 0,6 0,51 0, ,67 0, Nagykanizsa 0,52 0,41 0, ,22 0, Nyiregyhaza 1,09 0,88 1, ,5 0,72 1, Oroshaza 0,43 0,3 0, ,72 0, Ozd 0,63 0,55 0, ,22 1, Paks 0,52 0,41 0, ,61 1, Papa 0,52 0,41 0, ,22 0, Pecs 1,59 1,5 1, ,5 1,25 4,5 2 Salgotarjan 0,72 0,66 0, ,22 1, Sopron 1,11 1,13 1, ,67 0,63 2,8 2 Szeged 1,15 0,97 1, ,72 3, Szekesféhervar 0,83 0,57 1, ,44 0, Szekszard 0,61 0,52 0, ,61 1, Szolnok 0,72 0,66 0, ,22 1, Szombathely 0,61 0,52 0, ,22 0,
178 Hungary (HU) fua name global score functional score functional score with industry population administration decision transport knowledge tourism industry Tatabanya 0,73 0,67 0, ,89 0, Veszprem 0,61 0,52 0, ,22 0, Zalaegerszeg 0,61 0,52 0, ,22 0, Ireland (IE) fua name global score functional score functional score with industry population administration decision transport knowledge tourism industry Cork 3,12 3,15 3, ,58 5,1 6 Dublin 7,13 6,94 7,26 8 7,5 8,5 5,3 1 6,25 7,4 8 Dundalk 0,43 0,31 0, ,2 5 0, Galway 1,6 1,51 1, ,5 0,5 2, Limerick 2,64 2,56 3, ,7 5 3,75 4,5 6 Tralee 0,55 0,44 0, ,2 5 1, Waterford 0,59 0,5 0, ,5 0,5 1,
179 Italy (IT) fua name global score functional score functional score with industry population administration decision transport knowledge tourism industry Adrano 0,61 0,52 0, ,08 1, Agrigento 1,38 1,25 1, ,86 1, Alba 0,71 0,65 0, ,67 1, Alcamo 0,54 0,44 0, ,72 1, Alessandria 1,34 1,19 2, ,5 3,11 1, Altamura 0,56 0,46 0, ,44 0, Ancona 1,53 1,43 2, ,5 3,17 1,25 0,5 6 Andria 0,56 0,46 0, ,44 0, Aosta 1,19 1,23 1, ,89 1,25 1,4 2 Arezzo 1,35 1,43 1, ,89 1,25 2,8 4 Arzignano 0,88 0,86 1, ,61 1, Ascoli Piceno 0,85 0,82 1, ,94 1, Asti 1,25 1,08 1, ,11 1, Avellino 0,96 0,73 1, ,17 0, Aversa 1 0,78 1, ,89 0, Avezzano 0,58 0,49 0, ,94 1, Avola - Noto 0,59 0,49 0, ,97 1, Bagheria 0,61 0,52 0, ,08 1, Barcellona Pozzo di Gotto 0,61 0,52 0, ,08 1, Bari 2,6 2,07 3, ,19 3, Barletta 0,74 0,46 1, ,44 0, Bassano del Grappa 1,07 0,86 1, ,61 1, Belluno 0,8 0,76 1, ,67 1, Benevento 0,96 0,73 1, ,17 0, Bergamo 2,04 1,38 2, ,5 3,33 1, Biella 1,16 0,97 1, ,61 1, Bisceglie 0,74 0,46 1, ,44 0, Bologna 4,3 4,14 4, ,5 4,61 5,42 5,1 6 Bolzano 1,29 1,14 2, ,89 0,63 1,6 6 Borgomanero 0,97 0,97 1, ,11 1, Bra 0,86 0,83 0, ,67 2, Brescia 1,82 1,33 2, ,5 3,11 1, Brindisi 0,9 0,66 1, ,83 0, Cagliari 2,05 1,61 2, ,47 2,29 1,5 4 Caltagirone 0,61 0,52 0, ,08 1, Caltanisetta 0,57 0,47 0, ,36 1, Campobasso 0,65 0,57 0, ,94 0, Canicatti 0,57 0,47 0, ,86 1,
180 Italy (IT) fua name global score functional score functional score with industry population administration decision transport knowledge tourism industry Carpi 0,97 0,97 1, ,11 1, Casale Monferrato 0,97 0,97 1, ,11 1, Casarano 0,52 0,41 0, ,22 0, Caserta 1,79 1,29 2, ,89 0,63 1,8 6 Cassino 0,99 0,76 1, ,17 1, Catania 2,6 1,84 2, ,58 2,92 2,3 4 Catanzaro 0,86 0,61 1, ,5 1, Cecina 0,84 0,81 0, ,39 1, Cento 0,84 0,81 0, ,39 1, Cerignola 0,52 0,41 0, ,22 0, Cesena 0,89 0,86 1,37 1 0,5 0 2,39 1, Chiavari 0,84 0,81 1, ,39 1, Cittadella- Castelfranco Veneto 1,03 0,81 1, ,39 1, Civitanova Marche 0,63 0,55 0, ,22 1, Civitavecchia 1,02 1,02 1, ,36 1, Colleferro 0,97 0,97 0, ,11 1, Corato 0,56 0,46 0, ,44 0, Corigliano Calabrese 0,54 0,44 0, ,72 1, Cosenza 0,96 0,73 1, ,72 2, Crema 1 1 1, ,61 1, Cremona 1,09 1,11 1, ,61 1, Crotone 0,55 0,44 0, ,25 1, Cuneo 1,03 0,82 1, ,92 1, Empoli 0,93 0,92 1, ,5 2,39 1, Fabriano 0,8 0,76 0, ,17 1, Faenza 0,84 0,81 1, ,39 1, Fano 0,82 0, ,44 2, Fasano 0,54 0,44 0, ,33 0, Fermo 0,76 0,71 0, ,94 1, Ferrara 1,81 1,77 2, ,39 2, Fidenza 0,97 0,97 1, ,11 1, Firenze 4,49 4,16 4, ,89 5,42 7,4 6 Foggia 0,79 0,52 1, ,22 0, Foligno 0,67 0,6 0, ,44 1, Forli 1,12 0,92 1,56 2 0,5 0 2,64 1, Formia-Gaeta 0,76 0,71 0, ,94 1, Fossano 0,71 0,65 0, ,67 1, Frosinone 1,08 0,87 1, ,17 1,
181 Italy (IT) fua name global score functional score functional score with industry population administration decision transport knowledge tourism industry Galatina 0,52 0,41 0, ,22 0, Gela 0,52 0,41 0, ,61 1, Genova 4,16 3,75 4, ,39 4,58 3,9 6 Ginosa 0,54 0,44 1, ,33 0, Gioia del Colle 0,56 0,46 0, ,44 0, Gorizia 0,89 0,87 1, ,17 1, Grosseto 0,72 0,66 0, ,22 1, Iglesias 0,43 0,3 0, ,72 0, Imola 0,97 0,97 1, ,11 1, Imperia 1,11 1,13 1, ,67 2, Isernia 0,56 0,46 0, ,94 0, Ivrea 0,93 0,92 1, ,89 1, Jesi 0,8 0,76 0, ,17 1, La Spezia 1,21 1,03 1, ,89 1, Lamezia Terme 0,5 0,39 0, ,5 1, Latina 1,22 0,82 1, ,94 1, Lecce 0,94 0,71 1, ,22 1, Lecco 1,54 1,22 2, ,11 1, Legnago 0,97 0,97 1, ,11 1, Lentini 0,59 0,49 0, ,97 1, Livorno 1,34 1,2 1, ,64 1, L Aquila 1 1 1, ,94 2,08 0,5 2 Lodi 1,45 1,33 1, ,5 3,11 1, Lucca 1,79 1,74 2, ,39 1,25 3,7 4 Lugo 1,03 0,81 1, ,39 1, Lumezzane 1,09 1,11 1, ,11 1, Macerata 0,72 0,66 1, ,22 1, Manduria 0,54 0,44 0, ,33 0, Manfredonia 0,52 0,41 0, ,22 0, Mantova 1,27 1, ,61 1, Marsala 0,72 0,44 0, ,72 1, Massa-Carrara 1,03 0,81 1, ,89 1, Matera 0,52 0,41 0, ,72 0, Merano 0,64 0,56 0, ,89 0, Messina 1,06 0,63 1, ,08 1, Milano Busto Arsizio Como 7,65 7,13 8, ,5 6,81 6,88 7,4 10 Milazzo 0,7 0,63 0, ,58 1, Mirandola 0,97 0,97 0, ,11 1,
182 Italy (IT) fua name global score functional score functional score with industry population administration decision transport knowledge tourism industry Modena 1,82 1,56 2, ,5 3,11 2, Modica 0,47 0,36 0, ,36 1, Mondovi 0,71 0,65 0, ,67 1, Monfalcone 0,99 0,76 1, ,17 1, Monopoli 0,56 0,46 0, ,44 0, Montebelluna 0,84 0,81 1, ,39 1, Montecatini-Terme 0,84 0,81 1, ,39 1, Montevarchi 0,75 0,7 0, ,89 1, Napoli - Castellamare di Stabia-Torre Annunziata - Nola 4,94 4,04 5, ,14 3,13 6,4 6 Nocera Inferiore 0,87 0,62 1, ,17 0, Novara 1,25 1,08 1, ,11 1, Novi Ligure 0,97 0,97 1, ,11 1, Nuoro 0,39 0,25 0, , Olbia 0,43 0,31 0, ,75 0, Oristano 0,39 0,25 0, , Padova 3,14 2,73 3, ,39 4,58 3,8 6 Palermo 3,53 2,98 3, ,58 3,75 5,1 4 Parma 2,02 1,8 2,63 3 1,5 0,5 3,11 3, Pavia 1,82 1,78 2, ,11 4, Perugia 2,05 2,06 2, ,44 2,92 3,9 6 Pesaro 0,76 0,71 1, ,44 1, Pescara 1,58 1,26 1, ,42 1,25 1,5 4 Piacenza 1,25 1,08 1, ,11 1, Pinerolo 0,93 0,92 1, ,89 1, Piombino 0,89 0,86 1, ,64 1, Pisa 2,89 3,09 3, ,39 5,42 4,6 4 Pistoia 0,93 0,92 1, ,39 1, Poggibonsi 0,71 0,65 0, ,67 1, Pontedera 0,84 0,81 1, ,39 1, Pordenone 0,99 0,76 1, ,67 1, Portogruaro 0,84 0,81 1, ,39 1, Potenza 0,79 0,52 1, ,72 0, Prato 1,12 0,92 1, ,39 1, Putignano 0,56 0,46 0, ,44 0, Ragusa 0,57 0,47 0, ,36 1, Rapallo 1,23 1,28 1, ,39 1,25 2,1 0 Ravenna 2,13 2,16 2, ,39 1,25 4,
183 Italy (IT) fua name global score functional score functional score with industry population administration decision transport knowledge tourism industry Reggio di Calabria 1,33 1,18 1, ,08 1,25 0,5 2 Reggio nell Emilia 1,43 1,08 2, ,11 1, Rieti 0,67 0,6 0, ,94 1, Rimini 1,53 1,43 1, ,39 1,25 2,3 4 Roma 8,52 8,41 8, ,11 8, Rosetto degli Abruzzi - Giulianova 0,67 0,6 0, ,44 1, Rovereto 0,75 0,7 0, ,89 1, Rovigo 0,89 0,87 1, ,17 1, Salerno 1,95 1,72 2, ,42 3,13 1,7 6 San Benedetto del Tronto 0,76 0,71 0, ,94 1, San Dona di Piave 0,84 0,81 1, ,39 1, San Remo-Ventimiglia 1,09 1,12 1, ,67 1,25 2,1 2 San Severo 0,52 0,41 0, ,22 0, Sarno 0,69 0,62 0, ,17 0, Sassari 0,91 0,66 1, ,5 0,25 0,63 1,1 4 Sassuolo 1,16 0,97 1, ,11 1, Savona 1,07 1,09 1, ,14 1, Schio 0,88 0,86 1, ,61 1, Senigallia 0,8 0,76 0, ,17 1, Sessa Aurunca 0,82 0,78 0, ,89 0, Siena 2,11 2,36 2, ,5 1,67 3,75 4,2 4 Siracusa 1,67 1,59 2, ,72 1,25 3,7 4 Sora 0,8 0,76 0, ,17 1, Sorrento 1,2 1,25 1, ,89 0,63 2,1 2 Sulmona 0,58 0,49 0, ,94 1, Taranto 1,31 0,94 1, ,58 0,63 0,5 4 Teramo 0,76 0,71 1, ,44 1, Termini Imerese 0,61 0,52 0, ,08 1, Termoli 0,47 0,35 0, ,94 0, Terni 0,89 0,65 1, ,17 1, Thiene 0,88 0,86 1, ,61 1, Torino 5,57 5,03 5,94 8 2,5 6,5 4,14 6,25 4,5 8 Tortona 0,97 0,97 1, ,11 1, Trapani 0,86 0,6 1, ,97 1, Trento 2,27 2,33 2, ,89 4, Treviso 1,3 0,92 2, ,39 1, Trieste 2,18 2,22 2, ,5 3,42 2,
184 Italy (IT) fua name global score functional score functional score with industry population administration decision transport knowledge tourism industry Udine 1,58 1,26 2, ,44 3, Varese 1,4 1,27 1, ,33 1, Vasto 0,8 0,76 0, ,17 1, Velletri 0,97 0,97 1, ,11 1, Venezia 4,43 4,31 4, ,5 5,14 3, Verbania 0,88 0,86 1, ,11 1, Vercelli 1,07 1,08 1, ,11 1, Verona 3,51 3,18 3, ,11 2,92 5,8 6 Viareggio 0,84 0,81 1, ,39 1, Vibo Valentia 0,59 0,5 0, ,5 1, Vicenza 2,07 1,86 2, ,61 1, Viterbo 0,94 0,71 1, ,44 1, Vittoria 0,47 0,36 0, ,36 1, Vittorio Veneto- Conegliano 1,03 0,81 1, ,39 1, Voghera 1,09 1,11 1, ,11 1, Lithuania (LT) fua name global score functional score functional score with industry population administration decision transport knowledge tourism industry Alytus 0,5 0,39 0, ,61 0, Kaunas 1,89 1,2 1, ,61 2, Klaipeda 1,3 0,92 1, ,5 1,5 0, Panevezys 0,45 0,33 0, ,36 0, Sialiai 0,63 0,33 0, ,36 0, Vilnius 4,26 3,87 3, ,5 3,13 3,
185 Luxembourg (LU) fua name global score functional score functional score with industry population administration decision transport knowledge tourism industry Luxembourg 5,05 5,29 5,2 4 8,5 8 4,56 1,88 5,1 6 Latvia (LV) fua name global score functional score functional score with industry population administration decision transport knowledge tourism industry Daugavpils 0,61 0,31 0, ,25 0, Jelgava 0,43 0,31 0, ,25 0, Liepaja 0,43 0,31 0, ,25 0, Rezekne 0,43 0,31 0, ,25 0, Riga 4,88 4,41 4, ,97 2,29 5,1 2 Ventspils 0,75 0,7 0, , Malta (MT) fua name global score functional score functional score with industry population administration decision transport knowledge tourism industry Valletta 3,42 3,29 3, ,25 1,25 5,
186 The Netherlands (NL) fua name global score functional score functional score with industry population administration decision transport knowledge tourism industry Alkmaar 1,75 1,7 1, ,33 2,71 1,6 2 Almelo 1,2 1,02 1, ,33 1, Almere 1,31 1,16 1, ,33 1, Amersfoort 1,76 1,48 1, ,5 4,28 1, Amsterdam 8,13 8,15 7,8 8 3,5 9,5 8,06 9, Appeldoorn 1,39 1,25 2, ,56 2, Arnhem 2,05 1,84 2, ,78 1,88 1,1 4 Assen 0,93 0,92 1, ,39 1, Bergen op Zoom 1,06 1,07 1, ,56 1, Breda 1,51 1,18 2, ,5 3,56 1, Delft 2,87 3,07 2, ,06 6,04 3,7 0 Den Bosch 1,69 1,4 2, ,56 1, Den Haag 4,96 4,73 4, ,5 4,06 2,71 4,5 4 Den Helder 1,09 1,11 1, ,11 1, Deventer 1,2 1,02 1, ,33 1, Dordrecht 1,94 1,48 2, ,5 4,28 1, Ede 1,81 1,55 2, ,5 3,56 2, Eindhoven 2,77 2,5 3, ,5 3,81 5,42 0,5 6 Emmen 1,07 0,86 1, ,61 1, Enschede - Hengelo 2,32 1,94 2, ,33 5, Geleen 1,1 1,12 1, ,78 1, Gouda 1,44 1,32 1, ,06 1, Groningen 2,3 2,14 2, ,11 6, Haarlem 2,04 2,05 2, ,5 3,33 1, Heerlen 1,7 1,41 2, ,5 3,78 2, Helmond 1,24 1,07 1, ,56 1, Hilversum 1,44 1,32 1, ,06 1, Hoogeveen 0,92 0,91 0, ,83 1, Leeuwaarden 1,32 1,17 1, ,89 1, Leiden 2,65 2,36 2, ,5 4,06 6, Lelystad 1,22 1,27 1, ,33 1, Maastricht 1,82 1,78 2, ,78 3, Middelburg-Vlissingen 1,38 1,24 1, ,83 1, Nijmegen 2,18 2 2, ,78 5, Oss 1,66 1,81 1, ,56 4, Roosendaal 1,06 1,07 1, ,56 1, Rotterdam 5,73 5,22 6, ,5 6,81 4,38 5,8 8 Smallingerland 0,92 0,91 0, ,83 1,
187 The Netherlands (NL) fua name global score functional score functional score with industry population administration decision transport knowledge tourism industry Tilburg 1,97 1,74 2, ,5 3,56 3, Utrecht 5,11 5,14 5, ,28 8,54 4,8 6 Velsen 1,45 1,32 1, ,08 1, Venlo 1,24 1,07 1, ,56 1, Zwolle 1,29 1,13 1, ,33 1, Norway (NO) fua name global score functional score functional score with industry population administration decision transport knowledge tourism industry Alesund 0,52 0,42 0, , Arendal 0,66 0,58 0, ,25 1, Bergen 3,61 3,74 3, ,5 2,25 6,88 5,7 6 Drammen 0,8 0,53 0, , Frederikstad 0,75 0,47 0, ,25 1, Gjovik 0,52 0,42 0, , Hamar 0,61 0,53 0, , Haugesund 0,66 0,58 1, ,75 1, Kristiansand 1,05 1,06 1, ,75 3, Larvik 0,57 0,47 0, ,25 1, Molde 0,61 0,53 0, , Moss 0,66 0,58 0, ,25 1, Oslo 6,73 6,68 6, ,5 3,72 7,92 6,4 6 Skien 0,57 0,47 0, ,25 1, Stavanger 1,52 1,2 1, , Tonsberg 0,71 0,64 0, ,5 1, Tromsö 1,4 1,49 1, , Trondheim 1,78 1,73 2, ,25 6,
188 Poland (PL) fua name global score functional score functional score with industry population administration decision transport knowledge tourism industry Belchatow 0,6 0,51 0, ,67 0, Biala Podlaska 0,61 0,52 0, ,11 1, Bialystok 1,13 0,5 1, ,61 0,63 0,5 2 Bielawa - Dzierzoniow 0,69 0,62 0, ,17 0, Bielsko-Biala 1,15 0,51 1, ,67 0, Boleslawiec 0,69 0,62 0, ,17 0, Brzeg 0,52 0,41 0, ,22 0, Bydgoszcz 1,4 0,83 1,8 4 0,5 0 1,22 1, Chelm 0,52 0,41 0, ,61 1, Chojnice 0,5 0,39 0, ,11 0, Ciechanow 0,63 0,55 0, ,22 1, Cieszyn 0,8 0,76 0, ,17 1, Czestochowa 1,42 0,85 1, ,67 1,25 0,9 4 Debica 0,69 0,62 0, ,17 0, Elblag 0,59 0,28 0, ,61 0, Elk 0,63 0,55 0, ,22 1, Gdansk 3,95 3,49 4, ,5 3,33 4,58 5,8 6 Glogow 0,41 0,28 0, ,61 0, Gniezno 0,41 0,28 0, ,61 0, Gorzow Wielkopolski 0,63 0,33 1,15 2 0,5 0 1, Grudziadz 0,63 0,55 0, ,22 1, Inowroclaw 0,5 0,39 0, ,11 0, Jaroslaw 0,52 0,41 0, ,22 0, Jaslo 0,52 0,41 0, ,22 0, Jelenia Gora 1,06 0,85 1, ,44 1,88 0,5 2 Kalisz 0,7 0,41 0, ,22 0, Katowice 2,98 1,64 3, ,14 0,63 1,1 6 Kiedzierzyn-Kozle 0,52 0,41 0, ,22 0, Kielce 1,24 0,84 1, ,17 0,63 0,5 2 Kolobrzeg 0,71 0,65 0, ,67 1, Konin 0,81 0, ,22 1, Koszalin 0,68 0,39 0, ,11 0, Krakow 4,33 3,74 4, ,14 4, Krosno 0,5 0,39 0, ,11 0, Kutno 0,56 0,46 0, ,44 0, Legnica 0,74 0,46 0, ,44 0, Leszno 0,5 0,39 0, ,11 0, Lodz 2,56 1,58 3, ,5 2,17 2,
189 Lomza 0,43 0,3 0, ,72 0, Lubin 0,41 0,28 0, ,61 0, Poland (PL) fua name global score functional score functional score with industry population administration decision transport knowledge tourism industry Lublin 1,78 1,29 2, ,22 2, Mielec 0,69 0,62 0, ,17 0, Nowa Sol 0,73 0,67 0, ,39 0, Nowy Sacz 0,85 0,6 1, ,44 1, Nowy Targ 0,44 0,32 0, , Nysa 0,52 0,41 0, ,22 0, Olsztyn 1,04 0,83 1, ,61 0, Opole 0,9 0,43 1, , Ostroleka 0,4 0,27 0, , Ostrow Wielkopolski 0,61 0,3 0, ,72 0, Ostrowiec Swietokrzyski 0,62 0,53 0, , Pila 0,68 0,39 0, ,11 0, Piotrkow Trybunalski 0,67 0,6 0, ,44 1, Plock 0,68 0,38 0, ,5 1, Poznan 2,93 2,25 3, ,5 2,19 2, Przemysl 0,5 0,39 0, ,11 0, Pulawy 0,4 0,27 0, , Raciborz 0,67 0,6 0, ,44 1, Radom 0,88 0,41 1, ,22 0, Radomsko 0,6 0,51 0, ,67 0, Rybnik 1,15 0,51 1, ,67 0, Rzeszow 0,95 0,49 1, ,22 0 0,5 2 Sandomierz 0,62 0,53 0, , Sanok 0,63 0,55 0, ,22 1, Siedlce 0,4 0,27 0, , Sieradz 0,56 0,46 0, ,44 0, Skarzysko-Kamienna 0,62 0,53 0, , Skierniewice 0,67 0,6 0, ,44 1, Slupsk 0,68 0,39 0, ,11 0, Stalowa Wola 0,87 0,62 0, ,17 0, Starachowice 0,62 0,53 0, , Stargard Szczecinski 0,74 0,68 0, ,83 1, Starogard Gdanski 0,36 0,22 0, ,36 0, Suwalki 0,41 0,28 0, ,61 0, Swidnica 0,69 0,62 0, ,17 0, Szczecin 2,05 1,4 2, ,72 2,
190 Poland (PL) fua name global score functional score functional score with industry population administration decision transport knowledge tourism industry Tarnobrzeg 0,69 0,62 0, ,17 0, Tarnow 0,99 0,55 1, ,22 1, Tczew 0,36 0,22 0, ,36 0, Tomaszow Mazowiecki 0,6 0,51 0, ,67 0, Torun 1,13 0,94 1,57 2 0,5 0 1,22 1,25 1,5 4 Walbrzych 0,97 0,74 1, ,44 1, Warszawa 6,92 6,46 7,09 9 8,5 7 4,14 6, Wloclawek 0,81 0, ,22 1, Wroclaw 3,21 2,6 3, ,39 4, Zamosc 0,52 0,41 0, ,61 1, Zary 0,73 0,67 0, ,39 0, Zdunska Wola 0,56 0,46 0, ,44 0, Zielona Gora 0,67 0,38 0,88 2 0,5 0 1,
191 Portugal (PT) fua name global score functional score functional score with industry population administration decision transport knowledge tourism industry Aveiro 0,91 0,88 1, ,19 2, Barcelos 0,49 0,38 1, ,08 0, Braga 1,31 1,16 1, ,08 3,13 0,5 4 Coimbra 2,17 2,21 2, ,5 0,69 3,96 4,3 2 Faro 1,1 0,9 1, ,25 0 2,3 2 Funchal 1,36 1,22 1, , Guimaraes 0,67 0,38 1, ,08 0, Leiria - Marinha Grande 0,36 0,22 0, , Lisboa 7,36 7 7, ,81 6, Ponta Delgada 0,45 0,33 0, , Porto 4,57 3,8 4, ,56 3,96 5,1 6 Rebordosa - Pacos de Ferreira - Freamunde 0,67 0,38 1, ,08 0, Santa Maria de Feira 0,69 0,4 1, ,19 0, Santo Tirso 0,49 0,38 1, ,08 0, Vila Nova de Famalicao 0,25 0,08 0, , Viseu 0,36 0,22 0, , Paredes-Penafiel 0,69 0,4 1, , Ovar 0,66 0,59 1, ,19 1,
192 Romania (RO) fua name global score functional score functional score with industry population administration decision transport knowledge tourism industry Alba Iulia 0,38 0,25 0, , Alexandria 0,4 0,27 0, , Arad 0,69 0,4 0, ,61 0 0,7 2 Bacau 0,61 0,3 1, , Baia Mare 0,57 0,25 0, , Birlad 0,29 0,14 0, , Bistrita 0,38 0,25 0, , Botosani 0,57 0,25 0, , Braila 0,66 0,36 0, , Brasov 2 1, ,5 0,72 0 5,3 2 Bucuresti 5,53 4,76 5, ,5 3,67 0,83 6,4 6 Buzau 0,59 0,27 0, , Calarasi 0,4 0,27 0, , Cluj-Napoca 1,77 1,28 2, ,86 0 4,4 4 Constanta 2,14 1,72 2, ,86 0 4,4 4 Craiova 0,93 0,25 1, , Deva 0,38 0,25 0, , Drobeta - Turnu Severin 0,38 0,25 0, , Focsani 0,4 0,27 0, , Galati 1,15 0,52 1, ,5 1, Giurgiu 0,4 0,27 0, , Hunedoara 0,29 0,14 0, , Iasi 1,7 1,18 2, ,33 0 3,5 4 Medias 0,29 0,14 0, , Onesti 0,29 0,14 0, , Oradea 1,05 0,84 1, ,97 0 2,3 2 Petroseni 0,29 0,14 0, , Piatra Neamt 0,38 0,25 0, , Pitesti 0,59 0,27 0, , Ploiesti 0,81 0,54 0, ,5 1, Resita 0,36 0,22 0, , Rimnicu Vilcea 0,4 0,27 0, , Roman 0,29 0,14 0, , Satu Mare 0,57 0,25 0, , Sfintu Gheorghe 0,4 0,27 0, , Sibiu 1,11 0,91 1, , Slatina 0,4 0,27 0, , Slobozia 0,4 0,27 0, ,
193 Romania (RO) fua name global score functional score functional score with industry population administration decision transport knowledge tourism industry Suceava 0,77 0,71 0, ,61 0 2,1 2 Timisoara 1,57 1,03 1, ,5 1,25 0 2,4 4 Tirgoviste 0,53 0,43 0, , Tirgu Jiu 0,38 0,25 0, , Tirgu Mures 0,57 0,25 0, , Tulcea 0,32 0,17 0, , Turda 0,29 0,14 0, , Vaslui 0,38 0,25 0, , Vulcan 0,29 0,14 0, , Zalau 0,38 0,25 0, ,
194 Sweden (SE) fua name global score functional score functional score with industry population administration decision transport knowledge tourism industry Boraas 1,06 0,85 1, ,5 3, Eskilstuna 0,59 0,5 1, ,36 1, Falun 0,95 0,71 1, , Gävle 0,84 0,58 1, ,25 1, Göteborg 4,86 4,61 5, ,25 7,5 4,5 8 Halmstad 0,84 0,8 1, ,61 2,5 0 4 Jönköping 1,07 0,86 1, ,5 1, Kalmar 1,18 1,22 1, ,25 3,33 1,4 4 Karlskrona 0,66 0,58 1, ,25 1, Karlstad 0,99 0,77 1, ,25 2, Kristianstad 0,95 0,71 1, ,33 1, Lidköping 0,73 0,67 0, ,5 2,5 0 2 Linköping 1,6 1,51 1, ,25 6, Luleaa 1,04 0,82 1, ,5 2, Malmö 4,02 3,8 4, ,83 6,88 3,9 8 Nyköping 0,73 0,66 0, ,61 1, Nörrköping 0,84 0,58 1, ,5 0,25 1, Orebrö 1,21 1,03 1, ,61 3, Ornsköldsvik 0,52 0,42 0, , Ostersund 0,61 0,53 0, , Skelleftaa 0,52 0,42 0, , Skövde 0,91 0,67 1, ,5 2,5 0 4 Stockholm 7,14 6,72 7,27 9 7,5 9 3,83 6, Sundsvall 0,52 0,42 1, , Trollhättan 0,73 0,67 1, ,5 2,5 0 4 Uddevalla 0,73 0,67 0, ,5 2,5 0 2 Umeaa 1,78 1,73 2, ,25 6, Vaesteraas 0,86 0,61 1, ,36 1, Växjö 0,98 0,98 1, ,5 2,71 0,
195 Slovenia (SI) fua name global score functional score functional score with industry population administration decision transport knowledge tourism industry Celje 0,97 0,74 1, ,22 0, Koper 0,97 0,96 1, ,19 0, Kranj 0,83 0,79 0, ,44 0, Ljubljana 4,73 4,89 4, ,44 6,46 4,1 4 Maribor 1,63 1,55 1, ,5 1,44 3, Nova Gorica 0,74 0,68 0, ,5 1,44 0, Novo Mesto 0,68 0,61 0, ,5 1,11 0,
196 Slovakia (SK) fua name global score functional score functional score with industry population administration decision transport knowledge tourism industry Banska Bystrica 0,86 0,83 1, ,22 0,63 1,4 2 Bratislava 4,47 4,36 4, ,14 3, Humenne 0,69 0,63 0, ,19 0, Komarno 0,64 0,56 0, ,89 0, Kosice 1,5 1,16 1, ,5 1,94 2, Levice 0,64 0,56 1, ,89 0, Liptovsky Mikulas 0,6 0,51 0, ,67 0, Lucenec 0,52 0,41 0, ,22 0, Martin 1,59 1,72 1, ,67 3,96 2,1 4 Michalovce 0,65 0,57 0, ,94 0, Nitra 0,91 0,67 1, ,89 0, Nove Zamky 0,64 0,56 1, ,89 0, Piestany 0,99 0,98 0, ,39 0,63 1,4 0 Poprad 0,78 0,73 0, ,94 0,63 0,7 2 Povazska Bystrica 0,84 0,81 1, ,39 1, Presov 0,92 0,68 1, ,94 0, Prievidza 0,84 0,81 1, ,39 1, Ruzomberok 0,6 0,51 0, ,67 0, Spisska Nova Ves 0,65 0,57 0, ,94 0, Trencin 1,21 1,03 1, ,89 1, Trnava 1,29 1,14 1, ,39 0,63 1,6 2 Zilina 0,87 0,62 1, ,67 0, Zvolen 0,52 0,41 0, ,22 0,
197 The United Kingdom (UK) fua name global score functional score functional score with industry population administration decision transport knowledge tourism industry Aberdeen 2,87 2,84 NA ,75 5,21 3,3 NA Alloa - Stirling 1,5 1,61 NA ,33 5,42 0 NA Ashford 1,01 1,02 NA ,33 1,25 0 NA Ayr 0,73 0,66 NA ,61 1,88 0 NA Ballymena 0,55 0,44 NA ,25 1,25 0 NA Barrow-in-Furness 0,79 0,74 NA ,44 1,88 0 NA Bedford 1,74 1,68 NA ,33 3,75 0 NA Belfast 3,84 3,36 NA ,72 5,42 2 NA Birmingham metropolitan area 5,78 5,07 NA ,06 6,25 4,5 NA Blackburn/Burnley 1,45 1,11 NA ,61 1,88 0 NA Blackpool 1,41 1,06 NA ,39 1,88 0 NA Bournemouth/Poole 1,97 1,3 NA ,64 2,71 0 NA Braintree 1,13 1,16 NA ,33 1,88 0 NA Brighton/Worthing/ Littlehampton 3,99 3,77 NA ,89 6,88 5,7 NA Bristol metropolitan area 5,28 4,9 NA 7 1,5 4 4,61 6,88 5,8 NA Burton on Trent 0,92 0,91 NA ,83 1,25 0 NA Cambridge 3,85 4,04 NA 3 2 0,5 3,33 8,54 4,8 NA Canterbury 2,34 2,64 NA ,33 3,75 4,8 NA Cardiff and South Wales valleys metropolitan area 3,83 3,35 NA ,17 2,92 5 NA Carlisle 0,88 0,85 NA ,44 1,88 0 NA Cheltenham 1,18 1 NA ,61 1,88 0 NA Clacton 1,13 1,16 NA ,33 1,88 0 NA Colchester 1,92 1,9 NA ,33 5,21 0 NA Crewe/Nantwich 0,88 0,86 NA ,61 1,25 0 NA Dover 1,15 1,18 NA ,08 1,25 0 NA Dumfries 0,88 0,85 NA ,44 1,88 0 NA Dundee 1,82 1,78 NA ,61 6,88 0 NA Dunfermline 0,83 0,57 NA ,33 1,25 0 NA Edinburgh 5,28 5,35 NA 5 5 3,5 4,58 6,88 6,6 NA Exeter 1,87 1,62 NA ,69 4,58 0,5 NA Falkirk 1,13 0,94 NA ,83 1,88 0 NA Folkestone 1,01 1,02 NA ,33 1,25 0 NA Glasgow 5,3 4,7 NA 8 1 2,5 5,31 6,04 6,8 NA Gloucester 1,27 1,11 NA ,61 1,88 0 NA 197
198 The United Kingdom (UK) fua name global score functional score functional score with industry population administration decision transport knowledge tourism industry Great Yarmouth 0,84 0,81 NA ,39 1,25 0 NA Greenock 0,84 0,8 NA ,22 1,88 0 NA Grimsby 1,21 1,03 NA ,39 1,25 0 NA Hastings/Bexhill 1,23 1,06 NA ,89 1,88 0 NA Hereford 0,84 0,81 NA ,89 1,25 0 NA Hull 2,12 1,7 NA ,39 3,75 0 NA Inverness 0,96 0,95 NA ,5 1,88 1,4 NA Ipswich 1,39 1,25 NA ,89 1,25 0 NA Irvine 1,04 0,82 NA ,33 1,88 0 NA Kettering - Corby 1,2 1,02 NA ,33 1,25 0 NA Kirkcaldy 0,83 0,57 NA ,33 1,25 0 NA Lancaster 1,76 1,71 NA ,11 4,58 0 NA Leeds - Bradford metropolitan area 4,79 4,07 NA 8 1,5 4,5 4,83 6,25 2 NA Leicester 3,29 2,91 NA ,33 6,25 1 NA Lincoln 1,25 1,08 NA ,61 1,25 0,5 NA Liverpool/Birkenhea d metropolitan area 5,16 4,31 NA 9 1,5 2,5 5,61 5,42 5,1 NA London 9,71 9,65 NA 10 9,5 10 9,28 9,38 10 NA Londonderry 1,01 0,8 NA ,5 2,08 0,5 NA Lowestoft 0,84 0,81 NA ,39 1,25 0 NA Lurgan/Portadown 0,45 0,33 NA ,25 1,25 0 NA Manchester metropolitan area 5,7 4,96 NA 9 1,5 5 5,83 6,25 4,5 NA Middlesborough 1,93 1,25 NA ,67 1,46 0 NA Milton Keynes 1,85 1,59 NA ,33 3,33 0 NA Newbury 0,83 0,79 NA , NA Northampton 1,56 1,24 NA 3 1 0,5 3,33 1,25 0 NA Norwich 2,53 2,42 NA 3 1 1,5 2,64 3,75 2,5 NA Nottingham-Derby metropolitan area 4,22 3,6 NA 7 2 3,5 4,08 5,42 2,2 NA Oxford 3,3 3,59 NA ,33 7,71 4,6 NA Perth 0,95 0,94 NA 1 1 0,5 1,33 1,88 0 NA Peterborough 1,27 1,11 NA 2 1 0,5 2,11 1,88 0 NA Plymouth 2,31 2,16 NA 3 1,5 1,5 2,08 2,08 3,3 NA Portland/Weymouth 0,86 0,82 NA ,83 1,88 0 NA Portsmouth/Southa mpton metropolitan area 4,73 4,22 NA 7 1 2,5 5,61 6,88 3,5 NA Preston 1,58 1,26 NA ,11 2,08 0 NA 198
199 The United Kingdom (UK) fua name global score functional score functional score with industry population administration decision transport knowledge tourism industry Rugby 1,17 1,21 NA ,56 1,88 0 NA Rushden 1,2 1,02 NA ,33 1,25 0 NA Scarborough 0,84 0,81 NA ,39 1,25 0 NA Scunthorpe 1,42 1,29 NA ,39 2,92 0 NA Sheffield metropolitan area 3,81 3,1 NA 7 1,5 2 3,33 6,88 1 NA Shrewsbury 1,09 1,11 NA ,61 1,88 0 NA St. Austell 0,5 0,39 NA ,5 1,25 0 NA Stafford 1,26 1,31 NA 1 1 0,5 2,83 2,08 0 NA Stoke 2,37 2,01 NA ,83 2,92 1,8 NA Swansea 1,66 1,36 NA ,69 2,92 0 NA Swindon 1,69 1,4 NA ,11 2,71 0 NA Taunton 0,89 0,87 NA ,17 1,25 0 NA Telford 1,27 1,11 NA ,61 1,88 0 NA Thanet 1,2 1,02 NA ,33 1,25 0 NA Torbay 0,94 0,71 NA ,44 1,25 0 NA Tyneside metropolitan area 4,34 3,75 NA 7 2 3,5 4,14 6,25 2 NA Whitehaven 0,65 0,58 NA ,72 1,88 0 NA Worcester 1,25 1,08 NA 2 1 0,5 2,61 1,25 0 NA York 2,49 2,59 NA 2 1 0,5 2,39 4,58 3,7 NA 199
")
200 6.2 The Maps Figure 23 The FUAs according to the functional criteria (Global score) 200

201 Figure 24 The decision specificity of the FUAs 201

202 Figure 25 The administrative specificity of the FUAs 202

203 Figure 26 The knowledge specificity of the FUAs 203

204 Figure 27 The transport specificity of the FUAs 204

205 Figure 28 The tourism specificity of the FUAs 205
206 6.3 The measure of polycentricity with the functions Polycentrism has until yet been estimated on a morphological basis, i.e. on the basis of the analysis of the distribution of the population of the FUAs. We can also try to estimate a more functional view of polycentrism, taking into account the functions of the cities. For each country, the functional index is based on the average between the following indicators: the coefficient of asymetry of the global scores of the whole set of FUAs, scaled from 0 and 100 between the most asymetric, Hungary, and the most symetric, Cyprus ; the part of the score of the highest ranked FUA in the sum of the scores of the five highest ranked FUAs, scaled from 0 (the highest part, in Estonia) to 100 (the smallest part, in Germany); the number of FUAs scored 10 or more and the number of FUAs scored 5 or more in the field of administrative and private decision. The sum of these two values have been scaled from 0, when it concerns only one FUA, and the highest number, 100 (7 FUAs rating 10 or more and 14 5 or more in Germany); the ratio between the score of the best ranking FUA and the average score of the whole set of FUAs, scaled from 0 (Greece, where this ratio is the highest) to 100 (Cyprus, where it is the lowest) The average of these four scores shows that Hungary is the most functionally monocentric country (score = 3) and Germany the most polycentric (score = 88). Some links exist between morphological and functional polycentrism, but the coefficient of regression between the two sets of scores is only r = 0,

207 Figure 29 Bad correlation between morphological and functional polycentricity We can thus identify different kinds of countries, for instance : Strongly polycentric countries, as well from the morphological as from the functional point of view : firstly Germany, but also Switzerland and the Netherlands; A group of central-eastern European countries, quite polycentic from the morphological point of view, but strongly monocentric from the functional point of view, with most of the decisional functions concentrated in the capital : Poland, Romania, Bulgaria, the Czech republic, Slovakia; in Hungary, the functional monocentrism is yet more strong and the morphological monocentrism is also strong; As Hungary, Greece is strongly monocentric from the two points of view, despite the size of Thessaloniki as the second Greek city; Among the other countries, functional monocentrism appears quite strong in Denmark, Finland or Norway, as well as in France and Portugal. France and Britain appear at the same level concerning the morphological monocentrism, with the same strong weight of their capitalregion. However, the other British MEGA benefit from more decisional functions that the French ones, so that the United Kingdom appears to be more polycentric than France. The morphological polycentrism is stronger in Spain and in Italy, but functionaly polycentrism is a bit weaker than in Britain, despite of the sharing of the functions between Madrid and Barcelona and between Rome and Milano. 207
208 Discussion on the polycentricity issue Part 4. Discussion on the polycentricity issue An index of polycentricity We have built an index of polycentricity, based on a purely morphological methodology (as approached by the arguable proxies of population data of the FUAs), using the cardinal ranking of the following indicators: 1. weight of the main FUA in the total population of the country or macro-region 2. weight of the main FUA in the total population of the whole set of FUAs with more than and more than inhabitants 3. average of the differences of population between a FUA and the following one in a decreasing ranking from the most populated FUA to the one immediately beneath the threshold of 200,000 inhabitants and until the threshold of inhabitants 4. standard deviation of the population of the set of FUAs with more than and with more than inhabitants. The value of each of these seven indicators has been distributed on a scale bounded from 100 (the highest value for the indicator) and 0 (the lowest one). The arithmetic average of these seven indicators gives the cardinal global index. We stress that this exclusively morphological index of polycentricity imperfectly reflects the functional polycentricity, decisional functions appearing to be much more concentrated than the urban populations (C. Vandermotten & al., 1999). An apparent morphological polycentricity may conceal a strong functional monocentricity at the level of the location of the command of the economy: this is one of the most significant results of the POLYNET study, which shows how even inside apparently very polycentric urban regions, like Delta Metropolis in the Netherlands and South-East England, the main functions linked to the advanced services sector remain concentrated in the traditional economic cores, like Amsterdam and London (Hall & Pain, 2006). In fact, the functional polycentricity does not exist inside the enlarged metropolitan areas but between their cores, at the European or worldwide level. Does increased polycentricity bring about advantages? The question is asked from a point of view of the role cities and regions play in the development of a performing and durable economy, not from the point of view of the provision of services throughout a territory. The question can be put from three points of view: does increased polycentricity lead to a better economic efficiency?! does increased polycentricity lead to more spatial equity?! does increased polycentricity lead to a more sustainable development? As regards economic efficiency, a small advantage is detected in favour of the most monocentric countries and macro-regions. This assessment is not only due to the globalisation of the economy, which favours the most accessible and the best integrated cores in the world networks (Sassen, 1991; Veltz, 1996; Taylor, 2003), but also to the fact that a rise in subcontracting, just-in-time, shift work, and advanced services increases the interest of more central locations. But the factors of economic success are so numerous that the statistical correlation between more economic growth and more monocentricity is very weak. Therefore, this small statistical obviousness may by no means be interpreted, in the field of spatial planning and economic development policy, as a wish to promote monocentrism. 208
209 Discussion on the polycentricity issue From the point of view of spatial equity, it appears of course that there is a small trend toward more homogeneity in the spatial distribution of GDP per inhab. in the most polycentric countries and macro-regions. However, the statistical link is weak in this case too, and quite dependent on statistical divisions which isolate the major core-cities and their peripheries arbitrarily. Moreover, the link disappears when GDPs per inhab. are no longer taken into consideration but the available income by inhab., while taking into account the GDP transfers either through public expenditure and transfer revenues, or through alternating moves and temporary workforce movements (secondary residences, family, business, leisure, week-end or longer duration tourism) (Behrens, 2003; Davezies, 2005). As regards sustainable development, we have not conducted any study up to now. Meanwhile, it does not seem a priori evident that the environmental burden is worse in a more concentrated system than in a more scattered system: the densification and the big size of cities favour for instance public transport to the detriment of individual transport. In any case, nothing allows us to significantly confirm that a more polycentric urban structure will contribute to a more balanced regional development, to reducing regional disparities, to increasing European competitiveness, to the fuller integration of European regions into global economy, and to sustainable development (ESPON report) (and, a fortiori, to establish causality relationships). It would besides be surprising if there was no contradiction between those different objectives. 209
210 Comments on ESPON final report Part 5. Comments on ESPON final report This project had the difficult task of critically reviewing the results of ESPON project on polycentricity (NORDREGIO et al., 2005). This is the first example of such peer review within the ESPON programme and obviously risks causing frustration. We would, therefore, from the outset like to insist on the fact that the aim of the critique is not to judge the scientific capacities of the teams working in that project, but rather to evaluate, on the basis of comments of the ESPON Monitoring Committee (MC), the ESPON Contact Point network (ECPs) and members of the research team, how the methodology used and the results presented answer the questions raised in the political debate about a difficult concept such as polycentricity. We are aware of the difficult constraints the ESPON programme and the political agenda at the moment of the completion of project (notably the elaboration of the Third Cohesion Report) limited their freedom of research. However, as the concept of polycentricity is an important building block in European territorial policy documents, and as the results of this project are some of the most prominent presented by ESPON to the European world of spatial policy, it seems necessary to submit the scientific aspects of the work to a thorough and frank review and to raise the issues that seem doubtful. Not in the name of sterile academic debates, but in order to advance the applied research on a field which where policy makers need solid foundations in order to make informed decisions. In this sense, the report, which is widely acknowledged as a step towards further understanding of the European urban system, raises many questions on conceptual and methodological aspects which have a significant influence on the research results and, thus, on the policy messages it conveys. 7. Overview of the comments on the final report ESPON project by the Monitoring Committee and the ECP network Owing to its wide scope, the pioneering character of research undertaken, as well as a particular position in the ESPON programme, the ESPON project on: The role, specific situation and potentials of urban areas as modes in a polycentric development, generated broad interest among both scholars, planners and policy makers across Europe. It also induced numerous comments by the ESPON Monitoring Committee and members of the ECP network. These comments, as recapitulated below, have been taken as a point of departure of, and whenever possible, integrated in the work on the ESPON project. 7.1 Comments by Monitoring Committee Members Considerations from Switzerland The Swiss MC member points out that the Swiss urban system has been presented in the ESPON project report on a factually correct basis, but often lacking details on its regional particularities. It is noted nevertheless, that ESPON s main merit is not the generation of new knowledge on individual European countries, but rather establishing a superordinate level of analysis, i.e. depicting the links among national urban systems and presenting their position in a broader spatial context. Indeed, in ESPON project an effort has been made to characterize these links first of all by identifying a new set of transboundary Functional Urban Areas. Also, work has 210
211 Comments on ESPON final report focused on improving cross-national comparability of FUAs by the implementation of a consistent, standardized definition of these basic spatial units. Still, some specific problems as to the way, the Swiss urban system was depicted in the ESPON report were identified in the MC comments. Among others, designation of the Swiss French EuroAirport as belonging to the French city of Mulhause, while ignoring the neighbouring city of Basel, is strongly questioned. Such an allocation has been corrected in ESPON report. In fact, the Basel Mulhause area is identified as one of transnational Functional Urban Areas (metropolitan area) with the population total of 982 thousand (Section 6, Table 4 and 5) Consideration from France The French MC member prizes the ESPON project for succeeding in overcoming the lack of a unified statistical system while presenting an integrated picture of Urban Europe. Aside from this, a number of critical points are also raised. These include: the use of static indicators that fail to account for the evolutionary dimension of urban areas; the use of GDP as a measure (not fully satisfactory one) of the wealth of regions; an arbitrary selection of some other indicators, for example the 45-minutes isochrone as the accessibility criterion. As a result, it is claimed, the picture of the French urban system is not quite complete. Among other things, Le Havre and Rouen should be considered one FUA, while Nantes Saint Nazaire and Strasbourg should (and could, if trends were taken into account) appear among the MEGAs. Further discussion focused on polycentricity measures as adopted in ESPON First of all, the policy recommendations concerning polycentrism are seen as rather vague, and addressed to thee different scales of government. These recommendations are not easily converted into concrete policies. Secondly, morphological polycentrism indicators can dominate the relational (read: functional) polycentrism i.e. measures which are much more important. Thirdly, the vision of polycentricity based upon the Randstad example is restrictive, as only few urban systems have such a configuration (proximity, density, specialization, complementarity). Finally, the question that remains open is: what does performance of a polycentric urban system mean in terms of sustainable development? In the present report, the question of polycentricity and its correlates are treated quite extensively. It is one of the crucial notions, introduced in the ESDP, and its relevance for spatial policy at various levels should be discussed, with different aspects and alternative interpretations analysed in debth Consideration from Finland The Finish MC member notes that the part of the report devoted to networks and specialization of urban areas is based on case studies only and the information about strategies adopted is weak. Another comment concerns the use of five functions, out of the original set of seven, to classify the FUAs. In the case of Finland this resulted in the allocation of a MEGA rank to Turku but not to Tampere, which is difficult to accept. The policy recommendations, as formulated in the ESPON Final Report, are relevant, but remain too general. Admittedly it is not an easy task to offer concrete policy recommendations and measures, especially at the European level. Differences between national and regional administrative systems make a transnational policy implementation difficult. The Report, as it is claimed by the Finish MC member, did not answer the following 211
212 Comments on ESPON final report questions: what kind of polycentricity is good for regional development? What is the optimal relation between centralization and decentralization? Another problem pertains to cities, such as St. Petersburg, which are important nodes of transnational urban networks, but owing to their situation beyond the EU boundaries, were not included in the analysis. This problem, it is suggested in the present report, should certainly be tackled in a future ESPON study on the European Urban System Consideration from the Netherlands Stimulation of cooperation between municipalities, i.e. promoting the formation of urban networks is indicated as a policy recommendation, formulated in the ESPON report, that fully corresponds to the Dutch planning practice. Conversely, according to the Dutch MC member, there is ground for identifying polycentricity attributes with the Lisbon Gothenburg goals; neither can any causality be claimed to exist between policentricity level on the one hand, and the indicators of economic growth and sustainability on the other. Also, it is pointed out that, while offering recommendations concerning national and regional levels, the Report gives insufficient attention to the way in which the EU itself can promote polycentric development namely via structural funds and sectoral policies Consideration from Belgium The Belgian MC member focus on the case of Brussels FUA, which is wrongly delimited, and appears as such in the Final Report, even though this error was indicated by the Belgian ECP already at the stage of Third Interim Report. Obviously, in the work of ESPON 1.4.3, the proper correction was introduced Consideration from the European Commission An analogous question was raised by a representative of the European Commission. It concerned the city of Thessaloniki in Greece which, in spite of its relatively big size and important functions, was not depicted as a MEGA. This case was also investigated and corrected (see Tables 4 and 5) in the work of FUAs consolidation, in the framework of ESPON project. 7.2 Comments by the ESPON Contact Points network Out of numerous comments made by representatives of ten ECPs (of Belgium, the Czech Republic, France, Greece, Ireland, Malta, the Netherlands, Poland, Slovenia and Sweden) those presented below, refer mainly to the scope of ESPON project. Among topics omitted are questions pertaining to the identification of PUSH and PIA areas, as well as to the urban networks analysis General questions (strategic reflections) Individual evaluations of the report by national experts vary considerably. Thus, from the point of view a Belgian expert, the main problem concerning polycentricity as a spatial policy goal is: at what scale? For example, the strategy to strengthen the Vlaamse Ruit, which is an inter-urban polycentric node, is a monocentric strategy at the regional level. 212
213 Comments on ESPON final report Experts from the Netherlands identify two challenges, or lessons stemming from the report: Each FUA, in order to improve its position in the European urban system, should develop a specialization with a potential demand on the European market. Secondly, policies should strive to improve cohesion between regions and help to develop a balanced urban system. Unlike in the report, however, where cohesion is identified with evenness among regions at all spatial levels, in Dutch spatial policy cohesion is promoted at the level of metropolitan regions, while international competitiveness is seen as stemming from the diversity of the regions. In the case of the Czech Republic, polycentricity goal is judged to be of high importance, since the process of transition to market economy has brought strong imbalance between Prague and the rest of the country. While FUAs are distributed fairly adequately throughout the Czech Republic, inter-urban, international and cross-border cooperation remains poor. For Sweden the report is relevant at all levels of governance. The position of MEGAs and other bigger FUAs, with a functional specialization of urban nodes, is very important from the national perspective. Strong, successful urban regions situated across the national territory are the main contributors to economic growth, and the challenge for the regions is (similarly as in the Dutch case) to be able to use their unique conditions and resources. In Polish ECP comments on ESPON Final Report it is emphasized that the results of the project concerning urban system s polycentricity closely correspond with results of studies conducted in Poland. While the overall polycentricity index is high, its value is dominated by the weight of structural indicators (rank-size distribution, spatial distribution of urban places). Conversely, the values of functional polycienticity indicators (accessibility, connectivity), are low. This leads to strong policy recommendations concerning improvements in spatial accessibility at both transnational and interregional levels, as well as the promotion of inter-urban cooperation and networking. This similarity of the results is achieved in spite of the fact that the set of FUAs, as identified for Poland in the ESPON report is far from optimal and poorly corresponds with FUA sets identified for a number of other countries. In fact, in the framework of ESPON project it has been subject to basic revision. The Slovenian expert notes that high morphological polycentricity, a feature of the urban system of that country in the light of report, also reflects the national perspective and national policies that aim at the development of a balanced urban system. However, according to national studies, interrelations between the individual FUAs, and the integration of the urban system is stronger than it is suggested in the ESPON report. French ECP expert resounds the comments by the MC representative concerning criteria adopted for the selection of MEGA s. It is namely pointed out that these criteria the role attached to harbour functions in particular, favoured the seaport cities (the case of Le Havre), while they did not allow for inclusion into the set of MEGAs such major urban centres and agglomerations as Nantes and Strasbourg. ECP comments from Ireland and Grecce are rather critical. According to them, the ESPON results poorly correspond with the established knowledge concerning the spatial structure as well as functioning of the respective national urban systems. It is noted that consequences of the EU enlargement to the east (in 2004) are not clearly reflected in the project analytical results and its policy recommendations. Reference is made in particular to prospects of the emergence of linear urbanization corridors, beyond the Pentagon. These questions, admittedly, have been analysed extensively in another project, namely the ESPON Also it this context, the Belgian experts point to a potentially dramatic impact of polycentric development on natural assets, especially through the development of transport corridors between high and medium rank MEGAs. The latter point relates to problematic aspects of polycentric development, which are referred to in a number of ECP comments. These include especially the possible contradictions between spatial cohesion and competitiveness objectives, and between polycentric development strategies as implemented at different levels simultaneously. For illustration: a contradiction is found between economic efficiency goals of EU transportation 213
214 Comments on ESPON final report strategy that promotes the growth of major urban centres in the NMCs, and the negative impact this strategy has on cohesion levels at the national scale. At the same time it is emphasized by several ECP experts (those from Greece, Poland, Sweden and Malta) that the approach to polycentricity taken in ESPON project follows the interpretation found in the European Spatial Development Perspective, where polycentricity is used as a descriptive and a normative concept at the same time. In ESPON report, the emphasis is put on measuring rather than on the evaluation of polycentricity. For ECP experts from Ireland and Belgium this lack of critical analysis of polycentric development is a definite drawback of the report. As they point out, the positive statistical correlation between the level of polycentricity on the on hand, and economic wealth and sustainable development (environmental protection) is extremely weak, while the correlation with spatial equity measures is even negative. In each case, nothing is known about causal relations. As the Irish experts insist, one of the outcomes of the research should be a more critical assessment of the European urban system, and especially of the potential of the polycentric development model as a planning tool throughout Europe Methodological matters Most of the ECP representatives appreciate an impressive volume of work conducted in ESPON project which provides a solid basis and an important reference for future studies on the European urban system. Experts from France, the Czech Republic, Sweden, Belgium and Poland emphasize, among other merits, the wide scope of the study, the huge amount of information handled, an attempt to operationalize the polycentricity concept. Still, a number of critical remarks have also been formulated in the ECP comments. The French expert considers the empirical study of city networks as a crucial aspect of the theme which, however, has been covered in the project in a rather fragmentary and preliminary way. Several experts point to limitations of the analysis and the results that stem from the lack of comprehensive sets of relevant spatial data, in particular the data on flows, functions, interrelations. The ECP representative from Malta observes that although the FUA represent relevant units for socioeconomic analysis, they rarely function as formal administrative, or self-governance entities; hence, few actual policies are implemented at this level. The Slovenian expert noted a lack of mutual comparability of FUAs and FUA sets between individual countries, as the FUAs were identified and delimited by national experts at the country level. The French expert points at both advantages and disadvantages of the FUA typology. The list of criteria adopted should be complemented by indicators of the range of influence of the urban agglomerations, their cultural heritage etc. According to several ECP experts, including those from Poland and Sweden, the typological analysis suffers from its static character. On still another point, Greek, Slovenian and Polish representatives regret that the EU is considered in the analysis as an excessively closed territorial system, while, even within the EU, cross-border metropolitan areas are not identified. Numerous critical comments, including those by experts from the Netherlands, Belgium, Ireland and Poland, refer to the choice of indicators that measure economic competitiveness, spatial equity, and environmental sustainability of urban systems at the national and regional levels. As to comments concerning relations between scientific results of the project and the policy recommendations, as formulated in the final report, experts of individual ECPs differ from each other. ECP representatives of Malta, Belgium, France, Greece and Poland find such a relationship in the report, but are critical of individual recommendations. For example, investments in city networking may not bring foreseeable results. Another point: building up potential of large urban centres (including the MEGAs) upon their functional specialization may involve a risk of instability in the long term. Also, due to insufficient data concerning the functions performed by andividual FUAs and MEGAs, the recommendation concerning functional specialization lacks solid scientific basis. These questions are raised in the ECP 214
215 Comments on ESPON final report comments from the Netherlands, Poland, Ireland and France. In a similar vein, for the Swedish expert the policy recommendations provided in the report are overly general and only implicitly related to the scientific results of the project. According to ECP representatives from Ireland and the Netherlands, the report fails to prove that more polycentricity at the European level could lead towards achieving the Lisbon Gothenburg goals. Not enough attention is given to alternatives to polycentricity, i.e. advantages of monocentricity and of spatial concentration. Experts from Poland, Belgium and the Netherlands claim that the association between values of the polycentricity index and policy objectives may be positive in some cases, while negative in others. Another criticism shared by most of the experts is that a contradiction appears when policies aim at fostering polycentricity at different spatial levels at the same time. Promoting polycentricity at one level tends to decrease polycentricity at other spatial levels. The report fails to spell out definite priorities in this respect. Concerning the indicators and criteria selected for analytical purposes, opinions of the ECP representatives vary. Generally, it is pointed out that the concepts of FUA and MEGA should be further refined. Some of the indicators used in the FUA typology seem not to be relevant for measuring the importance of urban centres and their growth potential. This applies more specifically to airport (some serving mainly tourist traffic) and harbour functions (comments by Belgian and Polish ECP experts). Doubts are raised by Italian, Irish and Dutch ECP representatives with regard to the structure of polycentricity indexes used. Differences in national definitions and data quality, as well as their accessibility, constitute a major difficulty. This concerns in particular the flow data. The French expert writes explicitly about limitations of the project results attributed to heterogeneity of national data sources and the lack of a genuine pan-european system of territorially disaggregated statistics. In spite of these problems, however, the effort undertaken in data collecting and processing is impressive. Also, the rich cartographic representation of the results is one of the essential contributions of the project. Assembling data base for 1595 FUAs in EU represents a major achievement, even with the problems of cross-national comparability of data Questions for further research It is concluded by most of the ECP experts that further research on the European urban system is required. However, progress in research will be conditioned upon the availability of new internationally comparable data. These data should first of all pertain to inter-urban flows and networking activities. They should also allow to carry on dynamic analysis. Among new topics identified are: long term trends in economic structure, population mobility, housing market evolution, increasing intra-urban disparities and segregation, implications of demographic decline (depopulation) and international migration, the role of environmental assets, quality of urban life and cultural heritage as factors of urban development and urban competitivencess 215
216 Comments on ESPON final report 8. Criticisms of Espon An unclear scientific position The ESPON project is part of an applied research programme and as such obviously framed by the expectation of the policy makers. The ESDP defines polycentricity in a normative way as being inherently good. In general, ESPON research teams were not asked to critically discuss concepts of this type, but rather to start from the ESDP as the existing policy consensus and to operationalise its ideas. However, one can ask whether for difficult and complex questions such as polycentricity, this is really the best approach, even in an applied research programme, as it limits the researchers to a very small field of action, potentially resulting in highly contestable results. In the case of the final report of project it is sometimes difficult to differentiate the descriptive and analytical study from a more normative narrative often based on the ESDP and general objectives as defined by ESPON. In this context, many hypotheses remain unquestioned. For instance, on page 3 of the report, it is said that ( ), polycentricity is about promoting the balanced and multiscalar types of urban networks that are most beneficial from a social and economic point of view, both for the core areas and for the peripheries. In this sentence the descriptive value of the concept of polycentricity is shifted one would say biased into a rationale of action: polycentricity is depicted here as a potential leverage (to be used by planners and policy-makers) to develop an efficient spatial planning policy ( most beneficial from a social and economic point of view ). Even though this could be a result of the analysis, it might be more appropriate in a research context not to take for granted such assumptions which have an incidence on the conceptual framework of the study and on its methodology, where the normative discourses are abusively implemented into unquestioned research hypotheses. As an example, the morphological polycentricity analysis in chapter 3 frequently abandons the purely descriptive analysis to enter the darker waters of judgmental discourses about what the results should be. The rank-size rule (used in this case to describe the concentration of the population in the upper levels of urban systems a relatively constant relation between size and rank of cities in a given urban context), suddenly becomes a goal to be achieved in order to attain a morphological polycentricity that is implicitly depicted as positive for the EU, following in so an assumption developed for instance in the ESDP. Here is how a situation of primacy is described in negative terms in Hungary: Budapest, its capital city, for historical reasons is far too large for this small country, in fact two-and-half times too large p. 66 Many other examples can be found in the report: Athens and Thessaloniki are far too large for the remaining urban system in Greece The 249 areas are well distributed across Europe p. 16 A uniform distribution of cities across a territory is more appropriate for a polycentric urban system, p. 5 What are the criteria to decide if a country performs poorly or a city is too large or a distribution more appropriate? Moreover, the bias in favour of polycentricity is so important that it is nowhere said a capital might be too small in countries in which the primatiality of the largest city is inferior to what the rank-size law provides for. 216
217 Comments on ESPON final report This is all the more puzzling as the report provides a critical examination of the ESDP's objectives at the beginning of chapter 2. It is as if the initial cautions expressed in this first part of the study have been forgotten when undertaking the actual research work (at least in chapters 3 to 5). When the report states (on page 13) that the question is therefore where new functional entities, created trough increased integration and co-operation, may change the European urban hierarchy: where can new nodes emerge, strong enough to counterbalance the Pentagon? (p. 13), Belgian and Polish contact points criticised this approach, arguing that the main question should have rather been a critical examination of polycentricity as a descriptive tool and as a planning principle in Europe. The commentators (see V. Biot, 2005) insist on: The problem of the relevance of polycentrism, not scientifically proven by any correlation method ( ) (p. 16) or For Poland, this report has taken for granted the approach of polycentricity selected in the ESDP and uses it as a normative and descriptive concept. So the emphasis is on measuring (polycentrism), not on the evaluation of polycentricity. (p. 19). Overall, the scientific approach seems thus to be biased by a pro-polycentricity position where the ESDP/ESPON framework is influencing the analysis and results by applying unquestioned principles, objectives, hypothesis and methods. Those normative presuppositions also produce some biases in the measurement tools elaborated to study the urban system leading to the fact that some key methods and results of the ESPON report, as we show, are contestable. The issues raised are obviously related to the question as to what extent solid scientific research can be done in an applied research context where researchers are pushed to apply vague political goals as if they were scientifically valid concepts. 8.2 Conceptual issues on polycentricity and functional specialisation Within the concept of polycentricity, various issues are studied, at different scales, in the final report of project Scales are sometimes mixed up and so are the concepts, without underlining the links between them Scale issue A scale-dependant analysis of polycentricity: The problem of the scale at which polycentricity is studied needs to be clarified. In the ESPON report, polycentricity is promoted as a continuum, while the structuring role of cities is perceptible at two clearly different scales defining distinct issues: on one hand, the framing purposes of territories as providers of people services, or the mere execution of production activities from a Christallerian angle; on the other hand, the issue of insertion points in the globalized economy. Polycentricity is even, in some parts of the study, conceived at the inner city scale, what constitutes another completely different issue: Polycentricity is also opposed to urban sprawl, in which the structure of secondary centres is diluted in a spatially unstructured continuum (p.3). A scale-dependent analysis of functional specialisation: 217
218 Comments on ESPON final report After measuring some elements of polycentricity in Europe, the report shifts for some times to another dimension of urban systems with the study of the functional specialisation of cities. This analytical reorientation relies on the assumption that differences in specialisation between two cities are the driving forces for their integration into a polycentric system. However, there is an inconsistency in the use of this argument. The report assumes that polycentricity would result from functional specialisation at meso/micro level but that it is no longer relevant at the macro level (page 3). It is as if distance was reducing the potential complementarities between specialised cities. The scientific literature argues on the contrary that the most important European network of cities links distant global cities that share either functional complementarities or the same specialisation. From the metropolitan archipelago to the global city theories, recent researches argue that Paris, London, Amsterdam, Frankfurt and other major European cities shape a key polycentric economic system. To this little attention is paid in the report that focuses on local accessibility and spatial proximity. Actually, various situations have to be distinguished concerning functional specialisation: - the case of performing small- and medium-sized cities, whose strength lies in their advanced specializations. These cities (or more precisely their firms or institutions) are often inserted into cooperation networks, but with a European if not worldwide dimension, thus not at all proximity networks. Small or medium university cities belong to this category. - the case of neighbouring small- and medium-sized cities, in which firms actually operate in clusters (for instance, in the Belgian Courtrai area or in the north of Italy in the Brescia area or, in a high tech vein, the Silicon Valley). In the present case, it is not the specialization of cities, but well their insertion into a very specific chain and into proximity networks favouring cross-individual relationships that makes their prosperity; - the case of polycentric urban frames, often found in old areas of heavy industrialisation or in mining areas, where neighbour cities suffer from the legacy of obsolete structures or their repercussions and from a development gap in their tertiary market sector, especially enterprise services. These cities often have weak links with each other. It is hard to see on which bases they could build up links while they compete for aids or investments. Those cities would draw more benefits from developing specialized niches in connection with nearby metropolises and would consequently make up for their lack of high level services, for instance in France, the cities of the Nord-Pas-de-Calais coal basin and Lille, or Charleroi and Brussels in Belgium. - the case of metropolises: proposals favouring polycentricity presuppose that the remetropolisation and globalisation of the economy should lead cities to specialize. In fact, the most performing large metropolises appear to have their dominant structure both diversified and more and more similar (Cabus & Saey, 1997). A similarity can be established between inter-city relationships and the trends in international trade, which decreasingly concerns complementary goods exchanges (Krugman, 1991). This is not only true of the economic structures of those metropolises, but even of the image they wish to give of themselves and of their achievements. Besides, the benchmarking studies conducted by international offices encourage a homogenization of cities urban policies. 218
219 Comments on ESPON final report Concepts mixing issue As mentioned from the start polycentricity has two different dimensions, a morphological one and a functional one. The study covers a very large part to the first dimension, which constitutes the core of the quantitative analysis, and pays less attention to the relational issues. Even though much more difficult to study because of missing data, one needs to stress that the space of flows to use Castells terminology, actually quoted in the report in Chapter 6, is of crucial interest. Besides, functional polycentricity can be envisaged in two ways: In its first sense, this word is used to describe cities and regions which differ from each other as to their specialization in such or such functions, i.e. metropolises in global economy, medium-sized cities in people services, coast or mountain cities in tourism, small cities of rural regions in the industrial development of local productions, etc. In this first definition, functional polycentricity is thus closely linked to the notion of functional specialization, suggesting possible cooperations between complementary cities. A second definition of functional polycentricity can start from a more dynamic approach of urban and regional systems. Functional polycentricity is then no longer limited to the study of the cities economic specializations in such or such function, but corresponds to the functioning of the urban system. The emphasis is shifted here from complementarity to exchanges between cities and regions or, statistically speaking, from location quotients to intra- and inter-regional matrixes. Polycentricity is measured in terms of intensity of the relations (exchange of labour, capital, products, services, ideas, etc.) between the spaces considered. In ESPON 1.1.1, specialization and relations are often assimilated as the same thing even though their relation is never demonstrated nor even analyzed. This appears clearly on page 3: At the regional or local scale, polycentricity occurs when two or more cities have functions that complement each other and even more so, if the cities co-operate with each other in order to be able to act jointly as a larger city. At this level, policies for polycentricity stimulate the functional division of labour, as well as the flows and the level of co-operation between neighbouring cities. The study of functional specialisation seems to take for granted the causal link between functional complementarities and potential polycentricity. Yet, there are numerous examples of interactions that result not from distinct functional specialisation but from common specialisation in one or more functions. This is the case in the metropolitan systems in many developed western countries where the strongest interactions in a given urban system take place between the major agglomerations which in fact share the same economic specialisation. Relations do not come from differences but from identical specialisations in this case. At a larger scale, the London New York Tokyo triarchy described by Sassen results from the same concentration of financial services in these three global cities. Moreover, the report does not manage to propose a framework explaining how functional specialisation is a tool to describe relational polycentricity. It only does so implicitly with the seven functions depicted in each country in chapter 4. It is unclear, however, how a high ranking score in one function or another increases the potential for polycentric integration of a city. Many studies on city-region networks have stressed the limits of such hierarchical classifications (ranking method). At least it should be complemented with an analysis of real economic flows (see P. Taylor, 2003 and its argument on global city networks for instance). In other words, to allocate a value to cities 219
220 Comments on ESPON final report does not inform about actual exchanges between them. This is the paradox of the analysis proposed by project 1.1.1: it focuses on functional specialisation of cities but fails to indicate functional - that is to say relational polycentricity. As one can see, there is also a confusion between spontaneous relational polycentricity and institutional cooperation as if the processes were almost equivalent. The indistinct use of both functional integration processes (that result from real flows) and of co-operation (which is not defined in this case as functional or political) is clear in the following sentence: A third important precondition for polycentricity is that of functional integration and co-operation. (p. 17). As these two dimensions refer to different level of analysis (socio-economic and urban processes on one hand, political and administrative configurations on the other), one solution to limit an undifferentiated use of these complementary but yet distinct dimensions of relational polycentricity would have been to separate them much more strictly in the different parts of the report. Such a clearer distinction would have prevented some problems one faces in the understanding of PUSHs areas, where the potential role of political institutions is used to define inter-urban relations. 8.3 Measures Measure of polycentricity The study of the European urban system is done in a very empirical way, using standard statistical tools. Polycentricity for instance is qualified via different measures among which the size and location indexes. Demographic size is the primary indicator of polycentricity. However, it refers to a relatively limited understanding of urban systems. As urban geographers have shown the rank-size analysis is only efficient to qualify the hierarchy of a set of cities but not a system of effective relations. Indeed, the use of the rank-size rule is at best only a very indirect indicator of how an urban system might work. It is based on the underlying hypothesis that the geographical distribution of cities follows a hierarchical pattern. In this case, the European urban system is therefore not seen as a network but as a hierarchical arrangement of cities. This Christaller-like approach is even more obvious when complementing the size index by the location index. The report says: The second prerequisite of a polycentric urban system is that its centres are equally spaced from each other this prerequisite is derived from the optimal size of the service or market area of centrally provided goods and services. Therefore, a uniform distribution of cities across a territory is more appropriate for a polycentric urban system ( ). (p. 60). This normative proposal, where a homogeneous distribution of cities is considered optimal, follows a Christallerian rule. This expresses a partly out-dated understanding of contemporary urban systems, especially in regard with the notion of relational polycentricity which demands a network approach rather than the study of an evenly distributed and hierarchical urban structure. In this regard, the report analysis has been criticised by Contact Points as too static, studying the location of cities (urban structure) but missing the interactions between cities (urban system). In other words the priority is given to morphological polycentricity (via the analysis of spatial proximity) over relational polycentricity measured in terms of connectivity. Despite the complementary use of a connectivity index at the outset of the analysis (as a third indicator of polycentricity), the study quickly shifts to a narrowed definition of polycentricity: 220
221 Comments on ESPON final report The preconditions for polycentricity are best where cities are located in proximity to each other. (p. 13). This hypothesis should have been debated more thoroughly as it becomes the key to the rest of the analysis on potential new polycentric developments in Europe. It is indeed what justifies for the authors the use of 45 minutes isochrones to define the PUSHs and PIAs areas. This criterion unfortunately focuses on local accessibility rather than on long distance connectivity, most likely leaving aside the important interactions between distant cityregions that constitute the European urban system Measure of functional specialisation There is a lack of theoretical clarification on the underlying urban model used to study the functional specialisation in Europe. It seems that the seven functions have been cherrypicked and correspond more to an opportunistic research strategy depending on data availability than on a solid analysis of what cities are, a problem obviously linked to the requirements of the ESPON programme to cover 29 countries. A basic model of urban functions would have been useful if only to explicit the rationale behind this functional typology. On theoretical level, one might regret a lack of detailed analysis of some functions used in the classification as for instance with the knowledge function which is not clearly defined. Regarding the fuzziness of the terminology knowledge, it would have been more explicit to discuss the content or to use a clearer term such as the creative function defined in Florida's works (2002) or the innovation function (understood in a more restricted way than the creative function as activities dealing with the commoditisation of new knowledge). This semantic debate is not a purely academic argument. It has interesting outcomes in the selection of relevant indicators. The number of students is interesting but is quite limited: number of scientific quotations (informing what could be labelled the new knowledge production function), amount of R&D investments (informing the innovation function) and the share of creative workers (i.e. the creative function) could have further helped understand a complex and probably crucial aspect of modern economies. From our point of view, the idea would be to go past a too high-tech industries related definition of the knowledge function and to broaden the analysis to this ability of cities to engage technological, conceptual, aesthetic and semiotic innovation. At a more general level, the different functions used in the study would have benefited from an initial clarification of the goals and nature of the classification exercise. There is for instance an unclear relation between the nature of the specialisation (quality) and the implicit ranking (quantity) that is proposed for each city. From what one might understand, even though this is unfortunately not made clear in the report, the first dimension informs the quality of a city (administrative, residential, etc.) while the other measures its attractiveness, i.e. how successful a city is in polarising a function. This results into giving two distinct objectives to this functional specialisation study which may not go together easily. One is strictly descriptive (what is the dominant function(s) of a city?); the other is more evaluative (how good is a city performing in this function?). These are two different exercises that need to be carefully articulated. This can be illustrated with a detailed analysis of the decision-making power in the public sector function. What is described here is not so much a function strictly speaking than a valuation of how a city is successful in a function which could be labelled here the administrative function. This administrative function is not specific to European and national capital cities the ones that have got strong decision-making power in the public sector but to many other cities. The degree of specialisation (low/medium/strong decision-making 221
222 Comments on ESPON final report power) should probably be considered in a second step of the analysis. This classification can even be further refined by including a spatial reference depending on the scale that is considered. In the French case for instance, administrative cities could be differentiated for instance in four categories: préfectures (NUTS-3 level capital cities) would be local administrative cities, préfectures de région (NUTS-2 capital cities) would be regional administrative cities, where as Paris would be the national administrative city and Strasbourg would be a European administrative city. This example shows that to make the analysis more meaningful the nature of the specialisation (the function strictly speaking), its scale and its intensity should be differentiated more accurately. One could extend this to most functions. For instance a city specialised in the production function (this can be refined for instance into manufacturing and service production) can be either a local, regional, national or European decision-marking city. In this context, the distribution of the headquarters of the top European firms might be an indicator among productive cities of a European concentration of decision-making powers 2. Following the same reasoning, a city with national headquarters would be a productive city with national decision-making powers, and so forth with other regional and local firms. In conclusion, the functional classification of European cities should distinguish more clearly the nature of the specialisation, its intensity and its different scales, leading to a three dimensional analysis of specialisation. Axis 1: nature of the specialisation (qualitative) Axis 2: scale of the specialisation (qualitative) Axis 3: intensity of the specialisation (quantitative) This could lead to a comprehensive table of analysis as follows: Axis 1 = columns, Axis 2 = lines, Axis 3 = quantitative values in the table International/European National Regional Local Residential function Industrial function Innovation function Administrative function 8.4 Methodological issues Our strongest criticisms go to the methodology used in the delimitation of the FUAs and in the measurement of polycentricity Data availability: the strongest limitation to the study The report most important limit comes from the lack of consistent data which can be harmful in terms of results and methodology as shows the following example. If the authors of the report express their intentions to give priority to a European-based study of the urban system ( the point of departure is that of the European scale (p. 4)), thus following one of the major objectives given to the ESPON programme, the report is almost entirely based on a very national-centric approach. The study of polycentricity is for example firstly achieved at the national level as the title of chapter 3 indicates. Furthermore, the very definition of the basic geographical building blocks of the study refers to the national level. For instance the FUAs are based on two thresholds depending on the total number of inhabitants of a country. Seemingly the degree of polycentricity is studied within national 2 See draft final report of ESPON 3.4.2, page 78, figure
223 Comments on ESPON final report urban systems. Even though the authors argue that the countries are the best-integrated territorial level in Europe (p. 5), this argument is no justification for an analysis that is a European-oriented research project. The object is not to study the most-integrated territorial level (whatever it is) but to focus on the European urban system. This has severe consequences in the results. For instance, the calculation of Thiessen polygons within national borders excludes all potential transborder polycentricity. The problem of nation-centricity of the study becomes even more critical when it is combined with irreproducible national data (such as subjective expert insights ): In countries lacking official definitions, the identification of FUAs was based on insights provided by our national experts. The use of national definitions means, however, that the choice of FUAs is not totally comparable across Europe. (p. 4) This explains partly the problems with some building blocs of the analysis: the Functional Urban Areas Evaluation of MEGA identification and qualification The aim of ESPON , The role, specific situation and potentials of urban areas as nodes in a polycentric development was to research the conditions for a more polycentric development of the European urban system, following, with some restrictions, the idea of polycentricity manifested by the European Spatial Development Perspective. The starting point for the discussion on the topic was the assertion that a polycentric urban development of the EU27+2 requires a counterweight to the Pentagon, which constitutes a too much concentrated space of European urban power. This had led to an investigation of the state of the urban system with respect to its functional specialization and the degree if its polycentricity. Eventually the study required a reasonable division of space, i.e. an identification of spatial units, the building blocks of polycentricity to be. The urban structure of 29 European countries was mapped by distinguishing 1,595 Functional Urban Areas (FUAs). These were identified according to either travel-to-work areas, commuter catchments areas, urban poles, or insights provided by national experts. Although, the nonuniform criteria of FUA identification (Ex. population mass of the urban core) had actually hampered the possibility to confront them, the FUAs constituted a basis for further inquiry. The analysis of these spatial units according to their functional specialization had given an overall ranking of all FUAs. The study had distinguished three groups of FUAs. Those were: regional or local FUAs, transnational or national FUAs, and, FUAs of special importance, called the Metropolitan European Growth Areas (MEGAs).. FUA typology and MEGA identification The study identified 76 MEGAs, defined by the authors of the project as the strongest. The distinguishing of the so called FUAs of Exellence required a check-up of all 1,595 European FUAs according to selected features and functions. Seven such indicators were chosen, 223
224 Comments on ESPON final report namely: population (i.e. the mass function), transport, tourism, industry, knowledge, decision-making and public administration. The selected factors can be evaluated as interesting and important criteria and they mostly cover the needs of such an analysis, assuming of course, that the level of the analysis is quite general. The choice of features follows to a certain extent the goal of the project, namely the idea of identifying FUAs which could functionally counterbalance, or at least complement the cities of the Pentagon. It should be stressed however, that there are some basic restrictions to this assessment. The criteria of FUA evaluation should encompass those fields of activity which, on the one hand, typically decide about the metropolitan power of a city and region, and on the other are characteristic for the cities of the Pentagon. The functional structure of the strongest European cities is based on the quantity and quality of metropolitan functions. i.e. their specialization and spatial range. This study had not separately analyzed the range of the given functions. In some categories, the way they were chosen had allowed them to a a priori evaluation of the city s importance in the spatial dimension. This concerned in the first place, the decision-making function. The location of the largest companies in Europe, whether their headquarters or not, may to a certain extent give an idea about the range of the corporate-control function. Similarly, when describing the administrative role of the FUA, the importance of the city was either identified as local, regional, national or transnational. With respect to the last function, it was the case, when the city held European or international institutions. The situation was to a certain extent different with regard to other functions. For example, one of the two indicators evaluating the position of a FUA as a transportation node were the traffic levels at the main airports. The levels themselves did not characterize the range of the airport, at least if their structure, i.e. origin and destination of the passengers was not identified. The measures used for describing the knowledge functions of a FUA provided good information on the degree of polycentricity of knowledge in the respective country and gave an idea about the national importance of the city with respect to this function, as well as general facts on the overall level of national higher education. It delivered no knowledge however, on whether the function of the FUA was mainly regional, or national, or even transnational. Of course the attainment of this information would have required detailed survey studies. And apparently at this level of analysis this was not necessarily obligatory. Another issue is the selection of features itself. Some of the categories seem much less informative and objective than the others. The fact that such commonly understood metropolitan functions as culture or media had been omitted maybe due to problems with measures and data collection, could have had an influence on the results of the inquiry. Although, for example, it s a common fact that the main cultural centers are usually also those with universities. At the same time, the mass criterion and the tourist function might 224
225 Comments on ESPON final report on the one hand have eliminated smaller cities, or on the contrary, included them if they were strongly specialized tourist centers, without other important functions. MEGAs qualification According to the above criteria, 76 FUAs qualified as best. These urban areas, the MEGAs had in the further course of the study undergone an analysis which aimed at their qualification, again, according to selected factors. As building stones of four basic themes: mass criterion, competitiveness, connectivity and knowledge basis, altogether eight variables were selected, namely population, GDP in millions of EURO, GDP in Purchasing Power Parity per capita, location of TOP 500 companies in Europe, passengers at airports, the multimodal accessibility indicator, education level and R&D share of employment. It seems difficult not to point to the fact that at least two measures where chosen a second time, namely population and passengers at airports, which might not necessarily be wrong, but does not add a special quality to the overall picture. It had been mentioned in the project report, nevertheless it should be stressed here, that the factor of competitiveness of the MEGAs could only indirectly be estimated, without going deeply into the analysis of certain factors which stimulate the attractiveness of the city s and region s environment. Without such an analysis, it is difficult to actually describe the development potential of the MEGA, as the location of TOP 500 companies and GDP in PPS are results and not factors of urban competitiveness. Another point is that competitiveness should not be measured by economic indicators. In some cases, when qualifying a city s potential, the national importance of the urban area seems to be as important as the international role. There is no conflict between this statement and that of the necessity of including the range of functions in the analysis. A city may actually be strong nationally (also in a polycentric system) and have a comparatively low position in the macro scale, but as European polycentricity is concerned, both roles are important in evaluating a MEGA. The country s territory is namely also a space of influence, sometimes not without significance when considering the role of possible counterweighs for the Pentagon. It is difficult to argue with the results of the MEGA analysis. The qualification achieved in much respect corresponds with other rankings of European metropolises. In some cases however, the affiliation of a city to a category seems to be coincidental (Ex. Palma de Mallorca as a highly specialized area in the same category as Warsaw and Prague, or even the placement of Bratislava in the same category as the two other Central-European capitals). This also points to the question, whether the way to achieve a more balanced urban system in Europe leads through a specialization of functions in MEGAs outside the Pentagon, or whether functional specialization should concern rather FUAs of lesser importance, which would allow them to promote in the national urban systems. The viewpoint of the present 225
226 Comments on ESPON final report author follows the latter concept, according to which MEGAs of at least 3 first categories should omit specialization, which could in some cases cause economic collapse or isolation and be as multifunctional as possible, with some specialization, especially as far as noneconomic functions are concerned Critics on the definition and delineation of the spatial units: FUAs, MEGAs, PIAs and PUSHs Typical difficulties encountered when trying to delimitate a homogeneous set of functional spatial units in Europe are: - differences among national definitions and criteria of identification of towns and urbanized areas - heterogeneity of urban settlement patterns, related to variations in overall population density, urbanization level, historically development settlement forms - non uniform availability of spatial data The lack of common data for the Urban Agglomerations (UAs) and the FUAs partly explains the lack of a single Pan-European definition that is necessary to attain the objective of the study. p. 54: Lacking comprehensive and definitive definitions, this research could only look at various national definitions of UAs. Commuting data used in this case are available at NUTS-5 level only in 8 countries while national FUAs definitions are available in only 18 countries. Therefore, even though there is theoretically a definition of the FUAs, the final database at the end of the data collecting exercise looks much more like a patchwork of differentiated perimeters than a really standardised spatial study. Quite obviously the authors of the report must not be blamed for this deficiency which points out our inability to create a pan-european statistical system. However, this has lead to some decisions which appear somewhat arbitrary and which, therefore, limit the usefulness of the results: For countries with more than 10 million inhabitants, a FUA is defined as having an urban core of at least 15,000 inhabitants and over 50,000 in total population. For smaller countries, a FUA should have an urban core of at least 15,000 inhabitants and more than 0.5% of the national population, as well as having functions of national or regional importance. (p. 24). The difference in the definition that depends on total national population size is not explained. It is also not convincing. For example, one can see hardly a reason why the minimum population size for FUAs in Hungary, or the Czech Republic should be 50,000 while in Denmark, or Slovakia 25,000. The inclusion of cities under the 20,000 inhabitants threshold: even smaller FUAs are considered if they have a functional role within the national urban system (p. 64) is another unjustified decision, and raises the question whether the goal is to elaborate a European view of the urban system, or to cater to national interests only. More generally, in the light of the fact that the main goal of the project was to identify areas of potential urban concentration that could constitute in the future a counterweight to the Pentagon, and hence to analyze urban patterns in Europe at a macro-level, the size limit of 50,000 for a FUA seemed to be an absolute minimum. Inclusion of de facto small towns 226
227 Comments on ESPON final report (as cores of free-standing FUAs) as potential concentration nodes at the European scale has led to a dilution of the analysis and to some paradoxical results, especially in its further steps, when the PUSH and PIA areas were identified. It should be recalled at this point that in the ESPON project, on Small and Medium-Sized Towns, 50,000 inhabitants constitutes the upper size limit for small towns, while medium-sized towns are considered those falling in the 50, ,000 category. Such a situation a choice of FUAs not totally comparable across Europe was unavoidable. Total comparability of spatial units would not be a realistic objective. The question remains, however, whether the comparability level actually achieved is satisfactory. This is an important question, as the FUAs comprise the basic units on which most of the further analysis (for example, measurement of polycentricity) was performed. Some comments of the ex-post evaluations prepared by the monitoring Committee members and the ESPON Contact Points relate to the FUA definition, but these observations are fragmentary. A closer inspection of the FUAs on a country-by-country basis reveals further inconsistencies, as well as errors. The lower size limit for FUAs in several countries Germany, France, Hungary, Italy, Romania and the United Kingdom was set at 20,000 inhabitants, in contradiction to the general definition provided. At the same time, population of the smallest FUA identified in Belgium is 70,000 (with all the remaining ones above 100,000), 52,000 in Bulgaria, 51,000 in Spain, 39,000 in Latvia, 60,000 in the Netherlands, 47,000 in Slovenia, and 44,000 in Poland (with all the remaining FUAs, except one, exceeding 100,000 inhabitants). In the latter group of countries there exists, of course, towns below that size level which could qualify for inclusion as cores of potential FUAs. However, they were not considered as such. In Poland, to use one example, there are 137 towns in the size category of 20 50,000 inhabitants, the majority of which are freestanding settlements rather than parts of larger urban agglomerations. As a consequence of this, differences in the number of FUAs among individual countries can not be rationally explained on the basis of structural characteristics of urban settlement (see Table 1). Indeed, the number of FUAs in the Czech Republic (25) is just one-third of the respective number for Hungary (77), in spite of similar population size and area of the two countries. It is even lower than the respective number for Slovakia a smaller country, sharing a number of common characteristics with the Czech Republic. In the case of Poland, the number of FUAs identified (48) is comparable to that of Sweden, Portugal and Greece, countries with much smaller total population (and surface area for the latter two). Country Number of FUAs Population size of third smaller FUA (in thousand) Austria Belgium Bulgaria Switzerland Czech Republic Germany Denmark Estonia Spain Finland France Greece Hungary Ireland 7 47 Italy
228 Comments on ESPON final report Lithuania 8 72 Latvia 8 49 Netherlands Norway Poland Portugal Romania Sweden Slovenia 6 77 Slovakia United Kingdom ESPON Space 1588 Table 4 Selected data on Functional Urban Areas (FUAs) The source of these inconsistencies is no doubt a lack of sufficient comparability of the FUA definitions actually used for individual countries. Differences in the selection criteria were simply too large. As a result, the set of 1584 FUAs identified in the project fails to represent a close enough approximation of the European urban network. Some comments can also be made about the delimitation of the other spatial units used in the Espon study: There are several references to the MEGA selection in the comments on the final report made by the MC and the ECPs. Most of the remarks pertain to individual cities (FUAs) that are missing from the MEGA list but, for some reasons, deserve to be included. The Swiss MC, for instance, points out the case of Basel which was not allocated to the MEGA group owing to the fact that, according to the comment, in the ESPON the Swiss-French EuroAirport was allocated to the French city of Mulhouse, ignoring its relation to the city of Basel. This indicates one of the problems with the MEGA (and hence the FUA ) delineation, i.e. it disregards transboundary areas. Some comments also bring out the question of whether important metropolitan centres situated beyond the EU borders should not be considered among the MEGAs. St. Petersburg, for example, one of the biggest MEGAs in Europe and a very important node of the Baltic Sea Network. This is in fact part of a bigger issue; another relevant example being that of Istanbul. A number of doubts, as to the appropriateness of the selection criteria adopted, arise from a closer inspection of the full list of the 76 MEGAs, as well as their allocation among the four categories. An important point has been made by the Belgian CP who questions the major role attached to airport and harbour functions. Indeed, the elevation of Palma de Mallorca, Cork, Turku, Southampton or Le Havre to the MEGA status raises doubts, when centres such as Strasbourg, Hannover, Thessaloniki, The Hague, or Liverpool are left behind. The allocation of Palma de Mallorca into a category with cities such as Rotterdam, Budapest and Lisbon is a clear signal that revisions are required in the typological procedures applied. A number of comments converge on the fact that the function of PIA units is not clear. Questions pertain to their embeddedness within national territorial planning systems. The ESPON report seems to consider the PIAs as spaces for reflection, but also for action, in order to re-balance the European urban system. It seems, however, that this objective has not been fulfilled, owing mainly to methodological issues. 228
229 Comments on ESPON final report First of all, the PUSH and PIA systems reflect all the inconsistencies, primarily the differences among individual countries, in the way the FUA units were identified and delimited. Secondly, it was not realistic to assume that all FUA centres, including the smallest ones, can extend their zones of influence over the area situated within the 45 minutes travel time isochrone. If clusters of PUSH and PIA areas were to form magnets for further concentration of economic and demographic potential, they would have to be based upon the network of large cities which offer real attracting power in terms of labour market and the range of specialized services. Thirdly, as presented in the report, the pattern of PUSH areas reflects mainly variations in the overall density of urban settlement. Countries with high population densities are almost completely covered by the PUSH and PIA units. This says little about the structure of the urban systems. Fourthly, the identification and typology of the PIA areas (276 in total) has produced a number of paradoxical outcomes. As a consequence of the adoption of specific rules, some de-facto middle-sized cities, for example Bielefeld and Verona, emerged as main cores of huge urbanized areas, with the total population of 7.6 million and 6.6 million, respectively. By doing so they could also advance within the European urban system, to 12 th and 15 th rank, among all major potential urbanized areas (PIAs) identified. Using the case of Poland, one can easily demonstrate that in the elaborate construction of the system of PIA areas, little of the knowledge on the urban structures of a given country was used, thus significantly reducing the scientific nor practical utility of the results Travel to work: a restrictive approach to polycentricity Commuting-based analysis is an inadequate indicator to describe relational polycentricity as it focuses only on some types of relations (workers' journeys from home to work) and favours a strong bias towards morphological polycentricity based on spatial proximity. Which the authors of the report acknowledge: One must however keep in mind that spatial proximity is only one aspect of the interaction between cities. Another potentially more important one, is the network aspect. Due to the lack of data, the present project has not endeavoured to present a comprehensive analysis of network interaction between cities. (p. 53) If commuting does seem the least inefficient dataset to define FUAs perimeter, it is very contestable when applied in terms of relational polycentricity as it is does in the PUSHs and PIAs analyses. Our hypothesis is that cities with overlapping travel-to-work-areas have the best potential for developing synergies. (p. 13) This hypothesis has the merit to be explicitly stated so that the reader knows on which assumption the results are based. However, one is bound to ask why would overlapping travel-to-work areas favour synergies? For each of the FUAs, we have calculated the area that can be reached within 45 minutes by car from the FUA centre. These areas are then approximated to municipal boundaries, as municipalities are potential building blocks in polycentric development strategies. (p. 13) Here again we find in this explanation of the methodology a confusion between socioeconomic processes and political and administrative forces (municipalities as actors of 229
230 Comments on ESPON final report polycentric development strategies). But it goes further as it is based on the belief that proximity leads to polycentricity. Commuting distance is however a very limited tool as the report explains itself: Considering the potential commuter catchment's area as a proxy for each city's influence area is another major hypothesis underpinning the present analysis. Many other types of influence areas exist. For example, the concept of Global integration zones implies that some urban areas have transcontinental influence areas. (p. 121) Criticism of some detailed indicators Some more detailed problems can be encountered throughout the report, such as: Size index. The regression plot is calculated on all cities but the major. No explanations are given on the reason why not to include the biggest city. Location index. The Thiessen polygons methodology does not reflect effective influence of cities. Connectivity index. Due to lack of data, it is potential connectivity that is measured and not real flows (p. 61). Polycentricity index. Based on selected indicators from the three indexes (size, location and connectivity), this index is a weighted aggregation that refers to no theoretical framework. Therefore, the weight of each indicator seems to be the result of an arbitrary decision which is all the more problematic as the authors admit the final results to be sensitive to changes in the aggregation method. The health warning on the value of the polycentricity index is therefore alarming considering the small correlations observed later in the report between polycentricity and economic, social and environmental data. GDP/inhabitants. Recent literature shows that the use of GDP/inhabitant is a poor indicator of social inequity and probably even of economic development dynamics in most developed city-regions (Davezies, 2005). Other indicators should be used as the one proposed by Behrens (2003) Criticism of the indicator of polycentricity The proposed indicator of polycentricity uses the size, location and connectivity indexes described above. It is based on three normative assessments: a linear rank-size distribution indicates a better urban pattern because not dominated by a single big city an uniform pattern of the cities disseminated through the national territory is better than a pattern of urban clusters polarised on certain parts of the national territory in a polycentric pattern, accessibility should be identical for small and big FUAs. The use of Thiessen s rather than Reilly s polygons to measure the more or less strong equidistribution of the territorial servicing by cities means that the equality of the size of these polygons is an objective per se, notwithstanding the pattern of the population on the territory (or that the even distribution of the population on the national territory is an objective per se). A complex index adds indicators supposed to account for these three dimensions. It characterises each country by a synthetic value, notwithstanding the size of the country. Beyond the normative character assigned to the rank-size law, a logical incoherence 230
231 Comments on ESPON final report appears, as this index takes into account the distribution of the population of the FUAs as well as their GDP, when analysis should precisely aim at measuring if more or less polycentricity implies more or less equity in the regional distribution of the GDP Results Due to these different limitations (conceptual and methodological), of which the lack of consistent data is the most harmful, some results are suspicious. 231
232 Proposition for future research Part 6. Conclusion and Propositions for future research 9. General reflection The present reflection takes no account of Christallerian polycentricity, that is, the analysis of basic provision of services to population and of the availability of good quality infrastructures which public authorities have to ensure on the whole territory. This question is indeed rather within the scope of the ESPON project on small and medium cities. We focus here on the question of global polycentrism as political objective aiming at Europe s economic development in a context of economic globalization, increased competitiveness, pursuit of the Lisbon objectives and quest for better cohesion. We leave environmental questions open for they would deserve a complete study in themselves: is enlarged polycentricity likely to favour more sustainable development? The brief economic analysis we have achieved does not demonstrate any obvious advantage of polycentricity in terms of economic efficiency, measured globally in relative GDP growth compared to the European average: on the contrary, even if a very weak statistical relationship appears (quite insignificant indeed), this rather shows that more monocentric States or macroregions show a little better economic behaviours, which can be understood in the framework of a globalization and tertiarisation of the economy benefiting big cities, which are the strongest integration nodes in the world economy. The free play of the dominant globalised economic powers tends to reinforce this situation in favour of the hubs of the world economy. This can naturally impact negatively on cohesion inside national territories (let us take the case of new member countries in which the opening to market economy and the sudden tertiarisation and internationalisation have largely favoured the growth of capital regions to the detriment of industrial areas. The latter used to be, on the contrary, favoured by planned economy, which had also ensured an administratively balanced distribution of industrial activities on the whole of the national territory, even if command functions were centralized from the capital). The political discourse in favour of polycentrism should be able to rely on a sufficiently refined statistical analysis, specifying which scales are concerned. This report tries to contribute to solve both questions, although it remains an incomplete preliminary draft that should be completed and refined, with increased means, especially if one wishes to add to the analysis the dimension of contribution to sustainable development. In case an accurate analysis of polycentricity and polycentricity fitment on different scales fails to be achieved, the polycentrism option will remain an empty political slogan, an auberge espagnole where any partner will bring himself what he wants. Some will bring a line of argument to get regional aid, cohesion funds or public aid. Others inversely, will argue in favour of a laisser-faire policy and competition between urban areas, and a weakening of the regulating power of the States. If one wants the reflection on a polycentric Europe to really be in line with the aims of development, world competition, cohesion, and the Lisbon criteria and the concept to be operational, we believe, at the end this Report, that three fundamental questions should be discussed: - specification and definition of urban areas, as a basis of any reflection on polycentrism; - analysis of the polycentricity scales and its modalities, with impacts at different scales; - examination of the deficiencies of the statistical measure tools and of the tracks to follow. From this angle, we will examine three basic issues. 232
233 Proposition for future research Definition of the city This is no trivial question. The first problem is to make a choice between city as a FUA or as a MUA. It has appeared to us that the two dimensions should simultaneously be considered. Of course, the FUA, which corresponds to the employment pools, is an essential concept in functional terms and imposes itself more and more in a context of suburbanisation and growing mobility of active populations. However, the MUA, as a dense and coherent morphological whole, remains an essential concept: with identical populations, it clearly appears that FUAs which have better opportunities are those having a strong MUA in their centre, especially if the latter has some good quality historical and cultural heritage. This is an important element in the new forms of cross-city competitiveness. In addition, if we limit our work to the FUAs level, it might lead us to political conclusions in opposition to, or taking no account of, the territorial planning policies aimed at by different states or regions: prevention of scattered housing - which increases mobility, energy and space consumption, and damages landscape values and consequent reconcentration of housing and activities in urban cores. We have therefore chosen to consider FUAs and MUAs separately. Now comes the question of delineation. In principle, the definition of FUAs is simple, as they are based on the functioning of labour pools. Meanwhile, defining the centres is not always trivial, for instance in the case of very densely populated areas where an intense industrial activity has developed from a history of transformation of craft activities into dense small- and medium firms networks: we then have labour pools without true centre-cities: such cases can be found in the large metropolitan area of Porto or in the north-east of Italy. Some similar situations are found in the intermediary areas between the biggest cities of some old industrialisation basins in Great Britain, (for ex. between Leeds-Bradford and Sheffield). But, if the definition is simple (even if the threshold of 10% of the actives heading for the MUA can be discussed), its exact application today is only possible with a considerable work of data collection in some countries (Belgium, France, Germany, Austria ). In other countries, even if we have strongly homogenised our data compared to those provided by the ESPON report (often based upon administrative divisions only, most of the time much smaller than the FUAs), several problems remain. These can result from the fact that the available data (at least within the time and with the means we had) divide the whole national territory into labour pools, which are thus statistical entities in labour market analyses and are only proxys of the true FUAs. This is the case in Great Britain and Italy for instance, and to a certain extent, in The Netherlands, where the COROP (NUTS-3 level) have been drawn while taking into account the reality of the labour market spatial functioning. In other cases too, there were no statistics available, and we had to call on national experts to try to determine the labour pools. This problem was nevertheless less consequent in countries where extensive communal divisions have been determined according to commuting movements (like in Sweden, but in that case the MUA was overestimated), or in countries where suburbanisation is only starting (Romania, Bulgaria). For MUAs, applying the basic statistical definition, in terms of contiguity of communes with high population densities, imposes in many cases a tiresome complementary analysis with the help of satellite images, in order to check morphological urban continuities. This is no formal exercise: indeed, behind such an analysis, the question of large scale polycentric morphological wholes is raised, generally much less coherent, less structuring and bearing less sustainable development values than more compact cores. In addition comes the question, in the case of polycentric urban entities, of densely populated areas or FUAs close 233

234 Proposition for future research to FUAs fitments: we had to define secondary MUAs, which can have their own big labour pool but can be at the same time included in a major FUA. Once again, these are no simple questions of formal description: they can have major impacts in territorial planning and regional development matters. The very long exercise of FUAs and MUAs delineation will still have to be refined for some countries, but the following extracts of (unfinished) working maps show what a map of FUAs and MUAs at NUTS-5 level, extended to the whole of Europe, could look like. The extracts partly concern Belgium, western central France, France and Germany (with the cross-border Basel area). Figure 30 Belgium 234


235 Proposition for future research Figure 31 France and Germany Figure 32 Western central France 235
236 Proposition for future research 9.1 Polycentricity scales and political stakes At European level At this level, one can consider that the stake of polycentrism is the stake of cohesion within the EU. The promotion of polycentrism at this scale is however opposed to the strongest trends of the deregulated world-economy, which tend to increase the concentration of decision in a small number of big world places. For the countries situated outside the central European space (Polygon), in particular the new member states, the situation is paradoxical: the claim for more polycentrism is a quite legitimate aim in favour of cohesion, but at the same time those countries tend to adopt rather liberal attitudes which not only bear more polycentricity (at least functional, at the highest hierarchical levels) on a European scale, but also tend to reduce polycentricity (to the benefit of the capital) inside national territories At States level The level and models of polycentricity are, first of all, products of different histories of territorial shaping, during the very long cycles of history. Territorial planning and regional development policies will have few impacts in the short run on those situations, which does not mean that laisser-faire is satisfying, the less so as this can lead to a worsening of negative trends. Meanwhile, statistical analysis shows no automatic advantage in favour of the most polycentric states or macroregions. Once again, the different situations and dynamics seem to be bound to the specific historical forms of monocentrality or polycentrality in the different states. At the highest levels of the urban hierarchy, quite different forms of polycentricity can be measured, depending on whether clusters of metropolises are considered individually or are aggregated into polycentric metropolitan entities (for ex. Rhine-Ruhr, Rhine-Main, Birmingham polycentric metropolitan area, Upper Silesian polycentric metropolitan area, etc.), the more so if the analysis is extended to a transborder scale (for ex. the Öresund metropolitan area, with Kobenhavn and Malmö). Besides, Geneva, Basel and Luxembourg are large cities from a national point of view, but become metropolises (and even, for the latter two, the centre of polycentric metropolitan areas, if we take the transborder dimension into account). Globally, it seems that polycentricity based upon bicephalous type systems or with some very strong cores organized around large historical cities (for ex. Italy, Spain), is all other things being equal more efficient in terms of scattered economic command and major functions on the national territory, than polycentricity organized around the gathering of clusters of big cities, especially if the latter are characterized by a long industrial past. So, despite the strength of the German economy, the Rhine-Ruhr area appears to bear less integration into the world-economy, and much less cultural values (which is also an element of integration into the world-economy) than the metropolitan areas of London and Paris, which have approximately the same population size. The impacts of polycentricity and its measurement will also have to take into account the concrete forms of organization of the urban hierarchy, which can be masked by the sole examination of synthetic indexes. For instance, France and Britain both show a strong domination of the capital-region on the urban frame. But in the first case, the urban frame 236
237 Proposition for future research is completed by metropolises and large cities with an important historical and cultural weight (Lyon, Marseille, Bordeaux, etc.), but with a weak weight in functional command, even at the national scale. On the opposite, in Britain the concentration of international functions in London (and to a certain extent, in peripheral cities of the large London metropolitan area) is accompanied by the delegation of significant command functions at national level to other cities. But their cultural weight is rather weak, and the morphological structuration of their metropolitan areas mixes a very strong structuration at very large scale with confused organizations at metropolitan level. The impacts of monocentricity will also vary depending whether monocentricity in favour of the capital is coupled with an urban frame from which some well equipped cities of second level emerge (for ex. Finland, with among other cities Tampere and Turku), or inversely whether an apparent polycentricity outside the capital masks in fact a very flat profile multiplying small cities whose sizes are more or less similar and of weak or very weak hierarchical level, without true capacity of economic impetus (for ex. Hungary, Romania, Bulgaria, or smaller countries such as Estonia or Latvia) At metropolitan areas level When polycentricity concerns, in some metropolitan areas, big neighbouring cities of old industrial tradition sufficiently integrated in the world-economy, faced with lacks in knowledge economy and social problems bound to their economic re-conversion, those cities risk competing without much efficiency, none of them reaching the qualitative thresholds that might result in positive and multiplicative effects. From the angle of territorial planning and more sustainable development, one should also examine more in depth the respective advantages and disadvantages, in particular as far as mobility and space consumption are concerned, of more or less developed polycentricity inside the large metropolitan areas, be they either structured around a single historical centre (Paris, London) or structured by several dense historical centres (Brussels, Antwerp, Ghent, Leuven, etc. in the central Belgian metropolitan area). One should also study more in depth the impacts of metropolitan polycentricity in social justice matters: the development of polycentricity and suburbanisation can be accompanied by increased social disparities inside the metropolitan entities in the absence of strong cross-subsidization between the different parts of the metropolitan entity and in the absence of an integrated metropolitan government on a sufficiently huge zone. This might result in socially unacceptable consequences, which could eventually damage the development of the metropolitan area as a whole, seen as unique by external observers susceptible to its image Territorial polycentricity vs. networks polycentricity Finally, networks polycentricity (not only their apparent morphological and functional polycentricity) deserves to be analysed more in depth. At the level of cities, cooperation networks develop according to logics different from proximity logics. As we have seen, proximity can lead to costly and not much efficient competition, even if this is not always true. In this regard, small and medium sized neighbouring cities within industrial districts of small and medium firms should be distinguished from the situation of cities facing difficult industrial or mining reconversion processes, not to say intrametropolitan competitions whose effects can prove negative in terms of planning, sustainable and social development. 237
238 Proposition for future research But, above all, surveys in Belgium (which should be conducted at European level too) have shown that, if firms do operate well in networks, these do not correspond to apparently obvious topological logics Measuring the features of polycentricity better From what we have just seen, it is understandable that the question of monocentricity and polycentricity is very complex. It cannot lead to simplistic choices (promotion of polycentrism or inversely monocentrism), without specifying the analyses, the scales and objectives pursued. It is for example not sure that economic growth and internationalisation, territorial cohesion (whose definition still remains to be deepened), social cohesion and sustainable development could be achieved through a similar promotion of polycentrism. One should still analyze the possible operational measurements according to the objectives aimed. At any rate, beyond the already mentioned issue of the definition of urban areas, as much at FUAs as at MUAs level (the latter being just as important), it appears that the indicators allowing to assess the impacts of policies are particularly deficient. The urban audit no doubt represents a significant progress, but still suffers from the vagueness of the delineation of the statistical frameworks, of the still very incomplete character of the data collected, and of the fact that the latter are oriented toward the assessment of social and environmental situations rather than economic situations. The regional statistics from EUROSTAT and other sources, still suffering from the lack of precision of their statistical frameworks, are the only left. This has truly less impact in the case of isolated informations (for ex. number of museums, patrimonial characteristics, importance of airports, etc.) than when it comes to measuring the importance and the economic structures of FUAs. With a view to assess polycentricity (and possible polycentrism policies), it would be particularly important to go over the NUTS units framework, either through regrouping NUTS-3 units differently within a NUTS-2 division which would better reflect FUAs reality (for ex. in Germany or in Belgium), or though dividing certain current NUTS-3 units, for instance on the basis of NUTS 4 units (for ex. in France or in Spain, where departments and provinces are too huge to determine correctly big metropolitan areas and, the more so, large cities). This question has already been addressed in another ESPON Report. It would of course be ideal to recompose new NUTS-3 units from NUTS-5 units, but one can easily imagine the political difficulties and the scope of such a work. With all approximations implied in these conditions by such a work, we nevertheless try to close our study by a table (which in our opinion provides a very first, quite temporary, approach, and of which the methodology should be refined and specified) of what might be an analysis of the urban structures oriented toward an assessment of the realities of polycentricity. We were able to achieve this exercise, within the time limits of the project and in acceptable approximation conditions, only for the MEGAs (FUAs of more than 1 million inhabitants), through regrouping constituent cities in the case of polycentric metropolitan areas. Moreover, even at that level we were restricted by the frequent unavailability of important statistics at NUTS-3 level in some countries (for ex. absence of data permitting to estimate the product structure under the NUTS-2 level in Germany). We draw up hereafter a first list of suggested indicators, with their justification, although all of them could not be collected at this stage. Therefore, the structural table of European polycentricity is still very incomplete, even for the MEGAs. The indicators are divided in four groups: 238
239 Proposition for future research Size of the MEGA - population of the MEGA s FUA (or of all FUAs of polycentric MEGAs); - total GDP of the FUA, on the basis of GDP/inhab. values at NUTS-3 level and of the FUA s population or of the FUAs assigned to the NUTS levels making up the MEGA MEGA classification We have founded this classification taking into account different dimensions: - a dimension that reflects economic integration. The indexes considered are as follows: - the weight of the MEGA in terms of advanced services office location and their worldwide connectivity (GAWc group s works under direction of P.J. Taylor at the University of Loughborough); - location of headquarters of the main world firms, weighted by their turnover (those having their offices in Europe among the biggest 2000 world firms listed by Forbes), with distinction of financial, industrial, logistics and building, services and trade sectors; - the weight of cities in national command. Indeed, the geographical command structure of the firms of national scope might differ from those of worldwide scope. Cities without any significance from a point of view of international integration could inversely prove rather important in terms of hierarchical organization of the national economy. We tried a first approach (imperfect, since it still concerns world firms) of this problematic on the basis of the location of national subheadquarters of big world firms. - a dimension reflecting accessibility. The indexes considered are as follows: - Air space opening. The works by F. Dobruszkes (ULB, IGEAT) allow to know the number of regular direct connections (outside charter flights) between one city and all the others, as much at intra-european as worldwide level (both have to be distinguished, because worldwide hubs have a different meaning for the most transnationalised firms); - The gateway role of cities compared to the world s economy of transports, measured in first approximation by the importance of cities in containers transport; - Another index could not yet be calculated: it should measure the number of cities (weighted by their importance and the number of daily connections) accessible by rail within a determined duration of time (for ex. a two hours journey, an acceptable duration for business trips). - a dimension reflecting the patrimonial heritage and the quality of cultural supply. Those dimensions are known to take a considerable part in today s dematerialized economy and to represent major elements in the international attraction of cities and in the competition opposing them. The indexes considered are as follows: 239
240 Proposition for future research - The importance of the MEGA s patrimonial heritage (number of stars and quotations in the European Michelin Guides; importance of museums). These measurements, resulting from J.M. Decroly s works (ULB, IGEAT), can still be marred by some biases, notably due to the choice of a French source exclusively for tourist attractions. They will have to be refined, but already provide a first satisfying approximation of the reality; - One could also add the number of hotel nights. Within the framework of this report, we provide here a temporary image of these classifications through characterizing each MEGA, on each of the dimensions and subdimensions, by an index varying from 100 (the best position) to The MEGA s structure in view of today s competitive economy and the development of a knowledge economy. The considered indexes are as follows: - assessment (from value added statistics calculated by IGEAT on the basis of regional statistical data from EUROSTAT and national sources) of the share of the manufacturing sector in the FUA s economy (excl. agriculture); - assessment of the share of light industry (textile and clothing, food industry, wood and furniture, paper and publishing, diverse industries) in the industrial economy; - assessment of the share of financial and business services in the FUA s economy; - assessment of the share of public services (incl. health and education services) within the tertiary sector; - assessment of the share of hotels and restaurants in the FUA s economy; - assessment of the share of transport and communications in the FUA s economy; - assessment of the share of research and development activities in the FUA s economy; - one could add the number of quotations by authors working in the FUA in the international scientific literature Assessment of performances This analysis has not been conducted yet, but according to us it should include the following dimensions: - assessment of social performances (unemployment rate, share of inhabitants with university degrees; available income by inhabitant; ideally, scattering of incomes); - assessment of environmental performances. This point refers to a more in depth examination of the urban audit s data. - Assessment of economic performances (relative growth rate, either compared to the European mean or compared to the national average). 240
241 Proposition for future research MEGAs and polycentric MEGAs (ranking according to the population) MEGAs and polycentric MEGAs (ranking according to the GDP) Population Estimation of the GDP/inhab. Estimation total GDP Population Estimation of the GDP/inhab. Estimation total GDP UK London metropolitan area , UK London metropolitan area , DE Rhein-Ruhr , FR Paris , FR Paris , DE Rhein-Ruhr , NL Randstad Holland/Delta metropolis , IT(-CH) Milano metropolitan area , IT(-CH) Milano metropolitan area , NL Randstad Holland/Delta metropolis , PL-CZ Upper Silesian-Moravian metro. area , BE Belgian central metropolitan area , ES Madrid , DE Rhein-Main , BE Belgian central metropolitan area , ES Madrid , ES Barcelona metropolitan area , DE München-Augsburg , DE Rhein-Main , ES Barcelona metropolitan area , DE Berlin , DE Hamburg , GR Athinai , AT-SK Wien-Bratislava , IT Napoli metropolitan area , IT Roma , UK Birmingham metropolitan area , DE Berlin , AT-SK Wien-Bratislava , DE Stuttgart metropolitan area , DE München-Augsburg , DK-SE Öresund metropolitan area , IT Roma , DE Rhein-Neckar , FR-BE Lille transborder metropolitan area , UK Birmingham metropolitan area , BE-DE-NL Euroregio MAHL , PT Lisboa , DE Hamburg , BE-DE-NL Euroregio MAHL , DE Rhein-Neckar , GR Athinai , DK-SE Öresund metropolitan area , FR-BE Lille transborder metropolitan area , PL Warszawa , CH Zürich , DE Stuttgart metropolitan area , SE Stockholm , PT Lisboa , PL-CZ Upper Silesian-Moravian metro. area , UK Manchester metropolitan area , IT Napoli metropolitan area ,
242 Proposition for future research HU Budapest , NL(-BE) Noord-Brabant metropolitan area , UK Leeds-Bradford metropolitan area , PL Warszawa , UK Liverpool metropolitan area , UK Manchester metropolitan area , NL(-BE) Noord-Brabant metropolitan area , IT Torino metropolitan area , RO Bucuresti , FR Lyon metropolitan area , SE Stockholm , UK Leeds-Bradford metropolitan area , FR Lyon metropolitan area , IE Dublin , PT Porto metropolitan area , DE Nürnberg/Fürth metropolitan area , IT Torino metropolitan area , UK Liverpool metropolitan area , CZ Praha , HU Budapest , CH Zürich , FI Helsinki , UK Newcastle/Tyneside , IT Venezia-Padova metropolitan area , DE Nürnberg/Fürth metropolitan area , NO Oslo , UK Sheffield metropolitan area ,0 UK Portsmouth/Southampton metropolitan area ,6 Portsmouth/Southampton metropolitan UK area , FR Marseille-Aix-en-Provence , UK Nottingham/Derby metropolitan area , UK Nottingham/Derby metropolitan area , FR Marseille-Aix-en-Provence , CZ Praha , ES Valencia metropolitan area , UK Glasgow , IE Dublin , IT Firenze metropolitan area , IT Venezia-Padova metropolitan area , PT Porto metropolitan area , UK Glasgow , DE Bremen , FI Helsinki , DE Bielefeld/Detmold , ES Sevilla metropolitan area , DE Hannover , NL-DE Gelderland metropolitan area , UK Newcastle/Tyneside , PL Krakow , NL-DE Gelderland metropolitan area , DE Leipzig-Halle , CH-DE-FR Basel-Mulhouse metropolitan area , LV Riga , ES Valencia metropolitan area , FR-IT Nice Côte d'azur , DE Braunschweig-Wolfsburg , BG Sofia , FR-IT Nice Côte d'azur , DE Bielefeld/Detmold , UK Bristol metropolitan area , PL Lodz , LU-BE-FR- DE Luxembourg metropolitan area ,7 DE Saarbrücken-Forbach(DE-FR) , DE Saarbrücken-Forbach(DE-FR) , UK Cardiff/Wales Valleys metropolitan area , UK Sheffield metropolitan area ,
243 Proposition for future research IT Firenze metropolitan area , DE Leipzig-Halle , DE Bremen , UK Cardiff/Wales Valleys metropolitan area , GR Thessaloniki , CH-FR Genève-Annemasse , UK Bristol metropolitan area , PL Krakow , NO Oslo , ES Sevilla metropolitan area , DE Braunschweig-Wolfsburg , GR Thessaloniki , DE Hannover , RO Bucuresti , PL Gdansk , LV Riga , LU-BE-FR DE Luxembourg metropolitan area ,7 PL Gdansk ,7 CH-DE-FR Basel-Mulhouse metropolitan area , BG Sofia , CH-FR Genève-Annemasse , PL Lodz , Table 5 Ranking of the European MEGAs and polycentric MEGAs according to their population and GDP 243
244 Proposition for future research Total GDP Location of headquarters and presence of international services (average 1 and 2) 1.Ranking in international business services (average 1a and 1b) 1a,Ranking in international business services (according to GAWc) 1b.Ranking in international business services connectivity 2,Location of headquarters (All sectors) 2a,Location of headquarters (Finance) 2b,Location of headquarters (Manufacturing) 2c,Location of headquarters (Logistics and Building) 2d,Location of headquarters (Services and trade) Air connectivity (average 3a and 3b) 3a, Air connectivity outside the European liberalised airspace (c) 3b, Air connectivity inside the European liberalised airspace (c) Conteneurs gateway function (d) Heritage value (in italics, touristic value only)(average 5a and 5b) 5a.Touristic values 5b. Importance of the museums MEGAs and Polycentric MEGAs (London metropolitan area = 100) AT-SK Wien-Bratislava BE Belgian central metropolitan area BE-DE-NL Euroregio MAHL BG Sofia CH Zürich CH-FR Genève-Annemasse CH-DE-FR Basel-Mulhouse metropolitan area CZ Praha DE Rhein-Ruhr DE Rhein-Main DE Berlin DE München-Augsburg DE Hamburg DE Rhein-Neckar DE Stuttgart metropolitan area DE Nürnberg/Fürth metropolitan area DE Leipzig-Halle DE Bielefeld/Detmold DE Bremen DE Braunschweig-Wolfsburg DE Hannover DE Saarbrücken-Forbach(DE-FR) DK-SE Öresund metropolitan area ES Madrid ES Barcelona metropolitan area ES Valencia metropolitan area ES Sevilla metropolitan area FI Helsinki
245 Proposition for future research FR Paris FR-BE Lille transborder metropolitan area FR Lyon metropolitan area FR Marseille-Aix-en-Provence FR-IT Nice Côte d'azur GR Athinai GR Thessaloniki HU Budapest IE Dublin IT(-CH) Milano metropolitan area IT Napoli metropolitan area IT Roma IT Torino metropolitan area IT Venezia-Padova metropolitan area IT Firenze metropolitan area LU-BE-FR-DE Luxembourg metropolitan area LV Riga NL Randstad Holland/Delta metropolis NL(-BE) Noord-Brabant metropolitan area NL-DE Gelderland metropolitan area NO Oslo PL-CZ Upper Silesian-Moravian metro. area PL Warszawa PL Lodz PL Krakow PL Gdansk PT Lisboa PT Porto metropolitan area RO Bucuresti SE Stockholm UK London metropolitan area UK Birmingham metropolitan area UK Manchester metropolitan area UK Leeds-Bradford metropolitan area UK Liverpool metropolitan area UK Newcastle/Tyneside
246 Proposition for future research UK Sheffield metropolitan area UK Portsmouth/Southampton metropolitan area UK Nottingham/Derby metropolitan area UK Glasgow UK Cardiff/Wales Valleys metropolitan area UK Bristol metropolitan area (a) The worldwide business services connectivity of some polycentric metropolitan areas (mainly Randstatd Holland, could be slightly overestimated, as some links could be intra-mega links. (b) The aerian connectivity of Bucharest and Sofia outside Europe are overestimated, and the intra-european underestimated, as Romania and Bulgaria are outside the European liberalised airspace. (c) Average between an index based on the number of seats and on the number of regular links (d) London's gateway function is strongly underestimated as ports like Felixstowe are located outside the limits of the MEGA Table 6 Qualitative ranking of the main MEGAs and polycentric MEGAs (Business and Transport international connectivity and heritage) 246
247 References Map of the first component analysis The objective of this map is to illustrate the urban hierarchy of the major FUA in Europe. This urban hierarchy has been evaluated at the light of two types of variables: the level of internationalization, on one hand, and the sectorial structure of the economy, on the other hand. On the one hand, the level of internationalization includes the headquarters of international firms, the location of business services firms, the air connectivity, the Conteneurs gateway function and the touristical value. All these criteria have been integrated in the analysis in both absolute and relative (according to the population) terms: a high relative internationalization does not mean the same in some major world cities, such as London and Paris, or in more modest cities. On the other hand, the economic structure includes the share of manufacturing, of light industry, of business and financial services, of public services, of hotels and restaurants as well as transportation in the GDP. All these indicators (20) have been synthetized by a Principal component analysis. The first component of the analysis takes into account 38% of the intital variance, while the second, the third and the fourth only account for 14%, 12% and 10% of the information. Because of the high percentage taken into account by the first component and the big gap between the first and the second component, we only take into consideration this first component to establish the European urban hierarchy. Indeed, as shown on the graph, the first component is correlated with the indicators of high internationalization level: location of headquarters or businesse firms at both absolute and relative terms; air connectivity outside Europe ; and in terms of structure, the share of business and financial services in the GDP. On the map, the size of the circle represents the total GDP, and the colour, the score on the first component of the Principal Component analysis. It illustrates the high concentration of major commanding and internationalized cities in the blue banana. We can also observe the quadrialteral of the major internationalized poles of Europe, whose vertex are London, Paris, Amsterdam and Frankfurt. Zurich and Luxemburg are also very internationalized but, especially for the second, it should be relativized by the small size of the FUA. Outside 247
248 References Central Europe, only the nordic capitals, Wien and Madrid reach a level of internationalization above the average. 1.0 Air connectivityeurope/inhab Ranking in international 0.8 business services/inhab CPII Heritage value/inhab GDPhab 0.4 Part of the transports in GDP Air connectivity outside Conteneurs gateway Europe/inhab 0.2function/inhab Part of business services Part of the light industry Part of the public services Location and of finance ingdp Part of hotels and in the tertiary sector Conteneurs gateway headquarters/inhab restaurants 0.0 in the GDP Heritage value function (d) Ranking in international business 0.8 services 1.0 Part of manufacturing in the GDP Air connectivity Europe Air connectivity outside Europe/inhab Location of headquarters Total GDP CPI Figure 33 Relation between the intial indicators and the first two components of the PCA analysis on the major FUA. 248

249 References Figure 34 International connections and economic structure of the biggest European FUAs 249
250 References Part of manufacturing in the nonagricultural GDP Part of the light industry in manufacturing Part of business services and finance in the nonagricultural GDP Part of the public services in the tertiary sector Part of hotels and restaurants in the non-agricultural GDP Part of the transports in the nonagricultural GDP AT-SK Wien-Bratislava BE Belgian central metropolitan area BE-DE-NL Euroregio MAHL (a) BG Sofia CH Zürich CH-FR Genève-Annemasse CH-DE-FR Basel-Mulhouse metropolitan area CZ Praha DE Rhein-Ruhr DE Rhein-Main DE Berlin DE München-Augsburg DE Hamburg DE Rhein-Neckar DE Stuttgart metropolitan area DE Nürnberg/Fürth metropolitan area DE Leipzig-Halle DE Bielefeld/Detmold DE Bremen DE Braunschweig-Wolfsburg DE Hannover DE Saarbrücken-Forbach(DE-FR) DK-SE Öresund metropolitan area ES Madrid ES Barcelona metropolitan area ES Valencia metropolitan area ES Sevilla metropolitan area FI Helsinki FR Paris FR-BE Lille transborder metropolitan area FR Lyon metropolitan area FR Marseille-Aix-en-Provence FR-IT Nice Côte d'azur GR Athinai GR Thessaloniki HU Budapest IE Dublin IT(-CH) Milano metropolitan area IT Napoli metropolitan area IT Roma IT Torino metropolitan area IT Venezia-Padova metropolitan area
251 References IT Firenze metropolitan area LU-BE-FR- DE Luxembourg metropolitan area(b) LV Riga NL Randstad Holland/Delta metropolis NL(-BE) Noord-Brabant metropolitan area NL-DE Gelderland metropolitan area NO Oslo PL-CZ Upper Silesian-Moravian metro. area PL Warszawa PL Lodz PL Krakow PL Gdansk PT Lisboa PT Porto metropolitan area RO Bucuresti SE Stockholm UK London metropolitan area UK Birmingham metropolitan area UK Manchester metropolitan area UK Leeds-Bradford metropolitan area UK Liverpool metropolitan area UK Newcastle/Tyneside UK Sheffield metropolitan area Portsmouth/Southampton metropolitan UK area UK Nottingham/Derby metropolitan area UK Glasgow UK Cardiff/Wales Valleys metropolitan area UK Bristol metropolitan area (a) Belgian and Dutch sides only (b) Grand-Duchy and Belgian side only Table 7 Main characteristics of the economic structure of the MEGAs and polycentric MEGAs 251
252 References 9.2 Recommendations for future researches The work of Espon like ours has been hampered by the lack of data. In particular there is a strong need for data or indices on industry and therefore Eurostat should provide a detailed information on production structure or at least a detailed repartition of the employment, possibly beyond the NUTS-3 level. It would also be interesting to have a demographic indicator, for instance data on migration that would distinguish between MUAs and FUAs. We re also in need for environment indices more appropriate than those of the Urban audit which has many missing data and doesn t use clearly delimited areas. It might perheaps be interesting somehow to establish a collaboration between Espon and the Urban Audit. 252
253 References 10. References - Behrens, A. (2003), How rich are Europe s regions. Experimental calculations, Statistics in Focus. General statistics. Theme 1, Eurostat, 6, p Biot, V. (2005), Synthesis of comments on the final report ESPON 1.1.1, The role, specific situation and potentials of urban areas as nodes in a polycentric development, Synthesis of comments from ESPON Contact Points on ESPON first round projects, p.10-33, - Cabus, P. and Saey, P. (1997), Consistentie en coherentie van het Ruimtelijk Structuurplan Vlaanderen in het licht van de actuele stedelijke en regionaaleconomische ontwikkeling, unpublished report for E. Baldewijns, Flemish Minister for Public Works, Transport and Regional Planning. - Davezies, L. (2005), My territory is rich...: Selon quels indicateurs? Décentralisation: enjeux et débats, Informations sociales, 121, p Florida, R. (2002), The Rise of the Creative Class: And How It s transforming work, Leisure, Community and Everyday Life, New York, Basic Books. - Krugman, P. (1991), Geography and Trade, MIT Press. - NORDREGIO et al. (2005), The role, specific situation and potentials of urban areas as nodes in a polycentric development, ESPON report , - Sassen, S. (1991), The Global City: New York, London, Tokyo, New York, Princeton University Press. - Taylor, P.J. (2003), World City networks: a global urban analysis, London, Routledge. - Veltz, P. (1996), Mondialisation, villes et territoires. L économie d archipel, Paris, Presses Universitaires de France. 253
Conclusions and Controversies about the Effectiveness of School Resources
 Conclusions and Controversies about the Effectiveness of School Resources Eric A. Hanushek Both the U.S. public and U.S. policymakers pursue a love-hate relationship with U.S. schools. While a majority
Examining Quality Culture: Part 1 Quality Assurance Processes in Higher Education Institutions. By Tia Loukkola and Thérèse Zhang
 E U A P U B L I C A T I O N S 2 0 1 0 Examining Quality Culture: Part 1 Quality Assurance Processes in Higher Education Institutions By Tia Loukkola and Thérèse Zhang Copyright by the European University
Decentralisation at a crossroads
 Decentralisation at a crossroads Territorial reforms in Europe in times of crisis Council of European Municipalities and Regions October 2013 About CEMR The Council of European Municipalities and Regions
How do firms agglomerate? A study of FDI in France
 Regional Science and Urban Economics 34 (2004) 27 54 www.elsevier.com/locate/econbase How do firms agglomerate? A study of FDI in France Matthieu Crozet a, Thierry Mayer b, *, Jean-Louis Mucchielli a a
How To Understand The Labour Market Outcomes Of Education In Europe
 From education to working life The labour market outcomes of vocational education and training Luxembourg: Publications Office of the European Union, 2012 A great deal of additional information on the
Measuring child poverty
 UNICEF Innocenti Research Centre Report Card 10 Measuring child poverty New league tables of child poverty in the world s rich countries Innocenti Report Card 10 was written by Peter Adamson. Two background
Europeans and Their Forests
 Ewald Rametsteiner, Florian Kraxner Europeans and Their Forests What Do Europeans Think About Forests and Sustainable Forest Management? FAO/UNECE FOREST COMMUNICATORS NETWORK United Nations Economic Commission
The Systems of Innovation Approach and Innovation Policy: An account of the state of the art
 The Systems of Innovation Approach and Innovation Policy: An account of the state of the art By Charles Edquist Home page: http://www.tema.liu.se/tema-t/sirp/chaed.htm E-mail: [email protected]
THE HOUSING WE D CHOOSE: a study for Perth and Peel
 THE HOUSING WE D CHOOSE: a study for Perth and Peel Report May 2013 Commissioned by GOVERNMENT OF WESTERN AUSTRALIA Department of Housing Department of Planning Co-contributors / industry partners Research
WORKING PAPER SERIES EUROPEAN WOMEN WHY DO(N T) THEY WORK? NO 454 / MARCH 2005. by Véronique Genre Ramón Gómez Salvador and Ana Lamo
 THEY WORK? NO 454 / MARCH 2005. by Véronique Genre Ramón Gómez Salvador and Ana Lamo") WORKING PAPER SERIES NO 454 / MARCH 2005 EUROPEAN WOMEN WHY DO(N T) THEY WORK? by Véronique Genre Ramón Gómez Salvador and Ana Lamo WORKING PAPER SERIES NO. 454 / MARCH 2005 EUROPEAN WOMEN WHY DO(N T)
WORKING PAPER SERIES NO 454 / MARCH 2005 EUROPEAN WOMEN WHY DO(N T) THEY WORK? by Véronique Genre Ramón Gómez Salvador and Ana Lamo WORKING PAPER SERIES NO. 454 / MARCH 2005 EUROPEAN WOMEN WHY DO(N T)
Why we need European cultural policies
 european cultural foundation www.eurocult.org Why we need European cultural policies by Nina Obuljen the impact of EU enlargement on cultural policies in transition countries Why we need European cultural
IMPACT OR ILLUSION? RANKINGS IN INSTITUTIONAL STRATEGIES AND PROCESSES: EUA PUBLICATIONS 2014 BY ELLEN HAZELKORN, TIA LOUKKOLA, THÉRÈSE ZHANG
 EUA PUBLICATIONS 2014 RANKINGS IN INSTITUTIONAL STRATEGIES AND PROCESSES: IMPACT OR ILLUSION? BY ELLEN HAZELKORN, TIA LOUKKOLA, THÉRÈSE ZHANG With the support of the Lifelong Learning programme of the
The Single European Market 20 years on Achievements, unfulfilled expectations & further potential
 EU Monitor European integration October 31, 213 Author Stefan Vetter +49 69 91-21261 [email protected] Editor Barbara Böttcher Deutsche Bank AG DB Research Frankfurt am Main Germany E-mail: [email protected]
University Autonomy. The Scorecard. By Thomas Estermann, Terhi Nokkala & Monika Steinel
 University Autonomy in EuropE II The Scorecard By Thomas Estermann, Terhi Nokkala & Monika Steinel Copyright 2011 European University Association All rights reserved. This information may be freely used
Are Students Ready for a Technology-Rich World?
 Programme for International Student Assessment Are Students Ready for a Technology-Rich World? What PISA Studies Tell Us OECD ORGANISATION FOR ECONOMIC CO-OPERATION AND DEVELOPMENT ORGANISATION FOR ECONOMIC
Employment Policy Department EMPLOYMENT Working Paper No. 162. At work but earning less: Trends in decent pay and minimum wages for young people
 Employment Policy Department EMPLOYMENT Working Paper No. 162 2014 At work but earning less: Trends in decent pay and minimum wages for young people Damian Grimshaw Employment and Labour Market Policies
Public Procurement as a Driver of Innovation in SMEs and Public Services. Guidebook Series. How to support SME Policy from Structural Funds
 Guidebook Series How to support SME Policy from Structural Funds Public Procurement as a Driver of Innovation in SMEs and Public Services Enterprise and Industry 8 3 Guidebook Series How to support SME
CREATING AN ENGAGED WORKFORCE
 Research report January 2010 CREATING AN ENGAGED WORKFORCE CREATING AN ENGAGED WORKFORCE FINDINGS FROM THE KINGSTON EMPLOYEE ENGAGEMENT CONSORTIUM PROJECT This report has been written by: Kerstin Alfes,
Despite the enormous sums of money being spent on transportation
 131 This article presents results from the first statistically significant study of traffic forecasts in transportation infrastructure projects. The sample used is the largest of its kind, covering 21
INSPECTION REFORMS: WHY, HOW, AND WITH WHAT RESULTS. By Florentin Blanc
 INSPECTION REFORMS: WHY, HOW, AND WITH WHAT RESULTS By Florentin Blanc TABLE OF CONTENTS EXECUTIVE SUMMARY... 2 CHAPTER 1. INTRODUCTION - THE INSPECTIONS ISSUE... 4 1. What are inspections and enforcement
HOW TO MANAGE JOINT STUDY PROGRAMMES?
 HOW TO MANAGE JOINT STUDY PROGRAMMES? Guidelines and Good Practices from the JOIMAN Network Document developed within the framework of the JOIMAN Network by the joint effort of the following partners:
Potential Migration from Central and Eastern Europe into the EU-15 An Update
 Potential Migration from Central and Eastern Europe into the EU-15 An Update Report for the European Commission, DG Employment and Social Affairs Patricia Alvarez-Plata Herbert Brücker (Coordinator) Boriss
BEYOND MAINSTREAM FRONTRUNNERS POTENTIALISTS TRADITIONALISTS HESITATORS INDUSTRY 4.0. The new industrial revolution How Europe will succeed
 BEYOND MAINSTREAM POTENTIALISTS FRONTRUNNERS TRADITIONALISTS HESITATORS The new industrial revolution How Europe will succeed MARCH 2014 THE BIG 3 1 40% is the share of worldwide manufacturing (a total
Build a Ladder to the Stars
 Build a Ladder to the Stars Report from the University of Oslo s Strategic Advisory Board 2012 14 Contents 04 Preamble: The International Strategic Advisory Board (SAB) 11 Part 3: Profile Dimension Analysis
DEFINE THEMATIC REPORT: FUNDING FOR EXCELLENCE
 DEFINE PROJECT DEFINE THEMATIC REPORT: FUNDING FOR EXCELLENCE BY ENORA BENNETOT PRUVOT AND THOMAS ESTERMANN Funding for excellence Contents 1. Introduction... 3 2. Scope of the report... 3 3. Excellence
Central European Corporate R&D Report 2015
 Central European Corporate R&D Report 2015 Partner s Foreword Investments in research and development are an indisputable driving force behind long-term economic growth. Empirical analyses show that when
Digitizing Public Services in Europe: Putting ambition into action
 Digitizing Public Services in Europe: Putting ambition into action 9 th Benchmark Measurement December 2010 Prepared by Capgemini, IDC, Rand Europe, Sogeti and DTi for: European Commission, Directorate
Information Management 2MODULE. A System We Can Count On. Assessing Need
 2MODULE Information Management A System We Can Count On Assessing Need The Health Planner s Toolkit Health System Intelligence Project 2006 Table of Contents Introduction: The Planner s Challenge..........
Forced labour and trafficking in Europe: how people are trapped in, live through and come out
 WP. 57 Working Paper Forced labour and trafficking in Europe: how people are trapped in, live through and come out by Beate Andrees International Labour Office Geneva February 2008 Copyright International
RESEARCH DISCUSSION PAPER
 Reserve Bank of Australia RESEARCH DISCUSSION PAPER Urban Structure and Housing Prices: Some Evidence from Australian Cities Mariano Kulish, Anthony Richards and Christian Gillitzer RDP 2011-03 URBAN STRUCTURE