Best Companies to Work For, India By Business Today and PeopleStrong in association with Naukri.com
|
|
|
- Albert Caldwell
- 7 years ago
- Views:
Transcription
1 Best Companies to Work For, India By Business Today and PeopleStrong in association with Naukri.com

2 Contents 1. Methodology Survey approach and respondents profile Sample Size and Representation Ranking The Sampled Respondents Profile Organizational Spread Geographic Spread Age, Experience and Education Type of Households and Income Levels Industry Sectors Kind of Companies represented Ranking of Companies The Overall Ranking (across all sectors) Ranking on each of the 6 parameters (across all sectors) Variation of Rankings by regions Variation of Rankings by different age groups Variation of Rankings by type of companies Variation of Rankings by different industry segments Ranking by BPO Sector Respondents Ranking by BFSI Sector Respondents Ranking by Core Sector Respondents Ranking by Engineering and Automotive Sector Respondents Ranking by Hospitality Sector Respondents Ranking by Manufacturing Sector Respondents Ranking by Pharma and Healthcare Sector Respondents Ranking by Software and IT Sector Respondents Ranking by Telecom and Allied Sector Respondents Ranking by Others and Diversified Sector Respondents Ranking of Companies within Sector Sector Business Process Outsourcing (BPO/ KPO/ ITES) Sector BFSI (Banking, Financial Services, Insurance) Sector Core Sector (Oil & Gas/ Power/ Steel/ Minerals) Sector Engineering and Automotive Sector Hospitality (Includes Aviation, Tours & Travels, Hotels) Sector Other Manufacturing (FMCG, Durables, Other non-engineering) Sector Pharma and Healthcare Sector Software and IT Sector Telecom and Allied Sector Others and Diversified Non Ranking Parameters What makes a company a fantastic place to work in? Rating of own company on the five factors identified What makes a company attractive? What upsets employees strongly enough to start contemplating change? Satisfaction in current job role Adherence to Ethical Values Relationship with the immediate boss/ supervisor Satisfaction level with certain key issues at work

3 1. Methodology "The Best Companies to work for" is an annual survey conducted by Business Today and PeopleStrong HR Services that aims to understand the Perceptions and Aspiration of India's Talent across industries. It gives a great insight into how Industry at large and in specific verticals can align their Employer Brands to how the workforce of India is aspiring and thinking. "Best Companies to Work for in India", as a feature, has been institutionalized over the past decade by Business Today. The survey aims to provide a feedback to the companies on what the employee marketplace thinks about various companies, what factors are considered important, what factors attract people, what factors demoralize people, and other inputs in an unbiased representative manner. The cornerstones of this research are the respondents who work in different types of organizations. For the last 11 years, we have sought responses and inputs from the workforce community directly through a large database of employees across diverse spectrum of vintage, age, industry, location and job grades. This survey primarily aimed to capture the Aspiration and Perception across key variables of Organizational interface with an employee. With this year, we induct a platform for a reality check through HR Metrics with the Employers as well. To include the "The Employers' Perspective", key Metrics of HR across the employee influencing variables have been included. These metrics complement the variables that an Employee experiences and provides the inputs on the key influencers for the employee Perceptions and Aspirations. Like last year, Business Today and PeopleStrong decided to continue with the methodology of inviting employees of any and all kinds of companies to participate in an open online survey in association with Naukri.com. This allows all kinds of salaried employees from different kinds of companies to participate and express their views and make the survey participation wider and more representing. The survey was conducted using an internet based self-filling questionnaire, where the questionnaire was sent to about 4 million people registered on the Naukri.com platform. To cross-check the authenticity of the respondents and to ensure that quality of responses were of acceptable standards, validation checks were done by Naukri team and PeopleStrong technology team by calling back a certain proportion of the respondents randomly. The PeopleStrong Study Team then constructed a ranking of companies and an analysis of various aspects that go into making a company a great place to work in. This study does not report on specific aspects of any company (positive or negative). The Best Companies to Work For rankings are done across industries and within specific industry/ economic sectors. The study further reports on the respondent employees satisfaction and aspirations, but at a sector level and at the overall level only, not at a company level. Differences of views across different geographies and demographic segments are also presented, highlighting the differences between various segments Survey approach and respondents profile Internet was chosen as the medium of survey to get the highest bang for the buck deeper reach at comparable costs. We leveraged the rich database of Naukri.com to reach out to approximately 4 million people. Further, online research is known to get more honest opinions, though there is a limitation that the questionnaire needs to be short and easy to understand (which in a way leads to better responses and therefore better quality of data collection). Online surveys are known to often achieve better randomness in collection of responses than land surveys. To conduct this survey, PeopleStrong used Naukri.com s online panels (of over 4 million Indian respondents), which permitted us to target the survey to only the relevant audience. Mailers and other forms of online communications were sent to the respondents through Naukri. About 20,000 of these potential respondents (0.5%) came to the survey page. Of these, 6,320 respondents (32%) actually filled out the questionnaire. After doing thorough scrutiny and cleaning of these respondent s questionnaires, we got a final reportable sample of 6,310. 2

4 Data authenticity was ensured in two ways a) the questionnaire design itself had built in verifications which rejected responses with contradictory/ incomplete information and b) a verification back check of about 10% of the accepted responses. These 6,310 employee respondents, when profiled, were found to be highly representative of the great Indian workplace as depicted in the diagram below: Demographic Sub-categories Percentage (%) City Type 5 Metro Cities 38 City Type 5 Mini Metros 18 City Type Other Cities 44 Region North 27 Region South 29 Region East 14 Region West 20 Region Central 9 Gender Male 92 Gender Female 8 Age 24 years or less 16 Age yrs 40 Age yrs 18 Age yrs 15 Age yrs 8 Age yrs 3 Annual Income Rs. 400,000 and below 61 Annual Income Rs Annual Income Rs Annual Income Rs and above 9 Household type Single income 78 Household type Double Income 16 Household type More than 2 earning members 6 Educational Qualifications Below graduate 4 Educational Qualifications Diploma holder 12 Educational Qualifications Graduate 43 Educational Qualifications Post graduate 38 Educational Qualifications Others 3 Experience at work 1-2 years 16 Experience at work 3-4 years 21 Experience at work 5-7 years 23 Experience at work 8-15 years 21 Experience at work More than 15 years 19 Company Type Public Sector 10 Company Type MNCs 34 Company Type Indian private sector 40 Company Type Others 15 Industry Engineering and Automotive 11 Industry BPO, KPO and ITeS 5 Industry Pharma and Healthcare 7 Industry Telecom 5 3

5 Industry Manufacturing 6 Banking, financial services and Industry insurance 9 Industry Core sector- Oil, Gas and Power 6 Industry Hospitality 2 Industry Software and IT 13 Industry Others and Diversified 35 Overall, the respondent base this year is relatively younger and more Indian companies - possibly a result of a relatively more spread out (non-metro) geographical base. It appears that due to our accessing larger survey panels, which had a more geographically spread out respondent base, despite a similar sample size compared to the last year (6176 respondents) we have been able to achieve a better representation of the Indian urban corporate employee base this year Sample Size and Representation An often misunderstood factor is the sample requirements for assessing the representative-ness of a sample. The popular perception is that it must be a certain proportion of the population it seeks to represent. The reality is somewhat different. The most important factor is the randomness of a sample. A sample of 10,000 respondents from three companies is highly biased and not representative at all. On the other hand, a sample of just 2,000 respondents from 400 different companies is highly representative. Randomness is thus the first and the most important criteria. Once randomness is achieved, the sample must still have two important caveats The confidence level and the confidence interval (expected error of the estimate). The confidence interval (standard error) is the expected range of error. For example, if you use a confidence interval of 5 and 53% percent of your sample picks an answer you can be "sure" that if you had asked the question of the entire relevant population between 48% (53-5) and 58% (53+5) would have picked that answer. The confidence level tells you how sure you can be. It is expressed as a percentage and represents how often the true percentage of the population who would pick an answer lies within the confidence interval. The 95% confidence level means you can be 95% certain; the 99% confidence level means you can be 99% certain. Most researchers use the 95% confidence level. The graphs below depict, how, depending on the confidence level and the confidence interval (standard error), the sample requirements can vary. A few things that the above diagram illustrates: 1. The sample requirement flattens as soon as you reach a certain population. In general, beyond a population of 100,000, as long as the sample is randomly selected, the sample requirement does not increase further. 4

6 2. The higher the confidence level required, and the lower the standard error desired, the higher will be the sample requirements. Most surveys accept that beyond 95% confidence level and 5% standard error, the trade-off between the high cost of survey and the precision enhancement are not worthwhile. For instance, the sample required for 95% confidence level and 5% standard error for a population of 100,000 is around 660. As one increases the precision to 99% confidence level and 2.5% standard error, the sample requirement jumps to 2,647 a four-fold increase in the required sample size. Such precision or higher is usually recommended in research of rare diseases or similar such issues. For this survey, any segment with a sample size of around 600 random selections has an outstanding representation. Segments with sample size of 200 random selections are also good samples because they give us a confidence level of 90% with a 5% standard error. Even a segment of 100 random selections give us a confidence level of 90% with an 8% standard error. We recommend that we do not report for any segment where the sample is less than 150 with 90% confidence level with 6% confidence interval Ranking We have asked the respondents to select and rank the 5 companies which in their opinion are the best companies to work in. This exercise would define the employee s aspirations. Respondents rank companies on various parameters. Rank 1 has higher weight as compared to rank 2, and so on. Also, the gap between rank 1 and rank 2 is considered to be more significant than the gap between rank 2 and rank 3, and so on. This is because the top ranks stand out and beyond a few ranks all other ranks are deemed to be also ran, in terms of perceptions. This difference is implemented by using 90% rule, wherein rank 2 gets 90% of the weight as rank 1, and rank 3 gets 90% of the weight given to rank 2, and so on. Therefore, if a respondent is selecting 5 companies (A, B, C, D and E) as ranks 1, 2, 3, 4 and 5 from the universe, the weighted score for each of these companies, will be as follows (with the 90% rule): A B C D E Once rank scores were computed, the top ranked company was given an index score of 100 and the scores obtained by the other companies were indexed to the score of the top ranked company. We have collected data on 7 HR metrics from the top 10 companies of each sector. These companies are identified from our analysis in phase 1. The metrics are as follow: i. Early Attrition= employees leaving in initial 6 months/total employees ii. Training man-hours = total training man-hours/total available man-hours iii. Training penetration = total employees attending training/ total employees iv. Cost per hire v. Average TAT vi. Promotion percentage = total number of promotions/total eligible employees for promotion vii. Internal growth and development = total positions closed through internal job posting/total positions Some additional metrics are: viii. Total HR headcount ix. Total employee headcount x. Absence rate (%age) The analysis of each of the metric is done on the basis of its difference from the best of the lot. The best performing companies on the parameters is given 1 and the worst is given 5. After collecting the data points for a particular metric for the top ten companies of a particular sector, we identified the best and the worst performer. We took the best one as our TARGET and used the formula of (maxmin)/5 to come up with the intervals. Thereafter, we divided the 10 data points into 5 buckets with a 5

7 common difference of the derived value. The companies lying in the best bracket gets 1 and the worst would get 5 and so on. This exercise was repeated for all the metrics. At the end we got the grades for all the 10 companies across all HR metrics. Given that all the metrics have equal weightage, we took out the average of each of the each company on the metrics. All companies got a cumulative score. These score were arranged in ascending order and given ranks from Overall results We got a rank from 1-10 on the basis of employee survey analysis and another set of ranks from 1-10 from the metric analysis. Given that employee survey has 95% and metrics have 5% weightage, we weighed both the ranks in this proportion to come up with the final ranks. 6

8 2. The Sampled Respondents Profile The survey was conducted during the period of 15 th March- 24 th April, 2013, and was open for about 40 days. The total number of respondents surveyed was 6,310 of which 8% were women. The objective of the sampling was to get a representative randomized sample, which would be as widely spread as possible. The objective was to have adequate representation of various geographies, a large number of companies, at least 7-8 key industry sectors, various functions, age groups and experience on the job. For all the important segments under consideration the target was to have 90% confidence level and 6% standard error. Accordingly, we recommend not reporting the findings of any segment where the sample representation is of less than 150 respondents Organizational Spread The reported sample respondents in this year s survey came from over 5070 different companies (compared to 4436 companies last year). This is truly well spread. There were only 2 companies with more than 20 respondents and only 11 with more than Geographic Spread The survey respondents were spread over 300 cities and towns of India. The five major metros (Mumbai, Chennai, Bangalore, Kolkata and Delhi) accounted for 38%, the 5 mini metros (Hyderabad, Pune, Coimbatore, Chandigarh and Ahmedabad) accounted for 18%, and the other cities accounted for 44% of the respondents. Region wise, North, South, and West accounted for 27%, 29% and 20% of the respondents. The East accounted for 14% and Central accounted for 9% of the sample base. The key urban clusters in terms of representation were: Mumbai-Pune- Thane The NCR (Delhi, Faridabad, Gurgaon, Noida and Ghaziabad) South Majors (Bangalore, Chennai, Hyderabad) 1,264 East Majors (Kolkata, Bhubaneshwar) The leading cities in terms of respondents were - Mumbai, Delhi, Hyderabad, Bangalore, Chennai, Gurgaon, Kolkata, Pune, Ahmadabad, Jaipur, Lucknow, Chandigarh, Indore, Bhubaneswar, Nagpur, Coimbatore, Noida, Gurgaon, Surat, and Vishakhapatnam. 7

9 Respondents by Type of cities and Regions Maximum participation has come from the North and the South Regions with 29% and 27% respectively. The spread across regions is quite balanced except from the Central zone where only 9% response rate is recorded. The 5 metro cities have contributed 38% of the responses as compared to the 5 mini metros with 18% responses. Maximum responses (44%) have come from the rest of the cities in India. 8

10 2.3. Age, Experience and Education The bulk of the respondents were young, with almost 40% of them being between years of age. Except for the 46 years and above age group all the other age group respondents were almost evenly distributed. Almost 40% of the respondents had over 8 years of work experience. Almost 1/3 rd of them (37%) were relatively inexperienced with less than 4 years of work experience. The spread across the experience brackets was quite balanced. The respondents were almost equally distributed across the various years of experience brackets. Just under half of the respondents (43%) were graduates and over 1/3 rd of them (38%) were post graduate. In terms of stream of education, almost 2/3 rd of the respondents (64%) had a professional degree. Only 4% of the respondents were educated below graduation level. 9


11 2.4. Type of Households and Income Levels Almost 3/4 th of the respondents (77%) were sole earners of their respective families. 16% came from double income households and 6% came from households which had more than 2 earning members. 3/5 th of the respondents earned less than Rs 400,00 per annum, whereas only 9% respondents earned more than Rs 12,00,000 per annum. 10

12 2.5. Industry Sectors 9 out of the 10 broadly defined industry sectors had good representation and reported sample of over 150 each (the only exception being the hospitality sector with a sample size of 148). Almost 1/3 rd of the responses (33%) came from the new age industry sectors like BFSI, Software and IT, BPO and Telecom, though a good 29% of the respondents came from the mainline conventional industries like Engineering and Automotive, Core sector, Manufacturing and Pharma & Healthcare. Other sectors and diversified companies constituted the remaining 38% of the respondent sample. The industry sector-wise reported samples were as follows: Industry Reported Sample Others and Diversified 2230 Software and IT 840 Engineering and Automotive 705 Banking, Financial Services and Insurance 543 Pharma and Healthcare 468 Core Sector- Gas, Power and Steel 397 Manufacturing 357 BPO, KPO and ITeS 313 Telecom and allied 309 Hospitality 148 Total

13 2.6. Kind of Companies represented Indian private companies account for the bulk 40% of the respondents, with 10% also coming from the PSU sector. MNCs accounted for almost 1 in 3 of all respondents (34%). 12

14 3. Ranking of Companies This chapter addresses the responses to the question - Your Rankings on the Best Companies to work in (Overall across sectors). Over here, we asked the respondents to select and rank the 5 companies which in their opinion are the best companies to work in. Once they selected these companies, we asked them to give their views on how they would rank them on each of the five factors specified. The specific question asked was Among all the companies that you know of in India, what are the top 5 dream companies that you would want to work for? This was followed by the question Which company would you rank the best on each of the factors? The follow up question was asked only for the top 3 companies of the 5 selected by the respondent in the first question The Overall Ranking (across all sectors) Among all the companies that you know of in India, what are the top 5 dream companies that you would want to work for? On compilation of the responses of all the sample respondents, we found that Google emerged as the Best Company to Work For amongst all the companies. The company had only 0.5 relative index point lead over the second ranked company Accenture. TCS, Infosys and L&T followed as the distant 3 rd, 4 th and the 5 th ranked best companies to work for. 13

15 Rank Company Name Absolute Index Relative Index 1 Google Accenture TCS Infosys Technologies Larsen & Toubro BHEL IBM Tata Motors Wipro Hindustan Unilever Microsoft Tata Steel ABB Airtel State Bank of India ONGC Axis Bank Mahindra and Mahindra Indian Railways ACC HDFC Bank HCL Technologies Delhi Metro Rail Corporation Limited Abbott Laboratories Vodafone ICICI Bank Here sample means the reported no. of respondents who chose the company as the best company to work for. 14

16 3.2. Ranking on each of the 6 parameters (across all sectors) Which company would you rank the best on each of the (6) factors? There are not very significant variations in the rankings across the five factors, except some marginal changes for a few factors. For instance, BHEL is getting rank 6 (and not rank 5) on the parameter financial compensation. The top ten companies and their rank index scores across the five factors are presented below: Rank Company Name Relative Index Career Growth Prospects Financial Compensation Work Life Balance Performance Evaluation Stability Other HR Practices 1 Google Accenture Overall 3 TCS Infosys Technologies Larsen & Toubro BHEL IBM Tata Motors Wipro Hindustan Unilever There were 47 odd distinct respondent segments with significant sample sizes. We examined how the ranking varied across the key different segments. 15

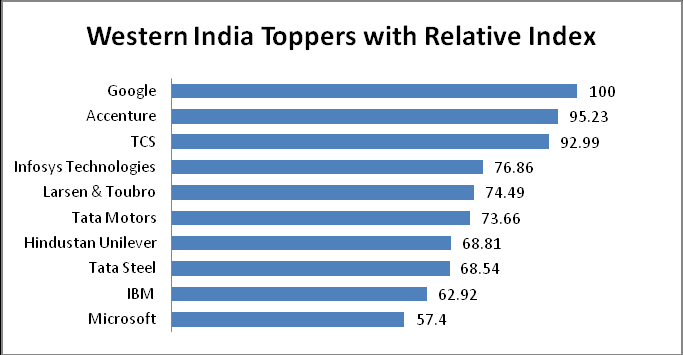
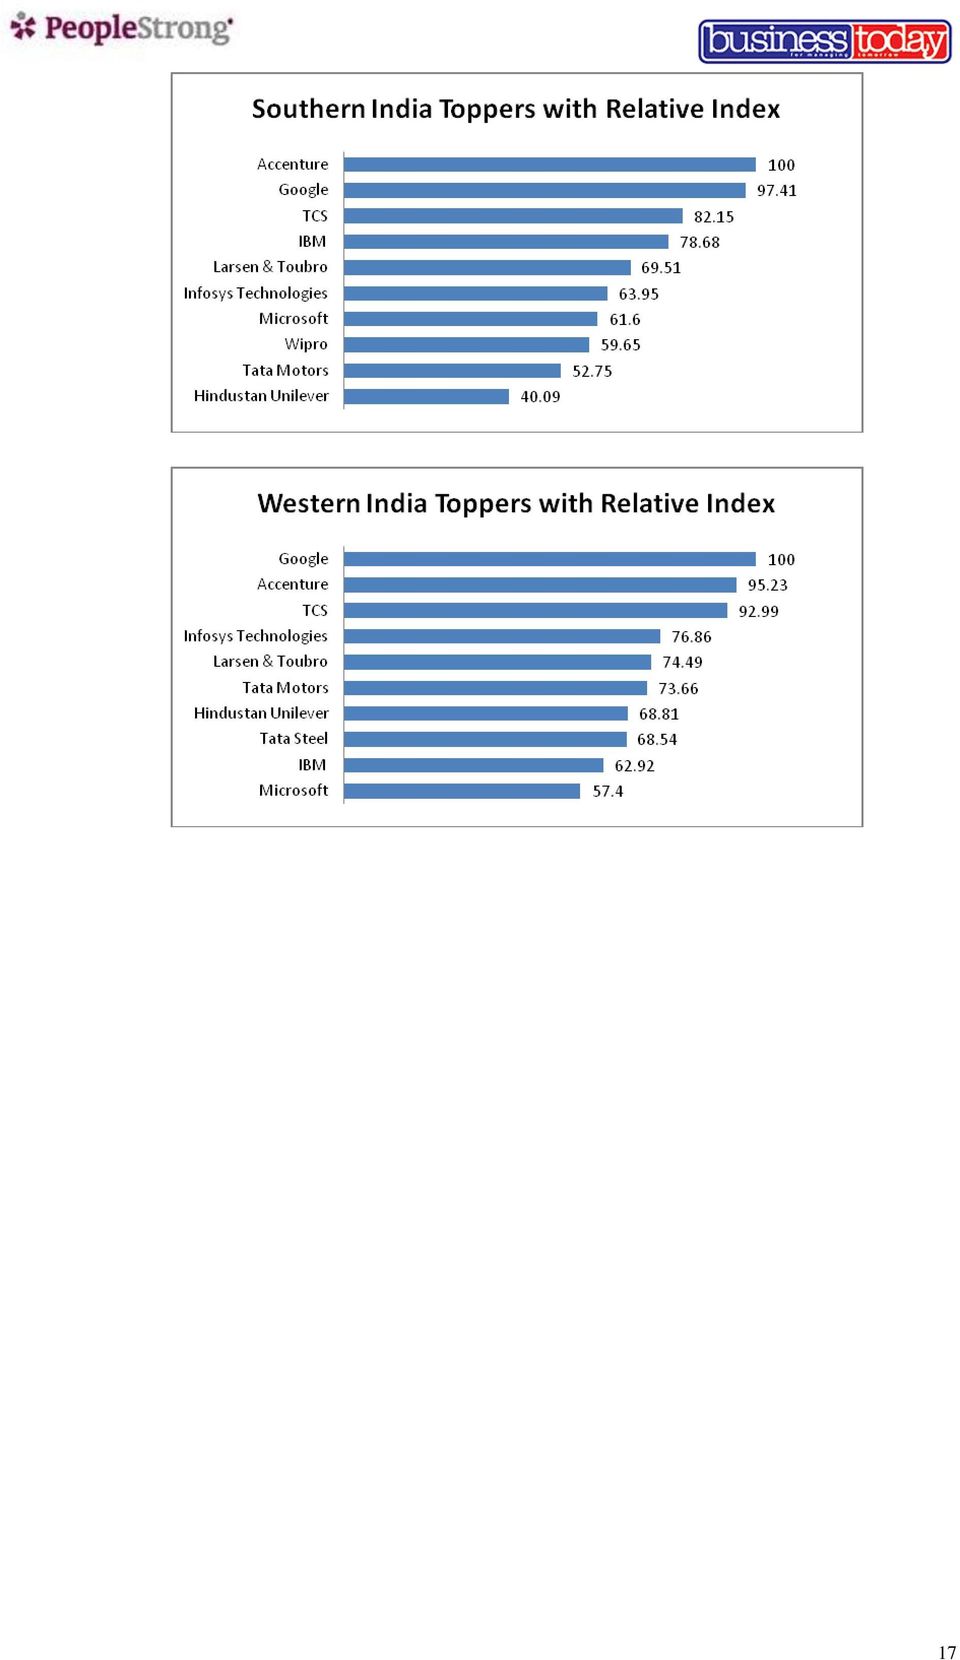
17 3.3. Variation of Rankings by regions Google stays firmly placed amongst the top of the order across all four regions. However, thereafter the rankings change a bit. While BHEL is no. 2 in the eastern and central region and Accenture is no. 1 in northern and southern regions and no. 2 in the western region, TCS is no. 3 in all the regions except the eastern region. Apart from Google, Accenture and TCS, only L&T is among the top 10 in all the five regions, though their ranks vary across the regions. Infosys technologies, TATA Motors and HUL figure in the top 10 and BHEL, TATA Steel and Microsoft figure in the top 10 list of 3 regions, while Wipro and IBM appear in the top 10 lists of 2 regions. Indian Railway, ONGC and SBI figure in the top 10 in central India only, Airtel only in eastern India and ABB in northern India. There is no company which appears in top 10 list of southern and western region only. 16

18 17
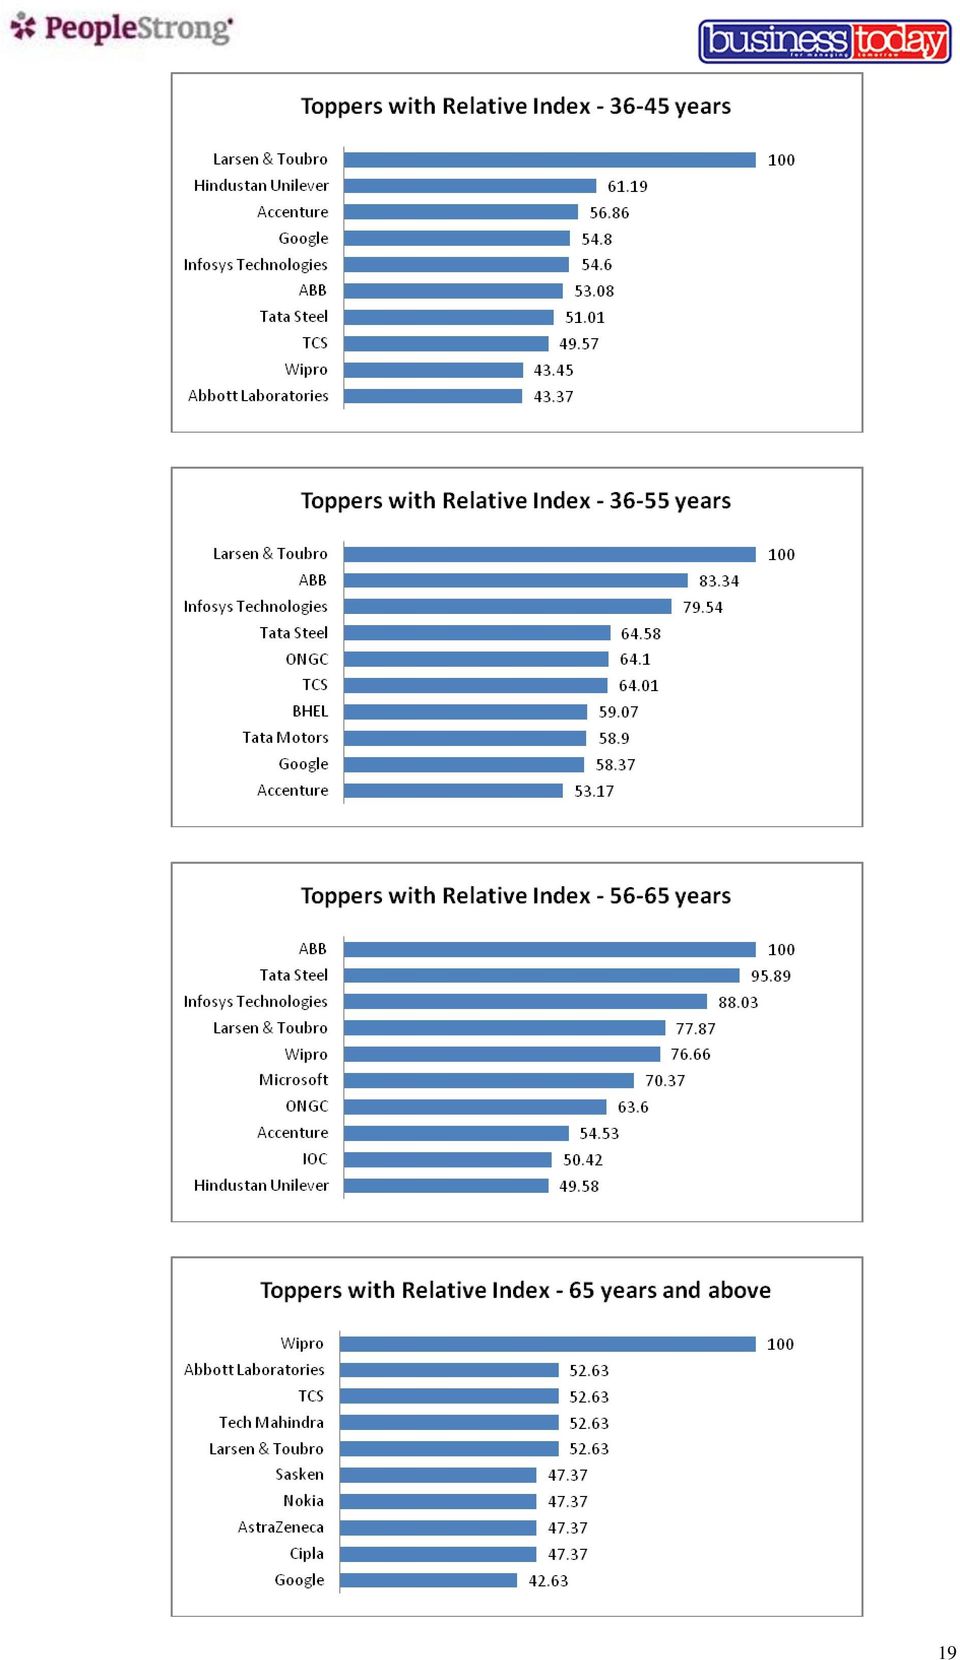
19 3.4. Variation of Rankings by different age groups Again, Google and Accenture retain their top 2 positions across all age groups till the age of 35 years. L&T leads in age groups between years while is there no clear trend coming out for the age groups of 56 years and above. L&T is the only company that figures amongst the top 10 across all the 7 age groups. 18

20 19
21 3.5. Variation of Rankings by type of companies Four types of companies were identified PSU, Indian Private Sector, MNCs and others. Once again, Google dominates one of the top 2 positions, Accenture is amongst the top 2 in all sectors expect PSU. TCS is amongst the top 4 in all the 4 sectors. L&T, Infosys, and TATA Motors are the other companies that figure in the top 10 lists in all the sectors. Wipro, BHEL and Microsoft appear in the top 10 list of 3 company type respondents. IBM and HUL appear in the top 10 list of 2 company type respondents PSU respondents have the most distinct list of top 10 companies, with 2 of these companies being PSUs ONGC and Airtel. ABB appears in the top 10 list of Other sector respondents only. 20
22 3.6. Variation of Rankings by different industry segments Ranking by BPO Sector Respondents This segment s respondents have mostly chosen companies from the Software and IT sector and the BPO sector in their list of best companies to work for. Only 2 companies in the top 10 list seem to not fit the above two industry sector strictly, namely, American Express and E&Y. In general, the segment has also rated Software companies as better places to work in as compared to its own BPO sector companies. Rank Company Name Absolute Relative Sample Index Index 1 Accenture Google TCS Infosys Technologies IBM Microsoft Wipro TCS BPO American Express Ernst and Young
, HDFC bank (2 nd, SBI (3 rd ) and ICICI Bank (4 th ), Citi Bank (6 th ) and Bank of Baroda (10 th ).")
23 Ranking by BFSI Sector Respondents Interestingly, 4 of the top 10 companies ranked by the BFSI respondents are non-bfsi companies (Infosys, TCS, Google and Accenture). 6 banks show up in the top 10 list, namely, Axis bank (1 st ), HDFC bank (2 nd, SBI (3 rd ) and ICICI Bank (4 th ), Citi Bank (6 th ) and Bank of Baroda (10 th ). Interestingly, none of the insurance companies show up in the top 10 list. Rank Company Name Absolute Relative Sample Index Index 1 Axis Bank HDFC Bank State Bank of India ICICI Bank TCS Citi Bank Google Infosys Technologies Accenture Bank of Baroda Ranking by Core Sector Respondents Respondents working in the core industry sectors have largely been loyal to own sector companies but the top 2 companies are from the engineering sector. They chose L&T as the best company to work for, along with ABB at the 2 nd position. The next 4 ranking companies are from the core sector only (Tata Power, Jindal Steel and Power, BHEL and ONGC). Only 4 non-core sector companies figure in their top 15 list L&T, ABB, TATA Steel and Alstom, 3 of which belong to the Engineering Sector and 1 from the Manufacturing sector. 22
24 Rank Company Name Absolute Relative Sample Index Index 1 Larsen & Toubro ABB Tata Power Jindal Steel and Power BHEL ONGC Tata Steel NTPC Alstom GAIL Ranking by Engineering and Automotive Sector Respondents Respondents working in the Engineering and Automotive industry sectors have largely been loyal to own sector companies. 9 out of 10 companies chosen by them belong to their own sector. Only TATA steel is an exception belonging to the Manufacturing sector. Rank Company Name Absolute Index Relative Index Sample 1 Tata Motors Larsen & Toubro Mahindra and Mahindra BHEL Tata Steel Ford India Engineers India Limited Delhi Metro Rail Corporation Limited Toyota GAIL

25 Ranking by Hospitality Sector Respondents As a group, they are the most loyal to their own industry segment sector. All companies chosen by the hospitality sector respondents belong to their own industry with India hotel Company Ltd as the 1 st preference followed by ITC, Oberoi and Marriot. Last year, only 2 out of the top 10 companies were from the hospitality sector. Rank Company Name Absolute Index Relative Index Sample 1 Indian Hotels Company Ltd.(The Taj Hotels Resorts & Palaces) ITC Hotels Oberoi Hotels(East India Hotels) Marriott Hotels India Hotel Leela Venture Asian Hotels Ltd Indian Railways Cox and Kings Jet Airways Radisson hotels & Resorts Ranking by Manufacturing Sector Respondents Interestingly, only 9 out of 10 top companies are FMCG companies (HUL, ITC and Nestle) same as last year. Only TATA Motors belongs to the Engineering and Automotive sector. 24
26 Rank Company Name Absolute Index Relative Index Sample 1 Hindustan Unilever ITC Nestle Britannia Procter and Gamble Coca Cola India Colgate Palmolive Dabur India Limited Godrej Consumer Products Tata Motors Ranking by Pharma and Healthcare Sector Respondents As a group, they are the most loyal to their own industry segment sector. All companies chosen by the pharma and healthcare sector respondents belongs to their own industry with Abbott Laboratories as the 1 st preference followed by Dr. Reddy s, Pfizer and Cipla. Rank Company Name Absolute Index Relative Index Sample 1 Abbott Laboratories Dr Reddy's Laboratory Pfizer Cipla Glaxo Smith Kline Novartis Ranbaxy Johnson & Johnson AstraZeneca Biocon

27 Ranking by Software and IT Sector Respondents This segment has not looked beyond its own sector. All the top 10 companies ranked are from within the IT, software and internet sector. The list is led by Google followed by Accenture, TCS and IBM. Rank Company Name Absolute Index Relative Index Sample 1 Google Accenture TCS IBM Microsoft Infosys Technologies Wipro HCL Technologies Adobe Systems India Pvt Ltd Dell Ranking by Telecom and Allied Sector Respondents The telecom sector respondents find their own sector companies quite worthy of being the best companies to work for. The top 2 companies are Airtel and Vodafone however Google and Accenture feature amongst the top 5. 6 out of 10 companies belong to the telecom sector. Other 4 companies belong to the Soft and IT sector (Google, Accenture, Microsoft and TCS). 26
28 Rank Company Name Absolute Index Relative Index Sample 1 Airtel Vodafone Google Ericsson Accenture Idea Cellular Limited TCS BSNL Reliance Communications Microsoft Ranking by Others and Diversified Sector Respondents Rank Company Name Absolute Index Relative Index Sample 1 BHEL Larsen & Toubro Hindustan Unilever Wipro ABB Accenture Tata Steel Airtel Google TCS
29 4. Ranking of Companies within Sector This chapter addresses the responses to the question Within the industry sector you are currently employed in - Among all the companies that you know of in India, which company you would rank the best, considering all the factors? Over here, we asked the respondents to select and rank the 5 companies within their respective work sectors, which in their opinion are the best companies to work in within their industry. Once they selected these companies at the overall level, we asked them to give their views on how they would rank them on each of the six factors specified. This was followed by the question Which company would you rank the best on each of the factors? The follow up question was asked only for the top 3 companies of the 5 selected by the respondent in the first question. The rankings thus obtained for the 10 broad industry sectors are presented sector-by-sector below Sector Business Process Outsourcing (BPO/ KPO/ ITES) Rank Company Name Relative Index Career Growth Prospects Financial Compensation Work Life Balance Performance Evaluation Stability Other HR Practices 1 Genpact TCS BPO Wipro BPO IBM Daksh Overall 5 HCL BPO Services Aegis BPO Services WNS MphasiS BPO EXL Service Holdings /7 Customer
30 4.2. Sector BFSI (Banking, Financial Services, Insurance) Rank Company Name Relative Index Career Growth Prospects Financial Compensation Work Life Balance Performance Evaluation Stability Other HR Practices Overall 1 Axis Bank State Bank of India HDFC Bank ICICI Bank Citi Bank HSBC Standard Chartered Bank 8 American Express HDFC Standard Life Barclays Sector Core Sector (Oil & Gas/ Power/ Steel/ Minerals) 29
31 Rank Company Name Relative Index Career Growth Prospects Financial Compensation Work Life Balance Performance Evaluation Stability Other HR Practices Overall 1 Jindal Steel and Power Tata Power NTPC Tata Steel ONGC GAIL SAIL Coal India Limited Hindalco Industries ACC Sector Engineering and Automotive Rank Company Name Relative Index Career Growth Prospects Financial Compensation Work Life Balance Performance Evaluation Stability Other HR Practices Overall 1 Larsen & Toubro Tata Motors Mahindra & Mahindra BHEL Maruti Udyog Hyundai Motors Ford India ABB Toyota Bajaj Auto
32 4.5. Sector Hospitality (Includes Aviation, Tours & Travels, Hotels) Rank Company Name Relative Index Career Growth Prospects Financial Compensation Work Life Balance Performance Evaluation Stability Other HR Practices Overall 1 Indian Hotels Company Ltd.(The Taj Hotels Resorts & Palaces) 2 ITC Hotels Oberoi Hotels(East India Hotels) 4 Marriott Hotels India Radisson 5 hotels & Resorts 6 Hotel Leela Venture Club Mahindra Holidays 8 Asian Hotels Ltd Cox and Kings Jet Airways

33 4.6. Sector Other Manufacturing (FMCG, Durables, Other non-engineering) Rank Company Name Relative Index Career Growth Prospects Financial Compensation Work Life Balance Performance Evaluation Stability Other HR Practices Overall 1 Hindustan Unilever Nestle Coca Cola India Procter and Gamble Dabur India Limited Asian Paints Colgate Palmolive Britannia Godrej Consumer Products 10 Samsung Sector Pharma and Healthcare 32
34 Rank Company Name Relative Index Career Growth Prospects Financial Compensation Work Life Balance Performance Evaluation Stability Other HR Practices Overall 1 Abbott Laboratories Dr Reddy's Laboratory Glaxo Smith Kline Novartis Johnson Johnson & Cipla AstraZeneca Pfizer Ranbaxy Biocon Sector Software and IT Rank Company Name Relative Index Career Growth Prospects Financial Compensation Work Life Balance Performance Evaluation Stability Other HR Practices 1 Google Accenture Microsoft Overall 4 TCS Dell IBM Infosys Technologies HCL Technologies Hewlett- Packard Wipro
35 4.9. Sector Telecom and Allied Rank Company Name Relative Index Career Growth Prospects Financial Compensation Work Life Balance Performance Evaluation Stability Other HR Practices 1 Airtel Overall 2 Vodafone Idea Cellular Limited Ericsson Reliance Communicati ons 6 Nokia Tata Teleservices BSNL Siemens Communicati ons 10 Aircel
36 4.10. Sector Others and Diversified Rank Company Name Relative Index Career Growth Prospects Financial Compensation Work Life Balance Performance Evaluation Stability Other HR Practices Overall 1 Indian Railways Delhi Metro 2 Rail Corporation Limited 3 Engineers India Limited DLF Universal Limited Canon Boston Consulting Group 7 CRISIL Mc. Donald s Xerox Jaiprakash Associates
37 5. Non Ranking Parameters Apart from pure ranking and rating of companies, the respondents were asked several questions on various aspects of employee satisfaction, relationships with superiors, etc. This chapter presents the findings of these aspects What makes a company a fantastic place to work in? Over here we asked the respondents to identify the factors that make a company a fantastic place to work in. The respondents were presented with 5 factors: Growth Oriented- Career and Growth Prospects Compensation and Benefits Progressive Culture promotes Diversity & Work life balance Ethical High standards of Fairness, Objectivity and Transparency Stability Large scale diversified operations Other HR practices of the company (Training/ Mentoring/ Working atmosphere) They were asked to rate each of these factors on a scale of 1-5 (1 being low importance, 5 being high importance), based on which the percentage importance of each factor was computed. They were also asked to rank their own companies on each of these factors on the same scale to see the difference between the expectations of the employees and the reality. Growth Oriented- Career and Growth Prospects 37% of the employees feel that career and growth prospect is the most important factor that makes a company a fantastic place to work for. Against this, only 13% employees feel that their companies provide excellent career and growth opportunities and 42% feel that their companies fail in providing the expected growth and development. 36
38 Compensation and Benefits 27% of the employees feel that compensation and benefits is the most importance factor in their professional careers. Nut only 11% of the respondents feel that their companies are able to meet their compensation expectations, whereas 43% employees feel that their companies fail in meeting their compensatory expectations. Progressive Culture promotes Diversity & Work life balance 37% of the employees feel that progressive culture is not an importance factor in making a workplace a best place to work for, whereas 24% employees feel that it is extremely important for companies to have a progressive culture. But only 11% of the respondents feel that their companies are able to create a culture of their choice and 45% employees feel that their companies fail in creating a progressive culture. 37
39 Ethical High standards of Fairness, Objectivity and Transparency 37% of the employees feel that it is not important for a company have very high standards of ethics to be classified as a best place to work for, whereas 29% employees feel that it is extremely important for companies to have high ethical standards. But only 12% of the respondents feel that their companies are able to maintain the desired level of ethical balance and 44% employees feel that their companies fail in meeting ethical standards. Stability Large scale diversified operations 39% of the employees feel that it is not important for a company have very high stability to be classified as a best place to work for, whereas 24% employees feel that it is extremely important for companies to have stable and large scale operations to hedge any risks in the future. But only 12% of the respondents feel that their companies are highly stable and 46% employees feel that their companies are very unstable. 38
40 Other HR practices of the company (Training/ Mentoring/ Working atmosphere) 40% of the employees feel that other HR practices like training, mentoring and working atmosphere are not important for them, whereas 27% employees feel that it is extremely important for companies to have good HR practices to become a best companies to work for. But only 13% of the respondents feel that their companies have good HR practices and 47% employees feel that their companies are have poor HR practices. Career growth seems to be the most important factor for the employees, which attracts them to a given company. Stability is seen to have the least importance amongst all the factors. In conclusion, the big picture that appears is that the employees see the attractiveness of a company as a place to work for from the perspective of what the company has to offer to him/her and not what the company has to offer per se. 39
41 Comparison: The overall sense is that companies fail to meet the expectations of the employees across all the 6 factors Rating of own company on the five factors identified As mentioned earlier, the respondents were asked to rate their own companies on these 5 factors on a scale of 1-5 (1 if their company fares poorly and 5 if their company is excellent). The purpose of this exercise was to ascertain how happy or unhappy the respondents are with their own employers on the 5 factors identified. Overall, the respondents rated their company s performance at an average of 2.27 on a scale of 1-5, which implies that respondents do not rate their respective companies too highly. In fact, for all the 6 individual factors, the performance rating scores averaged around 2.3 except for Other HR Practices. 40
42 5.3. What makes a company attractive? What would be the most important things that the employees would look for that would make a new job attractive enough to change to? The respondents were asked to pick out 3 out of 9 factors. Based on the proportion of respondents choosing a factor, inferences regarding the most important factors were drawn. Interestingly, higher job role and responsibility edges past compensation and benefits to emerge as the most important factor of attraction of a company when it comes to a new job just like last year. There is no change in the percentage importance in these 2 factors from the last year. Despite a noticeable increase in its importance (+5%), work environment and culture of the prospective company hung on to its position of the third most important factor. On the other hand Learning opportunity gained importance to emerge as the fourth most important factor at 39% as against Brand of the company. With the top two important factors which makes a company attractive to the respondent employees being higher job role and responsibility and compensation and benefits, clearly their own personal growth prospects is what drives the employees the most when it comes to moving jobs. The company based factors ( work environment and culture, company brand image and learning opportunities ) are only of secondary importance to them. The factors that are not really considered important by most of the respondents when looking at a new job opportunity (company) are: Location/ city Change the career into a new functional role or industry Global/ Regional responsibility To work with well-known person 41
43 5.4. What upsets employees strongly enough to start contemplating change? Often, people change jobs because of push factors in the current job, i.e., things that are not working to their satisfaction. Which factors will make you stay with your current organisation, and in case not fulfilled, will make you look for job in other organisation? The respondents were asked to pick out 3 out of 10 factors. Based on the proportion of respondents choosing a factor, inferences regarding the most important factors were drawn. If career and growth prospects is what employees considered as the most important factor in their evaluating a company to be a fantastic place to work in, it is no surprise that lack of career growth came out clearly as the most important factor considered by them to think of leaving a company (with 66 % selecting it as against 71% last year). In fact, the second most important dissatisfier dissatisfaction with the financial package is a significantly lesser devil than lack of career growth with only 49% employees selecting it (against 47% last year). At 41%, non-conducive work environment and culture also emerged as an important dissatisfier triggering a job change (as compared to 46% last year). This clearly indicates that personal career growth is what drives employees at the core. Lack of it is what triggers most of them to look out ; it is what they believe is the most important factor that makes a company a fantastic place to work for (manifested as career and growth prospects in a company) and therefore, it is what they seek in the new company that they consider attractive (manifested as higher job role and responsibility). Thereafter, it is about money honey! Dissatisfaction with their current financial package is what triggers the next most of them to look out ; a good financial package is what they believe is the most important factor that makes a company a fantastic place to work for and therefore, it is what they seek in the new company that they consider attractive. The factors that are not really considered important dissatisfier by most of the respondents in their current jobs (company) are: Lack of recognition Location/city Relationship with current supervisor/manager The company is not growing 42
44 Brand of the company not being attractive Sense of belongingness with the company not being strong 5.5. Satisfaction in current job role The specific question asked was whether people were satisfied in their job role given their qualifications. Only 53% were satisfied (against 70% last year) and 47% were not satisfied (against 30% last year) Adherence to Ethical Values The respondents were asked about the ethical values of senior management in their company. The specific question asked was How well do you believe that the senior management of your company lives up to the company's standard code of ethics? The five choices given were: Don't abide by company's ethics at all Not very well Sometimes do, sometimes don't Very well Extremely well Don t know The dis-heartening thing for companies is that only 43% of the respondent employees believe that their senior management adheres to ethical values very well or extremely well (as compared to 71% believing so last year). 23% (as compared to 15% last year) think that their management does not adhere to their expected ethical values and standards. Overall percentage Last year Don't abide by company's ethics at all 5% 7% -2% Not very well 17% 8% +9% Sometimes do, sometimes don't 32% 15% +17% Very well 28% 31% -3% Extremely well 15% 40% -25% Don t know 2% - - Change from Last Year 5.7. Relationship with the immediate boss/ supervisor The respondents were asked about their satisfaction level with their relationship with their immediate supervisor. How satisfied are they with the current boss/ supervisor. The answers were captured on a 5 point scale (1 extremely dissatisfied, 5- extremely satisfied). The parameters explored were: My Boss cares about my career growth My Boss communicates with me regularly & effectively My Boss recognizes me for work well done My Boss cares about me as a person I see a leader in my Boss 43
List of Top 100 BSE and NSE Listed companies arranged by Sector
 List of Top 100 BSE and NSE Listed companies arranged by Sector Company Name Industry NSE 100 / BSE 100 Already Report? Level of GRI Latest Reporting Report Ashok Leyland Ltd. Automobiles NSE 100 / BSE-100
Business / Opinion Polls MAGAZINE JUN 27, 2011
 www.outlookindia.com Top Engineering Colleges http://www.outlookindia.com/printarticle.aspx?277249 1 of 7 27/06/2011 17:54 Business / Opinion Polls MAGAZINE JUN 27, 2011 Set In Lead A student on campus
WHATS IN - WHATS OUT? MUTUAL FUND UPDATE
 ARIHANT capital markets ltd. WHATS IN - WHATS OUT? MUTUAL FUND UPDATE Contents What s in - WHAT S OUT TOP PICKS OF THE MONTH MAJOR REDUCTIONS POPULAR STOCKS ACCROSS FUNDS CASH RICH FUNDS Visit us at: www.arihantcapital.com
FINAL PLACEMENTS BATCH OF 2015
 FINAL PLACEMENTS BATCH OF 2015 JAMNALAL BAJAJ INSTITUTE OF MANAGEMENT STUDIES FOREWORD Fifty years of continued excellence led way to a spectacular assortment of final placements at Jamnalal Bajaj Institute
ANALYSIS AND CLUSTERING OF NIFTY COMPANIES OF SHARE MARKET USING DATA MINING TOOLS
 Review Article ANALYSIS AND CLUSTERING OF NIFTY COMPANIES OF SHARE MARKET USING DATA MINING TOOLS D. Venugopal Setty 1, Dr.T.M.Rangaswamy 2 and Dr.A.V.Suresh 3 Address for Correspondence 1 Assistant Professor,
Driving through the urban used-car market
 Driving through the urban used-car market February 2016 Second line optional lorem ipsum B Subhead lorem ipsum, date quatueriure Contents 1 Introduction 2 The buying behaviour 6 The buying process 9 Dealership
A REPORT ON HIRING ACTIVITY IN INDIA
 A Naukri.com Report A NAUKRI.COM MAY 2016 REPORT A REPORT ON HIRING ACTIVITY IN INDIA by: Location, Industry and Experience TABLE OF CONTENTS Executive Summary... 4 Sectoral Analysis... 5 Functional Area
Foreword. Arati Porwal Chief Representative India CIMA
 1 Foreword Despite the global economic uncertainty, CIMA s members and students are in demand. Our 2012 salary survey shows that chartered management accountants are commanding salaries that reflect their
Certification Programs in Enterprise Resource Planning
 with High-End Certification Programs in Enterprise Resource Planning Lithan Genovate Advantage Leading SAP Authorized Education Partner in India since 2000 Specialize exclusively in delivering SAP Education,
Placement Highlights & Analyses - 2011 & 2012 Institute of Management & Information Science
 Placement Highlights & Analyses - 2011 & 2012 Institute of Management & Information Science (Approved by AICTE, Govt. of India) BHUBANESWAR Dear all, I express my sincerest gratitude to all companies &
A Research Study on. Examining the Best Practices in Performance Appraisal
 A Research Study on Examining the Best Practices in Performance Appraisal By: Prof.Archana Ernest Author(s) affiliation: Assistant Professor Address : Sinhgad Institute of Business Administration & Research
A COMPARATIVE STUDY OF WORKFORCE DIVERSITY IN SERVICE AND MANUFACTURING SECTORS IN INDIA
 IMPACT: International Journal of Research in Business Management (IMPACT: IJRBM) ISSN(E): 2321-886X; ISSN(P): 2347-4572 Vol. 2, Issue 3, Mar 2014, 1-8 Impact Journals A COMPARATIVE STUDY OF WORKFORCE DIVERSITY
SYNOPSIS OF THE THESIS ON A STUDY ON HUMAN RESOURCE MANAGEMENT IN BPO WITH SPECIAL REFERENCE TO HIGH EMPLOYEE ATTRITION
 SYNOPSIS OF THE THESIS ON A STUDY ON HUMAN RESOURCE MANAGEMENT IN BPO WITH SPECIAL REFERENCE TO HIGH EMPLOYEE ATTRITION JAMES. M. J. Research Scholar Dr. U. Faisal Supervising Teacher INTRODUCTION The
CHANGING HRM PRACTICES WITH SPECIAL REFERENCE TO RETENTION POLICIES AT TCS
 CHANGING HRM PRACTICES WITH SPECIAL REFERENCE TO RETENTION POLICIES AT TCS Ms. Ruchita Petkar Asst. Professor ATSS CBSCA, Chinchwad, Pune Dr. Suhas Sahasrabudhe Principal CSIT, Shahu Nagar, Pune Abstract:
FIRST MORNING TECHNICAL CALL T E C H N I C A L S. Friday, September 04, 2015 MARKET OUTLOOK
 MARKETM T E C H N I C A L S MARKET OUTLOOK NIFTY (7823) CNX Nifty opened positive and managed to hold immediate support of 7750 zones and headed towards 7845 levels after the weakness of last three trading
5.1 Introduction 5.2 Management Level Wise 5.3 Functional Domain Wise
 Analysis & interpretation of Data Part - I: Application of Business Intelligence in Indian and Global companies across different Industry Verticals, Functional Domains & Management Levels. 5.1 Introduction
Consumer Attitude and Perception of Mobile Phone Service Providers in Nagapattinam District
 Volume: 2, Issue: 7, 673-678 Aug 2015 www.allsubjectjournal.com e-issn: 2349-4182 p-issn: 2349-5979 Impact Factor: 3.762 A. Muthukumaran Part-Time Research Scholar, Assistant Professor of Commerce, A.V.C.
High Speed Rail in India
 High Speed Rail in India Selection of corridors and Impacts on energy and emissions* Sarbojit Pal International Transport Forum Roundtable on the Economics of investments in HSR December 18-19 th, 2013
A STUDY ON USAGE AND SATISFACTION OF CREDIT CARDS BY CUSTOMERS IN KRISHNAGIRI DISTRICT
 A STUDY ON USAGE AND SATISFACTION OF CREDIT CARDS BY CUSTOMERS IN KRISHNAGIRI DISTRICT S.Deviranjitham Research scholar Periyar University Asst.Professor, Sri Vidya Mandir Arts & Science College,Uthangarai,Krishnagiri.
[Sharma, 2(2): April-June, 2012] ISSN: 2277-5528. Int. J. of Engg. Sci. & Mgmt. (IJESM), Vol. 2, Issue 2: April-June: 2012, 180-184
![[Sharma, 2(2): April-June, 2012] ISSN: 2277-5528. Int. J. of Engg. Sci. & Mgmt. (IJESM), Vol. 2, Issue 2: April-June: 2012, 180-184](/thumbs/27/9697411.jpg "[Sharma, 2(2): April-June, 2012] ISSN: 2277-5528. Int. J. of Engg. Sci. & Mgmt. (IJESM), Vol. 2, Issue 2: April-June: 2012, 180-184") INTERNATIONAL JOURNAL OF ENGINEERING SCIENCES & MANAGEMENT PRE-OWNED CAR MARKET IN INDIA: A STUDY OF MARKETING STRATEGIES OF CAR MAKERS Krati Sharma Lakshmi Narain College of Technology, Indore. Abstract
INTERNATIONAL JOURNAL OF ENGINEERING SCIENCES & MANAGEMENT PRE-OWNED CAR MARKET IN INDIA: A STUDY OF MARKETING STRATEGIES OF CAR MAKERS Krati Sharma Lakshmi Narain College of Technology, Indore. Abstract
The Bayt.com Middle East and North Africa. Salary Survey 2016. May 2016
 The Bayt.com Middle East and North Africa Salary Survey 2016 May 2016 Objective This research was conducted to gauge employee satisfaction levels with their salaries, but also pay raises and factors impacting
Everest Group PEAK Matrix TM for Supply Chain Management (SCM) BPO Service Providers
 BPO Service Providers") Everest Group PEAK Matrix TM for Supply Chain Management (SCM) BPO Service Providers Focus on TCS December 2014 Copyright 2014 Everest Global, Inc. This document has been licensed for exclusive use and
Everest Group PEAK Matrix TM for Supply Chain Management (SCM) BPO Service Providers Focus on TCS December 2014 Copyright 2014 Everest Global, Inc. This document has been licensed for exclusive use and
TELECOM REGULATORY AUTHORITY OF INDIA New Delhi, 1 st September, 2015 (www.trai.gov.in)
") For immediate release (Press Release No. 47/2015) Information Note to the Press TELECOM REGULATORY AUTHORITY OF INDIA New Delhi, 1 st September, 2015 (www.trai.gov.in) Highlights of Telecom Subscription
For immediate release (Press Release No. 47/2015) Information Note to the Press TELECOM REGULATORY AUTHORITY OF INDIA New Delhi, 1 st September, 2015 (www.trai.gov.in) Highlights of Telecom Subscription
PH.D THESIS ON A STUDY ON THE STRATEGIC ROLE OF HR IN IT INDUSTRY WITH SPECIAL REFERENCE TO SELECT IT / ITES ORGANIZATIONS IN PUNE CITY
 ABSTRACT OF PH.D THESIS ON A STUDY ON THE STRATEGIC ROLE OF HR IN IT INDUSTRY WITH SPECIAL REFERENCE TO SELECT IT / ITES ORGANIZATIONS IN PUNE CITY SUBMITTED TO THE UNIVERSITY OF PUNE FOR THE AWARD OF
,Dlizsl fefm;k lfozl 15-01-2015
 ,Dlizsl fefm;k lfozl 15-01-2015 HT Mint IIFT completes final placement in a week IIFT says 69 companies hired its entire batch of 219 students on salaries that on an average were 20% higher than last year
Liquidity Enhancement Incentive Programme for Equity Derivatives
 Liquidity Enhancement Programme for Equity Derivatives LEIPS-Stock Options ( Effective from June 08,2015) SEBI issued Circular no.cir/mrd/dp/14/2014 dated April 23, 2014 regarding revised guidelines for
Separation -A Better Tomorrow-Economy A Study of Marketing Strategies On Automobile
 Separation -A Better Tomorrow-Economy A Study of Marketing Strategies On Automobile Ekta Chakravarty Gauhati Commerce College, Gauhati University, E-mail : addictedlife24@gmail.com Abstract - Automobile
Influence of Social Media on the Indian Automotive Consumers: Primary Study in National Capital Region
 IOSR Journal of Business and Management (IOSR-JBM) e-issn: 2278-487X, p-issn: 2319-7668. Volume 17, Issue 8.Ver. IV (Aug. 2015), PP 01-05 www.iosrjournals.org Influence of Social Media on the Indian Automotive
CHAPTER I INTRODUCTION AND DESIGN OF THE STUDY
 P a g e 1 CHAPTER I INTRODUCTION AND DESIGN OF THE STUDY INTRODUCTION Business Process Outsourcing (BPO) is one of the fastest growing segments of the Information Technology Enabled Services (ITES) industry.
Content Disclaimer Introduction
 Content Introduction Career Prospects for Chartered Accountant Pinnacle of the Profession Different Stages of Chartered Accountancy course Different Stages one by one Subjects to be studied Fee for Registration
DATA ANALYSIS AND INTERPRETATION OF EMPLOYEES PERSPECTIVES ON HIGH ATTRITION
 DATA ANALYSIS AND INTERPRETATION OF EMPLOYEES PERSPECTIVES ON HIGH ATTRITION Analysis is the key element of any research as it is the reliable way to test the hypotheses framed by the investigator. This
Accounting StAndArdS in india: Adoption of ifrs
 Abstract Accounting StAndArdS in india: Adoption of ifrs prashanta Athma*, n. rajyalaxmi ** Adoption of IFRS means the use of the International Financial Reporting Standards as the primary GAAP by the
2070 Work Life Balance Survey - Employees
 2070 Work Life Balance Survey - Employees Record no: Introduction We would be grateful if you could spare the time to take part in our survey it should only take around 15 minutes to complete. The survey
TWITTER AND FINANCIAL MARKETS
 The 215 WEI International Academic Conference Proceedings TWITTER AND FINANCIAL MARKETS Muktamala Chakrabarti, Asim Kumar Pal, Ashok Banerjee Indian Institute of Management Calcutta D.H. Road, Joka, Kolkata,
BSES Rajdhani Power Limited Delhi CAT 1 0. BSES Yamuna Power Limited Delhi CAT 1 0. Bharat Sanchar Nigam Limited Ahmedabad CAT 1 0
 Biller name Billing Circle Category Surcharge Airtel Broadband Chennai CAT 1 0 Airtel Telephone Delhi CAT 1 0 Airtel Broadband Karnataka CAT 1 0 Torrent Power Ahmedabad CAT 2 1.82% Bharti Airtel Limited
Electrical Projects Co., Libya 220/66/30/11 KV Substations, 26 Nos. 33/11 KV Substations, 14 Nos
 Electrical Projects Co., Libya 220/66/30/11 KV s, 26 Nos. 33/11 KV s, 14 Nos 66 KV Mundra International Container Terminal Ltd. 20 MVA (2x10 MVA), 66/11 KV with 4 MVA (2x2 MVA) 11 KV D.G. sets 33 KV Indira
A Comparative Study on Customer Preference of Mobile Service Providers with Selected Service Providers
 A Comparative Study on Customer Preference of Mobile Service Providers with Selected Service Providers ABSTRACT Dr. L. Leo Franklin Assistant Professor & Research Adviser PG. & Research Department of Commerce,
CRISIL Research Impact note
 October 2015 Interest rate on home loans to fall 25-30 bps more: CRISIL Research RBI move to cut risk weight will benefit 70% of home loans, 80% of borrowers CRISIL Research expects interest rate on home
International Placement Programme through Video Conferencing Mode November - December, 2015
 International Placement Programme through Video Conferencing Mode November - December, Organised by : Committee for Members in Industry (Set up by an Act of Parliament) President s Message We are living
Personal Branding. Our survey reveals the performance drivers for Brand YOU. June 2012
 Personal Branding Our survey reveals the performance drivers for Brand YOU. June 2012 Views of all management levels, professional and technical employees and team members. Methodology Branding can be
India Solid Waste Management Vehicles Market Forecast and Opportunities, 2019
 Brochure More information from http://www.researchandmarkets.com/reports/2931908/ India Solid Waste Management Vehicles Market Forecast and Opportunities, 2019 Description: In India, municipal corporations
Chapter 7 SUMMARY- FINDINGS AND SUGGESTIONS
 Chapter 7 SUMMARY- FINDINGS AND SUGGESTIONS In academic field the research is an ongoing process that knows no limits and no full stops. Even then the main findings emerging out of the present study have
TELECOM REGULATORY AUTHORITY OF INDIA New Delhi, 27 th January, 2016 (www.trai.gov.in)
") For immediate release (Press Release No. 06/2016) Information Note to the Press TELECOM REGULATORY AUTHORITY OF INDIA New Delhi, 27 th January, 2016 (www.trai.gov.in) Highlights of Telecom Subscription
For immediate release (Press Release No. 06/2016) Information Note to the Press TELECOM REGULATORY AUTHORITY OF INDIA New Delhi, 27 th January, 2016 (www.trai.gov.in) Highlights of Telecom Subscription
New in online. Ground Realities. admission table. DULEEP DEOSTHALE, PhD
 admission table New in online Engineering marketing & India: Ground Realities admissiontable.com DULEEP DEOSTHALE, PhD Co Founder and Vice President International Education Co Founder and Vice President
NMIMS SCHOOL OF BUSINESS MANAGEMENT, BANGALORE. FINAL PLACEMENT REPORT 2014-16 Batch
 NMIMS SCHOOL OF BUSINESS MANAGEMENT, BANGALORE FINAL PLACEMENT REPORT 2014-16 Batch Snapshot 100% placements for 5th consecutive year since inception Highest salary - Rs. 16.2 lakhs /annum Average Salary
ppp M AL ALI AUDITING We are leading Chartered Accountant in the domain of Auditing, Accounting outsourcing, and Business Advisory Services.
 2013 ppp M AL ALI AUDITING We are leading Chartered Accountant in the domain of Auditing, Accounting outsourcing, and Business Advisory Services. Munish Goyal 222 23565e5eeeter 28/08/2013 Detail of the
KPMG FLASH NEWS. Background. Facts of the case. 26 June 2015. KPMG in India
 KPMG FLASH NEWS KPMG in India 26 June 2015 Restoration services relating to transmission of data and telecommunication traffic are not taxable as FTS. Income reasonably attributable to business operations
3rd OWASP Information Security
 OWASP InfoSec India Conference 2012 August 24th & 25th, 2012, 3rd OWASP Information Security International Conference About OWASP Open Web Application Security Project (OWASP) is a global open source application
The Impact of Successful Employee Referral Programs
 Hiring! Know any candidates? Bill is a good fit! Thanks for the referral! HR Rep HIRED Bill The Impact of Successful Employee Referral Programs 2015 icims Inc. All Rights Reserved. Table of Contents Executive
Telecom Regulatory Authority of India. Engagement of Consultant for conducting a market survey of consumers of Cable and Television services
 Telecom Regulatory Authority of India Engagement of Consultant for conducting a market survey of consumers of Cable and Television services 1 Background Terms of Reference (TOR) 1.1 A Consumer Survey was
The Training Needs of Older Workers
 The Training Needs of Older Workers Katrina Ball, Josie Misko and Andrew Smith National Centre for Vocational Education Research ABSTRACT The nature of work has been the subject of significant change in
The greatness gap: The state of employee disengagement. Achievers 2015 North American workforce survey results
 The greatness gap: The state of employee disengagement Achievers 2015 North American workforce survey results Greatness doesn t happen by chance it s the accumulation of daily successes. True greatness
100 % Career Oriented Professional Courses With Placement Assistance
 100 % Career Oriented Professional Courses With Placement Assistance 1.Quality Skill Improvement Courses.(For Engineers/MBA) Purpose of doing Quality Skill Improvement Courses For Freshers/Experienced
CONSUMERLAB. Performance shapes smartphone behavior Understanding mobile broadband user expectations in India
 CONSUMERLAB Performance shapes smartphone behavior Understanding mobile broadband user expectations in India An Ericsson Consumer Insight Summary Report July 2014 contents CONSUMER PERCEPTION 3 VS. REAL
CONTENT OCTOBER 2015. About RecruiteX. Hiring Trends. Executive Summary. Industry-wise Recruitment Trends. Functional Area-wise Recruitment Trends
 CONTENT About RecruiteX Hiring Trends Executive Summary Industry-wise Recruitment Trends Functional Area-wise Recruitment Trends Location-wise Recruitment Trends Experience-wise Recruitement Trends Contact
Information and Communication Technology
 Information Technology (IT) Robust growth of Indian IT companies The robust growth achieved by the top 6 Indian IT services companies, namely, Satyam, Wipro, Infosys, TCS, Cognizant and HCL Technologies
folios have been opened in Invest Today!! Call us on 1800 300 11111 www.reliancemutual.com SMS ELSS to 561617
 Tax Saver (ELSS) Fund (An open ended Equity Linked Savings ) 9 lakh * folios have been opened in Tax Saver (ELSS) Fund Invest Today!! Tax saving Growth potential Call us on 1800 300 11111 www.reliancemutual.com
Residential Real Estate in Hyderabad
 Brochure More information from http://www.researchandmarkets.com/reports/616038/ Residential Real Estate in Hyderabad Description: Introduction The Indian economy has registered growth of 8.7% for FY08
ADVANCED ONLINE ADVERTISING PROGRAM
 ADVANCED ONLINE ADVERTISING PROGRAM Certified by Google Program Director: Priyanka Kapuria Last Date to Apply: September 14, 2010 Program Start Date: October 5, 2010 BACKGROUND Internet penetration is
Majestic Market Research Support Services. Asia s Largest Independent Marketing Research Firm
 Majestic Market Research Support Services Asia s Largest Independent Marketing Research Firm INTRODUCTION What we do MMRSS is Asia s Largest Independent Marketing research firm specializing in Multi- Country
THE CUSTOMER COMES SECOND!
 THE CUSTOMER COMES SECOND! THE CUSTOMER COMES SECOND! To most of us, this statement seems so alien when, for the duration of our careers, we have had it drummed into us (as we have drummed it into others),
Social Media Usage in Indian Information Technology Professionals
 11 Social Media Usage in Indian Information Technology Professionals Amol Kumar Gupta, Research Scholar, Department of Management, EIILM University, Sikkim Dr. Sangya Shrivastava, Director, Rai Business
Indian Institute of Management Raipur. Final Placement Report 2013
 Indian Institute of Management Raipur Final Placement Report 2013 Introduction IIM Raipur is proud to announce its successful completion of the placement process for the second batch of its flagship program
A Study on Consumer Behavior of Aavin Milk in Bhel Township: Trichy
 ISSN: 2321-7782 (Online) Volume 1, Issue 4, September 2013 International Journal of Advance Research in Computer Science and Management Studies Research Paper Available online at: www.ijarcsms.com A Study
ARHINFUL LORETTA ABA A (844974) SAM PETRA MENSIMAA (844794) AHMED SK ASHIF (843888)
 SAM PETRA MENSIMAA (844794) AHMED SK ASHIF (843888)") GROUP MEMBERS ARHINFUL LORETTA ABA A (844974) SAM PETRA MENSIMAA (844794) AHMED SK ASHIF (843888) P W 1 THE HRM BUSINESS MODEL OF ENTERPRISE LIFE ASSURANCE COMPANY GHANA (ELAC) CONTENT ENTERPRISE LIFE
GROUP MEMBERS ARHINFUL LORETTA ABA A (844974) SAM PETRA MENSIMAA (844794) AHMED SK ASHIF (843888) P W 1 THE HRM BUSINESS MODEL OF ENTERPRISE LIFE ASSURANCE COMPANY GHANA (ELAC) CONTENT ENTERPRISE LIFE
TRAINING SECTION FREQUENTLY ASKED QUESTIONS
 TRAINING SECTION FREQUENTLY ASKED QUESTIONS S. NO. QUESTION REPLY QUERRIES RELATED TO 15 MONTHS TRAINING (MANAGEMENT TRAINING) 1 Can 15 month Management Training be undergone with any company? 2 What is
STRATEGIC PLANNING FOR RURAL MARKETS ALL ROADS LEADING TO RURAL INDIA
 STRATEGIC PLANNING FOR RURAL MARKETS ALL ROADS LEADING TO RURAL INDIA 1 RURAL INDIA - THE OPPORTUNITY The largest market in the world with 700 million Rural Folks With growing purchasing power and increasing
Table 1: Profile of Consumer Particulars Classification Numbers Percentage Upto 20 25 41.67 Age. 21 to 40 18 30.00 Above 40 17 28.
 2014; 1(7): 280-286 IJMRD 2014; 1(7): 280-286 www.allsubjectjournal.com Received: 04-12-2014 Accepted: 22-12-2014 e-issn: 2349-4182 p-issn: 2349-5979 V. Suganthi Assistant Professor, Department of Commerce,
SHRM Job Satisfaction Series: Job Security Survey. Research SHRM
 Job Satisfaction Series: Job Security Survey SHRM Job Satisfaction Series: Job Security Survey Evren Esen Survey Program Coordinator SHRM June 2003 This report is published by the Society for Human Resource
EMPLOYEE RECRUITMENT AND RETENTION PRACTICES IN INDIAN BANKING SECTOR. Dr. Narinder Kaur. Principal. University College, Meerapur ( Patiala)
") EMPLOYEE RECRUITMENT AND RETENTION PRACTICES IN INDIAN BANKING SECTOR Dr. Narinder Kaur Principal University College, Meerapur ( Patiala) nk_patiala@yahoo.com and Introduction Sandeep Bansal Research scholar
EMPLOYEE RECRUITMENT AND RETENTION PRACTICES IN INDIAN BANKING SECTOR Dr. Narinder Kaur Principal University College, Meerapur ( Patiala) nk_patiala@yahoo.com and Introduction Sandeep Bansal Research scholar
Welcome to Apollo Munich Health Insurance Co. Ltd.
 Welcome to Apollo Munich Health Insurance Co. Ltd. Factors Increase in Lifestyle Diseases Why Health Insurance? Urban spending in healthcare will increase due to a variety of factors Healthcare Spend in
COMPUTER SOFTWARE/SERVICES AND ITeS EXPORTS
 COMPUTER SOFTWARE/SERVICES AND ITeS EXPORTS OVERVIEW In recent times, Software development and information technology enabled services (ITeS) including business process outsourcing (BPO)/ knowledge process
MANDARIN ORIENTAL HOTEL GROUP REPORT SUMMARY
 MANDARIN ORIENTAL HOTEL GROUP REPORT SUMMARY THE COMPANY Established in Hong Kong in 1963. Mandarin Oriental Hotel Group is an international hotel investment and management group operating ten hotels in
Please note that this presentation is given to you for information only. This document remains property of Randstad and should never be used or
 Please note that this presentation is given to you for information only. This document remains property of Randstad and should never be used or distributed outside your company. Employer Branding Perception
CIMA SALARY SURVEY 2013. Australia
 CIMA SALARY SURVEY 2013 Australia 1 Foreword CIMA s members and students are looking forward to rapid career progression and salary rises above the national average - despite the continuing economic uncertainty.
HUMAN RESOURCES DEPARTMENT. HR-TAD/M2/Rec/2013 12 th September 2013 RECRUITMENT OF CLERKS AND OFFICERS
 BANKING PARTNER Regd. Office: Aluva, Kerala HUMAN RESOURCES DEPARTMENT HR-TAD/M2/Rec/2013 12 th September 2013 RECRUITMENT OF CLERKS AND OFFICERS Federal Bank, a leading Private Sector Bank having pan
The Retirement Savings Paradigm. Factors Influencing Saving
 The Retirement Savings Paradigm Factors Influencing Saving Contents Executive Summary 2 Introduction 4 Why Study Retirement Savings 6 Data and Methodology 7 Key Findings 8 Conclusion 18 About ADP 19 Executive
PMR. India the leading destination for outsourcing IT services FREE ARTICLE. www.ictrussia.com
 FREE ARTICLE India the leading destination for outsourcing IT services Source: IT outsourcing in Central and Eastern Europe 2009 Countries attractiveness and development forecasts February 2009 PMR P U
1 The total values reported in the tables and
 1 Recruiting is increasingly social and Adecco wants to know how it works. An international survey, that involved over 17.272 candidates and 1.502 Human Resources managers between March 18 and June 2,
INDIAN INSTITUTE OF MANAGEMENT RAIPUR. Final Placement Report 2015
 INDIAN INSTITUTE OF MANAGEMENT RAIPUR Final Placement Report 2015 IIM Raipur Proposed Campus Introduction IIM Raipur achieves 100% placements for the fourth consecutive year in record time. The institute
ICRA RESEARCH SERVICES. INDIAN PHARMACEUTICAL INDUSTRY New Pricing Policy: An Update
 ICRA RESEARCH SERVICES Corporate Ratings Subrata Ray +91 22 3047 0027 subrata@icraindia. com Shamsher Dewan +91 124 4545 328 shamsherd@icraindia. com INDIAN PHARMACEUTICAL INDUSTRY New Pricing Policy:
Stake Holders Perceptions in a Campus Recruitment Process
 Stake Holders Perceptions in a Campus Recruitment Process Dr. R. Prabhakara Raya Head, Department of Management Studies, Pondicherry University, Pondicherry, India Email: drrpraya@gmail.com Dr. V.Samuel
COMPARATIVE ANALYSIS OF EQUITY DIVERSIFIED SCHEMES OF HDFC MUTUAL FUND AND RELIANCE MUTUAL FUND
 COMPARATIVE ANALYSIS OF EQUITY DIVERSIFIED SCHEMES OF HDFC MUTUAL FUND AND RELIANCE MUTUAL FUND Abstract Mrs. MAMTA PAREEK A mutual fund is just the connecting bridge or a financial intermediary that allows
Millennials at Work. Presentation at the 2013 Financial Management Institute PD Week. Presenters. Lori Watson Partner. Ryan Lotan Director
 www.pwc.com/ca Millennials at Work Understanding Your Future Workforce Presentation at the 2013 Financial Management Institute PD Week Presenters Lori Watson Partner Ryan Lotan Director Franck Hounzangbe
Egon Zehnder International. The Leading Edge of Diversity and Inclusion. 11th International Executive Panel October 2012
 Egon Zehnder International The Leading Edge of Diversity and Inclusion 11th International Executive Panel October 2012 Contents 1 2 3 4 Foreword 3 Executive Summary 4 Survey Design 8 Results The Findings
Netmagic Enhances Simplicloud, Invests in Growing Managed Services Capability
 Netmagic Enhances Simplicloud, Invests in Growing Managed Services Capability BY AGATHA POON Source : https://451research.com/report-short?entityid=88599 Leading Indian managed cloud and IT provider Netmagic
TERI ENVIRONMENTAL SURVEY- 2012 DELHI NCR AND KARNATKA
 TERI ENVIRONMENTAL SURVEY- 2012 DELHI NCR AND KARNATKA 2 1. Introduction The Energy and Resources Institute (TERI) conducted an online Environmental Survey in two selected geographical areas of India the
Cost Management for Sustainable Project Success
 Cost Management for Sustainable Project Success Creating Value based on Values Vincom Cost Management Pvt Ltd About Us Vincom Cost Management was established by Mr. Vinod Markanda, B Arch,PG in Town Planning,
NMIMS School of Business Management, Mumbai FINAL PLACEMENTS 2015
 Overview SVKM s NMIMS School of Business Management, Mumbai has had yet another phenomenal year for its final placements. Continuing the legacy and leveraging on a change in the business sentiment as well
Travel & Tourism s Top Ten Emerging Market
 Travel & Tourism s Top Ten Emerging Market Presented by: Tourism Intelligence International Vienna, October 2011 Travel and Tourism Top Ten Emerging Markets India India the Future Superpower India s Economy
Joint Stock Company. Lesson 8. 8.1 Objectives. 8.2 Meaning of Joint Stock Company
 Lesson 8 Joint Stock Company You must have heard about Reliance Industries Limited (RIL), Tata Iron and Steel Company Limited (TISCO), Steel Authority of India Limited (SAIL), Maruti Udyog Limited (MUL),
INSPIRING THE NEXT GENERATION WORKFORCE THE 2014 MILLENNIAL IMPACT REPORT EXECUTIVE SUMMARY
 INSPIRING THE NEXT GENERATION WORKFORCE THE 2014 MILLENNIAL IMPACT REPORT EXECUTIVE SUMMARY ABOUT THE RESEARCH For the 2014 Millennial Impact Report, Achieve gathered information from two different sources:
HRM. The importance of HRM. Why Human Resource Management (HRM) is important for organizations today to make
 is important for organizations today to make") HRM The importance of HRM Why Human Resource Management (HRM) is important for organizations today to make their Human Resource into a competitive advantage Mr. CHUOP Theot Therith (2009), MBA, BIT, DPA
HRM The importance of HRM Why Human Resource Management (HRM) is important for organizations today to make their Human Resource into a competitive advantage Mr. CHUOP Theot Therith (2009), MBA, BIT, DPA
ICICI group insurance businesses. July 2003
 ICICI group insurance businesses July 2003 Contents Indian insurance sector ICICI Prudential Life Insurance ICICI Lombard General Insurance 2 The insurance opportunity in India 16.0% 14.0% 12.0% 14.2%
PG Diploma in Clinical Research, Pharmacovigilance, Regulatory and Clinical Data Management
 PG Diploma in Clinical Research, Pharmacovigilance, Regulatory and Clinical Data Management Contact: +91 9886735658, 080 28411665 ext 5103 Email: crtraining@avesthagen.com PG Diploma In Clinical Research,
Research into Issues Surrounding Human Bones in Museums Prepared for
 Research into Issues Surrounding Human Bones in Museums Prepared for 1 CONTENTS 1. OBJECTIVES & RESEARCH APPROACH 2. FINDINGS a. Visits to Museums and Archaeological Sites b. Interest in Archaeology c.
Annual Compensation & Benefits Trends Survey India FY 2015-16
 Annual Compensation & Benefits Trends Survey India FY 2015-16 Human Capital Consulting April 2015 To receive sector-wise analysis, please visit contact us section at the end of this report Table of Contents
REPORT ON UVIC S 2014-15 INTERNAL COMMUNICATIONS SURVEY
 REPORT ON UVIC S 2014-15 INTERNAL COMMUNICATIONS SURVEY INTRODUCTION In the Fall of 2013, President Jamie Cassels conducted a series of campus conversations designed to develop focus and priorities for
The Asset. Allocation Guide To. Wealth Creation. Absolute Return. Gold. Vehicle. Real Estate. Tax. An Investor Education Initiative by.
 The Asset Allocation Guide To Wealth Creation Real Estate Cash Reserves Vehicle Education Gold Tax Funds Food Car Equities Bonds House Precious Metals Fixed Income Natural Resources Absolute Return Understanding
to selection. If you have any questions about these results or In the second half of 2014 we carried out an international
 Candidate Experience Survey RESULTS INTRODUCTION As an HR consultancy, we spend a lot of time talking We ve set out this report to focus on the findings of to our clients about how they can make their