Applied Data Mining Analysis: Guide Via Examples.
|
|
|
- Darlene Allen
- 7 years ago
- Views:
Transcription
1 Applied Data Mining Analysis: Guide Via Examples Dan Steinberg, Milkail Golovnya, N Scott Cardell July 2013 Salford Systems

2 Modern Analytics Interest and research in what we now think of data mining and machine learning goes back to at least 1960s Perceptron pre-neural Network introduced in 1957 IEEE Transactions on Pattern Analysis and Machine Intelligence, January 1979 (vol. 1 no. 1) ACM KDD Knowledge Discovery in Databases series of conferences began informally in 1989, formally in 1995 Field is now in a stage of extraordinary growth and brings together concepts and techniques from statistics and computer science Recent extension of topics to Big Data fueled by Google s MapReduce, Yahoo! Development of Hadoop, Amazon EC Easy, massively parallel data processing

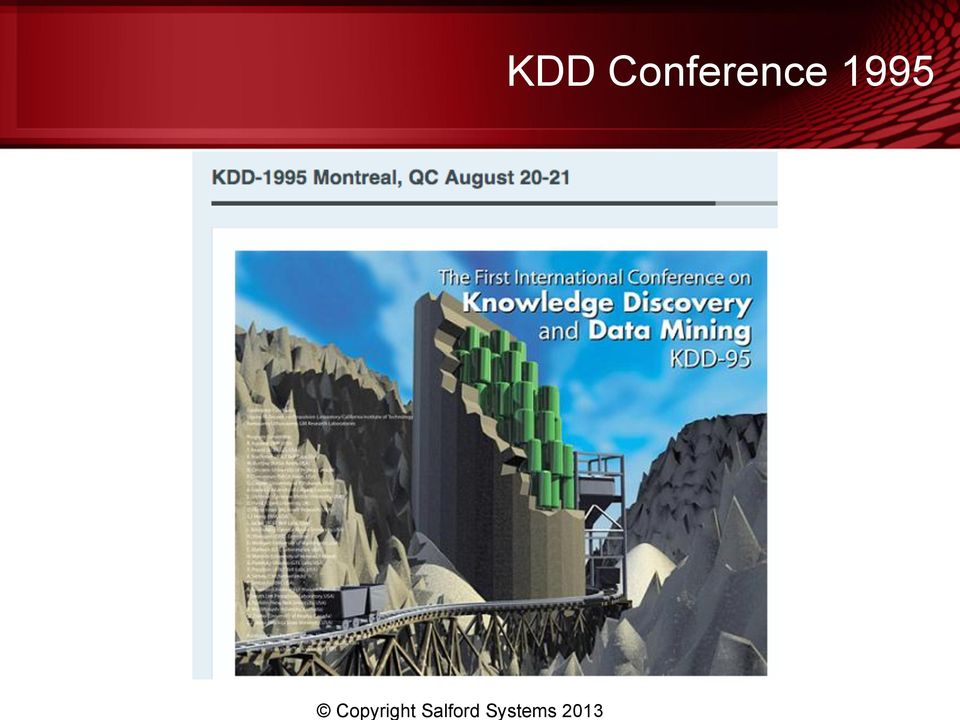
3 KDD Conference 1995
4 IEEE Pattern Analysis 1979 Vol 1, No. 1 Copyright Salford Systems 2013

5 Data Mining Key concepts differentiating data mining from traditional statistics Very few assumptions about the data or about the models to be built Emphasis on learning as much as possible from the data Emphasis on a fair degree of automation and search Allowing for a far larger space of possible models Typically computer intensive methods (a simple MARS spline regression might fit the equivalent of 70,000 models) Some early definitions of data mining emphasized the volume of data being analyzed (data mining=lots of data) but can use these techniques with very few data records Essentially data mining (or machine learning) is defined by the tools we use to analyze the data
 but can use these techniques with very few data records Essentially data mining (or machine learning) is defined by the tools we use to analyze")
6 Challenges for Data Miners Conceptually same as for statistician Understand problem Acquire appropriate data Define unit of observation and what is being predicted or explained Select appropriate methodology (classification, regression, survival, clustering) and tools Construct useful predictors if not present in data (feature extraction) Some differences in next steps as Data Mining uses much more flexible and adaptive learning algorithms Predictor selection Choice of learning algorithm Avoid overfitting (model too flexible, memorizes train data) Avoid underfitting (model not flexible enough, too few features)
 Avoid underfitting (model not flexible enough, too few")
7 Bias/Variance TradeOff Underfitting Vs Overfitting Rigid models (eg linear regression) when inappropriate have high bias and relatively low variance New training samples tend to yield similar results Overly flexible models can reach the extreme of memorizing the learn data Low bias but high variance Data miner needs to be alert to signals of over- or underfitting and strike the right balance

8 Decision Trees A major advance in analytical technology in which many important concepts of modern analytics were first clearly spelled out Learning machine is actually quite simple conceptually (but the details in making a successful implementation are challenging) Abandons the worlds of hypothesis testing and estimation of parameters (as conventionally understood) Several early versions which did not function well (ID3, AID) were followed by CART which perfected the methodology Paper by Jerome H. Friedman in 1975
 were followed by CART which perfected the methodology Paper by Jerome H.")
9 Tools Used In This Introduction Decision Tree (single CART tree) MARS Adaptive Regression Splines Gradient Boosting (TreeNet Boosted Trees) RandomForests (Ensembles of CART trees) Regularized Regression (GPS Generalized PathSeeker) These tools can get you very far and cover classification, regression, and unsupervised learning (clustering) Neural Networks have cycled in and out of favor (can require considerable experience to learn to use well)
 Neural Networks have cycled in and out of favor (can require considerable experience to")
10 CAR_CLAIM DataSet Insurance related data focused on FRAUD 15,420 records 923 records labeled FRAUD Should keep in mind that not all FRAUD is caught so there may be a few FRAUD cases lurking among the so-called good records Have a classification problem with a minority of the data in the class of interest Data published on the CD ROM included with Dorian Pyle s (1999) Data Preparation for Data Mining Data is on separate CD ROM Some used copies appear to be available on Amazon Book is focused principally on the specifics of data preparation for Neural Networks which have their own unique requirements

11 Salford Predictive Modeler Predictive Modeling package used for the examples Core Statistics Linear Regression Logistic Regression CART Decision Tree (original, by Jerome Friedman) MARS Spline Regression (original, by Jerome Friedman) GPS regularized regression (extended elastic net Jerome Friedman) TreeNet gradient boosting machine ((original, by Jerome Friedman) RandomForests (original, Breiman and Cutler) Automation and model acceleration
 RandomForests (original, Breiman and Cutler) Automation and model")
12 Open Raw Data: CarClaim.CSV Basic peek at data set to obtain main table dimensions (rows and columns) Copyright Salford Systems 2013
 Copyright")
13 Too many Character Variables We see that variables intended to capture numeric measures have been coded as and imported as text

14 Request Descriptive Statistics Icon on toolbar for statistics. Here we request just numeric variables

15 Basic Stats We always check for prevalence of missing data Always review number of distinct values (too few?, too many?

16 Detailed Stats and Tables Copyright Salford Systems 2013

17 Data Prep/Data Repair Not different than what any statistician would do in the earliest stages of data cleaning Remove inconsistent coding that varies across records Enforce consistent spelling of character values Checking for missing value codes Some coding uses NULL for a valid value (e.g. NO or 0) In our case many of the Character variables are intended to encode numeric information AGE of VEHICLE coded as text new 2 years 3 years 4 years 5 years Copyright Salford Systems 2013

18 Straighforward Recoding Here we use built-in BASIC language and command builder/assistant

19 Prepped Data Set has 17 Numeric Variables Previously only had 8 numeric variables Also requested generation of a SAMPLE$ variable (random partition of TEST data) Copyright Salford Systems 2013
 Copyright")
20 CORR for NUMERIC Vars Copyright Salford Systems 2013

21 MDS Scaling of CORR Matrix Positions Variables Quick check for anything bizarre NDAYS_POL_ACCIDENT is at upper right far from other variables AGE and CAR_AGE are on the left
22 Build CART Model Select TARGET (Dependent variable) Avoid clearly inappropriate predictors (RECORDID), clones of TARGET Copyright Salford Systems 2013
23 Test (or Validation) Method Normally reserve some data for testing (typically called validation data)
24 CART Model Learn and Test results respectable and also very close to each other Smallest node has 45 records, reasonable size (we can control this if we want) FOCUS class is YES for FRAUD (Blue= Not Fraud, Red= Fraud) Copyright Salford Systems 2013
25 Quick Overview of Main Tree Logic: Variables Driving Model Copyright Salford Systems 2013
26 Root Node Split Very Effective Very low FRAUD rate among insureds with just Liability coverage Need to grow a Probability Tree to make progress on left Copyright Salford Systems 2013
27 Detailed Inspection of an Interesting Split Test data confirms relatively higher FRAUD risk for Chevy, Toyota, Accura But still low risk Copyright Salford Systems 2013
28 Train vs Test Lift By Node: 9 Nodes versus 4 Nodes Simpler tree generalizes better at the node level If we were to deploy the larger tree we might wish to remap node 4 to its parent (a form of shrinking)
29 Tweaking the Tree BATTERY: Experimental Parameter Variation 35 pre-packaged experiments we might consider running to tweak model
30 BATTERY ROOT: Limited Look Ahead Dictate which variable splits the ROOT node YEAR in the root appears to give better performance but not ideal for prediction Copyright Salford Systems 2013
31 BATTERY ONEOFF Build Trees on One Predictor Only Best predictors in isolation do make sense Allows for nonlinear relationship for continuous variables Copyright Salford Systems 2013
32 BATTERY BOOTSTRAP: Bootstrap Resample Traini Data/Test Data Fixed Assess performance of CART Tree Via Bootstrap Resampling (100 times)
33 Variable Importance Averaging Over Trees Unambiguous ranking of importance of predictors
34 BATTERY PARTITION: Repartition Data Into Learn/Test (Sample Sizes Fixed) Performance evaluation over 100 splits of the data into learn and test (all same size)
35 Logistic Regression: All Variables in Model 83 coefficients estimated due to dummy variable expansion of categoricals. Test ROC is.775
36 Regularized Logistic Regression via GPS: 100 replications on different test partitions Median TEST ROC= th pctile= th pctile=.794 median coefs=19 Optimal models were LASSO or near-lasso Slightly better performance than conventional logistic but much smaller model Copyright Salford Systems 2013
37 Generalized PathSeeker Generalized Elastic Net Even a 3 coefficient model can each a test partition ROC of.764
38 LASSO Variable Importance Ranking Copyright Salford Systems 2013
39 YES/NO Odds Graph Nice monotonic pattern
40 RandomForests: BATTERY NPREDS Here BAGGER works just as well or better than true RF. ROC=.804 Copyright Salford Systems 2013
41 RandomForests Performance Curve ROC test partition=.804
42 YES/NO Odds Graph
43 RandomForests Variable Importance Measure Forest is a collection of trees (for post-processing reasons we recommend at least 500 trees) Normal scoring: drop a record down each tree and compute number of votes for each possible target outcome Instead of normal scoring do the following for each tree and each variable in the model: Randomly scramble the values of a specified variable in place Summary statistics for that variable are unchanged but the values of that variable are now located on the wrong row Scrambling is repeated anew for each tree Compute number of votes for each target outcome for each record Compute deterioration of overall sample performance Most important variable would be hurt most by this scrambling
44 RandomForests Variance Importance Ranking Based on variable scrambling to measure loss of accuracy Scrambling an important variable should hurt accuracy more
45 Summary Data Preparation was essential to make data fully usable Series of models developed rapidly using automated search tools Judgment assisted perfection of model Variety of well performing models
46 KDDCup Page contains data, documentation, description of the challenge (all freely downloadable) KDD conferences began in 1995 and hosted first data mining competition in 1997 KDDCup 1998 used exactly the same data as for 1997 but provided fuller documentation Top performers in 1998 had already analyzed data in 1997 Results of the 1998 competition posted at
47 KDDCup 1998 Data Set and Challenge Raw data contains 481 variables Learn sample N: 95,412 Validation N: 96,367 TARGET_B=0 90, % 91, TARGET_B=1 4, % % Mean IQR SD Mean IQR SD TARGET_D Objective: Create net revenue maximizing mailing list if each mail piece costs $0.68 to send Optimal decision rule: mail if expected value of donation>0.68 defined as Prob(Respond)*E(gift Respond)
48 Modeling Strategies Require two models RESPONSE to mailing BINARY YES/NO GIFTAMOUNT if responded REGRESSION conditional on response Naïve models ignore sample selection process Model each part separately and combine for final scoring Two stage model: Weight records in regression by inverse probability of sample inclusion Upweight records representative of those excluded Model each historical campaign Every list member responded with a gift at least once Every mailing represents a new opportunity to respond Have gift amount at least once for everybody Start with naïve two separate models for simplicity
49 KDDCup98 Possible Outomes Perfect targeting would mail only to the 4,873 respondents Total gifts $76,090 Mailing Cost $ 3,314 Net Revenue $72,776 Mail all net revenue $10,560 Winner in 1998 $14,712 mailing 56,330 people 58.5% of list Using routine methods in SPM (train just on learn sample) net revenue of $15,596 mailing 58,525 people Should beat winner using SPM out of the box (train on learn)
50 Check Randomness of Data Partition Pool data into one file containing all data Create LABEL variable, 1 for learn sample and 0 otherwise Check if LABEL is predictable using any kind of model We just use all variables available Could of course run t-tests or single variable models looking for any problematic difference We found nothing of concern here But have seen major problems in other partitioned data set Something that was supposed to have been randomly determined was clearly not
51 Nature of Data-I Elementary Demographics AGE GENDER Number of children by age group (0-3, 4-7, 8-12, 13-18) STATE of Residence, ZIPCODE Homeowner/renter Household Income Salutation (Dr., Mr., Mrs., Admiral, etc) Census Tract Level Data 286 socioeconomic and demographic indicators covering ethnicity, occupation, industry of employment, type of housing
52 Nature of Data-II Behavioral Data on prior gifts and response patterns RFA style of data, details and coded into groups Recency of response -how recently from a given date Frequency of response -how frequently in previous months Amount of gift when responded -dollar value of gift Campaign characteristics Offer type Calendars Stickers Christmas Cards Other types of cards, such as birthday, condolence, blank Notepad Thank You printed outside Date of mailing
53 Activity Window: Useful Launchpad to Next Actions RAW DATA: Select next action such as histograms, View Data, Summary Stats
54 Stats: Brief View Essential to review data for unexpected coding, quirks, special handling needed
55 Sort By %Missing Descending Might want to drop variables that are genuinely missing at some ultra-high rate But for variables with only 1 good level the missing usually means something -- Often presence/absence or for continuous measures might really signify a 0 Also useful to sort ascending to note vars which have no or vey few missings Copyright Salford Systems 2013
56 Diagnostic CART Run DEPTH=1 LIMIT command ATOM=50 MINCHILD=30 DEPTH=1 Missing Values Controls Dummies for continuous Extra Level for categorical Want to examine power in ROOT node (nonlinear) Should run very fast Using controls suggested results in very useful diagnostics Informative missingness, nonlinear relationship Copyright Salford Systems 2013
57 Partition Test=.2 Some exploratory work needs to cover all the learn data Here we allocate a 20% random subset for testing
58 Ranking ROOT Node Splitters Top splitters are mostly missing. Need to consider why and maybe drop variables RDATE is date of response and missing if donor did not respond to that mailing
59 Model Setup PENALTY Tab Second stage model Penalize for missingness; penalize for high cardinality categorical
60 Key Points to Remember Working with RAW DATA Specify automatic creation of missing value dummy vars Dummy now repairs all binary variables coded BLANK=0 For all other variables tests for informative missingness Use a modeling tool that can handle missings CART, MARS, TreeNet have built-in missing handling CART methods most sophisticated and most flexible as can score any future pattern of missings MARS and TreeNet only handle missing patterns seen in learn data RandomForests uses imputation for missing value handling GPS is a regression/logistic regression tool and will listwise delete
61 ROOT Node Splitter Rankings (penalties active) Missing is now a predictive value. RFA_2$ only has 14 levels and so penalty is inactive (NLEARN>2 K-1 where K=14) PEPSTRFL$ blank is predictive Best splitters have 0 missing and all look reasonable RDATE variables now appear only in the form: Missing or Not Missing (gave or not) Copyright Salford Systems 2013
62 CART Run on All Variables Test Partition ROC=.5822 Kitchen sink model with PENALTIES on missing and HLCs Performance for a single tree is very good and hard to beat
63 BATTERY BOOTSTRAP and PARTITION 30 resamples, test partition fixed (shown below) 30 reruns test partition varying Can we have confidence in our main CART results ROC=.5822? BATTERY BOOTSTRAP: Median ROC= rd rank= th rank=.5824 BATTERY PARTITION : Median ROC= rd rank= th rank=.6009 Copyright Salford Systems 2013
64 Data Prep-1 Here we report on the data prep we did to facilitate subsequent analysis Conversion of dates to days since January 1, 1960 to facilitate date arithmetic (aka SAS dates) Create REGION$ variable from STATE$ (South, West, Northeast, Midwest, Other) Conversion of ZIP to a number and extraction of ZIP1 (first digit) and ZIP3 (first 3 digits) Dummy (0/1) recoding of variables that use 1 vs BLANK coding Break various RFA codes into 3 separate variables (R version, F version, A version)
65 Exploding RFA L3F becomes three separate variables Copyright Salford Systems 2013
66 Data Prep -2 Extract separate Socioeconomic Status (SES) and Urbanicity from combined variable DOMAIN Calculate average, min, max solicited donations Check for unsolicited donations, count, stats of gift amounts Create trend variables in donation amount, frequency Create one principle component per group of Census vars Create TREND vars for Recency, Frequency, and Amount variables Create overall summaries of RFA dimensions limited to last 24 months
67 Census Variables Examples Neighborhood level variables POP901 Number of Persons ETH1 Percent White AGE901 Median Age of Population CHIL1 Percent Children Under Age 7 HHN1 Percent 1 Person Households MARR1 Percent Married DW1 Percent Single Unit Structure HV1 Median Home Value in hundreds HVP1 Percent Home Value >= $200,000 RP1 Percent Renters Paying >= $500 per Month IC1 Median Household Income in hundreds TPE1 Percent Driving to Work Alone Car/Truck/Van LFC1 Percent Adults in Labor Force OCC1 Percent Professional EIC1 Percent Employed in Agriculture EC1 Median Years of School Completed by Adults 25+ VC1 Percent Vietnam Veterans Age 16+ ANC1 Percent Dutch Ancestry LSC1 Percent English Only Speaking
68 Principle Components Created Census variables only Overall Group Specific for 17 subgroups of census variables Also, judgmental slection of a few solo variables PRIN1 PRIN5 over all census variables PRINxx1 group specific first principle component only
69 CART on Census Principle Component Vars Ranks: Ethnicity, Home Costs, Education, Income, Omnibus. ROC=.5288
70 TreeNet Variable Importance Rankings: ROC=.5520 Ranking: Income, Housing, Transportation Ancestry, Labor Force, Household, Ethnicity, Interests Compared to using all raw variables these are quite effective
71 Data Prep-3 Create a new data set which contains one record per mailing per donor Donor who was mailed 5 times would have 5 rows of data By definition each donor responded at least once to a campaign Can build donation models using donation data from every person in data set In original data format TARGET_D is available only for the subset of responders to the most recent campaign Alternative approach did not improve test sample performance and so was abandoned But modeling experiments on this data helped refine predictor list
72 TreeNet Prepped Data: ROC=.6256 Some selection of variables, dropping of redundant variables Very difficult to beat this model (3 rd decimal place ROC only) But can make model performance more stable by trimming predictor list
73 Prepped TreeNet Variable Importances Large predictor list
74 Wrapper Vs Filter Feature Selection Filters treat each predictor in isolation and are thus vulnerable to missing variables important only via interactions Wrapper method uses a model to select variables, typically repeatedly and recursively Build model with many variables and rank all by importance Remove some variables from bottom of list and repeat We call this variable shaving and often run process removing one variable at a time until only one left Recursive Feature Elimination Judgment to select smallest defensible model (tradeoff accuracy for substantial simplification)
75 BATTERY SHAVING: Wrapper Method for Variable Selection Recursive Feature Elimination phrase also seen in literature For rapid scan of data we removed 5 predictors at each step Shaving from the BOTTOM of the ranked list of predictors Shaving from the TOP can also be helpful and enlightening Sometimes removing most important predictors improves generalization error
76 Tabular Display of Backward Shaving Five variables eliminated in each step Eliminating more than one variable per back step is a rough and ready to make rapid progress Could drop many more when working with tens of thousands of predictors Final refinements better done dropping ONE variable per back step
77 SHAVE ERROR and LOVO Instead of dropping least important predictor could TEST which variable to drop by running a LOVO experiment Leave One Variable Out (LOVO) With 20 predictors Shave via Importance Ranking 20 models required Shave via LOVO requires (20*21)/2 210 models required SHAVE ERROR number of models is quadratic in K SHAVE ERROR is repeated LOVO We shave from bottom generally to reach a reduced set of predictors and use SHAVE ERROR for the final refinement
78 Best Performing Model TARGET_B: ROC=.6293 More stable than previous model using many more predictors Can cut back to 12 predictors and still maintain ROC=.6228
79 12 variable RESPONSE Model Copyright Salford Systems 2013
80 TreeNet Partial Dependency Plots Copyright Salford Systems 2013
81 Dependency Plots-2
82 Dependency Plots-3
83 KDD98 Objective: Maximum Net Revenue Objective is not simply to maximize response rate Want to select mailing list based on expected donation Cost of mailing is $0.68 so maximizing net revenue means mailing to those whose expected donation>$0.68 Have moderately good response model after much experimentation Now need donation model which will be a regression Simple approach is to construct Prob(response)* E(Gift Predictors, Response=1) Might want to factor in sample selection bias as regression on TARGET_D is fit to the 5.08% of the prospect list who actually responded
84 KDDCup 1998 Data Set and Challenge Raw data contains 481 variables Learn sample N: 95,412 Validation N: 96,367 TARGET_B=0 90, % 91, TARGET_B=1 4, % % Mean IQR SD Mean IQR SD TARGET_D Objective: Create net revenue maximizing mailing list if each mail piece costs $0.68 to send Optimal decision rule: mail if expected value of donation>0.68 defined as Prob(Respond)*E(gift Respond)
85 TARGET_D Amount of Gift to Campaign 97 Learn Data N= % Max % % 46 95% 32 90% 25 75% Q % Median 13 25% Q % 5 5% 5 2.5% 4 1% 3 0% Min 1 80% of all gifts between $5 and $25 Smallest gift $1.00 so if we know for sure someone will give we should mail 2 nd model required to perfect targeted mailing list Sample Size much smaller so simpler model probably required
86 Kitchen Sink Model Prepped Data Exclude only Raw variables with processed versions TreeNet Test Sample MSE= CART MSE= No point in pursuing a CART model here
87 Outlier Analysis: Lift (Percent of PredictionError/Percent of Data) N Test sample=964 Just 10 records account for 58.33% of SSE (sum of prediction error)
88 Largest Positive Residuals Larger Than Negative Copyright Salford Systems 2013
89 Shaving Five Variables Every Step: For quick search for smaller better model Test sample MSE= with 50 predictors Copyright Salford Systems 2013
90 Imposing Additivity Constraints: TARGET_D Backwards stepwise imposition of additivity. Slight improvement obtained when two variables are constrained. Fully additive model is only slightly worse
91 Sequence of Models Built Raw Data Largest plausible KEEP list on Prepared Data Shaving (Backwards Feature Elimination) to Moderate number of variables Judgmentally selected smallest plausible model Less likely to be overfit and likely to have smallest prediction variance Raw data models were inferior to refined models Looked at Validation results only after Moderate models constructed
92 Results of Several Models Results of models following recommended procedures BATTERY RELATED intended to correct for sampling bias and uses 114 variables in KEEP list Combination BATTERY RELATED Inverse BATTERY RELATED no weight RA Best Smallest Keeplists tgtb18tlud17th tgtb18tlud17tlad tgtb18tlud156th # sent (validate) profit (validate) Observe that every model reported does better than original winners ($14,712) Any user modeling with TreeNet and everyday data prep and model selection should beat winners in 2-3 rounds of model refinement
Applied Data Mining Analysis: A Step-by-Step Introduction Using Real-World Data Sets
 Applied Data Mining Analysis: A Step-by-Step Introduction Using Real-World Data Sets http://info.salford-systems.com/jsm-2015-ctw August 2015 Salford Systems Course Outline Demonstration of two classification
Tree Ensembles: The Power of Post- Processing. December 2012 Dan Steinberg Mikhail Golovnya Salford Systems
 Tree Ensembles: The Power of Post- Processing December 2012 Dan Steinberg Mikhail Golovnya Salford Systems Course Outline Salford Systems quick overview Treenet an ensemble of boosted trees GPS modern
CART 6.0 Feature Matrix
 CART 6.0 Feature Matri Enhanced Descriptive Statistics Full summary statistics Brief summary statistics Stratified summary statistics Charts and histograms Improved User Interface New setup activity window
Gerry Hobbs, Department of Statistics, West Virginia University
 Decision Trees as a Predictive Modeling Method Gerry Hobbs, Department of Statistics, West Virginia University Abstract Predictive modeling has become an important area of interest in tasks such as credit
New Work Item for ISO 3534-5 Predictive Analytics (Initial Notes and Thoughts) Introduction
 Introduction") Introduction New Work Item for ISO 3534-5 Predictive Analytics (Initial Notes and Thoughts) Predictive analytics encompasses the body of statistical knowledge supporting the analysis of massive data sets.
Introduction New Work Item for ISO 3534-5 Predictive Analytics (Initial Notes and Thoughts) Predictive analytics encompasses the body of statistical knowledge supporting the analysis of massive data sets.
Risk pricing for Australian Motor Insurance
 Risk pricing for Australian Motor Insurance Dr Richard Brookes November 2012 Contents 1. Background Scope How many models? 2. Approach Data Variable filtering GLM Interactions Credibility overlay 3. Model
ASSIGNMENT 4 PREDICTIVE MODELING AND GAINS CHARTS
 DATABASE MARKETING Fall 2015, max 24 credits Dead line 15.10. ASSIGNMENT 4 PREDICTIVE MODELING AND GAINS CHARTS PART A Gains chart with excel Prepare a gains chart from the data in \\work\courses\e\27\e20100\ass4b.xls.
Identifying SPAM with Predictive Models
 Identifying SPAM with Predictive Models Dan Steinberg and Mikhaylo Golovnya Salford Systems 1 Introduction The ECML-PKDD 2006 Discovery Challenge posed a topical problem for predictive modelers: how to
IBM SPSS Direct Marketing 23
 IBM SPSS Direct Marketing 23 Note Before using this information and the product it supports, read the information in Notices on page 25. Product Information This edition applies to version 23, release
IBM SPSS Direct Marketing 22
 IBM SPSS Direct Marketing 22 Note Before using this information and the product it supports, read the information in Notices on page 25. Product Information This edition applies to version 22, release
A Property and Casualty Insurance Predictive Modeling Process in SAS
 Paper 11422-2016 A Property and Casualty Insurance Predictive Modeling Process in SAS Mei Najim, Sedgwick Claim Management Services ABSTRACT Predictive analytics is an area that has been developing rapidly
Data Mining: An Overview of Methods and Technologies for Increasing Profits in Direct Marketing. C. Olivia Rud, VP, Fleet Bank
 Data Mining: An Overview of Methods and Technologies for Increasing Profits in Direct Marketing C. Olivia Rud, VP, Fleet Bank ABSTRACT Data Mining is a new term for the common practice of searching through
Data Mining Approaches to Modeling Insurance Risk. Dan Steinberg, Mikhail Golovnya, Scott Cardell. Salford Systems 2009
 Data Mining Approaches to Modeling Insurance Risk Dan Steinberg, Mikhail Golovnya, Scott Cardell Salford Systems 2009 Overview of Topics Covered Examples in the Insurance Industry Predicting at the outset
EXPLORING & MODELING USING INTERACTIVE DECISION TREES IN SAS ENTERPRISE MINER. Copyr i g ht 2013, SAS Ins titut e Inc. All rights res er ve d.
 EXPLORING & MODELING USING INTERACTIVE DECISION TREES IN SAS ENTERPRISE MINER ANALYTICS LIFECYCLE Evaluate & Monitor Model Formulate Problem Data Preparation Deploy Model Data Exploration Validate Models
Modeling Lifetime Value in the Insurance Industry
 Modeling Lifetime Value in the Insurance Industry C. Olivia Parr Rud, Executive Vice President, Data Square, LLC ABSTRACT Acquisition modeling for direct mail insurance has the unique challenge of targeting
Decision Trees from large Databases: SLIQ
 Decision Trees from large Databases: SLIQ C4.5 often iterates over the training set How often? If the training set does not fit into main memory, swapping makes C4.5 unpractical! SLIQ: Sort the values
WebFOCUS RStat. RStat. Predict the Future and Make Effective Decisions Today. WebFOCUS RStat
 Information Builders enables agile information solutions with business intelligence (BI) and integration technologies. WebFOCUS the most widely utilized business intelligence platform connects to any enterprise
Methods for Interaction Detection in Predictive Modeling Using SAS Doug Thompson, PhD, Blue Cross Blue Shield of IL, NM, OK & TX, Chicago, IL
 Paper SA01-2012 Methods for Interaction Detection in Predictive Modeling Using SAS Doug Thompson, PhD, Blue Cross Blue Shield of IL, NM, OK & TX, Chicago, IL ABSTRACT Analysts typically consider combinations
!"!!"#$$%&'()*+$(,%!"#$%$&'()*""%(+,'-*&./#-$&'(-&(0*".$#-$1"(2&."3$'45"
*+$(,%!#$%$&'()*%(+,'-*&./#-$&'(-&(0*.$#-$1(2&.3$'45") !"!!"#$$%&'()*+$(,%!"#$%$&'()*""%(+,'-*&./#-$&'(-&(0*".$#-$1"(2&."3$'45"!"#"$%&#'()*+',$$-.&#',/"-0%.12'32./4'5,5'6/%&)$).2&'7./&)8'5,5'9/2%.%3%&8':")08';:
!"!!"#$$%&'()*+$(,%!"#$%$&'()*""%(+,'-*&./#-$&'(-&(0*".$#-$1"(2&."3$'45"!"#"$%&#'()*+',$$-.&#',/"-0%.12'32./4'5,5'6/%&)$).2&'7./&)8'5,5'9/2%.%3%&8':")08';:
Fast Analytics on Big Data with H20
 Fast Analytics on Big Data with H20 0xdata.com, h2o.ai Tomas Nykodym, Petr Maj Team About H2O and 0xdata H2O is a platform for distributed in memory predictive analytics and machine learning Pure Java,
An Overview of Data Mining: Predictive Modeling for IR in the 21 st Century
 An Overview of Data Mining: Predictive Modeling for IR in the 21 st Century Nora Galambos, PhD Senior Data Scientist Office of Institutional Research, Planning & Effectiveness Stony Brook University AIRPO
Data Mining Methods: Applications for Institutional Research
 Data Mining Methods: Applications for Institutional Research Nora Galambos, PhD Office of Institutional Research, Planning & Effectiveness Stony Brook University NEAIR Annual Conference Philadelphia 2014
NCSS Statistical Software Principal Components Regression. In ordinary least squares, the regression coefficients are estimated using the formula ( )
") Chapter 340 Principal Components Regression Introduction is a technique for analyzing multiple regression data that suffer from multicollinearity. When multicollinearity occurs, least squares estimates
Chapter 340 Principal Components Regression Introduction is a technique for analyzing multiple regression data that suffer from multicollinearity. When multicollinearity occurs, least squares estimates
The Predictive Data Mining Revolution in Scorecards:
 January 13, 2013 StatSoft White Paper The Predictive Data Mining Revolution in Scorecards: Accurate Risk Scoring via Ensemble Models Summary Predictive modeling methods, based on machine learning algorithms
Data Mining Applications in Higher Education
 Executive report Data Mining Applications in Higher Education Jing Luan, PhD Chief Planning and Research Officer, Cabrillo College Founder, Knowledge Discovery Laboratories Table of contents Introduction..............................................................2
Better credit models benefit us all
 Better credit models benefit us all Agenda Credit Scoring - Overview Random Forest - Overview Random Forest outperform logistic regression for credit scoring out of the box Interaction term hypothesis
Data Mining. Nonlinear Classification
 Data Mining Unit # 6 Sajjad Haider Fall 2014 1 Nonlinear Classification Classes may not be separable by a linear boundary Suppose we randomly generate a data set as follows: X has range between 0 to 15
CALCULATIONS & STATISTICS
 CALCULATIONS & STATISTICS CALCULATION OF SCORES Conversion of 1-5 scale to 0-100 scores When you look at your report, you will notice that the scores are reported on a 0-100 scale, even though respondents
THE HYBRID CART-LOGIT MODEL IN CLASSIFICATION AND DATA MINING. Dan Steinberg and N. Scott Cardell
 THE HYBID CAT-LOGIT MODEL IN CLASSIFICATION AND DATA MINING Introduction Dan Steinberg and N. Scott Cardell Most data-mining projects involve classification problems assigning objects to classes whether
Benchmarking of different classes of models used for credit scoring
 Benchmarking of different classes of models used for credit scoring We use this competition as an opportunity to compare the performance of different classes of predictive models. In particular we want
Classification of Bad Accounts in Credit Card Industry
 Classification of Bad Accounts in Credit Card Industry Chengwei Yuan December 12, 2014 Introduction Risk management is critical for a credit card company to survive in such competing industry. In addition
IBM SPSS Direct Marketing 19
 IBM SPSS Direct Marketing 19 Note: Before using this information and the product it supports, read the general information under Notices on p. 105. This document contains proprietary information of SPSS
STATISTICA Formula Guide: Logistic Regression. Table of Contents
 : Table of Contents... 1 Overview of Model... 1 Dispersion... 2 Parameterization... 3 Sigma-Restricted Model... 3 Overparameterized Model... 4 Reference Coding... 4 Model Summary (Summary Tab)... 5 Summary
Location matters. 3 techniques to incorporate geo-spatial effects in one's predictive model
 Location matters. 3 techniques to incorporate geo-spatial effects in one's predictive model Xavier Conort xavier.conort@gear-analytics.com Motivation Location matters! Observed value at one location is
Predicting Flight Delays
 Predicting Flight Delays Dieterich Lawson jdlawson@stanford.edu William Castillo will.castillo@stanford.edu Introduction Every year approximately 20% of airline flights are delayed or cancelled, costing
Data Mining Opportunities in Health Insurance
 Data Mining Opportunities in Health Insurance Methods Innovations and Case Studies Dan Steinberg, Ph.D. Copyright Salford Systems 2008 Analytical Challenges for Health Insurance Competitive pressures in
BOOSTED REGRESSION TREES: A MODERN WAY TO ENHANCE ACTUARIAL MODELLING
 BOOSTED REGRESSION TREES: A MODERN WAY TO ENHANCE ACTUARIAL MODELLING Xavier Conort xavier.conort@gear-analytics.com Session Number: TBR14 Insurance has always been a data business The industry has successfully
IBM SPSS Direct Marketing
 IBM Software IBM SPSS Statistics 19 IBM SPSS Direct Marketing Understand your customers and improve marketing campaigns Highlights With IBM SPSS Direct Marketing, you can: Understand your customers in
Insurance Analytics - analýza dat a prediktivní modelování v pojišťovnictví. Pavel Kříž. Seminář z aktuárských věd MFF 4.
 Insurance Analytics - analýza dat a prediktivní modelování v pojišťovnictví Pavel Kříž Seminář z aktuárských věd MFF 4. dubna 2014 Summary 1. Application areas of Insurance Analytics 2. Insurance Analytics
Why Ensembles Win Data Mining Competitions
 Why Ensembles Win Data Mining Competitions A Predictive Analytics Center of Excellence (PACE) Tech Talk November 14, 2012 Dean Abbott Abbott Analytics, Inc. Blog: http://abbottanalytics.blogspot.com URL:
Using multiple models: Bagging, Boosting, Ensembles, Forests
 Using multiple models: Bagging, Boosting, Ensembles, Forests Bagging Combining predictions from multiple models Different models obtained from bootstrap samples of training data Average predictions or
How To Make A Credit Risk Model For A Bank Account
 TRANSACTIONAL DATA MINING AT LLOYDS BANKING GROUP Csaba Főző csaba.fozo@lloydsbanking.com 15 October 2015 CONTENTS Introduction 04 Random Forest Methodology 06 Transactional Data Mining Project 17 Conclusions
Improving the Performance of Data Mining Models with Data Preparation Using SAS Enterprise Miner Ricardo Galante, SAS Institute Brasil, São Paulo, SP
 Improving the Performance of Data Mining Models with Data Preparation Using SAS Enterprise Miner Ricardo Galante, SAS Institute Brasil, São Paulo, SP ABSTRACT In data mining modelling, data preparation
Learning Example. Machine learning and our focus. Another Example. An example: data (loan application) The data and the goal
 The data and the goal") Learning Example Chapter 18: Learning from Examples 22c:145 An emergency room in a hospital measures 17 variables (e.g., blood pressure, age, etc) of newly admitted patients. A decision is needed: whether
Learning Example Chapter 18: Learning from Examples 22c:145 An emergency room in a hospital measures 17 variables (e.g., blood pressure, age, etc) of newly admitted patients. A decision is needed: whether
IBM SPSS Data Preparation 22
 IBM SPSS Data Preparation 22 Note Before using this information and the product it supports, read the information in Notices on page 33. Product Information This edition applies to version 22, release
Data Mining Applications in Fund Raising
 Data Mining Applications in Fund Raising Nafisseh Heiat Data mining tools make it possible to apply mathematical models to the historical data to manipulate and discover new information. In this study,
Stepwise Regression. Chapter 311. Introduction. Variable Selection Procedures. Forward (Step-Up) Selection
 Selection") Chapter 311 Introduction Often, theory and experience give only general direction as to which of a pool of candidate variables (including transformed variables) should be included in the regression model.
Chapter 311 Introduction Often, theory and experience give only general direction as to which of a pool of candidate variables (including transformed variables) should be included in the regression model.
A Property & Casualty Insurance Predictive Modeling Process in SAS
 Paper AA-02-2015 A Property & Casualty Insurance Predictive Modeling Process in SAS 1.0 ABSTRACT Mei Najim, Sedgwick Claim Management Services, Chicago, Illinois Predictive analytics has been developing
Class #6: Non-linear classification. ML4Bio 2012 February 17 th, 2012 Quaid Morris
 Class #6: Non-linear classification ML4Bio 2012 February 17 th, 2012 Quaid Morris 1 Module #: Title of Module 2 Review Overview Linear separability Non-linear classification Linear Support Vector Machines
Data Mining: Overview. What is Data Mining?
 Data Mining: Overview What is Data Mining? Recently * coined term for confluence of ideas from statistics and computer science (machine learning and database methods) applied to large databases in science,
Big Data Big Deal? Salford Systems www.salford-systems.com
 Big Data Big Deal? Salford Systems www.salford-systems.com 2015 Copyright Salford Systems 2010-2015 Big Data Is The New In Thing Google trends as of September 24, 2015 Difficult to read trade press without
Role of Customer Response Models in Customer Solicitation Center s Direct Marketing Campaign
 Role of Customer Response Models in Customer Solicitation Center s Direct Marketing Campaign Arun K Mandapaka, Amit Singh Kushwah, Dr.Goutam Chakraborty Oklahoma State University, OK, USA ABSTRACT Direct
Data Mining - Evaluation of Classifiers
 Data Mining - Evaluation of Classifiers Lecturer: JERZY STEFANOWSKI Institute of Computing Sciences Poznan University of Technology Poznan, Poland Lecture 4 SE Master Course 2008/2009 revised for 2010
Text Analytics using High Performance SAS Text Miner
 Text Analytics using High Performance SAS Text Miner Edward R. Jones, Ph.D. Exec. Vice Pres.; Texas A&M Statistical Services Abstract: The latest release of SAS Enterprise Miner, version 13.1, contains
COMP3420: Advanced Databases and Data Mining. Classification and prediction: Introduction and Decision Tree Induction
 COMP3420: Advanced Databases and Data Mining Classification and prediction: Introduction and Decision Tree Induction Lecture outline Classification versus prediction Classification A two step process Supervised
Why do statisticians "hate" us?
 Why do statisticians "hate" us? David Hand, Heikki Mannila, Padhraic Smyth "Data mining is the analysis of (often large) observational data sets to find unsuspected relationships and to summarize the data
Chapter Seven. Multiple regression An introduction to multiple regression Performing a multiple regression on SPSS
 Chapter Seven Multiple regression An introduction to multiple regression Performing a multiple regression on SPSS Section : An introduction to multiple regression WHAT IS MULTIPLE REGRESSION? Multiple
Successful Mailings in The Raiser s Edge
 Bill Connors 2010 Bill Connors, CFRE November 18, 2008 Agenda Introduction Preparation Query Mail Export Follow-up Q&A Blackbaud s Conference for Nonprofits Charleston Bill Connors, CFRE Page #2 Introduction
MISSING DATA TECHNIQUES WITH SAS. IDRE Statistical Consulting Group
 MISSING DATA TECHNIQUES WITH SAS IDRE Statistical Consulting Group ROAD MAP FOR TODAY To discuss: 1. Commonly used techniques for handling missing data, focusing on multiple imputation 2. Issues that could
Easily Identify Your Best Customers
 IBM SPSS Statistics Easily Identify Your Best Customers Use IBM SPSS predictive analytics software to gain insight from your customer database Contents: 1 Introduction 2 Exploring customer data Where do
Machine Learning Big Data using Map Reduce
 Machine Learning Big Data using Map Reduce By Michael Bowles, PhD Where Does Big Data Come From? -Web data (web logs, click histories) -e-commerce applications (purchase histories) -Retail purchase histories
STATISTICA. Financial Institutions. Case Study: Credit Scoring. and
 Financial Institutions and STATISTICA Case Study: Credit Scoring STATISTICA Solutions for Business Intelligence, Data Mining, Quality Control, and Web-based Analytics Table of Contents INTRODUCTION: WHAT
Chapter 12 Bagging and Random Forests
 Chapter 12 Bagging and Random Forests Xiaogang Su Department of Statistics and Actuarial Science University of Central Florida - 1 - Outline A brief introduction to the bootstrap Bagging: basic concepts
How To Run Statistical Tests in Excel
 How To Run Statistical Tests in Excel Microsoft Excel is your best tool for storing and manipulating data, calculating basic descriptive statistics such as means and standard deviations, and conducting
Churn Modeling for Mobile Telecommunications:
 Churn Modeling for Mobile Telecommunications: Winning the Duke/NCR Teradata Center for CRM Competition N. Scott Cardell, Mikhail Golovnya, Dan Steinberg Salford Systems http://www.salford-systems.com June
Predicting borrowers chance of defaulting on credit loans
 Predicting borrowers chance of defaulting on credit loans Junjie Liang (junjie87@stanford.edu) Abstract Credit score prediction is of great interests to banks as the outcome of the prediction algorithm
Additional sources Compilation of sources: http://lrs.ed.uiuc.edu/tseportal/datacollectionmethodologies/jin-tselink/tselink.htm
 Mgt 540 Research Methods Data Analysis 1 Additional sources Compilation of sources: http://lrs.ed.uiuc.edu/tseportal/datacollectionmethodologies/jin-tselink/tselink.htm http://web.utk.edu/~dap/random/order/start.htm
analytics stone Automated Analytics and Predictive Modeling A White Paper by Stone Analytics
 stone analytics Automated Analytics and Predictive Modeling A White Paper by Stone Analytics 3665 Ruffin Road, Suite 300 San Diego, CA 92123 (858) 503-7540 www.stoneanalytics.com Page 1 Automated Analytics
Alex Vidras, David Tysinger. Merkle Inc.
 Using PROC LOGISTIC, SAS MACROS and ODS Output to evaluate the consistency of independent variables during the development of logistic regression models. An example from the retail banking industry ABSTRACT
Weight of Evidence Module
 Formula Guide The purpose of the Weight of Evidence (WoE) module is to provide flexible tools to recode the values in continuous and categorical predictor variables into discrete categories automatically,
Survey Analysis: Data Mining versus Standard Statistical Analysis for Better Analysis of Survey Responses
 Survey Analysis: Data Mining versus Standard Statistical Analysis for Better Analysis of Survey Responses Salford Systems Data Mining 2006 March 27-31 2006 San Diego, CA By Dean Abbott Abbott Analytics
Myth or Fact: The Diminishing Marginal Returns of Variable Creation in Data Mining Solutions
 Myth or Fact: The Diminishing Marginal Returns of Variable in Data Mining Solutions Data Mining practitioners will tell you that much of the real value of their work is the ability to derive and create
Welcome. Data Mining: Updates in Technologies. Xindong Wu. Colorado School of Mines Golden, Colorado 80401, USA
 Welcome Xindong Wu Data Mining: Updates in Technologies Dept of Math and Computer Science Colorado School of Mines Golden, Colorado 80401, USA Email: xwu@ mines.edu Home Page: http://kais.mines.edu/~xwu/
Data Mining Practical Machine Learning Tools and Techniques
 Ensemble learning Data Mining Practical Machine Learning Tools and Techniques Slides for Chapter 8 of Data Mining by I. H. Witten, E. Frank and M. A. Hall Combining multiple models Bagging The basic idea
Descriptive statistics Statistical inference statistical inference, statistical induction and inferential statistics
 Descriptive statistics is the discipline of quantitatively describing the main features of a collection of data. Descriptive statistics are distinguished from inferential statistics (or inductive statistics),
Comparing the Results of Support Vector Machines with Traditional Data Mining Algorithms
 Comparing the Results of Support Vector Machines with Traditional Data Mining Algorithms Scott Pion and Lutz Hamel Abstract This paper presents the results of a series of analyses performed on direct mail
The Data Mining Process
 Sequence for Determining Necessary Data. Wrong: Catalog everything you have, and decide what data is important. Right: Work backward from the solution, define the problem explicitly, and map out the data
Introduction to Quantitative Methods
 Introduction to Quantitative Methods October 15, 2009 Contents 1 Definition of Key Terms 2 2 Descriptive Statistics 3 2.1 Frequency Tables......................... 4 2.2 Measures of Central Tendencies.................
Simple Predictive Analytics Curtis Seare
 Using Excel to Solve Business Problems: Simple Predictive Analytics Curtis Seare Copyright: Vault Analytics July 2010 Contents Section I: Background Information Why use Predictive Analytics? How to use
Leveraging Ensemble Models in SAS Enterprise Miner
 ABSTRACT Paper SAS133-2014 Leveraging Ensemble Models in SAS Enterprise Miner Miguel Maldonado, Jared Dean, Wendy Czika, and Susan Haller SAS Institute Inc. Ensemble models combine two or more models to
IBM SPSS Direct Marketing 20
 IBM SPSS Direct Marketing 20 Note: Before using this information and the product it supports, read the general information under Notices on p. 105. This edition applies to IBM SPSS Statistics 20 and to
SPSS Explore procedure
 SPSS Explore procedure One useful function in SPSS is the Explore procedure, which will produce histograms, boxplots, stem-and-leaf plots and extensive descriptive statistics. To run the Explore procedure,
Course Syllabus. Purposes of Course:
 Course Syllabus Eco 5385.701 Predictive Analytics for Economists Summer 2014 TTh 6:00 8:50 pm and Sat. 12:00 2:50 pm First Day of Class: Tuesday, June 3 Last Day of Class: Tuesday, July 1 251 Maguire Building
Microsoft Azure Machine learning Algorithms
 Microsoft Azure Machine learning Algorithms Tomaž KAŠTRUN @tomaz_tsql Tomaz.kastrun@gmail.com http://tomaztsql.wordpress.com Our Sponsors Speaker info https://tomaztsql.wordpress.com Agenda Focus on explanation
CONTENTS PREFACE 1 INTRODUCTION 1 2 DATA VISUALIZATION 19
 PREFACE xi 1 INTRODUCTION 1 1.1 Overview 1 1.2 Definition 1 1.3 Preparation 2 1.3.1 Overview 2 1.3.2 Accessing Tabular Data 3 1.3.3 Accessing Unstructured Data 3 1.3.4 Understanding the Variables and Observations
Knowledge Discovery and Data Mining
 Knowledge Discovery and Data Mining Unit # 11 Sajjad Haider Fall 2013 1 Supervised Learning Process Data Collection/Preparation Data Cleaning Discretization Supervised/Unuspervised Identification of right
Classification and Regression by randomforest
 Vol. 2/3, December 02 18 Classification and Regression by randomforest Andy Liaw and Matthew Wiener Introduction Recently there has been a lot of interest in ensemble learning methods that generate many
Data Mining Techniques Chapter 6: Decision Trees
 Data Mining Techniques Chapter 6: Decision Trees What is a classification decision tree?.......................................... 2 Visualizing decision trees...................................................
5. Multiple regression
 5. Multiple regression QBUS6840 Predictive Analytics https://www.otexts.org/fpp/5 QBUS6840 Predictive Analytics 5. Multiple regression 2/39 Outline Introduction to multiple linear regression Some useful
Some Essential Statistics The Lure of Statistics
 Some Essential Statistics The Lure of Statistics Data Mining Techniques, by M.J.A. Berry and G.S Linoff, 2004 Statistics vs. Data Mining..lie, damn lie, and statistics mining data to support preconceived
Model Validation Techniques
 Model Validation Techniques Kevin Mahoney, FCAS kmahoney@ travelers.com CAS RPM Seminar March 17, 2010 Uses of Statistical Models in P/C Insurance Examples of Applications Determine expected loss cost
Multiple Linear Regression in Data Mining
 Multiple Linear Regression in Data Mining Contents 2.1. A Review of Multiple Linear Regression 2.2. Illustration of the Regression Process 2.3. Subset Selection in Linear Regression 1 2 Chap. 2 Multiple
Addressing Analytics Challenges in the Insurance Industry. Noe Tuason California State Automobile Association
 Addressing Analytics Challenges in the Insurance Industry Noe Tuason California State Automobile Association Overview Two Challenges: 1. Identifying High/Medium Profit who are High/Low Risk of Flight Prospects
Model Combination. 24 Novembre 2009
 Model Combination 24 Novembre 2009 Datamining 1 2009-2010 Plan 1 Principles of model combination 2 Resampling methods Bagging Random Forests Boosting 3 Hybrid methods Stacking Generic algorithm for mulistrategy
Beating the MLB Moneyline
 Beating the MLB Moneyline Leland Chen llxchen@stanford.edu Andrew He andu@stanford.edu 1 Abstract Sports forecasting is a challenging task that has similarities to stock market prediction, requiring time-series
Server Load Prediction
 Server Load Prediction Suthee Chaidaroon (unsuthee@stanford.edu) Joon Yeong Kim (kim64@stanford.edu) Jonghan Seo (jonghan@stanford.edu) Abstract Estimating server load average is one of the methods that
Your Name: Section: 36-201 INTRODUCTION TO STATISTICAL REASONING Computer Lab Exercise #5 Analysis of Time of Death Data for Soldiers in Vietnam
 Your Name: Section: 36-201 INTRODUCTION TO STATISTICAL REASONING Computer Lab Exercise #5 Analysis of Time of Death Data for Soldiers in Vietnam Objectives: 1. To use exploratory data analysis to investigate
Copyright 2006, SAS Institute Inc. All rights reserved. Predictive Modeling using SAS
 Predictive Modeling using SAS Purpose of Predictive Modeling To Predict the Future x To identify statistically significant attributes or risk factors x To publish findings in Science, Nature, or the New
Big Data Analytics. Benchmarking SAS, R, and Mahout. Allison J. Ames, Ralph Abbey, Wayne Thompson. SAS Institute Inc., Cary, NC
 Technical Paper (Last Revised On: May 6, 2013) Big Data Analytics Benchmarking SAS, R, and Mahout Allison J. Ames, Ralph Abbey, Wayne Thompson SAS Institute Inc., Cary, NC Accurate and Simple Analysis
Data Mining: An Overview. David Madigan http://www.stat.columbia.edu/~madigan
 Data Mining: An Overview David Madigan http://www.stat.columbia.edu/~madigan Overview Brief Introduction to Data Mining Data Mining Algorithms Specific Eamples Algorithms: Disease Clusters Algorithms: