Inference for Data Visualization
|
|
|
- Delphia Goodman
- 7 years ago
- Views:
Transcription
1 Inference for Data Visualization Christof Seiler Stanford University, Spring 2016, Stats 205

2 Introduction Exploratory data analysis is usually not parametric For instance, in Principle Component Analysis (PCA), we do not assume any parametric model (the data doesn t need to be normally distributed) What is described by PCA is a decomposition of the data into Principle Components (PCs) along which the variance is maximized after projecting the data But, as we have seen in this course, it is in general not necessary to assume a parametric model for inference

3 Introduction We successfully used ranks that allowed to remove the normality assumptions in one and two-sample tests We successfully used the bootstrap to sample from the empirical distribution and construct confidence intervals We successfully used permutation tests for hypothesis testing In all these examples we have found ways to make inference Is this possible for data visualization? That s the topic for today

4 Magical Thinking Professional statisticians and other scientists with statistical training were ask How associated the two variables were Source: Diaconis (1983) Most of the subjects judged left plot as more associated than right plot (the same data points) Rescaling can shift the perceived association by 10 to 15%
 Rescaling can shift the perceived")
5 Inference for Plots: The Lineup Source: Buja et al. (2009)

6 Inference for Plots: The Lineup Generate 19 null plots Arrange all 19 plots and insert the real data at random location Ask human viewer to single out the real plot Under the null hypothesis that all plots are the same, there is a one in 20 chance to single out the real one If the viewer chooses the plot of the real data, then the discovery can be assigned a p-value of 1/20 = 0.05 Larger number of null plots could yield a smaller p-value But there is a limit of how many plots a human can consider

7 Inference for Plots: The Lineup This protocol can be repeated with multiple independently recruited viewers Consider K viewers and k K selected the plot of the real data Then the combined p-value is probability P(X k) following a binomial distribution with K trials and success probability 1/20 Can be as small as 0.05 K if all viewers picked the plot of the real data

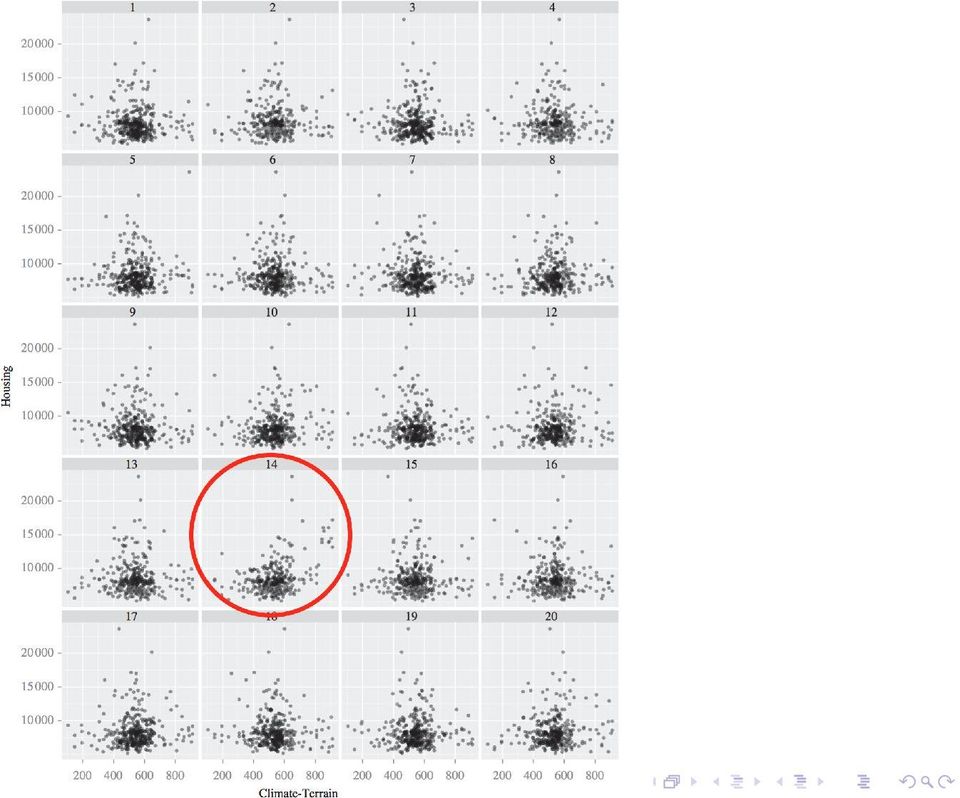
8 Inference for Plots: The Lineup (Example) Example comes from Boyer & Savageau (1984) where cities across the USA were rated in 1984 Question: Is Climate-Terrain associated to Housing? Low values on Climate-Terrain imply uncomfortable temperatures (either hot or cold) High values of Housing indicate a higher cost of owning a single family residence
")
9 Inference for Plots: The Lineup (Example) The null hypothesis for this example is H 0 : Housing is independent of Climate-Terrain The null plots are generated by permuting the values of the variable Housing Pick out the plot of the real data: Is any plot different from the others? Plots on next slide are taken from Buja et al. (2009)

10

11
12 In class experiment # number of students K = 8 # number of correct picks k = 2 pvalue = sum(dbinom(k:k,k,1/20)); pvalue ## [1]
); pvalue ##")
13 Inference for Plots: The Lineup (Example) HSBC (The Hongkong and Shanghai Banking Corporation) daily stock returns two panels, the first showing the 2005 data only, the second the more extensive data In each panel, select which plot is the most different Plots on next slide are taken from Buja et al. (2009)

14

15

16 In class experiment # number of students K = 8 # number of correct picks k = 4 pvalue = sum(dbinom(k:k,k,1/8)); pvalue ## [1]
); pvalue ##")
17 Inference for Plots: The Lineup (Example) For 2005, the viewer should have had difficulty selecting the real data This is a year of low and stable volatility For , it should be easy features two volatility bursts one in 1998 due to the Russian bond default and the LTCM collapse the other in 2001 due to the 9/11 event after, volatility stabilizes at a low level

18 Principal Component Analysis Principal Component Analysis (PCA) is a data exploration tool PCA finds a low-dimensional subspace that minimizes the distances between projections points and subspace Consider observations x 1, x 2,..., x n Center and combine them in matrix X of dimension p n PCA solves this minimization problem with v 1, v 1 = 1 { } ˆv 1 = maximize Var(Xv 1 ) v 1 And for v 2 with v 1, v 2 = 0 and v 2, v 2 = 1 { } ˆv 2 = maximize Var(Xv 2 ) v 2 Keep going the same way until ˆv 1,..., ˆv q have been collected and put them in ˆV q of dimensions p q
 v 1 And for v 2 with v 1, v 2 = 0 and v 2, v 2 = 1 { } ˆv 2 = maximize Var(Xv 2 ) v 2 Keep going the same way until ˆv 1,.")

19 Principal Component Analysis (Example) Condylar process and head Condylar process and head Coronoid Coronoid Angle and ramus Symphyseal and parasymphyseal Body Angle and ramus Symphyseal and parasymphyseal Body Source:

![Principal Component Analysis (Example) Principal component 2 [in standard deviation] -3-2 -1 0](/docs-images/45/23416735/images/20-0.png "1 2-2 -1 0 1 2 3 Principal component 1 [in standard deviation] Source: S.")
20 Principal Component Analysis (Example) Principal component 2 [in standard deviation] Principal component 1 [in standard deviation] Source: S., Pennec, and Reyes 2012

21 Principal Component Analysis (Example) Two animations of mandible eigenanatomy :
22 Bootstrap PCA Two ways to bootstrap PCA in case of random rows X Partial bootstrap and total bootstrap Partial bootstrap: Project B replications onto initial subspace Initial subspace is obtained by PCA on original X Underestimates variation of parameters (Milan 1995) Total bootstrap: Perform new PCA on each replication Problem: Need to align PCA s Nuisance variations: reflections and rotations
23 Bootstrap PCA For the total bootstrap, need to align PCA s This is usually done using Procrustes analysis Procrustes refers to a bandit from Greek mythology who made his victims fit his bed by stretching their limbs (or cutting them off) Procrustes analysis is used in statistical shape analysis to compare aligned shapes after removing nuisance parameters: translation in space rotation in space sometimes scaling of the objects
24 Bootstrap PCA Shape example: landmarks for the human spine
25 Bootstrap PCA Same idea can be applied to align projected observations In PCA, shapes are the projected observations onto the lower dimensional subspace spanned by say PC1 and PC2 Source: Josse, Wager, and Husson (2014)
26 Bootstrap PCA Collecting B bootstrap sampled PCA s by resampling rows of data matrix X ˆV q 1,..., ˆV q B Align all the projected point set using Procrustes alignment Meaning, we find rotation (R T R = I) ˆR b = minimize R = { X 1 ˆV q 1 X b ˆV q b R 2} and apply rotation to projected data points X b ˆV q b b ˆR Overlay points and draw contours around it
27 Parametric Bootstrap PCA In case of fixed rows and columns X, we can use parametric bootstrap It is good alternative when the model is too difficult or before the asymptotics regime Steps: 1. Perform PCA on X to estimate ˆV p 2. Estimate error σ 2 from residual matrix ɛ n p = X ˆV q ˆV T q X (assume elementwise iid normal noise) 3. Bootstrap 1,..., B: Draw ɛ b ij from N(0, ˆσ 2 ) Generate new matrix X b = ˆV T q ˆV q X + ɛ b Perform PCA on X b
28 Parametric Bootstrap PCA (Example) Consumers describe 10 white wines with 15 sensory attributes Consumers score wines between 1 and 10 for each attribute Collect averages across consumers in matrix X Source: Josse et al.
29 Parametric Bootstrap PCA (Example) With boostraped confidence ellipses Source: Josse et al.
30 References Diaconis (1983). Theories of Data Analysis: From Magical Thinking Through Classical Statistics Buja, Cook, Hofmann, Lawrence, Lee, Swayne, and Wickham (2009). Statistical Inference for Exploratory Data Analysis and Model Diagnostics Milan and Whittaker (1995). Application of the Parametric Bootstrap to Models that Incorporate a Singular Value Decomposition Josse, Wager, and Husson (2014). Confidence Areas for Fixed-Effects PCA Seiler, Pennec, and Reyes (2012). Capturing the Multiscale Anatomical Shape Variability with Polyaffine Transformation Trees
Introduction to General and Generalized Linear Models
 Introduction to General and Generalized Linear Models General Linear Models - part I Henrik Madsen Poul Thyregod Informatics and Mathematical Modelling Technical University of Denmark DK-2800 Kgs. Lyngby
Multivariate Analysis of Ecological Data
 Multivariate Analysis of Ecological Data MICHAEL GREENACRE Professor of Statistics at the Pompeu Fabra University in Barcelona, Spain RAUL PRIMICERIO Associate Professor of Ecology, Evolutionary Biology
Stat 411/511 THE RANDOMIZATION TEST. Charlotte Wickham. stat511.cwick.co.nz. Oct 16 2015
 Stat 411/511 THE RANDOMIZATION TEST Oct 16 2015 Charlotte Wickham stat511.cwick.co.nz Today Review randomization model Conduct randomization test What about CIs? Using a t-distribution as an approximation
Review Jeopardy. Blue vs. Orange. Review Jeopardy
 Review Jeopardy Blue vs. Orange Review Jeopardy Jeopardy Round Lectures 0-3 Jeopardy Round $200 How could I measure how far apart (i.e. how different) two observations, y 1 and y 2, are from each other?
Regression III: Advanced Methods
 Lecture 16: Generalized Additive Models Regression III: Advanced Methods Bill Jacoby Michigan State University http://polisci.msu.edu/jacoby/icpsr/regress3 Goals of the Lecture Introduce Additive Models
Tutorial 5: Hypothesis Testing
 Tutorial 5: Hypothesis Testing Rob Nicholls nicholls@mrc-lmb.cam.ac.uk MRC LMB Statistics Course 2014 Contents 1 Introduction................................ 1 2 Testing distributional assumptions....................
An Interactive Tool for Residual Diagnostics for Fitting Spatial Dependencies (with Implementation in R)
") DSC 2003 Working Papers (Draft Versions) http://www.ci.tuwien.ac.at/conferences/dsc-2003/ An Interactive Tool for Residual Diagnostics for Fitting Spatial Dependencies (with Implementation in R) Ernst
DSC 2003 Working Papers (Draft Versions) http://www.ci.tuwien.ac.at/conferences/dsc-2003/ An Interactive Tool for Residual Diagnostics for Fitting Spatial Dependencies (with Implementation in R) Ernst
Tutorial for proteome data analysis using the Perseus software platform
 Tutorial for proteome data analysis using the Perseus software platform Laboratory of Mass Spectrometry, LNBio, CNPEM Tutorial version 1.0, January 2014. Note: This tutorial was written based on the information
Two-sample inference: Continuous data
 Two-sample inference: Continuous data Patrick Breheny April 5 Patrick Breheny STA 580: Biostatistics I 1/32 Introduction Our next two lectures will deal with two-sample inference for continuous data As
Nonparametric statistics and model selection
 Chapter 5 Nonparametric statistics and model selection In Chapter, we learned about the t-test and its variations. These were designed to compare sample means, and relied heavily on assumptions of normality.
The Variability of P-Values. Summary
 The Variability of P-Values Dennis D. Boos Department of Statistics North Carolina State University Raleigh, NC 27695-8203 boos@stat.ncsu.edu August 15, 2009 NC State Statistics Departement Tech Report
Statistics 3202 Introduction to Statistical Inference for Data Analytics 4-semester-hour course
 Statistics 3202 Introduction to Statistical Inference for Data Analytics 4-semester-hour course Prerequisite: Stat 3201 (Introduction to Probability for Data Analytics) Exclusions: Class distribution:
Minitab Tutorials for Design and Analysis of Experiments. Table of Contents
 Table of Contents Introduction to Minitab...2 Example 1 One-Way ANOVA...3 Determining Sample Size in One-way ANOVA...8 Example 2 Two-factor Factorial Design...9 Example 3: Randomized Complete Block Design...14
CONTENTS OF DAY 2. II. Why Random Sampling is Important 9 A myth, an urban legend, and the real reason NOTES FOR SUMMER STATISTICS INSTITUTE COURSE
 1 2 CONTENTS OF DAY 2 I. More Precise Definition of Simple Random Sample 3 Connection with independent random variables 3 Problems with small populations 8 II. Why Random Sampling is Important 9 A myth,
INTERPRETING THE ONE-WAY ANALYSIS OF VARIANCE (ANOVA)
") INTERPRETING THE ONE-WAY ANALYSIS OF VARIANCE (ANOVA) As with other parametric statistics, we begin the one-way ANOVA with a test of the underlying assumptions. Our first assumption is the assumption of
INTERPRETING THE ONE-WAY ANALYSIS OF VARIANCE (ANOVA) As with other parametric statistics, we begin the one-way ANOVA with a test of the underlying assumptions. Our first assumption is the assumption of
Data Mining Introduction
 Data Mining Introduction Bob Stine Dept of Statistics, School University of Pennsylvania www-stat.wharton.upenn.edu/~stine What is data mining? An insult? Predictive modeling Large, wide data sets, often
Curriculum Map Statistics and Probability Honors (348) Saugus High School Saugus Public Schools 2009-2010
 Saugus High School Saugus Public Schools 2009-2010") Curriculum Map Statistics and Probability Honors (348) Saugus High School Saugus Public Schools 2009-2010 Week 1 Week 2 14.0 Students organize and describe distributions of data by using a number of different
Curriculum Map Statistics and Probability Honors (348) Saugus High School Saugus Public Schools 2009-2010 Week 1 Week 2 14.0 Students organize and describe distributions of data by using a number of different
MONT 107N Understanding Randomness Solutions For Final Examination May 11, 2010
 MONT 07N Understanding Randomness Solutions For Final Examination May, 00 Short Answer (a) (0) How are the EV and SE for the sum of n draws with replacement from a box computed? Solution: The EV is n times
Simple Linear Regression Inference
 Simple Linear Regression Inference 1 Inference requirements The Normality assumption of the stochastic term e is needed for inference even if it is not a OLS requirement. Therefore we have: Interpretation
Least-Squares Intersection of Lines
 Least-Squares Intersection of Lines Johannes Traa - UIUC 2013 This write-up derives the least-squares solution for the intersection of lines. In the general case, a set of lines will not intersect at a
Why Taking This Course? Course Introduction, Descriptive Statistics and Data Visualization. Learning Goals. GENOME 560, Spring 2012
 Why Taking This Course? Course Introduction, Descriptive Statistics and Data Visualization GENOME 560, Spring 2012 Data are interesting because they help us understand the world Genomics: Massive Amounts
CHAPTER 14 NONPARAMETRIC TESTS
 CHAPTER 14 NONPARAMETRIC TESTS Everything that we have done up until now in statistics has relied heavily on one major fact: that our data is normally distributed. We have been able to make inferences
Multivariate normal distribution and testing for means (see MKB Ch 3)
") Multivariate normal distribution and testing for means (see MKB Ch 3) Where are we going? 2 One-sample t-test (univariate).................................................. 3 Two-sample t-test (univariate).................................................
Multivariate normal distribution and testing for means (see MKB Ch 3) Where are we going? 2 One-sample t-test (univariate).................................................. 3 Two-sample t-test (univariate).................................................
Section 13, Part 1 ANOVA. Analysis Of Variance
 Section 13, Part 1 ANOVA Analysis Of Variance Course Overview So far in this course we ve covered: Descriptive statistics Summary statistics Tables and Graphs Probability Probability Rules Probability
Fairfield Public Schools
 Mathematics Fairfield Public Schools AP Statistics AP Statistics BOE Approved 04/08/2014 1 AP STATISTICS Critical Areas of Focus AP Statistics is a rigorous course that offers advanced students an opportunity
Multivariate Normal Distribution
 Multivariate Normal Distribution Lecture 4 July 21, 2011 Advanced Multivariate Statistical Methods ICPSR Summer Session #2 Lecture #4-7/21/2011 Slide 1 of 41 Last Time Matrices and vectors Eigenvalues
General Method: Difference of Means. 3. Calculate df: either Welch-Satterthwaite formula or simpler df = min(n 1, n 2 ) 1.
 1.") General Method: Difference of Means 1. Calculate x 1, x 2, SE 1, SE 2. 2. Combined SE = SE1 2 + SE2 2. ASSUMES INDEPENDENT SAMPLES. 3. Calculate df: either Welch-Satterthwaite formula or simpler df = min(n
General Method: Difference of Means 1. Calculate x 1, x 2, SE 1, SE 2. 2. Combined SE = SE1 2 + SE2 2. ASSUMES INDEPENDENT SAMPLES. 3. Calculate df: either Welch-Satterthwaite formula or simpler df = min(n
NONPARAMETRIC STATISTICS 1. depend on assumptions about the underlying distribution of the data (or on the Central Limit Theorem)
") NONPARAMETRIC STATISTICS 1 PREVIOUSLY parametric statistics in estimation and hypothesis testing... construction of confidence intervals computing of p-values classical significance testing depend on assumptions
NONPARAMETRIC STATISTICS 1 PREVIOUSLY parametric statistics in estimation and hypothesis testing... construction of confidence intervals computing of p-values classical significance testing depend on assumptions
Sample Size and Power in Clinical Trials
 Sample Size and Power in Clinical Trials Version 1.0 May 011 1. Power of a Test. Factors affecting Power 3. Required Sample Size RELATED ISSUES 1. Effect Size. Test Statistics 3. Variation 4. Significance
Tutorial on Exploratory Data Analysis
 Tutorial on Exploratory Data Analysis Julie Josse, François Husson, Sébastien Lê julie.josse at agrocampus-ouest.fr francois.husson at agrocampus-ouest.fr Applied Mathematics Department, Agrocampus Ouest
SCHOOL OF HEALTH AND HUMAN SCIENCES DON T FORGET TO RECODE YOUR MISSING VALUES
 SCHOOL OF HEALTH AND HUMAN SCIENCES Using SPSS Topics addressed today: 1. Differences between groups 2. Graphing Use the s4data.sav file for the first part of this session. DON T FORGET TO RECODE YOUR
Exploratory data analysis for microarray data
 Eploratory data analysis for microarray data Anja von Heydebreck Ma Planck Institute for Molecular Genetics, Dept. Computational Molecular Biology, Berlin, Germany heydebre@molgen.mpg.de Visualization
THE FIRST SET OF EXAMPLES USE SUMMARY DATA... EXAMPLE 7.2, PAGE 227 DESCRIBES A PROBLEM AND A HYPOTHESIS TEST IS PERFORMED IN EXAMPLE 7.
 THERE ARE TWO WAYS TO DO HYPOTHESIS TESTING WITH STATCRUNCH: WITH SUMMARY DATA (AS IN EXAMPLE 7.17, PAGE 236, IN ROSNER); WITH THE ORIGINAL DATA (AS IN EXAMPLE 8.5, PAGE 301 IN ROSNER THAT USES DATA FROM
2013 MBA Jump Start Program. Statistics Module Part 3
 2013 MBA Jump Start Program Module 1: Statistics Thomas Gilbert Part 3 Statistics Module Part 3 Hypothesis Testing (Inference) Regressions 2 1 Making an Investment Decision A researcher in your firm just
Introduction to Principal Components and FactorAnalysis
 Introduction to Principal Components and FactorAnalysis Multivariate Analysis often starts out with data involving a substantial number of correlated variables. Principal Component Analysis (PCA) is a
Non Parametric Inference
 Maura Department of Economics and Finance Università Tor Vergata Outline 1 2 3 Inverse distribution function Theorem: Let U be a uniform random variable on (0, 1). Let X be a continuous random variable
Exploratory Factor Analysis: rotation. Psychology 588: Covariance structure and factor models
 Exploratory Factor Analysis: rotation Psychology 588: Covariance structure and factor models Rotational indeterminacy Given an initial (orthogonal) solution (i.e., Φ = I), there exist infinite pairs of
Service courses for graduate students in degree programs other than the MS or PhD programs in Biostatistics.
 Course Catalog In order to be assured that all prerequisites are met, students must acquire a permission number from the education coordinator prior to enrolling in any Biostatistics course. Courses are
Example: Credit card default, we may be more interested in predicting the probabilty of a default than classifying individuals as default or not.
 Statistical Learning: Chapter 4 Classification 4.1 Introduction Supervised learning with a categorical (Qualitative) response Notation: - Feature vector X, - qualitative response Y, taking values in C
STT315 Chapter 4 Random Variables & Probability Distributions KM. Chapter 4.5, 6, 8 Probability Distributions for Continuous Random Variables
 Chapter 4.5, 6, 8 Probability Distributions for Continuous Random Variables Discrete vs. continuous random variables Examples of continuous distributions o Uniform o Exponential o Normal Recall: A random
How To Understand The Theory Of Probability
 Graduate Programs in Statistics Course Titles STAT 100 CALCULUS AND MATR IX ALGEBRA FOR STATISTICS. Differential and integral calculus; infinite series; matrix algebra STAT 195 INTRODUCTION TO MATHEMATICAL
Using Excel for inferential statistics
 FACT SHEET Using Excel for inferential statistics Introduction When you collect data, you expect a certain amount of variation, just caused by chance. A wide variety of statistical tests can be applied
Experimental Design. Power and Sample Size Determination. Proportions. Proportions. Confidence Interval for p. The Binomial Test
 Experimental Design Power and Sample Size Determination Bret Hanlon and Bret Larget Department of Statistics University of Wisconsin Madison November 3 8, 2011 To this point in the semester, we have largely
NCSS Statistical Software Principal Components Regression. In ordinary least squares, the regression coefficients are estimated using the formula ( )
") Chapter 340 Principal Components Regression Introduction is a technique for analyzing multiple regression data that suffer from multicollinearity. When multicollinearity occurs, least squares estimates
Chapter 340 Principal Components Regression Introduction is a technique for analyzing multiple regression data that suffer from multicollinearity. When multicollinearity occurs, least squares estimates
Name: Date: Use the following to answer questions 3-4:
 Name: Date: 1. Determine whether each of the following statements is true or false. A) The margin of error for a 95% confidence interval for the mean increases as the sample size increases. B) The margin
Projects Involving Statistics (& SPSS)
") Projects Involving Statistics (& SPSS) Academic Skills Advice Starting a project which involves using statistics can feel confusing as there seems to be many different things you can do (charts, graphs,
Projects Involving Statistics (& SPSS) Academic Skills Advice Starting a project which involves using statistics can feel confusing as there seems to be many different things you can do (charts, graphs,
NCSS Statistical Software
 Chapter 06 Introduction This procedure provides several reports for the comparison of two distributions, including confidence intervals for the difference in means, two-sample t-tests, the z-test, the
NCSS Statistical Software
 Chapter 06 Introduction This procedure provides several reports for the comparison of two distributions, including confidence intervals for the difference in means, two-sample t-tests, the z-test, the
Subspace Analysis and Optimization for AAM Based Face Alignment
 Subspace Analysis and Optimization for AAM Based Face Alignment Ming Zhao Chun Chen College of Computer Science Zhejiang University Hangzhou, 310027, P.R.China zhaoming1999@zju.edu.cn Stan Z. Li Microsoft
Package empiricalfdr.deseq2
 Type Package Package empiricalfdr.deseq2 May 27, 2015 Title Simulation-Based False Discovery Rate in RNA-Seq Version 1.0.3 Date 2015-05-26 Author Mikhail V. Matz Maintainer Mikhail V. Matz
From the help desk: Bootstrapped standard errors
 The Stata Journal (2003) 3, Number 1, pp. 71 80 From the help desk: Bootstrapped standard errors Weihua Guan Stata Corporation Abstract. Bootstrapping is a nonparametric approach for evaluating the distribution
LAB 4 INSTRUCTIONS CONFIDENCE INTERVALS AND HYPOTHESIS TESTING
 LAB 4 INSTRUCTIONS CONFIDENCE INTERVALS AND HYPOTHESIS TESTING In this lab you will explore the concept of a confidence interval and hypothesis testing through a simulation problem in engineering setting.
Class 19: Two Way Tables, Conditional Distributions, Chi-Square (Text: Sections 2.5; 9.1)
") Spring 204 Class 9: Two Way Tables, Conditional Distributions, Chi-Square (Text: Sections 2.5; 9.) Big Picture: More than Two Samples In Chapter 7: We looked at quantitative variables and compared the
Spring 204 Class 9: Two Way Tables, Conditional Distributions, Chi-Square (Text: Sections 2.5; 9.) Big Picture: More than Two Samples In Chapter 7: We looked at quantitative variables and compared the
Monitoring chemical processes for early fault detection using multivariate data analysis methods
 Bring data to life Monitoring chemical processes for early fault detection using multivariate data analysis methods by Dr Frank Westad, Chief Scientific Officer, CAMO Software Makers of CAMO 02 Monitoring
SPSS Explore procedure
 SPSS Explore procedure One useful function in SPSS is the Explore procedure, which will produce histograms, boxplots, stem-and-leaf plots and extensive descriptive statistics. To run the Explore procedure,
Principal components analysis
 CS229 Lecture notes Andrew Ng Part XI Principal components analysis In our discussion of factor analysis, we gave a way to model data x R n as approximately lying in some k-dimension subspace, where k
One-Way Analysis of Variance (ANOVA) Example Problem
 Example Problem") One-Way Analysis of Variance (ANOVA) Example Problem Introduction Analysis of Variance (ANOVA) is a hypothesis-testing technique used to test the equality of two or more population (or treatment) means
One-Way Analysis of Variance (ANOVA) Example Problem Introduction Analysis of Variance (ANOVA) is a hypothesis-testing technique used to test the equality of two or more population (or treatment) means
Orthogonal Projections
 Orthogonal Projections and Reflections (with exercises) by D. Klain Version.. Corrections and comments are welcome! Orthogonal Projections Let X,..., X k be a family of linearly independent (column) vectors
II. DISTRIBUTIONS distribution normal distribution. standard scores
 Appendix D Basic Measurement And Statistics The following information was developed by Steven Rothke, PhD, Department of Psychology, Rehabilitation Institute of Chicago (RIC) and expanded by Mary F. Schmidt,
Teaching Statistics with Fathom
 Teaching Statistics with Fathom UCB Extension X369.6 (2 semester units in Education) COURSE DESCRIPTION This is a professional-level, moderated online course in the use of Fathom Dynamic Data software
Recall this chart that showed how most of our course would be organized:
 Chapter 4 One-Way ANOVA Recall this chart that showed how most of our course would be organized: Explanatory Variable(s) Response Variable Methods Categorical Categorical Contingency Tables Categorical
How To Test For Significance On A Data Set
 Non-Parametric Univariate Tests: 1 Sample Sign Test 1 1 SAMPLE SIGN TEST A non-parametric equivalent of the 1 SAMPLE T-TEST. ASSUMPTIONS: Data is non-normally distributed, even after log transforming.
Dimensionality Reduction: Principal Components Analysis
 Dimensionality Reduction: Principal Components Analysis In data mining one often encounters situations where there are a large number of variables in the database. In such situations it is very likely
Least Squares Estimation
 Least Squares Estimation SARA A VAN DE GEER Volume 2, pp 1041 1045 in Encyclopedia of Statistics in Behavioral Science ISBN-13: 978-0-470-86080-9 ISBN-10: 0-470-86080-4 Editors Brian S Everitt & David
Mean = (sum of the values / the number of the value) if probabilities are equal
 if probabilities are equal") Population Mean Mean = (sum of the values / the number of the value) if probabilities are equal Compute the population mean Population/Sample mean: 1. Collect the data 2. sum all the values in the population/sample.
Population Mean Mean = (sum of the values / the number of the value) if probabilities are equal Compute the population mean Population/Sample mean: 1. Collect the data 2. sum all the values in the population/sample.
Once saved, if the file was zipped you will need to unzip it. For the files that I will be posting you need to change the preferences.
 1 Commands in JMP and Statcrunch Below are a set of commands in JMP and Statcrunch which facilitate a basic statistical analysis. The first part concerns commands in JMP, the second part is for analysis
ABSORBENCY OF PAPER TOWELS
 ABSORBENCY OF PAPER TOWELS 15. Brief Version of the Case Study 15.1 Problem Formulation 15.2 Selection of Factors 15.3 Obtaining Random Samples of Paper Towels 15.4 How will the Absorbency be measured?
business statistics using Excel OXFORD UNIVERSITY PRESS Glyn Davis & Branko Pecar
 business statistics using Excel Glyn Davis & Branko Pecar OXFORD UNIVERSITY PRESS Detailed contents Introduction to Microsoft Excel 2003 Overview Learning Objectives 1.1 Introduction to Microsoft Excel
Business Statistics. Successful completion of Introductory and/or Intermediate Algebra courses is recommended before taking Business Statistics.
 Business Course Text Bowerman, Bruce L., Richard T. O'Connell, J. B. Orris, and Dawn C. Porter. Essentials of Business, 2nd edition, McGraw-Hill/Irwin, 2008, ISBN: 978-0-07-331988-9. Required Computing
Department of Economics
 Department of Economics On Testing for Diagonality of Large Dimensional Covariance Matrices George Kapetanios Working Paper No. 526 October 2004 ISSN 1473-0278 On Testing for Diagonality of Large Dimensional
MULTIPLE REGRESSION AND ISSUES IN REGRESSION ANALYSIS
 MULTIPLE REGRESSION AND ISSUES IN REGRESSION ANALYSIS MSR = Mean Regression Sum of Squares MSE = Mean Squared Error RSS = Regression Sum of Squares SSE = Sum of Squared Errors/Residuals α = Level of Significance
STAT 35A HW2 Solutions
 STAT 35A HW2 Solutions http://www.stat.ucla.edu/~dinov/courses_students.dir/09/spring/stat35.dir 1. A computer consulting firm presently has bids out on three projects. Let A i = { awarded project i },
5: Magnitude 6: Convert to Polar 7: Convert to Rectangular
 TI-NSPIRE CALCULATOR MENUS 1: Tools > 1: Define 2: Recall Definition --------------- 3: Delete Variable 4: Clear a-z 5: Clear History --------------- 6: Insert Comment 2: Number > 1: Convert to Decimal
Statistical tests for SPSS
 Statistical tests for SPSS Paolo Coletti A.Y. 2010/11 Free University of Bolzano Bozen Premise This book is a very quick, rough and fast description of statistical tests and their usage. It is explicitly
Math 58. Rumbos Fall 2008 1. Solutions to Review Problems for Exam 2
 Math 58. Rumbos Fall 2008 1 Solutions to Review Problems for Exam 2 1. For each of the following scenarios, determine whether the binomial distribution is the appropriate distribution for the random variable
Iris Sample Data Set. Basic Visualization Techniques: Charts, Graphs and Maps. Summary Statistics. Frequency and Mode
 Iris Sample Data Set Basic Visualization Techniques: Charts, Graphs and Maps CS598 Information Visualization Spring 2010 Many of the exploratory data techniques are illustrated with the Iris Plant data
Exact Nonparametric Tests for Comparing Means - A Personal Summary
 Exact Nonparametric Tests for Comparing Means - A Personal Summary Karl H. Schlag European University Institute 1 December 14, 2006 1 Economics Department, European University Institute. Via della Piazzuola
APPM4720/5720: Fast algorithms for big data. Gunnar Martinsson The University of Colorado at Boulder
 APPM4720/5720: Fast algorithms for big data Gunnar Martinsson The University of Colorado at Boulder Course objectives: The purpose of this course is to teach efficient algorithms for processing very large
Factor Analysis. Chapter 420. Introduction
 Chapter 420 Introduction (FA) is an exploratory technique applied to a set of observed variables that seeks to find underlying factors (subsets of variables) from which the observed variables were generated.
Factors affecting online sales
 Factors affecting online sales Table of contents Summary... 1 Research questions... 1 The dataset... 2 Descriptive statistics: The exploratory stage... 3 Confidence intervals... 4 Hypothesis tests... 4
Risk Decomposition of Investment Portfolios. Dan dibartolomeo Northfield Webinar January 2014
 Risk Decomposition of Investment Portfolios Dan dibartolomeo Northfield Webinar January 2014 Main Concepts for Today Investment practitioners rely on a decomposition of portfolio risk into factors to guide
The Scientific Data Mining Process
 Chapter 4 The Scientific Data Mining Process When I use a word, Humpty Dumpty said, in rather a scornful tone, it means just what I choose it to mean neither more nor less. Lewis Carroll [87, p. 214] In
Imputing Values to Missing Data
 Imputing Values to Missing Data In federated data, between 30%-70% of the data points will have at least one missing attribute - data wastage if we ignore all records with a missing value Remaining data
Elements of statistics (MATH0487-1)
") Elements of statistics (MATH0487-1) Prof. Dr. Dr. K. Van Steen University of Liège, Belgium December 10, 2012 Introduction to Statistics Basic Probability Revisited Sampling Exploratory Data Analysis -
Elements of statistics (MATH0487-1) Prof. Dr. Dr. K. Van Steen University of Liège, Belgium December 10, 2012 Introduction to Statistics Basic Probability Revisited Sampling Exploratory Data Analysis -
Simple Predictive Analytics Curtis Seare
 Using Excel to Solve Business Problems: Simple Predictive Analytics Curtis Seare Copyright: Vault Analytics July 2010 Contents Section I: Background Information Why use Predictive Analytics? How to use
Acknowledgments. Data Mining with Regression. Data Mining Context. Overview. Colleagues
 Data Mining with Regression Teaching an old dog some new tricks Acknowledgments Colleagues Dean Foster in Statistics Lyle Ungar in Computer Science Bob Stine Department of Statistics The School of the
Implementation exercises for the course Heuristic Optimization
 Implementation exercises for the course Heuristic Optimization 1 jeremie.dubois-lacoste@ulb.ac.be IRIDIA, CoDE, ULB February 25, 2015 1 Slides based on last year s excersises by Dr. Franco Mascia. Implement
Quantitative Methods for Finance
 Quantitative Methods for Finance Module 1: The Time Value of Money 1 Learning how to interpret interest rates as required rates of return, discount rates, or opportunity costs. 2 Learning how to explain
Detecting Network Anomalies. Anant Shah
 Detecting Network Anomalies using Traffic Modeling Anant Shah Anomaly Detection Anomalies are deviations from established behavior In most cases anomalies are indications of problems The science of extracting
ANALYSIS OF TREND CHAPTER 5
 ANALYSIS OF TREND CHAPTER 5 ERSH 8310 Lecture 7 September 13, 2007 Today s Class Analysis of trends Using contrasts to do something a bit more practical. Linear trends. Quadratic trends. Trends in SPSS.
Course Text. Required Computing Software. Course Description. Course Objectives. StraighterLine. Business Statistics
 Course Text Business Statistics Lind, Douglas A., Marchal, William A. and Samuel A. Wathen. Basic Statistics for Business and Economics, 7th edition, McGraw-Hill/Irwin, 2010, ISBN: 9780077384470 [This
Chapter 7 Section 7.1: Inference for the Mean of a Population
 Chapter 7 Section 7.1: Inference for the Mean of a Population Now let s look at a similar situation Take an SRS of size n Normal Population : N(, ). Both and are unknown parameters. Unlike what we used
Data Mining: Exploring Data. Lecture Notes for Chapter 3. Slides by Tan, Steinbach, Kumar adapted by Michael Hahsler
 Data Mining: Exploring Data Lecture Notes for Chapter 3 Slides by Tan, Steinbach, Kumar adapted by Michael Hahsler Topics Exploratory Data Analysis Summary Statistics Visualization What is data exploration?
Principle Component Analysis and Partial Least Squares: Two Dimension Reduction Techniques for Regression
 Principle Component Analysis and Partial Least Squares: Two Dimension Reduction Techniques for Regression Saikat Maitra and Jun Yan Abstract: Dimension reduction is one of the major tasks for multivariate
Lecture 2: Descriptive Statistics and Exploratory Data Analysis
 Lecture 2: Descriptive Statistics and Exploratory Data Analysis Further Thoughts on Experimental Design 16 Individuals (8 each from two populations) with replicates Pop 1 Pop 2 Randomly sample 4 individuals
Comparison of frequentist and Bayesian inference. Class 20, 18.05, Spring 2014 Jeremy Orloff and Jonathan Bloom
 Comparison of frequentist and Bayesian inference. Class 20, 18.05, Spring 2014 Jeremy Orloff and Jonathan Bloom 1 Learning Goals 1. Be able to explain the difference between the p-value and a posterior
Cross Validation techniques in R: A brief overview of some methods, packages, and functions for assessing prediction models.
 Cross Validation techniques in R: A brief overview of some methods, packages, and functions for assessing prediction models. Dr. Jon Starkweather, Research and Statistical Support consultant This month
Graphical Inference for Infovis
 IEEE TRANSACTIONS ON VISUALIZATION AND COMPUTER GRAPHICS, VOL. 16, NO. 6, NOVEMBER/DECEMBER 2010 973 Graphical Inference for Infovis Hadley Wickham, Dianne Cook, Heike Hofmann, and Andreas Buja Fig. 1.