Campus Water Uses and Potential Water Efficiencies By: Calvin Kuo Mentors: Professor Melany Hunt, John Onderdonk, Matthew Berbee
|
|
|
- Samuel Briggs
- 7 years ago
- Views:
Transcription
1 Campus Water Uses and Potential Water Efficiencies By: Calvin Kuo Mentors: Professor Melany Hunt, John Onderdonk, Matthew Berbee Abstract: With recent increases in the price of water, saving water has become one of the main focuses for sustainability. The California Institute of Technology used 200,000,000 gallons of water in the year 2008; however the institute has never tracked this water to its destination within the campus. Using data collected from water meters on campus and from the utility company that supplies the campus with water, this research has produced a model that details how the water is distributed throughout campus. With this information, the institute can then identify the heaviest water users and implement measures that will reduce the water consumption on campus. Introduction: The green movement at the California Institute of Technology has made great strides in the past years. Most of the improvements that have been made concern improving electrical efficiency throughout the campus and reducing the carbon footprint. Previous efforts in this area include the installation of motion sensors to shut off lights, solar panels for cleaner energy, and energy efficient light bulbs. However, the institute may have overlooked the importance of water efficiencies and its environmental impact. In response to rising water costs and increasing water shortages in the Los Angeles area, the California Institute of Technology has proposed that water efficiency be one of its priorities in sustainability. As part of an ongoing movement to implement water efficiencies and study their environmental impacts, this report studied the distribution of water within the campus in order to determine areas in which water efficiencies may have the most impact on total water use. The results detailed the heaviest users as the central and satellite utility plants, which are responsible for providing campus with chilled water and electricity. Together, these two plants are responsible for 45% of the campus water consumption. Thus, methods to improve efficiencies regarding the water consumption in the two utility plants would have the most effect on the total campus water consumption. This report was broken into two sections. The first section summarized the water distributions through the California Institute of Technology campus and the second outlined proposed areas in which water efficiency could be improved. California Institute of Technology Water Map Campus Water Mains The California Institute of Technology received its water from the City of Pasadena through eight water mains. The original assumption was that these eight mains were independent of each other and that specific buildings on campus could be mapped to a respective campus water main. Thus, examining the water supply from each main may provide insight into the heaviest water users on campus. The City of Pasadena kept monthly records of the water supplied by each of the eight campus mains for the year Upon reviewing the monthly records for each of the campus mains, it was concluded that several of the campus mains were interconnected and servicing the same area of campus. Analysis from this data showed that at least four of the mains (400 Wilson Ave, 500 Wilson Ave, 523 Wilson Ave, and 550 Wilson Ave) were interconnected. These four mains had significant variations in their water supply,

2 which was inconsistent with total campus water reports that showed a sinusoidal water consumption trend where more water was used in the summer and less in the winter (figures 1 and 2). However, when the four mains water contributions were combined, the familiar trend became apparent (fig. 3), which was evidence that these mains were interconnected. This conclusion was later confirmed by the California Institute of Technology s facilities department. Along with the four mains previously mentioned, they also reported that one other main (1250 East Del Mar) were also interconnected and supplying the same area of campus with water. It is interesting to point out that the 1250 East Del Mar main did not exhibit an abnormal
 were also interconnected and supplying the same area of campus with water.")
3 variation in its water supply that would make it suspect. It was reported that these five mains were all interconnected by pipes whose valves had been left open. The reason for this was that all five mains needed to be connected in order to obtain enough pressure to get water to the top floor of the campus largest building. This finding made it difficult to measure the water usage of specific buildings the data from respective mains for these five mains. Approximate Campus Water Map Despite this setback, the remaining three independent mains could still be mapped to certain buildings on campus. In order to determine which buildings corresponded with each of these three remaining mains, the California Institute of Technology provided the monthly water readings for several buildings and a Goss report that detailed the piping system throughout campus. Unfortunately, many of the monthly water reports for individual buildings were either inaccurate or missing. The California Institute of Technology at the time of this report had approximately 60% of its buildings metered, and was in the process of installing meters in all of its buildings. Thus, to estimate the water use for the missing buildings, all of the buildings were grouped into a subcategory and labeled as research, student life, irrigation, or other. The buildings in one subcategory with known monthly water values were averaged to obtain an average water use per floor area value and then applied to the other unknown buildings to obtain an estimated water use. With this estimated water consumption for all the buildings, the pipelines from the Goss report were analyzed to determine which mains were likely to supply each building with water. Upon further inspection of the Goss report, it was discovered that each campus main was directly connected to a large pipeline that ran through the California Institute of Technology campus. Figure 4 depicts the completed map with the main pipelines running through campus and the respective areas each one serves. This was particularly important for the five interconnected mains, because these large pipelines could be traced to specific buildings. The Goss report also showed several pipelines that connected the large pipelines of four mains that were interconnected. The Goss report didn t show any pipes that connected the final main (the Del Mar main) to the other four. Thus, five interconnected mains could now be traced to specific buildings assuming that these mains were independent of each other. Fluctuations in Water Supply The next step in the analysis for the campus map was to determine the reason for the fluctuations in the water provided by each of the five interconnected mains. Why, for instance, did the 550 Wilson Ave main provide the campus with 4800 CCFs of water in March and only 39 CCFs of water in September? One possible explanation this was that more water would flow through a main if that particular main was experiencing a higher pressure drop between the city line and the campus pipeline. Unfortunately, this would mean that there may be no intake valve at the point of entry into campus that can control the amount of water each main supply. However, at least one piece of data suggests otherwise. According to the monthly reports, a building labeled geophysics exhibited similar heavy water use followed by a sudden drop between the months of July and September as the 550 Wilson Ave main (Figures 5 and 6). The explanation follows that as a building experiences increased demand, water pressure in its pipelines drop, resulting in a larger pressure gradient and increased water flow through its supplying main.

4 Figure 4: A depiction of the campus water map. The eight campus mains are labeled with their major pipelines color coded with areas of the campus. Dashed lines between the major lines represent the interconnecting pipelines. No similar correlation was found in the other mains, which suggests there may be another explanation for the phenomena observed between the 550 Wilson Ave main and the Geophysics meter. It s possible that the geophysics meter tied into a line that branched off the 550 Wilson Ave main, and that when the main stopped supplying water, the geophysics building started to receive water from other lines branching off the other mains in the area. Further investigation in

5 this area will be required to determine if building demands can affect supply from the mains. If that is the case, then the California Institute of Technology can implement strategies to reduce demand from buildings near the entrance of mains that have been experiencing large flow volumes, reducing water flow through those main. Water Uses The final piece in the campus map was to identify what all the water was being used for. Was the water being used in the laboratories on campus, or were the student dormitories the largest offenders of water use? To answer this question, the same building meters were analyzed again and water usage from buildings in each subcategory (research, student life, gyms, irrigation, and utility plants) was summed to give an approximation for the water distribution on campus (Fig. 7). The analysis showed that the largest water users at the California Institute of Technology were the two utility plants on campus: the central and satellite plants. Thus, proposing water efficiency measures for the two plants would most likely produce the largest water savings. But, it was first imperative that the water usage for the plants themselves be investigated. Research facilities used the next largest amount of water; however, improvements in this area would have to be specific to each facility and was not within the scope of this report. Plant Maps There are two utility plants at the California Institute of Technology: the central plant and the satellite plant. Both plants are responsible for providing chilled water to the campus, but the central plant also produces electricity, deionized (DI) water, and steam. Each month, both of the plants report on their water uses. This data was compiled to give a complete water map for the central plant for the year of 2008 (Fig. 8). A similar chart was not created for the satellite plant because all of the satellite plant water was used in the cooling towers. This analysis shows that the cooling towers at the two plants use the most water, indicating that improvements in water efficiencies for the cooling towers would produce the greatest water savings. The reports from the utility plants also included data on where the water went after going through the plant. Much of the plant operations are closed cycles; however, there are many sources for water loss within the system. Figure 9 depicts the distribution of water losses from the central and satellite plants.

6
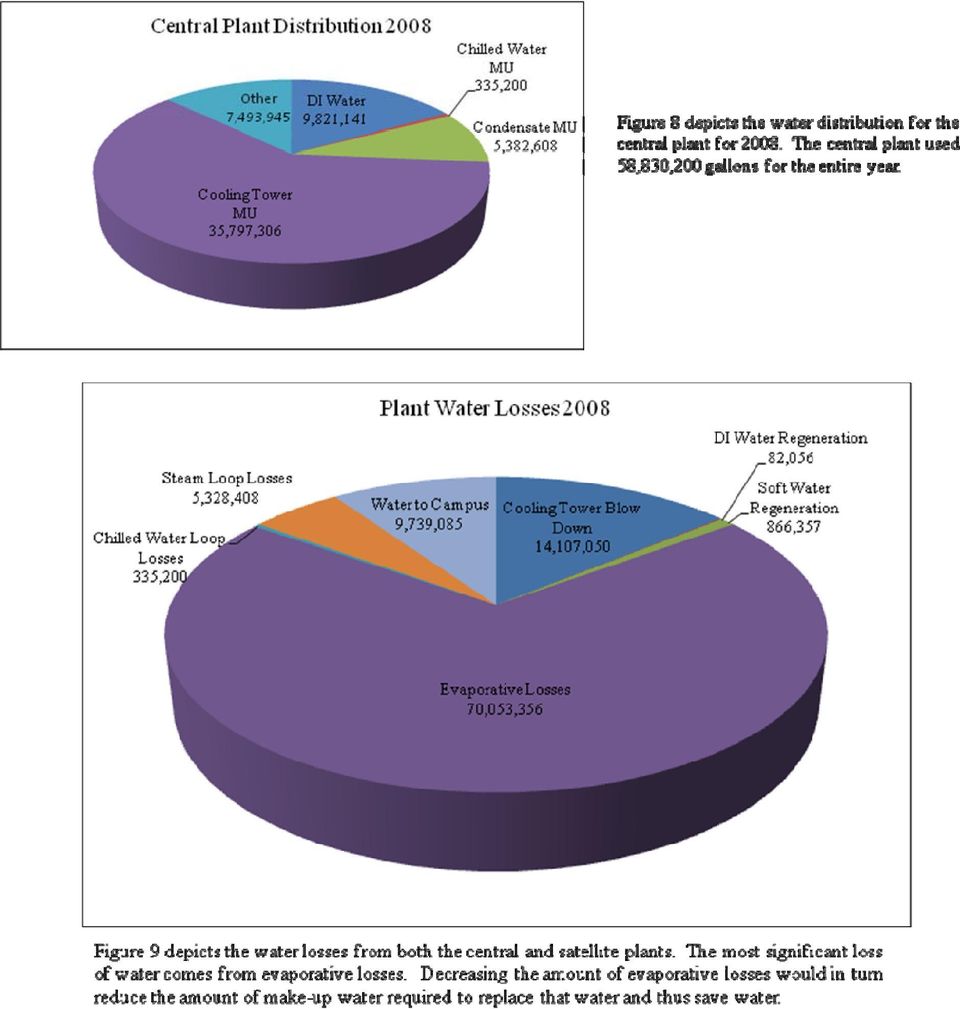
7 Improved Water Efficiencies: Water Reuse As noted before, the monthly reports for the two plants on campus reported their waste water output. The largest of these was the tower blow down, contributing more than 14,000,000 gallons of waste water in the year 2008 between both plants, but the regeneration process from the soft water producers also contributed a significant amount at 866,000 gallons. This report investigated whether the waste water from these sources could be reused with little or no treatment. The main concern for reclamation of waste water from these sources was their salt content. In the tower blow down water, evaporative processes caused salt build-up in the remaining circulating water. For the soft water regeneration process, salt water content was a result of mixing soft water and high concentrations of brine. Chemicals were also added to the tower water in order to prevent bacterial build-up, so this waste water was considered ideal for non-potable campus uses so long as the salt concentrations were acceptable. The tower only blew down water when salinity levels reached a dangerous level that could compromise tower equipment. The salinity level was determined by the water s electric conductivity (EC). Tap water has an EC of approximately 0.5 ms/cm, which is equivalent to a total dissolved salt (TDS) concentration of 0.25 parts per thousand (ppt). Comparatively, the tower blow down was designed to release water when the EC reached 3.5 ms/cm, or approximately 1.8ppm. The soft water regeneration process involved mixtures of soft water and high concentrations of brine. However, there were three parts to the regeneration process, each requiring a different ratio of soft water and brine. The first was a brief rinse of soft water through the resin, followed by a longer blast of soft water and highly concentrated brine, and then finally a rinse of the system with soft water. This presented a problem, because the concentration of the waste water from the soft water regeneration process was different depending on the stage in the regeneration process. To get a better idea of the concentrations of the waste water during each period, a sample of waste water was analyzed every five minutes during the 90 minute regeneration cycle. The analysis involved a specific gravity measurement and is presented in table 1. The soft water specific gravity was measured to be whereas the brine specific gravity was Using this information, the ratios of soft water to brine could be determined at each step in the process. The concentrations of the waste water were determined based on the salt concentrations of the brine and the soft water. The plant uses 100% saturated brine for soft water regeneration, so the concentration for a 100% saturated solution is approximately 360ppt. Soft water salt concentrations are very similar to tap water concentrations with a maximum accepted value of 0.5ppt. Based on this analysis, table 1 shows the salinity concentrations for each sample collected during the regeneration process. Unfortunately, this process produces a lot of saline waste water that is might not be usable for most processes. For this analysis, only water with less than 20ppt salt was considered as usable. Several non potable uses for this water were investigated for the purposes of this research. The first involved irrigation of fields and grassy areas on campus. Plants and grass can be harmed by high salt concentrations; however there are several grass species that can withstand the tower blow down salt concentrations (2ppt) such as Kentucky bluegrass or Buffalograss. Despite the fact that these grasses can withstand the salinity level of the tower blow down, the soil may not. Thus, to determine if the tower blow down water can be used for irrigation purposes, the institute will need to experiment with a small area in order to determine if the salt concentrations will not adversely affect soil integrity or grass growth.

8 The institute has also proposed that the waste water could be used to refill certain water features (such as fountains) around campus. Students at the California Institute of Technology often use the various fountains for certain traditions, but the salt concentrations are safe for human contact. However, the various chemicals used in the tower to control bacterial growth are also a concern in this case. Such chemicals should be checked to see if they re safe for human contact. Otherwise, the waste water could be reliably used to refill such water features. A final possible use for this waste water would be to reuse it within the plant system. The water could be sent back to the soft water producers mixed with normal tap water and used within the plant for the towers, DI production, and make-up water for the other water systems. Reusing this water in this manner would raise the total salinity level of the soft water produced by approximately 0.02ppm. This is because most of the water being fed to the soft water producers will be tap water and the small amounts of higher saline water will raise the salinity of the solution by approximately 0.02ppm. As a result, tower blow downs will likely occur more frequently because the salt concentrations of the feed water are slightly increased and some other systems might be affected as well. The best way to approach the system would be to slowly increase the amount of tower blow down and soft water regeneration waste water given to the soft water purifiers, watching for any effects on the machinery or efficiency of the various processes within the plants. Cooling Tower Efficiency The largest users of water in the two plants are the cooling towers. The cooling towers cool water through evaporation and heat exchange with the air and then sends the cool water to the water chillers, the steam generators, and other heat producing processes. Making the cooling towers more water efficient would significantly reduce water use at the California Institute of Technology. This research investigated possibility of making the towers more efficient by changing the time of day the towers are used. The idea was inspired by a project that was seeking government funding and involved running the cooling towers and water chillers mainly

9 in the evenings when electricity was cheapest and storing the chilled water in underground tanks for use during the day. However, the idea of running the cooling towers in the evenings would not only save money in electrical costs, but also theoretically save water. Cooling towers rely on evaporation of water and heat exchanges with the ambient air. Pasadena weather is rather consistent, being warmer and drier during the day and cooler and more humid during the evening. Thus, during the day, more cooling would result from evaporation because the air would be warm (less heat exchange) and dry (more evaporation). But during the evenings, more cooling will result from heat exchange with the air because it s cooler and more humid. In order to show that this idea could be feasible, a model was created for the cooling towers. This model represented an ideal cooling tower based on thermodynamic properties of the water and the air, assuming that the mass and enthalpy of each is conserved between intake and output. The main purpose of the model was to predict the amount of evaporation as a function of the ambient air temperature and humidity (the two main factors that will affect the cooling of the water). The amount of water used by the tower directly correlated to the amount of water was evaporated, because the cooling tower make-up water replaces evaporated water and blow down water, and blow down occurs as a result of high salinity concentrations due to evaporation. Thus, reducing evaporative losses would reduce the amount of water the cooling towers used. This model also depended on certain specifications from the cooling tower. The first specification was the temperature of the air being ejected, which was a result of heat exchange between the cycling water and the air. The second specification was the amount of water that circulated through the tower and the temperature of that water during intake and output. Finally, the last specification regarded the air flow, which was dependent on the strength of the fan on the top of the tower and its size. Several temperature measurements over the top of the tower were collected during the course of this study. The temperature of the air being ejected was determined by measuring the air temperature at the top of the cooling tower where the output air was ejected. The outlet air temperature was read at 82 degrees F, which was significantly cooler than the ambient air temperature at the time of 102 degrees. It was discovered that this output air temperature was likely a simple heat exchange between the water and air inside the cooling tower and could thus be calculated using the intake water temperature, intake air temperature, and the volumetric flows of each. The amount of water that circulates through the cooling tower was not available when this research was done, but the flow was estimated based on chilled water demand. This was because the cooling tower is mostly used by the water chillers. The required volumetric flow of water from the cooling towers for use by the chillers was recorded as 4000 gallons per minute per water chiller. The plant also supplied daily logs for the month of August, 2009 that reported that only two of the chillers were working full time. Thus, during the month of August, it could be assumed that an average of 8000 gallons per minute was circulating through the cooling towers due to the chillers demand. The air flow could be calculated based on the fan strength and speed. Each fan has a fan curve that determines the volumetric flow of air based on the pressure gradient through the fan. Unfortunately, this information could not be obtained and the air flow had to be determined using another method. When the temperature of the output air was taken, the tower fans were operating at full power. Using this information, the maximum volumetric flow could be estimated based on the known intake air and water temperatures, the water volumetric flow, and the output air temperature. As a result, it was estimated that the fans could move at most 500kg/s of air. This information was then used to create a function that estimated the evaporation based on ambient air temperature and humidity (fig. 10). As can be observed, the amount of

10 evaporation was mainly affected by the ambient air temperature and was significantly lower with lower air temperatures. This model was designed based on the specification outlined earlier, but the variables can be changed to give similar estimates for other cooling towers. Humidity (%) Evaporative Losses (gal/min) Temperature (F) Figure 10 depicts the relation theoretical relationship between the evaporative losses and the ambient humidity and temperature. This model assumed an air mass flow of 500 kg/s and a water volumetric flow of 8000 gal/min. The model also assumes the water is cooled by 10 degrees F. With this model, the next step in the investigation looked into the amount of water that could be saved by operating the cooling towers solely in the evenings. To perform this estimate, an accurate trend detailing all of the variables had to be kept. The central plant kept such trends for the tower fan speeds and the intake and output water temperature at one minute intervals from July 2008 to August The ambient temperature and humidity were taken from the records of a weather station within a mile of the central plant and was accepted as an accurate assessment of the ambient conditions around the plant. These temperature and humidity readings were taken at approximately five minute intervals from July 2008 to August Unfortunately, the water flow through the towers and the output air temperature were not trended. The water flow was estimated based on the water chillers. It was known that during the month of August, the chillers required approximately 8000 gallons per minute of water for operation. Because the month of August had one of the highest chilled water demands in 2008, it was assumed that 8000 gallons per minute of water represented the conditions during peak demand. Afterwards, it was assumed that for a cooler month such as February, the demand for chilled water would be significantly less, and thus would require at most one chiller to be operational at all times. Thus, it was estimated that 4000 gallons per minute were flowing through the towers from the chillers during February. The estimated water flow for the months in between was estimated assuming a sinusoidal pattern in the demand of chilled water. For example, for the month of November, the water flow was estimated to be 6000 gallons per minute. The output temperature of the air was estimated based on a simple heat exchange between the water and air in the tower and could be computed using the intake temperature of air and water and their respective mass flow rates. Using these estimates and the model, three cooling tower scenarios were tested. The first involved a cooling tower running all day at the specified conditions. The second scenario

11 involved a cooling tower running from 9:00am to 9:00pm (during the day) having twice as much water volumetric flow and twice as much mass air flow (but never more than 500kg/s, which was assumed to be the maximum). The final scenario involved a cooling tower running from 9:00pm to 9:00am (during the evening) with again, twice as much water volumetric flow and twice as much air mass flow never exceeding 500 kg/s. The data was analyzed monthly and summarized in figure 11. One can observe that the significant reductions in evaporation can be obtained by operating the cooling towers in the evening based on this analysis. It was assumed that currently, the amount of evaporation due to water required by the chillers fell between the first and second scenarios because chilled water demand rises and falls depending on the time of day. It was also assumed that running the cooling towers during the evening would not completely satisfy chilled water demands and the cooling towers would need to operate during the day at some capacity. Thus, the improved evaporation would fall somewhere between scenario one and scenario three. Regardless, based on this estimate, there would be approximately 10% reductions in cooling tower evaporation. Much of the data to perform this cooling tower analysis was missing, and as a result, these figures should be regarded more as a first estimate than serious figures. Despite this, the research suggests that the idea of operating the towers more during the evenings should be further investigated for its potential water savings. Specifically, a trend of the output air temperature and water flow into the towers should be recorded. The fan curves should also be consulted to confirm the mass air flow of the fans. With this data, a more detailed analysis can be performed to determine more accurate savings estimates.

12 Acknowledgements: This research would not have been possible were it not for several key persons from the California Institute of Technology staff and faculty. I would like to thank my co-mentors: Professor Melany Hunt for helping me with my some of my thermodynamic calculations and guiding me through my research experience; John Onderdonk for introducing me to this project and making sure I was on the right track; and Matthew Berbee for guiding me through the complexities of the central plant operations and campus utilities systems. I would also like to thank Jim Cowell for suggesting areas in which I could concentrate my research, and also the staff at the central plant for helping me obtain key data. References: 1. Sonntag, R. E., Borgnakke, C, and Van Wylen, G. J., 2003, Fundamentals of Thermodynamics, Hobokin, NJ, Swift, C. E. and Koski, A.J., 2009, Growing Turf on Salt-Affected Sites, Colorado State University Extension, (September 23, 2009) 3. Fipps, G., 2006, Irrigation Water Quality Standards, Texas Cooperative Extension, The Texas A&M University System, B1667.pdf (March 02, 2006) 4. Madison, Pasadena, California, Weather Underground, (September 25, 2009)

Increasing Cooling Tower Water Efficiency Chang Sub Kim Mentor: Melany Hunt Co-Mentors: Jim Cowell, John Onderdonk, Matthew Berbee
 Increasing Cooling Tower Water Efficiency Chang Sub Kim Mentor: Melany Hunt Co-Mentors: Jim Cowell, John Onderdonk, Matthew Berbee Abstract In 2008, California Institute of Technology used 764,064,005
Temperature and Humidity
 Temperature and Humidity Overview Water vapor is a very important gas in the atmosphere and can influence many things like condensation and the formation of clouds and rain, as well as how hot or cold
Wet Bulb Temperature and Its Impact on Building Performance
 Wet Bulb Temperature and Its Impact on Building Performance By: Kurmit Rockwell, PE, CEM, LEED AP and Justin Lee, PE, LEED, AP BD+C Energy Solution Services, AtSite, Inc. 1 What is Wet Bulb Temperature?
COOLING WATER MANAGEMENT
 COOLING WATER MANAGEMENT Intent To minimize the carbon-footprint, water usage and environmental impact of HVAC cooling systems and process cooling systems, generally by optimizing the control of water
International Telecommunication Union SERIES L: CONSTRUCTION, INSTALLATION AND PROTECTION OF TELECOMMUNICATION CABLES IN PUBLIC NETWORKS
 International Telecommunication Union ITU-T TELECOMMUNICATION STANDARDIZATION SECTOR OF ITU Technical Paper (13 December 2013) SERIES L: CONSTRUCTION, INSTALLATION AND PROTECTION OF TELECOMMUNICATION CABLES
Energy Action Plan 2015
 Energy Action Plan 2015 Purpose: In support of the Texas A&M University Vision 2020: Creating a Culture of Excellence and Action 2015: Education First Strategic Plan, the Energy Action Plan (EAP) 2015
Evaluation Of Hybrid Air- Cooled Flash/Binary Power Cycle
 INL/CON-05-00740 PREPRINT Evaluation Of Hybrid Air- Cooled Flash/Binary Power Cycle Geothermal Resources Council Annual Meeting Greg Mines October 2005 This is a preprint of a paper intended for publication
Yijun Gao, Wei Wu, Zongwei Han, Xianting Li *
 Study on the performance of air conditioning system combining heat pipe and vapor compression based on ground source energy-bus for commercial buildings in north China Yijun Gao, Wei Wu, Zongwei Han, Xianting
Some Criteria for Choosing a Steam Boiler for a Microbrewery
 Some Criteria for Choosing a Steam Boiler for a Microbrewery Jack Coe Rite Engineering and Manufacturing Corporation Breweries rely on steam heating for a number of functions, primarily to heat the brew
Water Coolers and Dispensing Machines:
 Water Coolers and Dispensing Machines: Please note this guidance has mainly been superseded by the introduction of the new Drinking Water policy by the Estates and Buildings Department in 2009 which only
Water Shortage Contingency Plan
 Section 10632 of the California Water Code states that the Urban Water Management Plan shall provide an urban water shortage contingency analysis that includes information on the estimated three-year minimum
Heat Recovery from Data Centres Conference Designing Energy Efficient Data Centres
 What factors determine the energy efficiency of a data centre? Where is the energy used? Local Climate Data Hall Temperatures Chiller / DX Energy Condenser / Dry Cooler / Cooling Tower Energy Pump Energy
DESIGN CHALLENGES AND OPERATIONAL EXPERIENCE OF A MEGA MED SEAWATER DESALINATION PLANT IN TIANJIN
 DESIGN CHALLENGES AND OPERATIONAL EXPERIENCE OF A MEGA MED SEAWATER DESALINATION PLANT IN TIANJIN Authors: Presenter: T. Efrat, Yu Haimiao Tomer Efrat Deputy Manager, Thermal Process Dept. IDE Technologies
Analysis of data centre cooling energy efficiency
 Analysis of data centre cooling energy efficiency An analysis of the distribution of energy overheads in the data centre and the relationship between economiser hours and chiller efficiency Liam Newcombe
Zhao et al. 2.2 Experimental Results in Winter Season The analysis given below was based on the data collected from Nov. 2003 to Mar. 15, 2004.
 Proceedings World Geothermal Congress 2005 Antalya, Turkey, 24-29 April 2005 A Case Study of Ground Source Heat Pump System in China Jun Zhao, Chuanshan Dai, Xinguo Li, Qiang Zhu and Lixin Li College of
Water Efficiency. Water Management Options. Boilers. for Commercial, Industrial and Institutional Facilities. Boiler Water Impurities
 Water Efficiency Water Management Options Boilers for Commercial, Industrial and Institutional Facilities Boiler Water Impurities All boiler make-up water contains impurities. As clean steam is released
AIR-CONDITIONERS CONDENSATE RECOVERY SYSTEM FOR BUILDINGS
 AIR-CONDITIONERS CONDENSATE RECOVERY SYSTEM FOR BUILDINGS Kelum Siriwardhena Mercury International Electro-Mechanical LLC - UAE Telephone: 00971507518423; Fax: 0097126270087 E-mail: Kelum.siriwardhena@mercury.ie;
Lesson 5: Water Conductivity and Total Dissolved Solids Water Quality Sampling
 Lesson 5: Water Conductivity and Total Dissolved Solids Water Quality Sampling Time Frame: Two 45-50 minute class periods Grade Level: 8 th 12 th Grade Overview: There are a wide variety of inorganic substances
Recommendations for Measuring and Reporting Overall Data Center Efficiency
 Recommendations for Measuring and Reporting Overall Data Center Efficiency Version 2 Measuring PUE for Data Centers 17 May 2011 Table of Contents 1 Introduction... 1 1.1 Purpose Recommendations for Measuring
Case Study: Innovative Energy Efficiency Approaches in NOAA s Environmental Security Computing Center in Fairmont, West Virginia
 Case Study: Innovative Energy Efficiency Approaches in NOAA s Environmental Security Computing Center in Fairmont, West Virginia Prepared for the U.S. Department of Energy s Federal Energy Management Program
Evaporative Cooling System for Aquacultural Production 1
 Fact Sheet EES-100 March 1993 Evaporative Cooling System for Aquacultural Production 1 C. D. Baird, R. A. Bucklin, C. A. Watson and F. A. Chapman 2 INTRODUCTION Florida aquaculture sales totaled $54 million
EXPLANATION OF WEATHER ELEMENTS AND VARIABLES FOR THE DAVIS VANTAGE PRO 2 MIDSTREAM WEATHER STATION
 EXPLANATION OF WEATHER ELEMENTS AND VARIABLES FOR THE DAVIS VANTAGE PRO 2 MIDSTREAM WEATHER STATION The Weather Envoy consists of two parts: the Davis Vantage Pro 2 Integrated Sensor Suite (ISS) and the
4 Stage Barracuda RO/DI Instruction & Owner s Manual
 4 Stage Barracuda RO/DI Instruction & Owner s Manual 7208 Aloma Ave Suite 600 Winter Park, FL 32792 Phone 407-599-2123 Fax 407-599-2124 www.aquariumwaterfilters.com www.aquafx.net 7208 Aloma Ave Suite
Solar One and Solar Two
 Solar One and Solar Two Solar One generated electricity between 1982 and 1988. (178-182) Solar One generated steam directly from water in its receiver, but its direct steam system had low efficiency in
Codes and High Performance Hot Water Systems. Gary Klein Affiliated International Management, LLC 916 549 7080 gary@aim4sustainability.
 Codes and High Performance Hot Water Systems Gary Klein Affiliated International Management, LLC 916 549 7080 gary@aim4sustainability.com Annual Energy Use for Heating Water Natural Gas Gallons Per Day
Increasing Natural Gas Boiler Efficiency by Capturing Waste Energy from Flue Gas
 Increasing Natural Gas Boiler Efficiency by Capturing Waste Energy from Flue Gas Mark Schiffhauer, ATSI Engineering Services Cameron Veitch, Combustion and Energy Systems Scott Larsen, New York State Energy
Data Center Industry Leaders Reach Agreement on Guiding Principles for Energy Efficiency Metrics
 On January 13, 2010, 7x24 Exchange Chairman Robert Cassiliano and Vice President David Schirmacher met in Washington, DC with representatives from the EPA, the DOE and 7 leading industry organizations
THE HUMIDITY/MOISTURE HANDBOOK
 THE HUMIDITY/MOISTURE HANDBOOK Table of Contents Introduction... 3 Relative Humidity... 3 Partial Pressure... 4 Saturation Pressure (Ps)... 5 Other Absolute Moisture Scales... 8 % Moisture by Volume (%M
Name: OBJECTIVES Correctly define: WEATHER BASICS: STATION MODELS: MOISTURE: PRESSURE AND WIND: Weather
 Name: OBJECTIVES Correctly define: air mass, air pressure, anemometer, barometer, cyclone, dew point, front, isobar, isotherm, meteorology, precipitation, psychrometer, relative humidity, saturated, transpiration
Chapter 3.4: HVAC & Refrigeration System
 Chapter 3.4: HVAC & Refrigeration System Part I: Objective type questions and answers 1. One ton of refrigeration (TR) is equal to. a) Kcal/h b) 3.51 kw c) 120oo BTU/h d) all 2. The driving force for refrigeration
The MIIAC IAC Industrial Assessment Program
 About Us: The University of Miami Industrial Assessment Center Introduction The work that is detailed in this report was developed under the direction of Dr. Shihab Asfour, Director of the University of
HEAT RECOVERY OPTIONS FOR DRYERS AND OXIDIZERS
 HEAT RECOVERY OPTIONS FOR DRYERS AND OXIDIZERS William K. Scullion, Application Engineering Leader, MEGTEC Systems, De Pere, WI Introduction Competitive pressures continuously motivate us to examine our
A Guide to Trouble-Free Cooling Towers
 A Guide to Trouble-Free Cooling Towers A basic understanding of cooling tower operation and maintenance will help keep a cooling water system running in top condition, year after year By David M. Suptic
Recover Heat from Boiler Blowdown Water
 Prepared for California Energy Commission (CEC) Prepared By: Southern California Gas Company (A Sempra Energy Utility) E3M Inc. May 2012 i Disclaimer The CEC and its contractor, Southern California Gas
AIR CONDITIONING TECHNOLOGY
 AIR CONDITIONING TECHNOLOGY PART 9 Water Cooled Condensers & Cooling Towers IN LAST month s article we looked at how Air Cooled Condensers are used to transfer the total heat of rejection from the air
Utilities Privatization Success Story. Mid-west drought management Enhance water conservation Enhance environmental sustainability
 Utilities Privatization Success Story Reclaimed Water Reuse Fort Sill, OK Objective Mid-west drought management Enhance water conservation Enhance environmental sustainability December 2015 Background
How do I measure the amount of water vapor in the air?
 How do I measure the amount of water vapor in the air? Materials 2 Centigrade Thermometers Gauze Fan Rubber Band Tape Overview Water vapor is a very important gas in the atmosphere and can influence many
Rainwater Harvesting
 Rainwater Harvesting With climate change now a reality rather than a speculated possibility, the demand on water resources has gone up, whilst the amount of water available for supply has gone down. Forth
Conductivity and TDS Meters
 Table of Contents Comparison Charts Introduction Portable Meters Waterproof Meters Printing & Logging Portable Meters Bench Meters Combination EC/TDS/pH Meter Page G2 G3 G6 G11 G14 G15 G16 G1 Comparison
ES 106 Laboratory # 3 INTRODUCTION TO OCEANOGRAPHY. Introduction The global ocean covers nearly 75% of Earth s surface and plays a vital role in
 ES 106 Laboratory # 3 INTRODUCTION TO OCEANOGRAPHY 3-1 Introduction The global ocean covers nearly 75% of Earth s surface and plays a vital role in the physical environment of Earth. For these reasons,
2. The map below shows high-pressure and low-pressure weather systems in the United States.
 1. Which weather instrument has most improved the accuracy of weather forecasts over the past 40 years? 1) thermometer 3) weather satellite 2) sling psychrometer 4) weather balloon 6. Wind velocity is
Q. Why have we set up an energy centre and heat network in Bunhill?
 FAQs: Bunhill energy centre and heat network Q. Why have we set up an energy centre and heat network in Bunhill? A. We set up a heat network in the Bunhill ward to provide cheaper, greener, locallyproduced
HEAT RECOVERY FROM CHILLED WATER SYSTEMS. Applications for Heat Reclaim Chillers
 HEAT RECOVERY FROM CHILLED WATER SYSTEMS Applications for Heat Reclaim Chillers April 2008 TABLE OF CONTENTS INTRODUCTION... 3 WASTE HEAT SOURCES... 3,4 Capturing Sufficient Heat for Useful Purposes...
imagine SOLAR AIR CONDITIONING MADE EASY
 imagine SOLAR AIR CONDITIONING MADE EASY WHY SOLAR COOLING? Imagine...being able to fit a solar air conditioning system to your building that would result in dramatic reductions in electricity consumption
Verizon SMARTS Data Center Design Phase 1 Conceptual Study Report Ms. Leah Zabarenko Verizon Business 2606A Carsins Run Road Aberdeen, MD 21001
 Verizon SMARTS Data Center Design Phase 1 Conceptual Study Report Ms. Leah Zabarenko Verizon Business 2606A Carsins Run Road Aberdeen, MD 21001 Presented by: Liberty Engineering, LLP 1609 Connecticut Avenue
(Walter Glogowski, Chaz Shapiro & Reid Sherman) INTRODUCTION
 INTRODUCTION") Convection (Walter Glogowski, Chaz Shapiro & Reid Sherman) INTRODUCTION You know from common experience that when there's a difference in temperature between two places close to each other, the temperatures
Convection (Walter Glogowski, Chaz Shapiro & Reid Sherman) INTRODUCTION You know from common experience that when there's a difference in temperature between two places close to each other, the temperatures
UNIT 2 REFRIGERATION CYCLE
 UNIT 2 REFRIGERATION CYCLE Refrigeration Cycle Structure 2. Introduction Objectives 2.2 Vapour Compression Cycle 2.2. Simple Vapour Compression Refrigeration Cycle 2.2.2 Theoretical Vapour Compression
Centrifugal Fans and Pumps are sized to meet the maximum
 Fans and Pumps are sized to meet the maximum flow rate required by the system. System conditions frequently require reducing the flow rate. Throttling and bypass devices dampers and valves are installed
A heat pump system with a latent heat storage utilizing seawater installed in an aquarium
 Energy and Buildings xxx (2005) xxx xxx www.elsevier.com/locate/enbuild A heat pump system with a latent heat storage utilizing seawater installed in an aquarium Satoru Okamoto * Department of Mathematics
Lesson 36 Selection Of Air Conditioning Systems
 Lesson 36 Selection Of Air Conditioning Systems Version 1 ME, IIT Kharagpur 1 The specific objectives of this chapter are to: 1. Introduction to thermal distribution systems and their functions (Section
State of the Art Energy Efficient Data Centre Air Conditioning
 - White Paper - State of the Art Energy Efficient Data Centre Air Conditioning - Dynamic Free Cooling - Release 2, April 2008 Contents ABSTRACT... 3 1. WHY DO I NEED AN ENERGY EFFICIENT COOLING SYSTEM...
Facility Operations Physical Safety Guidance Document
 Facility Operations Physical Safety Guidance Document Title: Guide on Pipe Identification Standards (ASME A13.1-1996) Original Date: December 18, 2000 Section: 4.0 Facility Operations Revised Date: Number:
Laundry Hot Water Systems
 TECHNICAL BULLETIN HE-2020 Laundry Hot Water Systems Commercial/Institutional Applications using Helitherm Heat Exchangers AERCO INTERNATIONAL, INC. 159 PARIS AVE., NORTHVALE, NJ 07647 (201) 768-2400 FAX
1932 Lexington Houston, Texas 77098-4220 (713) 524-4877. Recommendations for installation of cooling systems
 524-4877. Recommendations for installation of cooling systems") 1932 Lexington Houston, Texas 77098-4220 (713) 524-4877 The purpose for this information is to provide a better understanding of the HVAC equipment, components, designs, and installations, of HVAC system
1932 Lexington Houston, Texas 77098-4220 (713) 524-4877 The purpose for this information is to provide a better understanding of the HVAC equipment, components, designs, and installations, of HVAC system
Heat Recovery Dehumidification (HRD) system. Designed for municipal swimming pools
 system. Designed for municipal swimming pools") Heat Recovery Dehumidification (HRD) system Designed for municipal swimming pools A dehumidification and ventilation system with dynamic heat pump heat recovery to swimming pool water and air ENVIRONMENTAL
Heat Recovery Dehumidification (HRD) system Designed for municipal swimming pools A dehumidification and ventilation system with dynamic heat pump heat recovery to swimming pool water and air ENVIRONMENTAL
CONTENTS. ZVU Engineering a.s., Member of ZVU Group, WASTE HEAT BOILERS Page 2
 WASTE HEAT BOILERS CONTENTS 1 INTRODUCTION... 3 2 CONCEPTION OF WASTE HEAT BOILERS... 4 2.1 Complex Solution...4 2.2 Kind of Heat Exchange...5 2.3 Heat Recovery Units and Their Usage...5 2.4 Materials
With the background of fulfilling public commitments for ECONO-PILOT ENERGY-SAVING SYSTEM FOR WATER PUMPS
 ECONO-PILOT ENERGY-SAVING SYSTEM FOR WATER PUMPS SAWAI Tsuneji *1 TAKAHASHI Hiroshi *1 INOUE Ken-ichi *2 We have developed the Econo-Pilot energy-saving system for water pumps, which reduces the power
KU DESIGN GUIDELINES APPENDIX XVI RECOMMENDED BAS I/O CONTROL POINTS BY EQUIPMENT / SYSTEM
 KU DESIGN GUIDELINES APPENDIX XVI RECOMMENDED BAS I/O CONTROL POINTS BY EQUIPMENT / SYSTEM AIR HANDLING UNITS... 1 CHILLERS... 2 COOLING TOWERS... 2 CLOSED LOOP COOLERS... 2 MISCELLANEOUS SUPPLY FANS...
Research on the Air Conditioning Water Heater System
 Purdue University Purdue e-pubs International Refrigeration and Air Conditioning Conference School of Mechanical Engineering 28 Research on the Air Conditioning Water Heater System Fei Liu Gree Electric
Determination of Thermal Conductivity of Coarse and Fine Sand Soils
 Proceedings World Geothermal Congress Bali, Indonesia, - April Determination of Thermal Conductivity of Coarse and Fine Sand Soils Indra Noer Hamdhan 1 and Barry G. Clarke 2 1 Bandung National of Institute
HAY MOISTURE & WEATHER:
 HAY MOISTURE & WEATHER: IMPLICATIONS FOR HAY HARVEST Paul Brown Extension Specialist, Biometeorlogy University of Arizona Harvest Losses vs. Moisture From Collins & Owens, 1995 Losses During Haymaking
understanding medium frequency induction melting furnace and its components
 understanding medium frequency induction melting furnace and its components 9 Spruce Street, Jersey City, NJ 07306 USA sales@electroheatinduction.com INDUCTION MELTING FURNACE AND ITS COMPONENTS The purpose
Thermodynamics - Example Problems Problems and Solutions
 Thermodynamics - Example Problems Problems and Solutions 1 Examining a Power Plant Consider a power plant. At point 1 the working gas has a temperature of T = 25 C. The pressure is 1bar and the mass flow
Measuring The Right Thing For Humidity Control It s the Dew Point Stupid!
 Page 1 of 6 Measuring The Right Thing For Humidity Control It s the Dew Point Stupid! By Mike Schell, AirTest Technologies Corp. A version of this article appeared in the June 2004 edition of Indoor Air
It will be available soon as an 8.5 X 11 paperback. For easier navigation through the e book, use the table of contents.
 The System Evaluation Manual and Chiller Evaluation Manual have been revised and combined into this new book; the Air Conditioning and Refrigeration System Evaluation Guide. It will be available soon as
Reuse of Alternative Water Sources for Cooling Tower Systems Two Case Studies Using Non-Traditional Water Sources
 Reuse of Alternative Water Sources for Cooling Tower Systems Two Case Studies Using Non-Traditional Water Sources Matthew L. Haikalis Veolia Water Solutions & Technologies April 24, 2013 Operational Priorities
Catalyst RTU Controller Study Report
 Catalyst RTU Controller Study Report Sacramento Municipal Utility District December 15, 2014 Prepared by: Daniel J. Chapmand, ADM and Bruce Baccei, SMUD Project # ET13SMUD1037 The information in this report
EVALUATION OF GEOTHERMAL ENERGY AS HEAT SOURCE OF DISTRICT HEATING SYSTEMS IN TIANJIN, CHINA
 EVALUATION OF GEOTHERMAL ENERGY AS HEAT SOURCE OF DISTRICT HEATING SYSTEMS IN TIANJIN, CHINA Jingyu Zhang, Xiaoti Jiang, Jun Zhou, and Jiangxiong Song Tianjin University, North China Municipal Engineering
INVESTIGATION ON AIR-CONDITIONING ENERGY CONSUMPTION OF A TYPICAL COMMERCIAL BUILDING COMPLEX
 , Volume 6, Number 4, p.178-183, 2005 INVESTIGATION ON AIR-CONDITIONING ENERGY CONSUMPTION OF A TYPICAL COMMERCIAL BUILDING COMPLEX Qinghai Luo College of Architecture and Resource, Nanhua University,
An Approach for Water Cost of Cooling Water System in Oil Refinery
 CHEMICAL ENGINEERING TRANSACTIONS Volume 21, 2010 Editor J. J. Klemeš, H. L. Lam, P. S. Varbanov Copyright 2010, AIDIC Servizi S.r.l., ISBN 978-88-95608-05-1 ISSN 1974-9791 DOI: 10.3303/CET1021018 103
INVESTMENT GRADE ENERGY AUDIT. Ahmad R. Ganji, Ph.D., P.E. BASE Energy, Inc. San Francisco, CA 94103
 INVESTMENT GRADE ENERGY AUDIT Ahmad R. Ganji, Ph.D., P.E. BASE Energy, Inc. San Francisco, CA 94103 Bruce Gilleland Energy Management Division California Department of General Services Sacramento, CA 95814
Office of the Government Chief Information Officer. Green Data Centre Practices
 Office of the Government Chief Information Officer Green Data Centre Practices Version : 2.0 April 2013 The Government of the Hong Kong Special Administrative Region The contents of this document remain
SPECIAL ISSUE: NATIONAL SCIENCE FOUNDATION WORKSHOP
 research journal 2013 / VOL 05.01 www.perkinswill.com SPECIAL ISSUE: NATIONAL SCIENCE FOUNDATION WORKSHOP ARCHITECTURE AND ENGINEERING OF SUSTAINABLE BUILDINGS Current Trends in Low-Energy HVAC Design
Benefits of Cold Aisle Containment During Cooling Failure
 Benefits of Cold Aisle Containment During Cooling Failure Introduction Data centers are mission-critical facilities that require constant operation because they are at the core of the customer-business
VACUUM REFRIGERATION SYSTEMS
 VACUUM REFRIGERATION SYSTEMS CHILL VACTOR The Croll-Reynolds CHILL-VACTOR is a chiller that uses a vapor flashing process. Water has a pressure-temperature relationship which is its boiling point. If its
Cool Spaces. earth-wise guide to. green strategies: light strategies: Keep Austin Cool
 earth-wise guide to Cool Spaces green strategies: 1. Trees and leafy plants 2. Green roofs 3. Green walls light strategies: 4. Reflective roofs 5. Permeable pavement 6. Shade structures Keep Austin Cool
Recommendations for Measuring and Reporting Overall Data Center Efficiency
 Recommendations for Measuring and Reporting Overall Data Center Efficiency Version 1 Measuring PUE at Dedicated Data Centers 15 July 2010 Table of Contents 1 Introduction... 1 1.1 Purpose Recommendations
GREEN FACTS. Marina Bay Sands
 Marina Bay Sands GREEN FACTS Marina Bay Sands is committed to integrating sustainability into the core business strategy. We drive sustainability through our Sands ECO360 Sustainability programme, a global
Indiana University Office of Sustainability
 Indiana University Office of Sustainability Qualified Energy Savings Project Final Report Summer 2012 Andrew Bushnell Mentor: Charlie Matson Introduction As the Energy and Built Environment intern, I worked
How To Use A Water Source Heat Pump
 Geothermal Energy Using Water-Source Heat Pumps By VIRSTAR Corporation Geothermal Expertise Since 1978 All information contained herein is the exclusive property of VIRSTAR Corporation, all rights reserved.
Evaporative Cooling for Residential and Light-Commercial
 EMERGING TECHNOLOGIES This article was published in ASHRAE Journal, October 2011. Copyright 2011 American Society of Heating, Refrigerating and Air-Conditioning Engineers, Inc. Posted at www.ashrae.org.
Thermal Coupling Of Cooling and Heating Systems
 This article was published in ASHRAE Journal, February 2011. Copyright 2011 American Society of Heating, Refrigerating and Air-Conditioning Engineers, Inc. Posted at www.ashrae.org. This article may not
The function of a power station is to deliver
 CHAPTER CHAPTER 3 Variable Load on Power Stations 3.1 Structure of Electric Power System 3.2 Variable Load on Power Station 3.3 Load Curves 3.4 Important Terms and Factors 3.5 Units Generated per Annum
ICE THERMAL STORAGE IN AIR CONDITIONING APPLICATION FUNDAMENTALS
 ICE THERMAL STORAGE IN AIR CONDITIONING APPLICATION FUNDAMENTALS By: T. S. Wan Date: April 19, 1994 (1st draft 3/7/86) Copyright 1994 by T. S. Wan (All rights reserved) ABSTRACT: The technology of energy
ALONE. small scale solar cooling device Project No TREN FP7EN 218952. Project No TREN/FP7EN/218952 ALONE. small scale solar cooling device
 Project No TREN/FP7EN/218952 ALONE small scale solar cooling device Collaborative Project Small or Medium-scale Focused Research Project DELIVERABLE D5.2 Start date of the project: October 2008, Duration:
Adam Bayer, San Jose State University
 Bringing i Recycled Water to San Jose State University The 10th Annual CA Higher Education Sustainability Conference Long Beach, California July 11, 2011 Adam Bayer San Jose State University Adam Bayer,
1. Which list contains only nonliving things in an environment?
 Grade 3 Standard 2 Unit Test Environment Multiple Choice 1. Which list contains only nonliving things in an environment? A. snails, water, mushrooms B. soil, trees, worms C. sunlight, water, soil D. rocks,
Boiler Preparation, Start-Up and Shutdown
 Boiler Preparation, Start-Up and Shutdown Learning Outcome When you complete this module you will be able to: Describe the basic preparation of a boiler for start-up, and the start-up and shutdown procedures.
This presentation premiered at WaterSmart Innovations. watersmartinnovations.com
 This presentation premiered at WaterSmart Innovations watersmartinnovations.com Green Plumbing and Mechanical Code Supplement David Viola IAPMO Director of Special Services 1 IAPMO Group Association of
Energy Saving Tips. Adjust set point temperature up a few degrees... Window contact. Occupancy sensor. A Programmable Thermostat
 Energy Saving Tips Nowadays when Energy costs are skyrocketing and the awareness to environmental issues is increasing, we all want to reduce energy consumption and have a greener lifestyle. Heating &
WHITE PAPERS. Food Processing Plant Design
 WHITE PAPERS Food Processing Plant Design Preface The design of your food processing plant can be a lengthy and tedious process, but is where the most critical decisions will be made. Your architects and
Seeing by Degrees: Programming Visualization From Sensor Networks
 Seeing by Degrees: Programming Visualization From Sensor Networks Da-Wei Huang Michael Bobker Daniel Harris Engineer, Building Manager, Building Director of Control Control Technology Strategy Development
Climate and Weather. This document explains where we obtain weather and climate data and how we incorporate it into metrics:
 OVERVIEW Climate and Weather The climate of the area where your property is located and the annual fluctuations you experience in weather conditions can affect how much energy you need to operate your
8 plumbing. plumbing. 2010 PulteGroup, Inc. All Rights Reserved.
 8 90 2010 PulteGroup, Inc. All Rights Reserved. drains All the water you use leaves the home through a drain. Maintaining drains prevents clogging, overflows, water damage, and other problems. care and
Analyzing Weather Data
 Analyzing Weather Data Lesson Concept Link Scientists analyze data gathered from weather tools to predict weather. At the beginning of this unit, each measuring tools was introduced, and over time students
Managing Heat Stress in Poultry
 Managing Heat Stress in Poultry Amy E. Halls, Monogastric Nutritionist Shur-Gain, Nutreco Canada Inc. Heat stress has several serious and economical effects on poultry. In broilers and turkeys, it can
Solar air collectors for industry and larger halls S Ø. Efficient dehumidification and air heating for free...
 Solar air collectors for industry and larger halls N S Ø Efficient dehumidification and air heating for free... This booklet contains information about SolarVenti Industrial air solar system. The system
Federal Wage System Job Grading Standards for Air Conditioning Equipment Operating, 5415. Table of Contents
 Federal Wage System Job Grading Standards for Air Conditioning Equipment Operating, 5415 Table of Contents WORK COVERED... 2 WORK NOT COVERED...2 TITLES... 2 GRADE LEVELS... 2 HELPER AND INTERMEDIATE JOBS...
Energy Saving Tips. They can have a dramatic impact on your bill. The cheapest energy is the energy you don t use.
 Energy Saving Tips They can have a dramatic impact on your bill. The cheapest energy is the energy you don t use. Drive by your building at night. Driving by your building at night makes it easy to check
Absolute and relative humidity Precise and comfort air-conditioning
 Absolute and relative humidity Precise and comfort air-conditioning Trends and best practices in data centers Compiled by: CONTEG Date: 30. 3. 2010 Version: 1.11 EN 2013 CONTEG. All rights reserved. No