SPSS Instruction Manual. University of Waterloo Department of Statistics and Actuarial Science September 1, 1998
|
|
|
- Marcus Shaw
- 7 years ago
- Views:
Transcription
1 SPSS Instruction Manual University of Waterloo Department of Statistics and Actuarial Science September 1, 1998

2 Table Of Contents Before Using This Manual.3 Introduction to SPSS..4 SPSS Basics...5 Tutorial 1: SPSS Windows. 5 Tutorial 2: Starting A SPSS Session....6 Tutorial 3: Getting Help on SPSS. 6 Tutorial 4: Ending A SPSS Session. 6 Creating and Manipulating Data in SPSS.. 7 Tutorial 1: Creating a New Data Set Tutorial 2: Creating a New Data Set From Other File Formats..10 Tutorial 3: Opening an Existing SPSS Data Set.. 16 Tutorial 4: Printing a Data Set. 16 Generating Descriptive Statistics in SPSS...17 Tutorial 1: Mean, Sum, Standard Deviation, Variance, Minimum Value, Maximum Value, and Range Tutorial 2: Correlation Generating Graphical Statistics in SPSS..20 Tutorial 1: How to Generate Scatter Plots. 20 Tutorial 2: How to Generate A Histogram Tutorial 3: How to Generate A Stem and Leaf Plot..23 Tutorial 4: How to Generate A Box Plot.26 Statistical Models in SPSS..28 Tutorial 1: Linear Regression.. 28 Tutorial 2: Analysis of Variance.. 31 Appendix A: Data Files 34 Page 2

3 Before Using This Manual The following manual explains various statistical methods using tutorials. Each tutorial begins with a problem that is based on a set of data. A solution is then presented as an example of the steps that need to be taken to perform that particular statistical method. In using these tutorials, you need to be able to access the various data sets that are used. To access these files, it is easier to copy the files to your home directory. 1. Logon to an x server from your Polaris account. 2. In your home directory, make a directory called SPSS. > mkdir SPSS 3. Open up a Netscape browser. 4. Change the location in the browser to where the files are located. The address is: 5. Position the cursor so that it is located on top of one of the data files in this directory. Hold down the Shift button and left click. The Save As window will appear. 6. Choose the directory, ~/SPSS. 7. If you are using a browser from UNIX, ensure that the Format For Saved Document: box indicates Source. DO NOT save as Text or Postscript. However, if you are using Netscape in Polaris, ensure that the type of file to save as is HTML Files and change the ending of the file to.htm. This will ensure that the file is saved in the correct format. 8. Click OK. This will download the selected file into ~/SPSS. 9. For all other files shown, repeat steps 5-8 until all files have been saved to ~/SPSS. At this point, all data files to be used in this manual should be in the directory ~/SPSS. If you are accessing SPSS from your Polaris account, you would look under the P: drive to find this directory. A description and partial listing of the data sets are located in Appendix A. 3

4 Introduction to SPSS SPSS (Statistical Package for the Social Sciences) is a statistical analysis and data management software package. SPSS can take data from almost any type of file and use them to generate tabulated reports, charts, and plots of distributions and trends, descriptive statistics, and conduct complex statistical analyses. The following manual will give an introductory description of how to use SPSS. However, due to the complex nature of SPSS, many details have been omitted. To find a more complete description, consult the following manuals: SPSS Guide by Kilman Shin Some helpful websites concerning SPSS are:

5 SPSS Basics Tutorial 1: SPSS Windows There are six different windows that can be opened when using SPSS. The following will give a description of each of them. The Data Editor The Data Editor is a spreadsheet in which you define your variables and enter data. Each row corresponds to a case while each column represents a variable. The title bar displays the name of the open data file or "Untitled" if the file has not yet been saved. This window opens automatically when SPSS is started. The Output Navigator The Output Navigator window displays the statistical results, tables, and charts from the analysis you performed. An Output Navigator window opens automatically when you run a procedure that generates output. In the Output Navigator windows, you can edit, move, delete and copy your results in a Microsoft Explorer-like environment. 5

6 The Pivot Table Editor Output displayed in pivot tables can be modified in many ways with the Pivot Table Editor. You can edit text, swap data in rows and columns, add color, create multidimensional tables, and selectively hide and show results. The Chart Editor You can modify and save high-resolution charts and plots by invoking the Chart Editor for a certain chart (by double-clicking the chart) in an Output Navigator window. You can change the colors, select different type fonts or sizes, switch the horizontal and vertical axes, rotate 3-D scatterplots, and change the chart type. The Text Output Editor Text output not displayed in pivot tables can be modified with the Text Output Editor. You can edit the output and change font characteristics (type, style, color, size). The Syntax Editor You can paste your dialog box selections into a Syntax Editor window, where your selections appear in the form of command syntax. Tutorial 2: Starting A SPSS Session 1. Logon to your Polaris account. 2. Select Programs from the Start menu. 3. Select Scientific from the Programs drop down menu. 4. Select SPSS 7.5 from the Scientific drop down menu. Tutorial 3: Getting Help on SPSS Locating Topics in the Help Menu 1. Select Topics from the Help Menu on the Data Editor. 2. Select the Contents tab. This will give a set of books to look under for the required information. Searching for Information in the Help Menu 1. Select Topics from the Help menu. 2. Select the Index tab. 3. Type a word in the text box describing the information to search for. This will give a list of headings on the desired information. Tutorial 4: Ending A SPSS Session 1. Select Exit SPSS from the File menu on the Data Editor. 6

7 Creating and Manipulating Data in SPSS When creating or accessing data in SPSS, the Data Editor window is used. Tutorial 1: Creating a New Data Set There are three steps that must be followed to create a new data set in SPSS. The following tutorial will list the steps needed and will give an example of creating a new data set. STEP 1: Defining Variables in a New Data Set Variables are defined one at a time using the Define Variable dialog box. This box assigns data definition information to variables. To access the Define Variable dialog box, doubleclick on the top of a column where the word var appears or select Define Variable from the Data menu. Variable Name: This field describes the name of the variable being defined. To change the name, place the cursor in this field and type the name. The variable name must begin with a letter of the alphabet and cannot exceed 8 characters. Spaces are not allowed within the variable name. Each variable name must be unique. Type: This field describes the type of variable that is being defined. To change this field, click on the Type button. This will open the Define Variable Type: dialog box. Select the appropriate type of data. When done, click on the Continue button. Variable Label: There are two types of variable labels: 1. Variable Label: A name for the variable that can be up to 120 characters long and can include spaces (which variable names cannot). If a variable label is entered, the label will be printed on charts and reports instead of the name, making them easier to understand. 7

8 2. Value Label: Provides a key for translating numeric data. To change the variable label, click on the Labels button. This will open the Define Labels: dialog box. Enter the appropriate information into the fields. When done, click on the Continue button. Missing Values: This field indicates which subset of the data will not be included in the data set. To change this field, click on the Missing Values button. This will open the Define Missing Values: dialog box. Enter the appropriate information into the fields. When done, click on the Continue button. Alignment: This field indicates column alignment and width. To change this field, click on the Column Format button. This will open the Define Column Format: dialog box. Enter the appropriate information into the fields. When done, click on the Continue button. STEP 2: Entering Data in a New Data Set Once all of the variables are defined, enter the data manually (assuming that the data is not already in an external file). The data is typed into the spreadsheet one cell at a time. Each cell represents an observation. When information is typed into a cell, it appears in the edit area at the top of the window. The information is entered into the cell when the active cell is changed. The mouse and the tab, enter, and cursor keys can be used to enter data. To indicate a cell that does not have a data value, a period is entered. A period represents the system-missing value. 8

9 STEP 3: Saving a New Data Set Work performed on a data set only lasts during the current session. To retain the current data set, it must be saved to a file. 1. Select Save from the File menu. The Save Data As dialog box opens. 2. From the Save as Type drop-down list, select SPSS (*.sav). 3. From the Save in drop-down list, select the path where the file will be saved. 4. In the File name box, enter a name for the file. SPSS automatically adds the extension.sav. 5. Click Save. Problem The following data regarding a person s name, age and weight must be entered into a data set using SPSS. Solution Name Age Weight Mark Allison Tom Cindy Double click on the top of the first column in the Data Editor window. This will open the Define Variable dialog box. Type Name in the Variable Name box. 2. Select Type in the Change Settings area. This will open the Define Variable Type dialog box. Left click on String. 3. Select Continue. This will close the Define Variable Type dialog box and will re-open the Define Variable dialog box. 4. Click OK. This will define the first column as a string variable called Name. 5. Double click on the top of the second column. This will open the Define Variable dialog box. Type Age in the Variable Name box. 6. Select Type in the Change Settings area. This will open the Define Variable Type dialog box. Left click on Numeric. In the Width box, set it to 3. In the Decimal Places box, set it to Select Continue. This will close the Define Variable Type dialog box and will re-open the Define Variable dialog box. 8. Click OK. This will define the second column as a numeric variable called Age. 9. Double click on the top of the third column. This will open the Define Variable dialog box. Type Weight in the Variable Name box. 9

10 10. Select Type in the Change Settings area. This will open the Define Variable Type dialog box. Left click on Numeric. In the Width box, set it to 3. In the Decimal Places box, set it to Select Continue. This will close the Define Variable Type dialog box and will re-open the Define Variable dialog box. 12. Click OK. This will define the third column as a numeric variable called Weight. 13. Enter the above information into the cells of the spreadsheet. The Data Editor should look like the following. 14. Select Save from the File menu. 15. Choose the path where the file will be saved. 16. Type temp in the File name box and click Save. SPSS will save this file as temp.sav in the specified directory. Tutorial 2: Creating a New Data Set From Other File Formats SPSS is designed to handle a wide variety of formats including: Spreadsheet files created with Lotus and Excel Database files created with dbase Tab-deliminated and other types of ASCII text files SPSS data files create on other operating systems SYSTAT data files The following tutorial will indicate how to read in a spreadsheet or text file into a data set in SPSS. Examples will be given of each method. 10

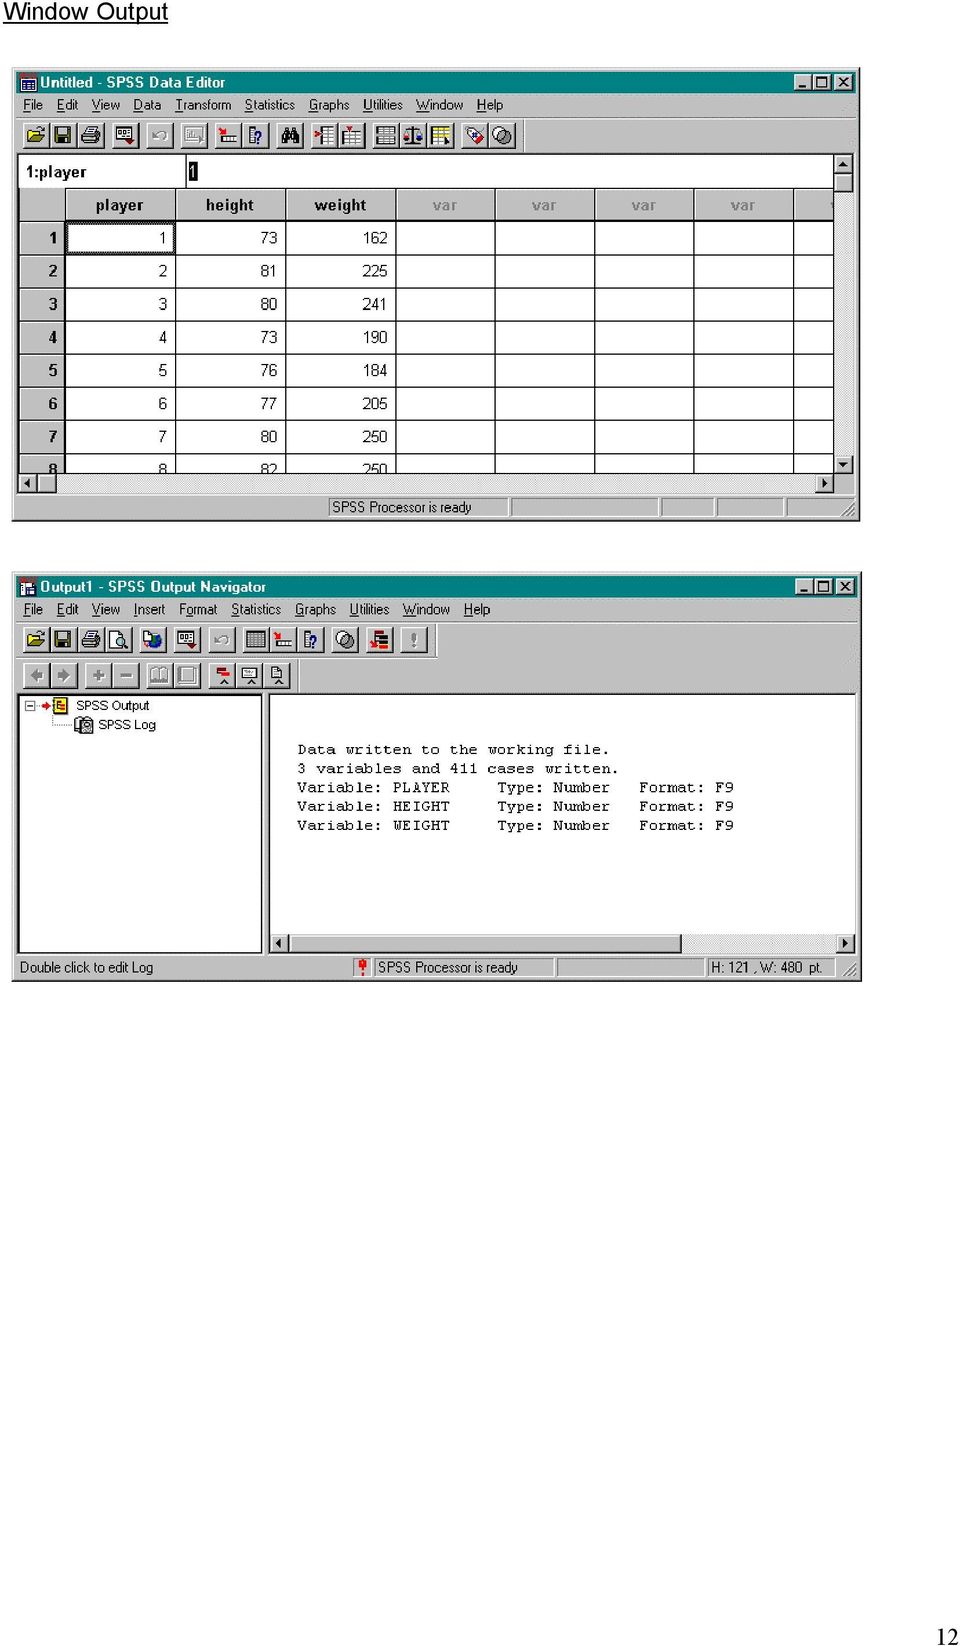
11 Reading Spreadsheet Files (Lotus and Excel) Problem Read the following file, ~/SPSS/nba.xls, into a SPSS data set. Solution 1. From the File menu, select Open. This will open the Open File dialog box. 2. Change the path name to your home directory and open the SPSS folder. This is where the file to be opened should be. 3. Select Excel(*.xls) (or Lotus(*.w*) for Lotus files) from the Files of type box. 4. Select nba.xls. 5. Click Open. This will open the Opening File Options dialog box. Click on the Read variable names dialog box. Click OK. This will close the Opening File Options dialog box and will open nba.xls in the Data Editor. The Output Navigator will also be opened. NOTE: If only a partial file is to be read into SPSS, the following steps are taken. For Lotus files, in the Range box, specify the beginning column letter and row number followed by two periods followed by the ending column letter and row number. Ie. A1..C12 For Excel files, in the Range box, specify the beginning column letter and row number followed by a colon followed by the ending column letter and row number. Ie. A1:C12 11

12 Window Output 12
13 Reading Text Files Two ways to read a text file are by using freefield or fixed columns. Freefield This method is used if the variables are recorded in the same order for each case but not necessarily in the same column locations. Problem Read the following file, ~/SPSS/citydata.txt, into an SPSS data set. Solution 1. Select Read ASCII Data from the File Menu. From the Read ASCII Data drop down menu, choose Freefield. This will open the Define Freefield Variables dialog box. 2. Specify the variable name and data type. The following gives a description of each of these fields. Name: Variable names must begin with a letter and cannot exceed eight characters. Each variable name must be unique. Data Type: Select a data type. 3. Click Add for each separate variable. This will enter the variable name and data type onto the Defined Variables list. 4. Once all variables are defined, click Browse to specify the name of the file to be read. This will open the Define Freefield Variables: Browse dialog box. Change the path name to your home directory and open the SPSS folder. This is where the file to be opened should be. 5. Select citydata.txt and click Open. The Define Freefield Variables dialog box will be returned. 6. Click OK. This will close the Define Freefield Variables dialog box and will open citydata.txt in the Data Editor. 13

14 Window Output Fixed Columns This method is used if each variable is recorded in the same column location for each case in the data file. Problem Read the following file, ~/SPSS/nba.txt, into an SPSS data set. Solution 1. Select Read ASCII Data from the File Menu. From the Read ASCII Data drop down menu, choose Fixed Columns. This will open the Define Fixed Variables dialog box which will be used to define each variable. 2. Specify the variable name, record, column locations, and data type. The following gives a description of each of these fields. Name: Variable names must begin with a letter and cannot exceed eight characters. Each variable name must be unique. 14

15 Record: A case can have data on more than one line. The record number indicates the line within the case where the variable is located. Start Column/End Column: These specifications indicate the location of the variable within the record. The value for the variable can appear anywhere within the range of columns. Data Type: Select a data type. For this problem, the following is a list of the required information. Name Record Column Locations Data Type Player Numeric as is Height Numeric as is Weight Numeric as is 3. When all information is added for a variable, click Add. This will enter the record number, start and end columns, variable name, and data type onto the Defined Variables list. 4. Once all variables are defined, click Browse to specify the name of the file to be read. This will open the Define Fixed Variables: Browse dialog box. Change the path name to your home directory and open the SPSS folder. This is where the file to be opened should be. 5. Select nba.txt and click Open. The Define Fixed Variables dialog box will be returned. 6. Click OK. This will close the Define Fixed Variables dialog box and will open nba.txt in the Data Editor. Window Output 15

16 Tutorial 3: Opening an Existing SPSS Data Set 1. Select Open from the File menu. This will open the Open File dialog box. 2. From the Files of type drop-down list, select.sav. 3. From the Look in drop-down list, select the appropriate drive where the file is located. 4. In the File name box, type in the name of the file to be opened. 5. Click Open. Tutorial 4: Printing a Data Set 1. Highlight the data that will be printed. To print all of the data, ignore this step and continue to step Select Print from the File menu. The Print dialog box opens. Change the options where appropriate. 3. Click OK. 16

17 Generating Descriptive Statistics in SPSS The following tutorials will demonstrate how to generate descriptive statistics in SPSS. Tutorial 1: Mean, Sum, Standard Deviation, Variance, Minimum Value, Maximum Value, and Range When generating these statistics, the Data Editor must be open with the appropriate data set before continuing. Problem Using the data in the file nba.txt that is located in ~/SPSS/, determine the mean, sum, standard deviation, variance, minimum value, maximum value, and range for height only. Solution 1. From the Statistics menu, select Summarize. From the Summarize drop down menu, select Descriptives. This will open the Descriptives dialog box. 2. In the variable list, select the variable height. Left click on the right arrow button between the boxes to move this variable over to the Variable(s) box. To calculate statistics for many variables, simultaneously add variables to the Variable(s) box. 3. Click on the Options button. This will open the Descriptives: Options dialog box. Click on mean, sum, standard deviation, variance, minimum value, maximum value, and range. Click on the Continue button when done. 17

18 4. Click OK. The Descriptives dialog box closes and SPSS activates the Output Navigator to illustrate the statistics. Window Output Tutorial 2: Correlation Two or more variables may be included in a correlation matrix. When generating the correlation matrix, the Data Editor must be open with the appropriate data set before continuing. Problem Using the data in the file nba.txt that is located in ~/SPSS/, determine the correlation between a player s height and weight. Solution 1. From the Statistics menu, select Correlate. From the Correlate drop down menu, select Bivariate. This will open the Bivariate Correlations dialog box. 2. In the variable list, select height and weight. Left click on the right arrow button between the boxes to move a variable over to the Variable(s) box. 3. Select the type of correlation coefficients that will be generated. In this case, use Pearson. 18

19 4. Select the test of significance to be used. In this case, use two-tailed. 5. Check mark the Flag significant correlations box. 6. Click on the Options button. This will open the Bivariate Correlations: Options dialog box. To display the mean and standard deviation for each variable, select Means and standard deviations. In this case, this option is not used. To display cross product deviations and covariances for each pair of variables, select Cross-product devations and covariances. In this case, this option will not be used. When done, click the Continue button. 7. Click OK. The Bivariate Correlations dialog box closes and SPSS activates the Output Navigator. The correlation coefficient for each pair of variables is displayed. The number of cases appears at the bottom. Window Output 19

20 Generating Graphical Statistics in SPSS The following tutorials introduce how to create scatter plots, histograms, stem and leaf plots, and box plots using the SPSS Graphs menu located on the Data Editor menu bar. Tutorial 1: How to Generate Scatter Plots Problem Using the data in ~/SPSS/nba.txt, create an x-y plot of a player s weight versus height. Solution 1. From the Graphs menu, select Scatter This will open the Scatterplot dialog box. 2. Select the Simple icon and click Define. This will open the Simple Scatterplot dialog box. 3. From the variable list, select weight. Left click on the right arrow button between the variable list and the Y Axis box to move the variable, weight, to this box. 4. From the variable list, select height. Left click on the right arrow button between the variable list and the X Axis box to move the variable, height, to this box. 5. Click on the Options button. This will open the Options dialog box. 20

21 To display a report of missing values, select Display groups defined by missing values. In this case, this option will not be used. When done, click the Continue button. 6. To display titles, subtitles, or footnotes on the histogram, click on the Titles button. This will open the Titles dialog box. In the Line 1 box, type Scatter Plot Height vs. Weight. When done, click the Continue button. 7. Click OK. The Simple Scatterplot dialog box closes and SPSS activates the Output Navigator. Window Output 21
22 Tutorial 2: How to Generate a Histogram Problem Using the data in ~ /SPSS/statdata.txt, create histogram of per capita income. Solution 1. From the Graphs menu, select Histogram This will open the Histogram dialog box. 2. From the variable list, select income. Left click on the right arrow button between the variable list and the Variable box to move the variable, income, to this box. 3. Select Display normal curve box to show a normal curve on the histogram. 4. To display titles, subtitles, or footnotes on the histogram, click on the Titles button. This will open the Titles dialog box. In the Line 1 box, type Histogram of Per Capita Income. Click on the Continue button when done. 5. Click OK. The Histogram dialog box will close and SPSS activates the Output Navigator to display the histogram. 22
23 Window Output Tutorial 3: How to Generate a Stem and Leaf Plot Problem Using the data in ~ /SPSS/statdata.txt, create a stem and leaf plot of per capita income. Solution 1. From the Statistics menu, select Summarize. From the Summarize drop-down menu, select Explore This will open the Explore dialog box. 2. From the variable list, select income. Left click on the right arrow button between the variable list and the Dependent List box to move the variable, income, to this box. 3. Click on the Statistics button. This will open the Explore: Statistics dialog box. 23
24 To display descriptive statistics, select Descriptives. To display maximum likelihood estimators, select M-estimators. To display cases with the five largest and smallest values, select Outliers. To display percentiles, select Percentiles. In this case, none of these options are used. When done, click on the Continue button. 4. In the Display area, select Plots. This will display the specified plot only (i.e. no statistics are given). 5. Click on the Plots button. This opens the Explore: Plots dialog box. Ensure that the Stem-and-leaf box is selected. Click on the Continue button. 6. Click on the Options button. This will open the Explore: Options button. To exclude cases that have missing values for any of the variables used in any of the analyses, select Exclude cases listwise. In this case, this option is used. To exclude cases that have missing values for either or both of the pair of variables in a specific correlation coefficient, select Exclude cases pairwise. 24
25 However, to treat missing values as a separate category, select Report values. Click the Continue button when done. 7. Click OK. This will close the Explore dialog box and SPSS activates the Output Navigator to display the stem and leaf plot. Window Output 25
26 Tutorial 4: How to Generate a Box Plot Problem Using the data in the file, ~ /SPLUS/statdata.dat, produce a boxplot of per capita income Solution 1. From the Graphs menu, select Boxplot This will open the Boxplot dialog box. 2. Select the Simple button. 3. Select Summaries of separate variables in the Data in Chart Are area. 4. Click on the Define button. This will open the Define Simple Boxplot: Summaries of Separate Variables dialog box. 5. From the variable list, select income. Left click on the right arrow button between the variable list and the Boxes Represent box to move the variable, income, to this box. 6. Click on the Options button. This will open the Options dialog box. To display a report of missing values, select Display groups defined by missing values. In this case, this option will not be used. When done, click the Continue button. 26
27 7. Click OK. This will close the Define Simple Boxplot: Summaries of Separate Variables dialog box and SPSS activates the Output Navigator to display the box plot. Window Output 27
28 Statistical Models in SPSS Tutorial 1: Linear Regression The Regression submenu on the Statistics menu of the Data Editor provides regression techniques. The following tutorial will introduce how to perform linear regression using SPSS. The output contains goodness of fit statistics and the coefficients for the variables. Problem Using the data in ~/SPSS/nba.txt, compute a least squares regression line to investigate if a player s height can predict his weight. Solution 1. From the Statistics menu, select Regression. From the Regression drop down menu, select Linear This will open the Linear Regression dialog box. 2. From the variable list, select weight. Left click on the right arrow button between the variable list and the Dependent box to move the variable, weight, to this box. 3. From the variable list, select height. Left click on the right arrow button between the variable list and the Independent(s) box to move the variable, height, to this box. 4. Select the method the independent variables are entered into the analysis. From the Method drop-down menu, there is a choice of enter, stepwise, remove, backward, and forward. In this case, we will use the enter method. 5. To limit the analysis to a subset of cases having a particular value for a variable, enter this variable into the Selection Variable box. In this case, this option is not used. 6. Determine the variable that will identify the points on plots. Select the variable and left click on the right arrow between the variable list and the Case Labels box. In this case, this option is not used. 28
29 7. To display statistics, click on the Statistics button. This will open the Linear Regression: Statistics dialog box. Select the appropriate statistics to be displayed and click on the Continue button when done. In this case, this option is not used. 8. To display specific plots, click on the Plots button. This will open the Linear Regression: Plots dialog box. From the variable list, select the variable that will be displayed on the Y axis. Left click on the right arrow button between the variable list and the Y box. Do this also for the X axis. When done, click on the Next button. If more plots are needed, follow the same procedure. In this case, this option is not used. When done defining the plots, click on the Continue button. 9. To indicate which statistics should be displayed, click on the Save button. This will open the Linear Regression: Save dialog box. 29
30 Select the appropriate statistics. To save the coefficient statistics, click on the box and indicate the file to which you want them saved. In this case, this option is not used. 10. To indicate the stepping method criteria, click the Options button. This will open the Linear Regression: Options dialog box. Select the method to be used. When the selection is made, click on the Continue button. 11. Click OK. This will close the Linear Regression dialog box. SPSS activates the Output Navigator to display the results of the analysis. Window Output 30
31 Tutorial 2: Analysis of Variance Problem Using the data in ~/SPSS/teller1.txt, test if the mean number of customers served per hour by each of the four tellers is the same. Solution 1. From the Statistics menu, select Compare Means. From the Compare Means drop down menu, select One-Way ANOVA This will open the One-Way ANOVA dialog box. 2. From the variable list, select num_cus. Left click on the right arrow button between the variable list and the Dependent List box to move the variable, num_cus, to this box. 3. From the variable list, select teller. Left click on the right arrow button between the variable list and the Factor box to move the variable, teller, to this box. 4. Click on the Contrasts button. This will open the One-Way ANOVA: Contrasts dialog box. To partition between-groups sum of squares into polynomial trend components, select the Polynomial box and select the highest degree of the polynomial to be modelled. In this case, this option will not be used. To enter a numeric coefficient value for each level, click Add. However, the number of coefficients must equal the number of groups or the analysis is not performed. Because the levels in this problem are already numeric, this option does not need to be used. 31
32 5. Click on the Post Hoc button. This will open the One-Way ANOVA: Post Hoc Multiple Comparisons dialog box. If equal variances are assumed between the different factor levels, select the type of comparison method to be used. If equal variance are not assumed between the different factor levels, select the type of comparison method to be used. To get a description on each of the methods listed, right click on the word. A description window will appear. Click the Continue button when done. 6. Click on the Options button. This will open the One-Way ANOVA: Options dialog box. To display descriptive statistics, select Descriptive in the Statistics area. In this case, select this option. To exclude cases that have missing values for the variable involved in that test, select Exclude cases analysis by analysis. In this case, select this option. However, to exclude cases that have missing values for any of the variables used in any of the analyses, select Exclude cases listwise. Click the Continue button when done. 7. Click OK. The One-Way ANOVA dialog box closes and SPSS activates the Output Navigator. The means of the dependent variable for each category of the independent variable can be found under "Descriptives". 32
33 Window Output 33
34 Appendix A: Data Files City Data This data set, called citydata.txt, includes prices of selected products for 200 selected cities across the U.S. C1 C2 C3 C4 C5 C6 C7 C8 C9 C10 C11 C12 City number Price of T-bone steak per pound Price of half-gallon carton of whole milk Price of 2-litre Coca-Cola bottle, excluding any deposit Monthly rent of an unfurnished two-bedroom apartment,1-1/2 or 2 baths, approximately 950 square feet Purchase price of 1800-square foot new house, on 8000-square foot lot in urban area with all utilities Monthly telephone charges for a private residential line Price of one gallon regular unleaded gas, including all taxes Average cost per day of a semiprivate room in a hospital Price for a woman s shampoo, trim, and blow dry Price of dry cleaning, man s two-piece suit Price of Gallo Chablis blanc wine, 1.5-litre bottle C1 C2 C3 C4 C5 C6 C7 C8 C9 C10 C11 C State Data This data set, called statdata.txt, includes information of different variables for 50 states in the U.S. C1 State number C2 Average tuition and fees (in dollars) for in-state residents at public college, C3 Female labour force participation rate (in percent), 1995 C4 Estimated 1996 spending (in millions of dollars) by states C5 Per capita income (in dollars), 1995 C6 Per capita energy expenditure (in dollars), 1993 C7 Infant mortality rate (in percent), 1993 C1 C2 C3 C4 C5 C6 C
35 NBA Data This data set includes, called nba.txt, information on the heights and weights of NBA players who were on the rosters of NBA teams at the beginning of season. C1 C2 C3 Player number Height (in inches) of a player Weight (in pounds) of a player C1 C2 C Teller Data This data set, called teller1.txt, includes information on the number of customers that a teller serves at a bank. C1 C2 Teller number Number of customers C C2 35
There are six different windows that can be opened when using SPSS. The following will give a description of each of them.
 SPSS Basics Tutorial 1: SPSS Windows There are six different windows that can be opened when using SPSS. The following will give a description of each of them. The Data Editor The Data Editor is a spreadsheet
SPSS Introduction. Yi Li
 SPSS Introduction Yi Li Note: The report is based on the websites below http://glimo.vub.ac.be/downloads/eng_spss_basic.pdf http://academic.udayton.edu/gregelvers/psy216/spss http://www.nursing.ucdenver.edu/pdf/factoranalysishowto.pdf
Scatter Plots with Error Bars
 Chapter 165 Scatter Plots with Error Bars Introduction The procedure extends the capability of the basic scatter plot by allowing you to plot the variability in Y and X corresponding to each point. Each
Directions for using SPSS
 Directions for using SPSS Table of Contents Connecting and Working with Files 1. Accessing SPSS... 2 2. Transferring Files to N:\drive or your computer... 3 3. Importing Data from Another File Format...
SPSS Manual for Introductory Applied Statistics: A Variable Approach
 SPSS Manual for Introductory Applied Statistics: A Variable Approach John Gabrosek Department of Statistics Grand Valley State University Allendale, MI USA August 2013 2 Copyright 2013 John Gabrosek. All
Sample Table. Columns. Column 1 Column 2 Column 3 Row 1 Cell 1 Cell 2 Cell 3 Row 2 Cell 4 Cell 5 Cell 6 Row 3 Cell 7 Cell 8 Cell 9.
 Working with Tables in Microsoft Word The purpose of this document is to lead you through the steps of creating, editing and deleting tables and parts of tables. This document follows a tutorial format
GeoGebra Statistics and Probability
 GeoGebra Statistics and Probability Project Maths Development Team 2013 www.projectmaths.ie Page 1 of 24 Index Activity Topic Page 1 Introduction GeoGebra Statistics 3 2 To calculate the Sum, Mean, Count,
Excel Tutorial. Bio 150B Excel Tutorial 1
 Bio 15B Excel Tutorial 1 Excel Tutorial As part of your laboratory write-ups and reports during this semester you will be required to collect and present data in an appropriate format. To organize and
Excel 2007 Basic knowledge
 Ribbon menu The Ribbon menu system with tabs for various Excel commands. This Ribbon system replaces the traditional menus used with Excel 2003. Above the Ribbon in the upper-left corner is the Microsoft
Describing, Exploring, and Comparing Data
 24 Chapter 2. Describing, Exploring, and Comparing Data Chapter 2. Describing, Exploring, and Comparing Data There are many tools used in Statistics to visualize, summarize, and describe data. This chapter
Using SPSS, Chapter 2: Descriptive Statistics
 1 Using SPSS, Chapter 2: Descriptive Statistics Chapters 2.1 & 2.2 Descriptive Statistics 2 Mean, Standard Deviation, Variance, Range, Minimum, Maximum 2 Mean, Median, Mode, Standard Deviation, Variance,
Introduction Course in SPSS - Evening 1
 ETH Zürich Seminar für Statistik Introduction Course in SPSS - Evening 1 Seminar für Statistik, ETH Zürich All data used during the course can be downloaded from the following ftp server: ftp://stat.ethz.ch/u/sfs/spsskurs/
Advanced Microsoft Excel 2010
 Advanced Microsoft Excel 2010 Table of Contents THE PASTE SPECIAL FUNCTION... 2 Paste Special Options... 2 Using the Paste Special Function... 3 ORGANIZING DATA... 4 Multiple-Level Sorting... 4 Subtotaling
Introduction to SPSS 16.0
 Introduction to SPSS 16.0 Edited by Emily Blumenthal Center for Social Science Computation and Research 110 Savery Hall University of Washington Seattle, WA 98195 USA (206) 543-8110 November 2010 http://julius.csscr.washington.edu/pdf/spss.pdf
CHARTS AND GRAPHS INTRODUCTION USING SPSS TO DRAW GRAPHS SPSS GRAPH OPTIONS CAG08
 CHARTS AND GRAPHS INTRODUCTION SPSS and Excel each contain a number of options for producing what are sometimes known as business graphics - i.e. statistical charts and diagrams. This handout explores
Microsoft Excel 2010 Part 3: Advanced Excel
 CALIFORNIA STATE UNIVERSITY, LOS ANGELES INFORMATION TECHNOLOGY SERVICES Microsoft Excel 2010 Part 3: Advanced Excel Winter 2015, Version 1.0 Table of Contents Introduction...2 Sorting Data...2 Sorting
Using Microsoft Word. Working With Objects
 Using Microsoft Word Many Word documents will require elements that were created in programs other than Word, such as the picture to the right. Nontext elements in a document are referred to as Objects
How to create pop-up menus
 How to create pop-up menus Pop-up menus are menus that are displayed in a browser when a site visitor moves the pointer over or clicks a trigger image. Items in a pop-up menu can have URL links attached
Assignment objectives:
 Assignment objectives: Regression Pivot table Exercise #1- Simple Linear Regression Often the relationship between two variables, Y and X, can be adequately represented by a simple linear equation of the
Create a Poster Using Publisher
 Contents 1. Introduction 1. Starting Publisher 2. Create a Poster Template 5. Aligning your images and text 7. Apply a background 12. Add text to your poster 14. Add pictures to your poster 17. Add graphs
How to make a line graph using Excel 2007
 How to make a line graph using Excel 2007 Format your data sheet Make sure you have a title and each column of data has a title. If you are entering data by hand, use time or the independent variable in
MS Excel. Handout: Level 2. elearning Department. Copyright 2016 CMS e-learning Department. All Rights Reserved. Page 1 of 11
 MS Excel Handout: Level 2 elearning Department 2016 Page 1 of 11 Contents Excel Environment:... 3 To create a new blank workbook:...3 To insert text:...4 Cell addresses:...4 To save the workbook:... 5
IBM SPSS Statistics 20 Part 1: Descriptive Statistics
 CALIFORNIA STATE UNIVERSITY, LOS ANGELES INFORMATION TECHNOLOGY SERVICES IBM SPSS Statistics 20 Part 1: Descriptive Statistics Summer 2013, Version 2.0 Table of Contents Introduction...2 Downloading the
Microsoft Excel 2010 Tutorial
 1 Microsoft Excel 2010 Tutorial Excel is a spreadsheet program in the Microsoft Office system. You can use Excel to create and format workbooks (a collection of spreadsheets) in order to analyze data and
Appendix 2.1 Tabular and Graphical Methods Using Excel
 Appendix 2.1 Tabular and Graphical Methods Using Excel 1 Appendix 2.1 Tabular and Graphical Methods Using Excel The instructions in this section begin by describing the entry of data into an Excel spreadsheet.
SPSS: Getting Started. For Windows
 For Windows Updated: August 2012 Table of Contents Section 1: Overview... 3 1.1 Introduction to SPSS Tutorials... 3 1.2 Introduction to SPSS... 3 1.3 Overview of SPSS for Windows... 3 Section 2: Entering
SPSS (Statistical Package for the Social Sciences)
") SPSS (Statistical Package for the Social Sciences) What is SPSS? SPSS stands for Statistical Package for the Social Sciences The SPSS home-page is: www.spss.com 2 What can you do with SPSS? Run Frequencies
SPSS (Statistical Package for the Social Sciences) What is SPSS? SPSS stands for Statistical Package for the Social Sciences The SPSS home-page is: www.spss.com 2 What can you do with SPSS? Run Frequencies
SAS Analyst for Windows Tutorial
 Updated: August 2012 Table of Contents Section 1: Introduction... 3 1.1 About this Document... 3 1.2 Introduction to Version 8 of SAS... 3 Section 2: An Overview of SAS V.8 for Windows... 3 2.1 Navigating
January 26, 2009 The Faculty Center for Teaching and Learning
 THE BASICS OF DATA MANAGEMENT AND ANALYSIS A USER GUIDE January 26, 2009 The Faculty Center for Teaching and Learning THE BASICS OF DATA MANAGEMENT AND ANALYSIS Table of Contents Table of Contents... i
Importing and Exporting With SPSS for Windows 17 TUT 117
 Information Systems Services Importing and Exporting With TUT 117 Version 2.0 (Nov 2009) Contents 1. Introduction... 3 1.1 Aim of this Document... 3 2. Importing Data from Other Sources... 3 2.1 Reading
An introduction to IBM SPSS Statistics
 An introduction to IBM SPSS Statistics Contents 1 Introduction... 1 2 Entering your data... 2 3 Preparing your data for analysis... 10 4 Exploring your data: univariate analysis... 14 5 Generating descriptive
Appendix III: SPSS Preliminary
 Appendix III: SPSS Preliminary SPSS is a statistical software package that provides a number of tools needed for the analytical process planning, data collection, data access and management, analysis,
SPSS Explore procedure
 SPSS Explore procedure One useful function in SPSS is the Explore procedure, which will produce histograms, boxplots, stem-and-leaf plots and extensive descriptive statistics. To run the Explore procedure,
The Center for Teaching, Learning, & Technology
 The Center for Teaching, Learning, & Technology Instructional Technology Workshops Microsoft Excel 2010 Formulas and Charts Albert Robinson / Delwar Sayeed Faculty and Staff Development Programs Colston
Merging Labels, Letters, and Envelopes Word 2013
 Merging Labels, Letters, and Envelopes Word 2013 Merging... 1 Types of Merges... 1 The Merging Process... 2 Labels - A Page of the Same... 2 Labels - A Blank Page... 3 Creating Custom Labels... 3 Merged
IBM SPSS Statistics for Beginners for Windows
 ISS, NEWCASTLE UNIVERSITY IBM SPSS Statistics for Beginners for Windows A Training Manual for Beginners Dr. S. T. Kometa A Training Manual for Beginners Contents 1 Aims and Objectives... 3 1.1 Learning
Scientific Graphing in Excel 2010
 Scientific Graphing in Excel 2010 When you start Excel, you will see the screen below. Various parts of the display are labelled in red, with arrows, to define the terms used in the remainder of this overview.
SPSS for Simple Analysis
 STC: SPSS for Simple Analysis1 SPSS for Simple Analysis STC: SPSS for Simple Analysis2 Background Information IBM SPSS Statistics is a software package used for statistical analysis, data management, and
Data Analysis Tools. Tools for Summarizing Data
 Data Analysis Tools This section of the notes is meant to introduce you to many of the tools that are provided by Excel under the Tools/Data Analysis menu item. If your computer does not have that tool
SPSS 12 Data Analysis Basics Linda E. Lucek, Ed.D. LindaL@niu.edu 815-753-9516
 SPSS 12 Data Analysis Basics Linda E. Lucek, Ed.D. LindaL@niu.edu 815-753-9516 Technical Advisory Group Customer Support Services Northern Illinois University 120 Swen Parson Hall DeKalb, IL 60115 SPSS
Statgraphics Getting started
 Statgraphics Getting started The aim of this exercise is to introduce you to some of the basic features of the Statgraphics software. Starting Statgraphics 1. Log in to your PC, using the usual procedure
INTRODUCTORY LAB: DOING STATISTICS WITH SPSS 21
 INTRODUCTORY LAB: DOING STATISTICS WITH SPSS 21 This section covers the basic structure and commands of SPSS for Windows Release 21. It is not designed to be a comprehensive review of the most important
Introduction to PASW Statistics 34152-001
 Introduction to PASW Statistics 34152-001 V18 02/2010 nm/jdr/mr For more information about SPSS Inc., an IBM Company software products, please visit our Web site at http://www.spss.com or contact: SPSS
Creating a PowerPoint Poster using Windows
 Creating a PowerPoint Poster using Windows Copyright 2001 Michael Dougherty (michael@nmsu.edu) Purpose The purpose of this tutorial is to illustrate how to create a 3 x 4 ft. poster using PowerPoint. This
Intro to Excel spreadsheets
 Intro to Excel spreadsheets What are the objectives of this document? The objectives of document are: 1. Familiarize you with what a spreadsheet is, how it works, and what its capabilities are; 2. Using
5. Correlation. Open HeightWeight.sav. Take a moment to review the data file.
 5. Correlation Objectives Calculate correlations Calculate correlations for subgroups using split file Create scatterplots with lines of best fit for subgroups and multiple correlations Correlation The
Basic Pivot Tables. To begin your pivot table, choose Data, Pivot Table and Pivot Chart Report. 1 of 18
 Basic Pivot Tables Pivot tables summarize data in a quick and easy way. In your job, you could use pivot tables to summarize actual expenses by fund type by object or total amounts. Make sure you do not
Figure 1. An embedded chart on a worksheet.
 8. Excel Charts and Analysis ToolPak Charts, also known as graphs, have been an integral part of spreadsheets since the early days of Lotus 1-2-3. Charting features have improved significantly over the
How to Use a Data Spreadsheet: Excel
 How to Use a Data Spreadsheet: Excel One does not necessarily have special statistical software to perform statistical analyses. Microsoft Office Excel can be used to run statistical procedures. Although
KaleidaGraph Quick Start Guide
 KaleidaGraph Quick Start Guide This document is a hands-on guide that walks you through the use of KaleidaGraph. You will probably want to print this guide and then start your exploration of the product.
An Introduction to SPSS. Workshop Session conducted by: Dr. Cyndi Garvan Grace-Anne Jackman
 An Introduction to SPSS Workshop Session conducted by: Dr. Cyndi Garvan Grace-Anne Jackman Topics to be Covered Starting and Entering SPSS Main Features of SPSS Entering and Saving Data in SPSS Importing
Participant Guide RP301: Ad Hoc Business Intelligence Reporting
 RP301: Ad Hoc Business Intelligence Reporting State of Kansas As of April 28, 2010 Final TABLE OF CONTENTS Course Overview... 4 Course Objectives... 4 Agenda... 4 Lesson 1: Reviewing the Data Warehouse...
TIBCO Spotfire Business Author Essentials Quick Reference Guide. Table of contents:
 Table of contents: Access Data for Analysis Data file types Format assumptions Data from Excel Information links Add multiple data tables Create & Interpret Visualizations Table Pie Chart Cross Table Treemap
Plotting: Customizing the Graph
 Plotting: Customizing the Graph Data Plots: General Tips Making a Data Plot Active Within a graph layer, only one data plot can be active. A data plot must be set active before you can use the Data Selector
Excel Math Project for 8th Grade Identifying Patterns
 There are several terms that we will use to describe your spreadsheet: Workbook, worksheet, row, column, cell, cursor, name box, formula bar. Today you are going to create a spreadsheet to investigate
Doing Multiple Regression with SPSS. In this case, we are interested in the Analyze options so we choose that menu. If gives us a number of choices:
 Doing Multiple Regression with SPSS Multiple Regression for Data Already in Data Editor Next we want to specify a multiple regression analysis for these data. The menu bar for SPSS offers several options:
GeoGebra. 10 lessons. Gerrit Stols
 GeoGebra in 10 lessons Gerrit Stols Acknowledgements GeoGebra is dynamic mathematics open source (free) software for learning and teaching mathematics in schools. It was developed by Markus Hohenwarter
Introduction to Microsoft Excel 2010
 Introduction to Microsoft Excel 2010 Screen Elements Quick Access Toolbar The Ribbon Formula Bar Expand Formula Bar Button File Menu Vertical Scroll Worksheet Navigation Tabs Horizontal Scroll Bar Zoom
This activity will show you how to draw graphs of algebraic functions in Excel.
 This activity will show you how to draw graphs of algebraic functions in Excel. Open a new Excel workbook. This is Excel in Office 2007. You may not have used this version before but it is very much the
CREATING EXCEL PIVOT TABLES AND PIVOT CHARTS FOR LIBRARY QUESTIONNAIRE RESULTS
 CREATING EXCEL PIVOT TABLES AND PIVOT CHARTS FOR LIBRARY QUESTIONNAIRE RESULTS An Excel Pivot Table is an interactive table that summarizes large amounts of data. It allows the user to view and manipulate
Calibration and Linear Regression Analysis: A Self-Guided Tutorial
 Calibration and Linear Regression Analysis: A Self-Guided Tutorial Part 1 Instrumental Analysis with Excel: The Basics CHM314 Instrumental Analysis Department of Chemistry, University of Toronto Dr. D.
Microsoft PowerPoint 2011
 Microsoft PowerPoint 2011 Starting PowerPoint... 2 Creating Slides in Your Presentation... 3 Beginning with the Title Slide... 3 Inserting a New Slide... 3 Adding an Image to a Slide... 4 Downloading Images
4 Other useful features on the course web page. 5 Accessing SAS
 1 Using SAS outside of ITCs Statistical Methods and Computing, 22S:30/105 Instructor: Cowles Lab 1 Jan 31, 2014 You can access SAS from off campus by using the ITC Virtual Desktop Go to https://virtualdesktopuiowaedu
Instructions for SPSS 21
 1 Instructions for SPSS 21 1 Introduction... 2 1.1 Opening the SPSS program... 2 1.2 General... 2 2 Data inputting and processing... 2 2.1 Manual input and data processing... 2 2.2 Saving data... 3 2.3
Basic Excel Handbook
 2 5 2 7 1 1 0 4 3 9 8 1 Basic Excel Handbook Version 3.6 May 6, 2008 Contents Contents... 1 Part I: Background Information...3 About This Handbook... 4 Excel Terminology... 5 Excel Terminology (cont.)...
EXCEL Tutorial: How to use EXCEL for Graphs and Calculations.
 EXCEL Tutorial: How to use EXCEL for Graphs and Calculations. Excel is powerful tool and can make your life easier if you are proficient in using it. You will need to use Excel to complete most of your
Gestation Period as a function of Lifespan
 This document will show a number of tricks that can be done in Minitab to make attractive graphs. We work first with the file X:\SOR\24\M\ANIMALS.MTP. This first picture was obtained through Graph Plot.
Microsoft Excel Basics
 COMMUNITY TECHNICAL SUPPORT Microsoft Excel Basics Introduction to Excel Click on the program icon in Launcher or the Microsoft Office Shortcut Bar. A worksheet is a grid, made up of columns, which are
Introduction To Microsoft Office PowerPoint 2007. Bob Booth July 2008 AP-PPT5
 Introduction To Microsoft Office PowerPoint 2007. Bob Booth July 2008 AP-PPT5 University of Sheffield Contents 1. INTRODUCTION... 3 2. GETTING STARTED... 4 2.1 STARTING POWERPOINT... 4 3. THE USER INTERFACE...
Basic Microsoft Excel 2007
 Basic Microsoft Excel 2007 The biggest difference between Excel 2007 and its predecessors is the new layout. All of the old functions are still there (with some new additions), but they are now located
Summary of important mathematical operations and formulas (from first tutorial):
:") EXCEL Intermediate Tutorial Summary of important mathematical operations and formulas (from first tutorial): Operation Key Addition + Subtraction - Multiplication * Division / Exponential ^ To enter a
EXCEL Intermediate Tutorial Summary of important mathematical operations and formulas (from first tutorial): Operation Key Addition + Subtraction - Multiplication * Division / Exponential ^ To enter a
Introduction to Microsoft Excel 2007/2010
 to Microsoft Excel 2007/2010 Abstract: Microsoft Excel is one of the most powerful and widely used spreadsheet applications available today. Excel's functionality and popularity have made it an essential
4. Descriptive Statistics: Measures of Variability and Central Tendency
 4. Descriptive Statistics: Measures of Variability and Central Tendency Objectives Calculate descriptive for continuous and categorical data Edit output tables Although measures of central tendency and
Using Microsoft Excel to Plot and Analyze Kinetic Data
 Entering and Formatting Data Using Microsoft Excel to Plot and Analyze Kinetic Data Open Excel. Set up the spreadsheet page (Sheet 1) so that anyone who reads it will understand the page (Figure 1). Type
Simple Linear Regression, Scatterplots, and Bivariate Correlation
 1 Simple Linear Regression, Scatterplots, and Bivariate Correlation This section covers procedures for testing the association between two continuous variables using the SPSS Regression and Correlate analyses.
Introduction to Microsoft Word 2003
 Introduction to Microsoft Word 2003 Sabeera Kulkarni Information Technology Lab School of Information University of Texas at Austin Fall 2004 1. Objective This tutorial is designed for users who are new
Microsoft Office Excel 2007 Key Features. Office of Enterprise Development and Support Applications Support Group
 Microsoft Office Excel 2007 Key Features Office of Enterprise Development and Support Applications Support Group 2011 TABLE OF CONTENTS Office of Enterprise Development & Support Acknowledgment. 3 Introduction.
Chapter 4 Creating Charts and Graphs
 Calc Guide Chapter 4 OpenOffice.org Copyright This document is Copyright 2006 by its contributors as listed in the section titled Authors. You can distribute it and/or modify it under the terms of either
Statistical Analysis Using SPSS for Windows Getting Started (Ver. 2014/11/6) The numbers of figures in the SPSS_screenshot.pptx are shown in red.
 The numbers of figures in the SPSS_screenshot.pptx are shown in red.") Statistical Analysis Using SPSS for Windows Getting Started (Ver. 2014/11/6) The numbers of figures in the SPSS_screenshot.pptx are shown in red. 1. How to display English messages from IBM SPSS Statistics
Statistical Analysis Using SPSS for Windows Getting Started (Ver. 2014/11/6) The numbers of figures in the SPSS_screenshot.pptx are shown in red. 1. How to display English messages from IBM SPSS Statistics
Data analysis process
 Data analysis process Data collection and preparation Collect data Prepare codebook Set up structure of data Enter data Screen data for errors Exploration of data Descriptive Statistics Graphs Analysis
SPSS Step-by-Step Tutorial: Part 1
 SPSS Step-by-Step Tutorial: Part 1 For SPSS Version 11.5 DataStep Development 2004 Table of Contents 1 SPSS Step-by-Step 5 Introduction 5 Installing the Data 6 Installing files from the Internet 6 Installing
How To Use Spss
 1: Introduction to SPSS Objectives Learn about SPSS Open SPSS Review the layout of SPSS Become familiar with Menus and Icons Exit SPSS What is SPSS? SPSS is a Windows based program that can be used to
Introduction to IBM SPSS Statistics
 CONTENTS Arizona State University College of Health Solutions College of Nursing and Health Innovation Introduction to IBM SPSS Statistics Edward A. Greenberg, PhD Director, Data Lab PAGE About This Document
Microsoft PowerPoint 2010
 Microsoft PowerPoint 2010 Starting PowerPoint... 2 PowerPoint Window Properties... 2 The Ribbon... 3 Default Tabs... 3 Contextual Tabs... 3 Minimizing and Restoring the Ribbon... 4 The Backstage View...
One-Way ANOVA using SPSS 11.0. SPSS ANOVA procedures found in the Compare Means analyses. Specifically, we demonstrate
 1 One-Way ANOVA using SPSS 11.0 This section covers steps for testing the difference between three or more group means using the SPSS ANOVA procedures found in the Compare Means analyses. Specifically,
Using Excel 2003 with Basic Business Statistics
 Using Excel 2003 with Basic Business Statistics Introduction Use this document if you plan to use Excel 2003 with Basic Business Statistics, 12th edition. Instructions specific to Excel 2003 are needed
PowerPoint 2007 Basics Website: http://etc.usf.edu/te/
 Website: http://etc.usf.edu/te/ PowerPoint is the presentation program included in the Microsoft Office suite. With PowerPoint, you can create engaging presentations that can be presented in person, online,
Using the Cute Rich-Text Editor
 Using the Cute Rich-Text Editor This document is designed to provide users with a basic introduction to using the Cute rich-text editor to format text, create and modify tables, and to place charts and
SPSS INSTRUCTION CHAPTER 1
 SPSS INSTRUCTION CHAPTER 1 Performing the data manipulations described in Section 1.4 of the chapter require minimal computations, easily handled with a pencil, sheet of paper, and a calculator. However,
ITS Training Class Charts and PivotTables Using Excel 2007
 When you have a large amount of data and you need to get summary information and graph it, the PivotTable and PivotChart tools in Microsoft Excel will be the answer. The data does not need to be in one
Creating an Excel XY (Scatter) Plot
 Plot") Creating an Excel XY (Scatter) Plot EXCEL REVIEW 21-22 1 What is an XY or Scatter Plot? An XY or scatter plot either shows the relationships among the numeric values in several data series or plots two
Creating an Excel XY (Scatter) Plot EXCEL REVIEW 21-22 1 What is an XY or Scatter Plot? An XY or scatter plot either shows the relationships among the numeric values in several data series or plots two
BUSINESS DATA ANALYSIS WITH PIVOTTABLES
 BUSINESS DATA ANALYSIS WITH PIVOTTABLES Jim Chen, Ph.D. Professor Norfolk State University 700 Park Avenue Norfolk, VA 23504 (757) 823-2564 jchen@nsu.edu BUSINESS DATA ANALYSIS WITH PIVOTTABLES INTRODUCTION
Instat Tutorial. by Roger Stern, Sandro Leidi, Ian Dale and Colin Grayer. Contents. Installation 2
 by Roger Stern, Sandro Leidi, Ian Dale and Colin Grayer Contents Installation 2 1. Introduction 3 1.1. Tutorial purpose and overview 3 1.2. Getting Started 3 2. Example 1: Basic Use of Instat 3 2.1. Entering
Web Intelligence User Guide
 Web Intelligence User Guide Office of Financial Management - Enterprise Reporting Services 4/11/2011 Table of Contents Chapter 1 - Overview... 1 Purpose... 1 Chapter 2 Logon Procedure... 3 Web Intelligence
Introduction to the TI-Nspire CX
 Introduction to the TI-Nspire CX Activity Overview: In this activity, you will become familiar with the layout of the TI-Nspire CX. Step 1: Locate the Touchpad. The Touchpad is used to navigate the cursor
Microsoft PowerPoint 2008
 Microsoft PowerPoint 2008 Starting PowerPoint... 2 Creating Slides in Your Presentation... 3 Beginning with the Title Slide... 3 Inserting a New Slide... 3 Slide Layouts... 3 Adding an Image to a Slide...
Sage Abra SQL HRMS Reports. User Guide
 Sage Abra SQL HRMS Reports User Guide 2010 Sage Software, Inc. All rights reserved. Sage, the Sage logos, and the Sage product and service names mentioned herein are registered trademarks or trademarks
Advanced Presentation Features and Animation
 There are three features that you should remember as you work within PowerPoint 2007: the Microsoft Office Button, the Quick Access Toolbar, and the Ribbon. The function of these features will be more
STATGRAPHICS Online. Statistical Analysis and Data Visualization System. Revised 6/21/2012. Copyright 2012 by StatPoint Technologies, Inc.
 STATGRAPHICS Online Statistical Analysis and Data Visualization System Revised 6/21/2012 Copyright 2012 by StatPoint Technologies, Inc. All rights reserved. Table of Contents Introduction... 1 Chapter