How To Calculate Income For Older People
|
|
|
- Lee Cain
- 3 years ago
- Views:
Transcription
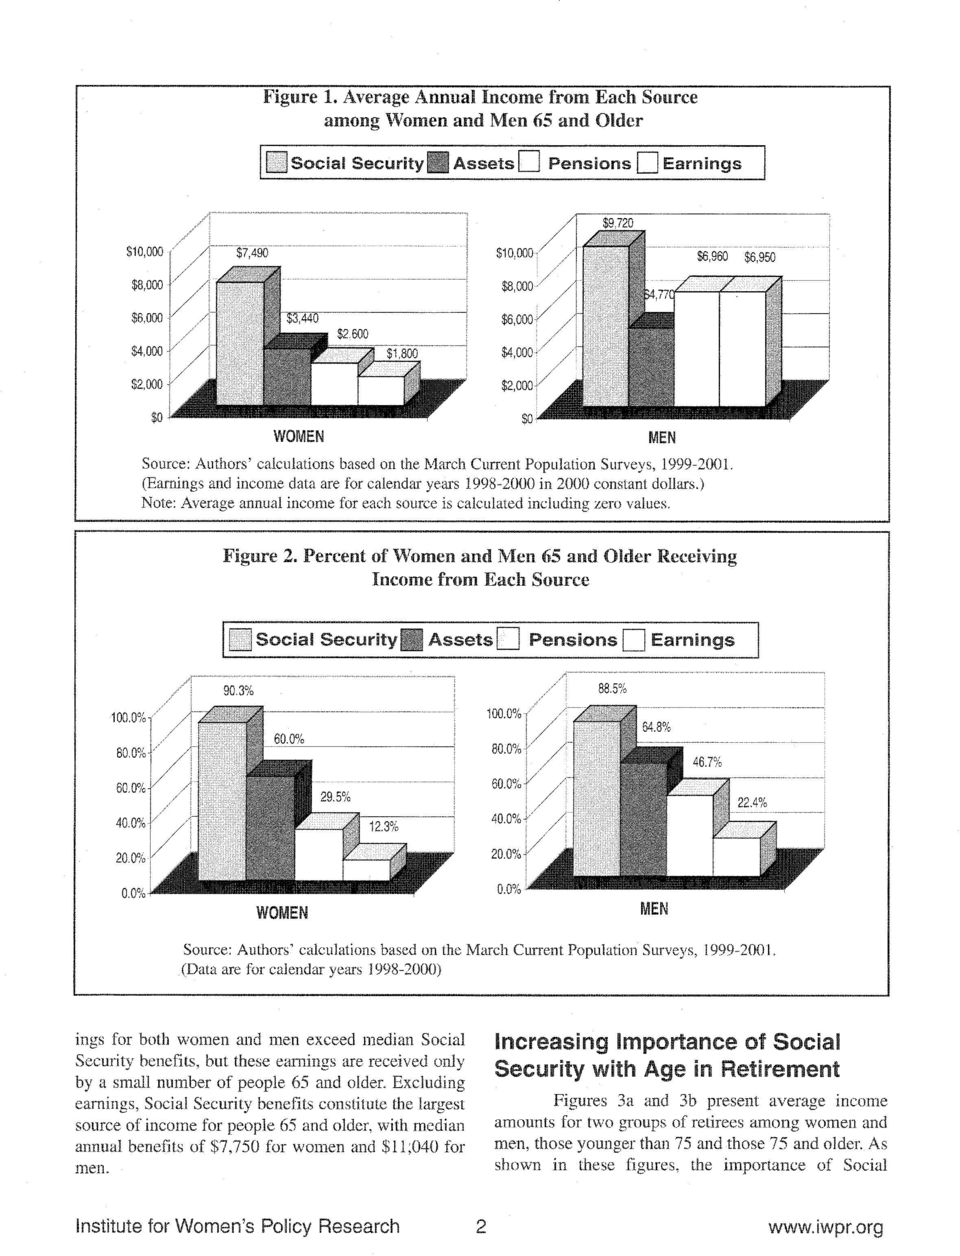
1 IWPR Publication #D455 April 2003 : The Largest Source of Income for Both Women and Men in Retirement By Heidi Hartmann and Sunhwa Lee This Briefing Paper examines major sources of income for older Americans earnings,, pensions and assets by gender and marital status. It shows that during retirement, is the most common and the largest source of income for both women and men. Approximately 90 percent of women and men 65 and older receive income from. During the retirement years, however, women face greater financial insecurity than men. Women tend to marry men who are older than themselves and live longer than men. As a result, women are much more likely than men to be widowed and live alone, making them highly vulnerable to economic insecurity. Having less access to other sources of income, women rely on even more than men do. The study is based on data from the March Current Population Survey (CPS), collected by the Census Bureau. The March CPS is the primary source of detailed information on income in the United States, as it gathers annual information on more than 50 sources of income including earnings, payments, pension income, and other government cash and noncash benefits (e.g., food stamps, health insurance, etc.). We combine data from three years in order to secure sufficient numbers of observations for different categories of older women and men. Analyses of earnings and income sources apply to the calendar years 1998, 1999, and Income Sources in Retirement As most people retire by age 65, both women and men rely heavily on as the largest single source of retirement income. As Figure 1 shows, average annual income from for all women 65 and older was $7,490 and for all men in the same age group was $9,720 during the period Income from other sources such as assets, pensions, and earnings are also important sources of retirement income, but for women 65 and older average annual income from each of these sources is well below the income from. For men, average annual incomes from other sources, especially those from pensions and earnings, are substantially higher than those for women, but they still fall short of the average income coming from. Not everyone, however, receives income from each of these sources in retirement. A majority of women and men over age 65 no longer work, many of them do not have pensions from their previous employment, and a number of them do not even have savings. Yet, provides benefits to almost 90 percent of women and men 65 and older, constituting a nearly universal source of income in old age (see Figure 2). The next most common source of retirement income for people 65 and older comes from assets (interest, dividends, and rent) with about 60 percent of women and 65 percent of men receiving income from these sources. Fewer than one-third of women (30 percent) and half of men (47 percent) receive income from pensions. 3 Only 12 percent of women and 22 percent of men receive income from earnings at ages 65 and older. Even when median annual income is considered only among those who received income from each of these sources, represents the largest, principal source of retirement income for both women and men except earnings (see Table 1). 4 Median earn- Table 1. Median Annual Income Received from Each Source among Women and Men Aged 65 and Older Who Receive Each Source Women Men $7,750 $11,040 $1,330 $1,650 $5,600 $10,340 $8,450 $14,780 Source: Authors' calculations based on the March Current Population Surveys, (Data are for calendar years )

2
3 Figure 3-a. Older Women s Average Annual Income from Each Source by Age ( and income data are for calendar years in 2000 constant dollars.) Note: Average annual income for each source is calculated including zero values. Figure 3-b. Older Men s Average Annual Income from Each Source by Age $9,480 $9,810 $10,060 $10,000 $8,000 $4,910 $7,310 $10,000 $8,000 $4,580 $6,480 $6,000 $4,000 $6,000 $4,000 $2,990 $2,000 $2,000 $0 $0 Age Age 75 & Older ( and income data are for calendar years in 2000 constant dollars.) Note: Average annual income for each source is calculated including zero values. further increases with age as average incomes from other sources decline. And becomes even more vital for women's income security than it does for men's. For both women and men overall, average total personal income tends to decrease as they age, along with decreases in other sources of income like pensions and earnings. 5 Among women, average annual personal income declines from $16,290 for those aged to $15,010 for those 75 and older; among men, it decreases from $32,040 to $24,550, respectively. Yet, the average income from among all elderly women and men increases with age, making up a larger share of their personal income. For example, women aged on average receive $6,890 per year from, whereas women 75 and older receive more than $8,000 on average (see Figure 3a). 6 For this older group of women, accounts for more than half (54 percent) of their total personal income, compared with 42 percent for women aged Institute for Women s Policy Research 3
 Note: Average annual income for each source is calculated including zero values.")
4 Figure 4. Marital Status and Living Arrangements among Older Women and Men by Age Married Unmarried Living alone Unmarried living with others 100% 80% % 80% % % 40% 20% % 20% % 0% Age Age Age 75+ Age Age Age 75+ WOMEN MEN Among men, the increase in average income from for those 75 and older is smaller than among women, but average annual incomes from other sources, particularly pensions and earnings, decline more substantially with age. For example, men aged have an average annual income of $9,810 from earnings, but only $2,990 for those aged 75 and older. 7 As a result, the share of average income coming from increases, from 30 percent for those aged to 41 percent for those 75 and older. Income Sources by Marital Status/ Living Arrangement is critical for economic security among older women, and it is even more so for those women who are unmarried and live alone. Women tend to marry men who are older than themselves and live longer than men. As a result, there are marked differences in marital status and living arrangement between women and men as they enter into the retirement years. As Figure 4 shows, the majority of older men are married: over three-quarters of men in their 50s through early 70s are married and over two-thirds of men 75 years and older are married as well. In contrast, while two-thirds of women aged are married, this proportion falls to just over half for women aged 65-74, and declines dramatically to less than one-third for women 75 years and older. At ages 65 and beyond, women are more than twice as likely as men to be unmarried widowed, divorced, separated, or never married. 8 While some older unmarried people live with others, most commonly relatives, the majority of unmarried people live alone. Women especially are increasingly likely to live alone at older ages. In the oldest age group of 75 and older, nearly half of all women are unmarried and living alone, compared with only 20 percent of men. These differences in marital status/living arrangement are closely associated with the economic well-being of older women and men. Older people who live alone are much more likely than others to be poor, and older women in particular face a disproportionately greater risk of poverty given their higher rates of being widowed and living alone. plays a major role in alleviating poverty among this group of older women who are financially vulnerable. As Figures 5a and 5b show, average annual income from accounts for nearly half of the income of women 65 and older who are unmarried and living alone (49 percent). Its share is even greater for unmarried women living with others (54 percent), while its share is slightly smaller for married women (44 percent). Among men, similarly, accounts for a larger share of average personal income for the unmarried than the married. Compared with women, however, for men, while still the largest source of income, constitutes a smaller share of overall personal income (about 33 to 40 percent on average). Institute for Women s Policy Research 4

5 Figure 5-a. Sources of Income for Women 65 and Older by Marital Status 44.3% 48.5% 54.1% 27.5% 20.3% 13.5% 13.7% 13.3% 1.2% 18.9% 10.1% 2.2% 16.9% 11.2% 4.3% Married Unmarried Living Alone Unmarried Living With s ( Source: and Authors income calculations data are for based calendar on the years March Current in Population 2000 constant Surveys, dollars.) Note: ( Percentages and income are calculated data are based for calendar on average years annual incomes in for 2000 each constant source including dollars.) zero values. Note: Percentages are calculated based on average annual incomes for each source including zero Figure 5-b. Sources of Income for Men 65 and Older by Marital Status 32.9% 34.7% 39.8% 24.5% 25.3% 1.5% 15.8% 23.5% 18.4% 2.3% 21.1% 20.4% 22.7% 3.3% 13.8% Married Unmarried Living Alone Unmarried Living With s ( Source: and Authors income Calculations data are for based calendar on years the March Current in 2000 Population constant Surveys, dollars.) Note: ( Percentages and income are calculated data are based for calendar on average years annual incomes in for 2000 each constant source dollars.) including zero values. Note: Percentages are calculated based on average annual incomes for each source including zero Poverty Rates Despite its importance, the income received from is not sufficient to provide complete economic security in old age, especially for women who have few other sources of income. Women face a greater risk of poverty than men during the retirement years. The overall poverty rate is slightly under 10 percent for women aged 50-64, but increases to 11 percent for women aged and up to 14 percent for those 75 and older. Among men, in contrast, the poverty rate is fairly stable at 7 percent for different age groups. Poverty rates vary greatly for both women and men according to marital status/living arrangement. As Figure 6 shows, married women and men have pover- Institute for Women s Policy Research 5
 zero values. Note: Percentages are calculated based on average annual incomes for each source including zero Figure 5-b. Sources of Income for Men 65 and Older by Marital Status 32.9% 34.7% 39.")
6 ty rates of only 4 to 6 percent, rates that remain stable until age 75 and older, when they increase slightly. In contrast, unmarried 30 women and unmarried 25 men exhibit poverty rates that are two to four times 20 greater than the rates among married people. 15 Unmarried women living 10 alone show the highest poverty rate (approximately 20 percent) of all groups 5 at all ages above Unmarried men living alone also show the highest poverty rate among WOMEN men aged 50 and older, with rates ranging between 14 and 19 percent. is the most common and the largest source of income for both women and men, and it is a particularly critical source of income for those who are widowed, divorced, separated, or never married in old age. The poverty rate for unmarried women living alone would have been much higher if they had not received in retirement. About 68 percent of these women aged 65 and older would have fallen into poverty if they had not received income from during , compared with a poverty rate of 20 percent with receipt. Still, a poverty rate of 20 percent among unmarried women living alone suggests that there needs to be greater attention from policy makers to improving the income of women and men in old age. Conclusion Percent Age Age Age 75+ Figure 6. Poverty Rates among Older Women and Men by Age Married Unmarried living alone Unmarried living with others Percent Age Age Age 75+ MEN As people retire from the workforce and earnings decrease with age, income from, pensions, and savings become crucial for the financial security of older women and men. Of these three sources, is the most common and the largest source of retirement security for both women and men over age 65. also grows in importance for retirees as they age, as other income sources gradually decline. For women aged 75 and older, benefits provide on average almost 55 percent of their total personal income. For nearly one-quarter of women 75 and older, is the only source of income. 's importance for the older population will increase in the future as the U.S. population ages. Currently, about 13 percent of the population is aged 65 or older; by 2050 that population is expected to rise to about 20 percent. In 2000, there were about 10 million women aged 75 and older; by 2050 there are expected to be more than 26 million women in that age group. For men 75 and older, the number is expected to increase from about 6 million to 19 million. 10 Younger women planning for retirement and for old age need to take into account the strong probability of eventually living alone. Having an independent source of income from pensions or other assets is an important goal. If married, it is important that a wife receives a share of her husband's retirement income in case of either widowhood or divorce. The vulnerability of women in old age underscores the importance of maintaining a program that provides secure retirement and survivor benefits fully adjusted to keep up with inflation. Enhancements of are needed that would better protect divorced women, women and men with disabilities, and those who have always worked for low wages at unstable jobs or had low life-time earnings because of caregiving responsibilities. Improving benefits for these groups would further reduce poverty among them. Diverting part of taxes to private accounts will make the present system less secure and reduce opportunities for improvements in the system (Hartmann and Hill 2000; Rix and Williamson 1998; Shaw, Zuckerman, and Hartmann 1998). Since is the largest source of income on average for both women and men over age Institute for Women s Policy Research 6

7 65, and nearly universal for this age group, its importance in the income packages of retirees cannot be overemphasized. It must be continued as a secure, inflation-proof income source. Since pension coverage reaches only a minority of those aged 65 and older, public policy should focus on ways to enhance pension coverage, such as through greater portability or a universal pension instrument that would be attractive to smaller employers. And since asset income, while more common than pensions, is very small on average, public policies to encourage greater savings may also be in order. Endnotes 1 Income and earnings data for calendar years 1998 and 1999 are converted to 2000 dollars using the Consumer Price Index. 2 These calculations are means and include zero values when no income is derived from an income source. All other income sources than those shown in Figure 1 contribute on average only $340 to a woman's and $500 to a man's total annual personal income. 3 The March CPS provides information on the receipt of general retirement income (other than ) that includes income from company or union pension plans, government pensions, regular payments from IRA or Keogh accounts, and regular payments from annuities or paid insurance policies. For our analysis, veterans pensions and survivors pensions are also included as part of general pension income. 7 For men years of age, their average earnings are slightly higher than average benefits from, even though fewer than one-third of men in this age group have income from earnings. Their average earnings are relatively high because of a few people who have extremely high earnings, while earnings for most retirees tend to be rather small (if they work at all). For example, about three-quarters of men in this age group have either no earnings or annual earnings of less than $10,000, whereas about one percent have annual earnings ranging from $155,000 to over $500,000. Excluding the men with the top one percent of earnings brings down the average earnings for all men aged into $7, Among people 65 and older who are unmarried, nearly 80 percent of women and 56 percent of men are widows or widowers. 4 These median amounts are calculated only among those who received income from each of the sources; zero values are excluded. If zero values were included, the median amounts from pensions and earnings would equal zero, since fewer than half of women or men aged 65 and older have income from either pensions or earnings. 5 Some decreases in pensions and earnings at older ages may be due to generational differences in varying labor market experiences and wage profiles ("cohort" effects), while some decreases may reflect an "age" effect that occurs more or less uniformly for different generations as they age over the life course The poverty rate among unmarried people living with others tends to be lower than the rate among unmarried people living alone, partly because poverty rates are calculated using family incomes rather than individual incomes and often other family members have higher incomes that lift the family above poverty. The data are from "Older Population of the United States: Male and Female Population Estimates/ Projections and Sex Ratio " compiled by the Administration on Aging using Census Bureau estimates and projections. available at 6 The increase in benefits for women at older ages is partly due to a greater proportion of widows (61 percent of women 75 and older versus 31 percent of women aged 65-74) who are likely to receive survivor benefits that equal their spouses' full benefits. Institute for Women s Policy Research 7

8 References Hartmann, Heidi and Catherine Hill with Lisa Witter Strengthening for Women. Washington, DC: Institute for Women's Policy Research and the National Council of Women's Organizations' Task Force on Women and. Rix, Sara and John B. Williamson Reform: How Might Women Fare? Issue Brief No. 31. Washington, DC: Public Policy Institute, AARP. Shaw, Lois, Diana Zuckerman, and Heidi Hartmann The Impact of Reform on Women. Washington, DC: Institute for This Briefing Paper was written by Heidi Hartmann and Sunhwa Lee, based on research undertaken for the report Gender and Economic in Retirement by Sunhwa Lee and Lois Shaw. The research was funded by the Retirement Research Foundation, the Open Society Institute, and the AARP. JOIN THE INSTITUTE FOR WOMEN S POLICY RESEARCH Help Make a Difference in the Lives of Women and their Families Member Benefits (vary according to membership level) wall Major Reports wquarterly Newsletter wresearch News Reporter (RNR) wbiennial Conference Discounts wpublication Discounts wiwpr Information Network wfact Sheets wresearch-in-briefs Membership Levels wgraduate Student: $35 wfriend: $60 wsustainer: $175 wpartner: $250 waffiliate: $350+ wcorporate Affiliate: $1,000++ Eleanor Roosevelt Policy Council (Members receive all membership benefits and invitations to special IWPR events.) wcommunity Council: $500-$999 winstitute Council: $1,000-$2,499 wleadership Council: $2,500- $4,999 wpresident s Council: $5000 and up + $200 for non-profits with an operating budget under $500, $500 for corporations with revenues under $1 million. The Institute for Women's Policy Research (IWPR) is a scientific research organization dedicated to informing and stimulating debate on public policy issues of critical importance to women and their families. IWPR focuses on issues of poverty and welfare, employment and earnings, work and family issues, the economic and social aspects of health care and safety, and women's civic and political participation. The Institute works with policymakers, scholars, and public interest groups to design, execute, and disseminate research and to build a network of individuals and organizations that conduct and use women-oriented policy research. IWPR, an independent, nonprofit organization, also works in affiliation with the graduate programs in public policy and women's studies at The George Washington University. IWPR's work is supported by foundation grants, government grants and contracts, donations from individuals, and contributions from organizations and corporations. IWPR is a 501(c)(3) tax exempt organization. INSTITUTE FOR WOMEN S POLICY RESEARCH W 1707 L STREET NW W SUITE 750 W WASHINGTON, DC W (202)

Social Security: Vital to Retirement Security for 35 Million Women and Men
 IWPR Publication #D487 March 2010 Social Security: Vital to Retirement Security for 35 Million Women and Men Jeff Hayes, Heidi Hartmann, and Sunhwa Lee This Briefing Paper examines major sources of income
How Equal Pay for Working Women would Reduce Poverty and Grow the American Economy*
 IWPR #C411 January 2014 How Equal Pay for Working Women would Reduce Poverty and Grow the American Economy* Heidi Hartmann, Ph.D., Jeffrey Hayes, Ph.D., and Jennifer Clark Persistent earnings inequality
The Gender Wage Gap by Occupation 2015
 IWPR #C440 April 2016 The Gender Wage Gap by Occupation 2015 and by Race and Ethnicity Women s median are lower than men s in nearly all s, whether they work in s predominantly done by women, s predominantly
The Gender Wage Gap by Occupation 2014
 IWPR # C431 April 2015 The Gender Wage Gap by Occupation 2014 and by Race and Ethnicity Women s are lower than men s in nearly all s, whether they work in s predominantly done by women, s predominantly
Women and Men in the Recovery: Where the Jobs Are Women Recover Jobs Lost in Recession in Year Five
 IWPR #C426 November 2014 Women and Men in the Recovery: Where the Jobs Are Women Recover Jobs Lost in Recession in Year Five Heidi Hartmann, Ph.D., Elyse Shaw, and Rachel O Connor Overview While the number
On average, young retirees are not
 How Financially Secure Are Young Retirees and Older Workers? FIGURE 1 Financial Status of People Age 51 to 59, by Work Status THOUSS OF DOLLARS 14 1 8 6 $82 RETIREES WORKERS $99 4 $41 $24 MEDIAN MEDIAN
Retirement Readiness in New York City: Trends in Plan Sponsorship, Participation and Income Security
 Retirement Readiness in New York City: Trends in Plan Sponsorship, Participation and Income Security Figures and Tables by the Schwartz Center for Economic Policy Analysis (SCEPA) Joelle Saad Lessler,
Women and Men in the Recovery: Where the Jobs Are Women s Recovery Strengthens in Year Four
 IWPR #C408 November 2013 Women and Men in the Recovery: Where the Jobs Are Women s Recovery Strengthens in Year Four Heidi Hartmann, Ph.D., Elyse Shaw, and Elizabeth Pandya Overview While the number of
Adult children provide the majority of care
 Caregiving Helping the elderly with activity limitations Number 7 May 2000 NATIONAL ACADEMY ON AN AGING SOCIETY Two of five people over age 70 need help with one or more daily activities. Yet many do not
Working Beyond Retirement-Age
 Working Beyond Retirement-Age Kelly A. Holder and Sandra L. Clark U.S. Census Bureau Housing and Household Economics Division Labor Force Statistics Branch Presented at the American Sociological Association
Health Coverage among 50- to 64-Year-Olds
 Health Coverage among 50- to 64-Year-Olds In 2005, more than 51 million Americans were age 50 64. This number is projected to rise to 58 million in 2010, when the first baby boomers turn 64. The aging
SOCIETY OF ACTUARIES THE AMERICAN ACADEMY OF ACTUARIES RETIREMENT PLAN PREFERENCES SURVEY REPORT OF FINDINGS. January 2004
 SOCIETY OF ACTUARIES THE AMERICAN ACADEMY OF ACTUARIES RETIREMENT PLAN PREFERENCES SURVEY REPORT OF FINDINGS January 2004 Mathew Greenwald & Associates, Inc. TABLE OF CONTENTS INTRODUCTION... 1 SETTING
ICI RESEARCH PERSPECTIVE
 ICI RESEARCH PERSPECTIVE 0 H STREET, NW, SUITE 00 WASHINGTON, DC 000 0-6-800 WWW.ICI.ORG OCTOBER 0 VOL. 0, NO. 7 WHAT S INSIDE Introduction Decline in the Share of Workers Covered by Private-Sector DB
Wealth and Demographics: Demographics by Wealth and Wealth by Demographics using the Survey of Consumer Finances. *** DRAFT March 11, 2013 ***
 Wealth and Demographics: Demographics by Wealth and Wealth by Demographics using the Survey of Consumer Finances *** DRAFT March 11, 2013 *** Jeff Thompson* Economist Microeconomic Surveys Federal Reserve
A Sloan Work & Family Research Network Fact Sheet
 Questions and Answers about GENERATION X/GENERATION Y: Y A Sloan Work & Family Research Network Fact Sheet Introduction The Sloan Work and Family Research Network has prepared Fact Sheets that provide
Social Security and Financial Planning
 Social Security and Financial Planning William Arnone Chair, Board of Directors National Academy of Social Insurance June, 2015 What Role Does Social Security Play in Financial Planning? 2 It s more than
Making Jobs Good. John Schmitt and Janelle Jones. April 2013
 Making Jobs Good John Schmitt and Janelle Jones April 2013 Center for Economic and Policy Research 1611 Connecticut Avenue, NW, Suite 400 Washington, D.C. 20009 202-293-5380 www.cepr.net CEPR Making Jobs
College Students with Children are Common and Face Many Challenges in Completing Higher Education
 IWPR# C404 March 2013 College Students with Children are Common and Face Many Challenges in Completing Higher Education Summary Nearly 25 percent of college students in the U.S., or four million students,
The Gender Wage Gap by Occupation
 IWPR #C350a Updated April 2012 The Gender Wage Gap by Occupation Women s are lower than men s in nearly all s, whether they work in s predominantly done by women, s predominantly done by men, or s with
on a daily basis. On the whole, however, those with heart disease are more limited in their activities, including work.
 Heart Disease A disabling yet preventable condition Number 3 January 2 NATIONAL ACADEMY ON AN AGING SOCIETY Almost 18 million people 7 percent of all Americans have heart disease. More than half of the
What Individuals Should Plan For Retirement Risk Management
 6 May 2004 What Individuals Should Plan For Retirement Risk Management Anna Rappaport, F.S.A. Chicago, IL Retirement World Today - Context Many people choose to retire and are happy in retirement Decline
For individuals who have a
 The Return on Investment for Delaying Social Security Beyond Age 62 by Clarence C., Ph.D. Clarence C., Ph.D., is a professor of finance and the director of the Center for Financial Education in the College
POVERTY & AGING IN AMERICA Profiles of the Low-Income Older Population
 POVERTY & AGING IN AMERICA Profiles of the Low-Income Older Population 2008 Mission Statement: The AARP Foundation is AARP's charitable organization dedicated to enhancing the quality of life for all as
Health Insurance Data Brief # 4
 cepr Center for Economic and Policy Research Health Insurance Data Brief # 4 Access to Employer-Provided Health Insurance as a Dependent on a Family Member s Plan By Heather Boushey and Joseph Wright 1
Family structure, childbearing, and parental employment: Implications for the level and trend in poverty
 Family structure, childbearing, and parental employment: Implications for the level and trend in poverty Maria Cancian and Deborah Reed Maria Cancian is Professor of Public Affairs and Social Work at the
Council on Children & Families. Sources of Income Among New York s 50 Plus Population
 Council on Children & Families A Research Brief on the Status of Adults 50 Years & Older in New York State Eliot Spitzer Governor Deborah Benson Acting Chief Executive Officer Among New York s 50 Plus
A Woman s Guide to Retirement Income Planning
 securing your retirement A Woman s Guide to Retirement Income Planning CAC.5067 (04.13) TODAY is the day I have been waiting for. You ve been working for this your entire life. The day that you can kick
When Will the Gender Gap in. Retirement Income Narrow?
 When Will the Gender Gap in Retirement Income Narrow? August 2003 Abstract Among recent retirees, women receive substantially less retirement income from Social Security and private pensions than men.
DOCUMEMT RESUME CE 002 150
 ED 096 517 DOCUMEMT RESUME CE 002 150 TITLE Marital and Family Characteristics of Workers, March 1973. INSTITUTICN Bureau of Labor Statistics (DOL), Washington, D.C. PUB DATE Aug 73 NOTE 6p. EDRS PRICE
Health Insurance Coverage, Poverty, and Income of Veterans: 2000 to 2009
 Health Insurance Coverage, Poverty, and Income of Veterans: 2 to 29 February 211 NCVAS National Center for Veterans Analysis and Statistics Data Source and Methods Data for this analysis come from years
Issue Brief. A Look at Working-Age Caregivers Roles, Health Concerns, and Need for Support
 AUGUST 2005 Issue Brief A Look at Working-Age Caregivers Roles, Health Concerns, and Need for Support Alice Ho, Sara R. Collins, Karen Davis, and Michelle M. Doty For more information about this study,
by Barbara A. Butrica, Karen E. Smith, and Howard M. Iams* Introduction
 This Is Not Your Parents Retirement: Comparing Retirement Income Across Generations by Barbara A. Butrica, Karen E. Smith, and Howard M. Iams* This article examines how retirement income at age 67 is likely
Workforce Training Results Report December 2008
 Report December 2008 Community and Technical Colleges (CTC) Job Preparatory Training Washington s 34 community and technical colleges offer job preparatory training that provides students with skills required
Is widowhood out of date in the 21st Century?
 The Year 2000 International Research Conference on Social Security Helsinki, 25-27 September 2000 Social security in the global village Is widowhood out of date in the 21st Century? Linda ROSENMAN The
Custodial Mothers and Fathers and Their Child Support: 2011
 Custodial Mothers and Fathers and Their Child Support: 2011 Current Population Reports By Timothy Grall Issued October 2013 P60-246 IntroductIon This report focuses on the child support income that custodial
Campus Child Care Declining Even As Growing Numbers of Parents Attend College
 IWPR # C425 November 2014 Campus Child Care Declining Even As Growing Numbers of Parents Attend College Affordable, reliable child care is a crucial support for the 4.8 million college students raising
Research perspective. A Look at Private-Sector Retirement Plan Income After ERISA. Key Findings
 Research perspective 1401 H Street, NW, Suite 1200 Washington, DC 20005 202/326-5800 www.ici.org November 2010 Vol. 16, No. 2 A Look at Private-Sector Retirement Plan Income After ERISA Key Findings Retirement
Retirement Annuity and Employment-Based Pension Income, Among Individuals Age 50 and Over: 2006, p. 2
 NOTES January 2008, Vol. 29, No. 1 Retirement Annuity and Employment-Based Pension Income, Among Individuals Age 50 and Over: 2006, p. 2 Finances of Employee Benefits, 1950 2006, p. 7 New Publications
PROFILE OF THE SINGAPORE CHINESE DIALECT GROUPS
 PROFILE OF THE SINGAPORE CHINESE DIALECT GROUPS by Edmond Lee Eu Fah Social Statistics Section Singapore Department of Statistics INTRODUCTION The Singapore society is made up of different ethnic groups
First Impressions: Comparing State Paid Family Leave Programs in Their First Years
 First Impressions: Comparing State Paid Family Leave Programs in Their First Years ISSUE BRIEF Rhode Island s First Year of Paid Leave in Perspective FEBRUARY 2015 Family caregiving is a major challenge
Older Americans in Poverty: A Snapshot Ellen O Brien, Ke Bin Wu and David Baer AARP Public Policy Institute
 Older Americans in Poverty: A Snapshot Ellen O Brien, Ke Bin Wu and David Baer AARP Public Policy Institute This report was prepared under the direction of Janet McCubbin. AARP s Public Policy Institute
Patient Responsibility in Health Care: An AARP Bulletin Survey
 Patient Responsibility in Health Care: An AARP Bulletin Survey May 2011 Patient Responsibility in Health Care: An AARP Bulletin Survey Data Collected by SSRS Report Prepared by Teresa A. Keenan, Ph.D.
The Status of Women in Guilford County, North Carolina
 IWPR # R363 November 2012 The Status of Women in Guilford County, North Carolina Women in Guilford County, and in North Carolina as a whole, have made significant progress in the last few decades. The
Population Aging in Developed Countries: Emerging Trends and Dynamics Wan He, Ph.D. Population Division U.S. Census Bureau
 Population Aging in Developed Countries: Emerging Trends and Dynamics Wan He, Ph.D. Population Division U.S. Census Bureau This presentation is released to inform interested parties of population aging
Statistical Profile of Unmarried Women: Virginia 1
 1 I. Population, 18 years and older, 2014 2 Total: 5.888 million Men: 2.842 million (48.3% of total) 3.046 million (51.7% of total) Married women: 3 1.646 million (28.0% of total; 54.0% of women) Unmarried
Statistical Profile of Unmarried Women: North Carolina 1
 1 I. Population, 18 years and older, 2014 2 Total: 6.857 million Men: 3.204 million (46.7% of total) 3.654 million (53.3% of total) Married women: 3 1.850 million (27.0% of total; 50.6% of women) Unmarried
NOTES. Executive Summary: March 2006, Vol. 27, No. 3
 NOTES Retirement Plans and Retirement Confidence in Higher Education, p. 2 Retirement Annuity and Employment-Based Pension Income Among Individuals Ages 50 and Over, p. 6 Executive Summary: March 2006,
Florida s Families and Children Below the Federal Poverty Level
 Florida s Families and Children Below the Federal Poverty Level Florida Senate Committee on Children, Families, and Elder Affairs Presented by: February 17, 2016 The Florida Legislature Office of Economic
I. HEALTH ASSESSMENT B. SOCIOECONOMIC CHARACTERISTICS
 I. B. SOCIOECONOMIC CHARACTERISTICS 1. HOW FINANCIALLY SECURE ARE RESIDENTS OF DELAWARE? Delaware residents median household incomes are lower than comparison communities but higher than national norms.
HOUSINGSPOTLIGHT FEDERALLY ASSISTED HOUSING? Characteristics of Households Assisted by HUD programs. Our findings affirm that
 HOUSINGSPOTLIGHT National Low Income Housing Coalition Volume 2, Issue 2 November 2012 WHO LIVES in FEDERALLY ASSISTED HOUSING? Characteristics of Households Assisted by HUD programs Approximately 4.8
THE IMPACT OF INEQUALITY FOR SAME SEX PARTNERS IN EMPLOYER SPONSORED RETIREMENT PLANS. Naomi G. Goldberg The Williams Institute, UCLA
 THE IMPACT OF INEQUALITY FOR SAME SEX PARTNERS IN EMPLOYER SPONSORED RETIREMENT PLANS Naomi G. Goldberg The Williams Institute, UCLA October 2009 Acknowledgements This report was made possible through
SOCIAL SECURITY S REAL RETIREMENT AGE IS 70
 October 2013, Number 13-15 RETIREMENT RESEARCH SOCIAL SECURITY S REAL RETIREMENT AGE IS 70 By Alicia H. Munnell* Introduction Social Security was designed to replace income once people could no longer
Social Security Retirement Parman R. Green, MU Extension Ag Business Mgmt. Specialist
 Social Security Retirement Parman R. Green, MU Extension Ag Business Mgmt. Specialist Farmers and many other self-employed business owners who report income on the cash-basis have a tremendous amount of
The Impact of Cutting Social Security Cost of Living Adjustments on the Living Standards of the Elderly
 The Impact of Cutting Social Security Cost of Living Adjustments on the Living Standards of the Elderly Dean Baker and David Rosnick September 2011 Center for Economic and Policy Research 1611 Connecticut
An update on the level and distribution of retirement savings
 ASFA Research and Resource Centre An update on the level and distribution of retirement savings Ross Clare Director of Research March 2014 The Association of Superannuation Funds of Australia Limited (ASFA)
401(k) PARTICIPANTS AWARENESS AND UNDERSTANDING OF FEES
 PARTICIPANTS AWARENESS AND UNDERSTANDING OF FEES") 401(k) PARTICIPANTS AWARENESS AND UNDERSTANDING OF FEES February 2011 401(k) PARTICIPANTS AWARENESS AND UNDERSTANDING OF FEES February 2011 Copyright 2011 AARP Research & Strategic Analysis 601 E Street,
401(k) PARTICIPANTS AWARENESS AND UNDERSTANDING OF FEES February 2011 401(k) PARTICIPANTS AWARENESS AND UNDERSTANDING OF FEES February 2011 Copyright 2011 AARP Research & Strategic Analysis 601 E Street,
Women, Wages and Work A report prepared by the UNC Charlotte Urban Institute for the Women s Summit April 11, 2011
 A report prepared by the UNC Charlotte Urban Institute for the Women s Summit April 11, 2011 A report prepared for the Women s Summit by the UNC Charlotte Urban Institute 1 Table of Contents Table of Contents...
Financially Vulnerable Small Businesses and their Retirement Assets
 Financially Vulnerable Small Businesses and their Retirement Assets This study examines the retirement assets held by small business owners, who own and manage the business and have fewer than 500 employees,
Demographic Analysis of the Salt River Pima-Maricopa Indian Community Using 2010 Census and 2010 American Community Survey Estimates
 Demographic Analysis of the Salt River Pima-Maricopa Indian Community Using 2010 Census and 2010 American Community Survey Estimates Completed for: Grants & Contract Office The Salt River Pima-Maricopa
The Economic Impact of the Senior Population on a State s Economy: The Case of North Dakota
 The Economic Impact of the Senior Population on a State s Economy: The Case of North Dakota RICHARD RATHGE January 2007 NORTH DAKOTA STATE DATA CENTER North Dakota State University, an Equal Opportunity
The Impact on Inequality of Raising the Social Security Retirement Age
 The Impact on Inequality of Raising the Social Security Retirement Age David Rosnick and Dean Baker April 2012 Center for Economic and Policy Research 1611 Connecticut Avenue, NW, Suite 400 Washington,
THE DEMOGRAPHY OF POPULATION AGEING
 THE DEMOGRAPHY OF POPULATION AGEING Barry Mirkin and Mary Beth Weinberger* An inevitable consequence of the demographic transition and the shift to lower fertility and mortality has been the evolution
WHAT MOVES THE NATIONAL RETIREMENT RISK INDEX? A LOOK BACK AND AN UPDATE
 January 2007, Number 2007-1 WHAT MOVES THE NATIONAL RETIREMENT RISK INDEX? A LOOK BACK AND AN UPDATE By Alicia H. Munnell, Francesca Golub-Sass, and Anthony Webb* Introduction In June 2006, the released
Social Security 75 th Anniversary Survey Report: Public Opinion Trends
 Social Security 75 th Anniversary Survey Report: Public Opinion Trends Copyright 2010 AARP Research & Strategic Analysis 601 E Street, NW Washington, DC 20049 Reprinting with Permission AARP is a nonprofit,
Statistical Profile of Unmarried Women: New York 1
 1 I. Population, 18 years and older, 2014 2 Total: 13.611 million Men: 6.460 million (47.5% of total) 7.150 million (52.5% of total) Married women: 3 3.237 million (23.8% of total; 45.3% of women) Unmarried
Remarriage in the United States
 Remarriage in the United States Poster presented at the annual meeting of the American Sociological Association, Montreal, August 10-14, 2006 Rose M. Kreider U.S. Census Bureau rose.kreider@census.gov
Statistical Profile of Unmarried Women: Texas 1
 1 I. Population, 18 years and older, 2014 2 Total: 16.844 million Men: 8.076 million (47.9% of total) 8.767 million (52.1% of total) Married women: 3 4.443 million (26.4% of total; 50.7% of women) Unmarried
It is important to understand child poverty as multidimensional. Income poverty in South Africa. Annie Leatt (Children s Institute)
") Income poverty in South Africa Annie Leatt (Children s Institute) It is important to understand child poverty as multidimensional and more than just a lack of income. Nevertheless, this essay specifically
Income poverty in South Africa Annie Leatt (Children s Institute) It is important to understand child poverty as multidimensional and more than just a lack of income. Nevertheless, this essay specifically
INVESTING IN YOURSELF
 Investment Planning INVESTING IN YOURSELF Women are different from men. So are your financial planning needs. 2 INVESTING IN YOURSELF WOMEN & MONEY There are many reasons why you might require a different
16. Individual Retirement Accounts
 16. Individual Retirement Accounts Introduction Through enactment of the Employee Retirement Income Security Act of 1974 (ERISA), Congress established individual retirement accounts (IRAs) to provide workers
2013 Survey of Owners of Individual Annuity Contracts
 2013 Survey of Owners of Individual Annuity Contracts Conducted by The Gallup Organization and Mathew Greenwald & Associates for The Committee of Annuity Insurers 2013 SURVEY OF OWNERS OF INDIVIDUAL ANNUITY
Aging in Asia and Oceania AARP Multinational Survey of Opinion Leaders 2006
 Aging in Asia and Oceania AARP Multinational Survey of Opinion Leaders 200 Report March 2007 Prepared by Princeton Survey Research Associates International for Aging in Asia and Oceania AARP Multinational
Article: Main results from the Wealth and Assets Survey: July 2012 to June 2014
 Article: Main results from the Wealth and Assets Survey: July 2012 to June 2014 Coverage: GB Date: 18 December 2015 Geographical Area: Region Theme: Economy Main points In July 2012 to June 2014: aggregate
WILL WE HAVE TO WORK FOREVER?
 Work Opportunities for Older Americans Series 4, July 2006 WILL WE HAVE TO WORK FOREVER? By Alicia H. Munnell, Marric Buessing, Mauricio Soto, and Steven Sass* Introduction Today, the average retirement
Whose Security? What Social Security Means to Children and Families. Nancy K. Cauthen. February 2005
 Whose Security? What Social Security Means to Children and Families Nancy K. Cauthen February 2005 215 West 125th Street, 3rd floor New York, NY 10027 TEL 646-284-9600 FAX 646-284-9623 www.nccp.org The
Statistical Profile of Unmarried Women: Florida 1
 1 I. Population, 18 years and older, 2014 2 Total: 13.879 million Men: 6.551 million (47.2% of total) 7.327 million (52.8% of total) Married women: 3 3.689 million (26.6% of total; 50.4% of women) Unmarried
National Insurance Fund - Long-term Financial Estimates
 Social Security Administration Act 1992 National Insurance Fund - Long-term Financial Estimates Report by the Government Actuary on the Quinquennial Review for the period ending 5 April 1995 under Section
Statistical Profile of Unmarried Women: Colorado 1
 1 I. Population, 18 years and older, 2014 2 Total: 3.732 million Men: 1.849 million (49.5% of total) 1.883 million (50.5% of total) Married women: 3 1.053 million (28.2% of total; 55.9% of women) Unmarried
The Future of Social Security: 12 Proposals You Should Know About
 The Future of Social Security: 12 Proposals You Should Know About Strengthening Social Security AARP s You ve Earned a Say is working to make your voice heard about the future of Social Security. For more
Caregivers of Younger Adults: A Focused Look at Those Caring for Someone Age 18 to 49
 Photo used with Permission: Muscular Dystrophy Association Caregivers of Younger Adults: A Focused Look at Those Caring for Someone Age 18 to 49 National Alliance for Caregiving in collaboration with AARP
Old-Age and Survivors Insurance: Insured Workers and Their Representation in Claims
 Old-Age and Survivors Insurance: Insured Workers and Their Representation in Claims By George E. Immerwahr and Harry Mehlman* ALMOST 4 million persons are estimated to have been insured under Federal old-age
BENEFITS APPLICABLE TO PENSIONERS
 1 of 6 BENEFITS APPLICABLE TO PENSIONERS (Where reference is made in this document to the male gender, the female is included) 1. SPOUSE S INSURANCE SCHEME The Spouse s Insurance Scheme provides life insurance
How Wakefield Council is working to make sure everyone is treated fairly
 How Wakefield Council is working to make sure everyone is treated fairly As part of meeting the Public Sector Equality Duty, the Council is required to publish information on how it is working to treat
National Life Tables, United Kingdom: 2012 2014
 Statistical bulletin National Life Tables, United Kingdom: 2012 2014 Trends for the UK and constituent countries in the average number of years people will live beyond their current age measured by "period
Contents. Introduction 1 Key Findings 1. 1. Canada s Changing Retirement Landscape 2. 2. Retirement Expectations and Aspirations 4
 Contents Introduction 1 Key Findings 1 1. Canada s Changing Retirement Landscape 2 2. Retirement Expectations and Aspirations 4 3. Retirement Saving and Planning 7 4. The Retirement Savings Habit 9 Recommendations
Lago di Como, February 2006
 1 and Martin J Prince 1 1 Institute of Psychiatry, London Lago di Como, February 2006 1 Background to depression and 2 Study methods and measures 3 What does it all mean? 4 What does it all mean? Why was
Findings. Who Buys Long-Term Care Insurance in 2010 2011?
 Findings Who Buys Long-Term Care Insurance in 2010 2011? America s Health Insurance Plans Who Buys Long-Term Care Insurance in 2010-2011? is a twenty year study of the long-term care insurance marketplace
MORE MIDDLE CLASS WORKERS WILL BE POOR RETIREES
 JUN 15 1 MORE MIDDLE CLASS WORKERS WILL BE POOR RETIREES by Teresa Ghilarducci, Bernard L. and Irene Schwartz Economics Professor at The New School for Social Research and Director of the Schwartz Center
YOUR PENSION RIGHTS AT DIVORCE
 YOUR PENSION RIGHTS AT DIVORCE What Women Need to Know Third Edition Anne E. Moss PENSION RIGHTS CENTER Your Pension Rights at Divorce (Third Edition) Copyright 1991, 1995, 2006 by the Pension Rights Center.
HOW MUCH SHOULD PEOPLE SAVE?
 July 2014, Number 14-11 RETIREMENT RESEARCH HOW MUCH SHOULD PEOPLE SAVE? By Alicia H. Munnell, Anthony Webb, and Wenliang Hou* Introduction The National Retirement Risk Index (NRRI) shows that half of
The Elderly in Africa: Issues and Policy Options. K. Subbarao
 The Elderly in Africa: Issues and Policy Options K. Subbarao The scene prior to 1990s The elderly were part of the extended family and as such enjoyed care and protection. The informal old age support
Child Care in State Economies
 This report was produced by RegionTrack, Inc., an economic research firm, and commissioned by the Committee for Economic Development with funding from the Alliance for Early Success. It provides a broad
SalarieS of chemists fall
 ACS news SalarieS of chemists fall Unemployment reaches new heights in 2009 as recession hits profession hard The economic recession has taken its toll on chemists. Despite holding up fairly well in previous
T H E P U B L I C P E N S I O N P R O J E C T. Can California Teacher Pensions Be Distributed More Fairly?
 T H E P U B L I C P E N S I O N P R O J E C T RESEARCH REPORT Can California Teacher Pensions Be Distributed More Fairly? Richard W. Johnson Benjamin G. Southgate December 2014 ABOUT THE URBAN INSTITUTE
It s Time to Save for Retirement. The Benefit of Saving Early and the Cost of Delay
 It s Time to Save for Retirement The Benefit of Saving Early and the Cost of Delay November 2014 About the Insured Retirement Institute: The Insured Retirement Institute (IRI) is the leading association
R e a l i t y C h e c k
 The New American Economy A Rising Tide that Lifts Only Yachts T he United States is the richest country on earth; the income of the average American household substantially exceeds that of the average
Americans Current Views on Smoking 2013: An AARP Bulletin Survey
 Americans Current Views on Smoking 2013: An AARP Bulletin Survey November 2013 Americans Current Views on Smoking 2013: An AARP Bulletin Survey Report Prepared by Al Hollenbeck, Ph.D. Copyright 2013 AARP
2014 Demographics PROFILE OF THE MILITARY COMMUNITY
 Demographics PROFILE OF THE MILITARY COMMUNITY ACKNOWLEDGEMENTS This report is published by the Office of the Deputy Assistant Secretary of Defense (Military Community and Family Policy), under contract
New York State Employment Trends
 New York State Employment Trends August 2015 Thomas P. DiNapoli New York State Comptroller Prepared by the Office of Budget and Policy Analysis Additional copies of this report may be obtained from: Office
PROFESSIONAL WOMEN: VITAL STATISTICS
 Fact Sheet 2010 PROFESSIONAL WOMEN: VITAL STATISTICS General Statistics The number of working women has risen from 5.1 million in 1900, to 18.4 million in 1950, 1 to 66.2 million in 2009. 2 The number