Plant Phenotyping in SPICY. Chris Glasbey Biomathematics and Statistics Scotland (BioSS)
|
|
|
- Solomon Hilary Watkins
- 7 years ago
- Views:
Transcription


1 Plant Phenotyping in SPICY Chris Glasbey Biomathematics and Statistics Scotland (BioSS)

2 Aim of SPICY: Develop tools to predict phenotypic response of a genotype under a range of environmental conditions This requires: Characterisation of a large number of genotypes by Manual measurements Automatic phenotyping tools

3 Measurements in phenotyping experiments Total fresh fruit yield (kg m -2 ) Total dry fruit yield (kg m -2 ) Fruit dry matter content (kg kg -1 ) Total dry matter (kg m -2 ) Fraction to the fruits (kg kg -1 ) LUE (g MJ -1 ) Fraction of light intercepted (MJ m -2 ) Sink strength of fruits No of fruits Photosynthetic rate (g m -2 s -1 ) LAI (m m -2 ) Potential fruit weight (g) Fruit growth duration (d) No of flowers Abortion rate No of internodes
 LAI (m m -2 ) Potential fruit weight (g) Fruit growth duration (d) No of flowers Abortion rate No of")
4 Plan of talk 1. Manual phenotyping 2. Phenotyping by fluorescence 3. Phenotyping by image analysis

5 1. Manual phenotyping Anja Dieleman, Wageningen UR Greenhouse Horticulture Juan José Magan, Estación Experimental de la Fundación Cajamar

6 Manual phenotyping Start of the experiment: Destructive harvest Leaf area DW leaves DW stem Stem length before 1 th branching No of internodes before 1 th branching

7 Weekly: No. of fruits on plants FW/DW harvested fruits 2-weekly: No. of internodes 4-weekly Stem length

8 Fruit growth duration Potential fruit weight

9 Final destructive harvest: DW leaves DW stem DW fruits No. of fruits Leaf area Stem length

10 Manual phenotyping Disadvantages: - Slow and expensive - Variation between observers - Sometimes destructive

11 2. Phenotyping by fluorescence Attila Barocsi & Sandor Lenk Budapest University of Technology and Economics

12 Principles of the technique N.R. Baker and E. Rosenqvist, Applications of chlorophyll fluorescence can improve crop production strategies: an examination of future possibilities, J Exp Botany, 55, (2004)


13 Principles of the technique Fluorescence response: to low dose F 0 : minimum, PSII open (dark adapted)


14 Principles of the technique Fluorescence response: to step illumination

, F m :")
15 Principles of the technique Fluorescence response: to transient pulses F m : max, PSII closed (dark adapted), F m : in light
, F")

16 Principles of the technique Fluorescence response: to far red excitation F 0 : PSI selectively opens

17 Fluorescence sensor developed: Short measurement cycle Portable 2 operating sensors per system Wireless data acquisition

18 Fq'/Fv' Fv'/Fm' Fq'/Fm' Fv' F0' Fq Fm' Fv/Fm Fv Fm F0 Results: Heritability of estimated parameters H 690nm H 730nm H PAM F Fm Fv Fv/Fm Fm' 60s s s Fq 60s s s F0' 60s s s Fv' 60s s s Fq'/Fm' 60s s s Fv'/Fm' 60s s s Fq'/Fv' 60s s s NPQ 60s High heritabilities at short times faster measurements

19 3. Phenotyping by image analysis Chris Glasbey, Graham Horgan, Yu Song Biomathematics and Statistics Scotland (BioSS) Gerie van der Heijden, Gerrit Polder Biometris, Wageningen UR
 Gerie van der Heijden, Gerrit Polder")
20 Phenotyping by Image Analysis Scanalyzer 3D, LemnaTec Sorting Anthurium cuttings, Wageningen UR Most image analysis systems for automatic phenotyping bring the plants to the camera.

21 Commercial tomato plants in Almeria, Spain Pepper plants in our experiments But for some crops, like pepper and tomato, this is not feasible bring the cameras to the plants!
22 SPYSEE equipment


23 SPYSEE 4* IR, Colour, Range (ToF) cameras
24 We aim to : Replace manual by automatic measurements Find new features, which are not possible or too difficult for manual measurement Two approaches: A. 3D B. Statistical
25 A. 3D approach 3D information can be recovered from stereo pairs, because Depth = constant / disparity
26 Stereo pair + ToF range image detailed range image
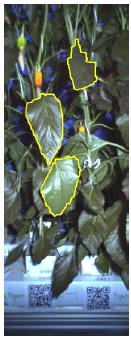

27 Foreground leaves
28 Leaf in 3D automatic measurement of size, orientation, etc
29 Individual leaf size (cm 2 ) Automatic Manual Validation trial (11 genotypes, 55 leaves): Correlation = 98% RMSE = 9.50cm 2
30 QTL analysis of automatically measured leaf sizes for 151 genotypes Leaf size had a heritability of 0.70, three QTLs were found, together explaining 29% of the variation.
31 Leaf orientation: Angle between the leaf and the vertical axis.
32 Leaf orientation: Angle between the leaf and the vertical axis.
33 QTL analysis of automatically measured leaf orientation for 151 genotypes Heritability was 0.56, and one QTL explained 11% of the total variation
34 B. Statistical approach Plant height estimated, from locations of green pixels
35 Correlation 93% between automatic and manual plant heights
36 Total leaf area is a measure of how much solar radiation the plant can intercept
37 Frequency Colour distribution Counts how many pixels in the image have each red intensity Intensity
38 Frequency Colour distribution Intensity
39 Frequency Colour histograms Another example Intensity
40 Principal component regression Call: lm(formula = sep.leafarea ~ pr1$x[, 1:6], na.action = na.exclude) Number crunching to link colour histograms to manually measured total leaf area Coefficients: Estimate Std. Error t value Pr(> t ) (Intercept) 4.899e e+01 Complex but standard <2e-16 methodology *** PC e e <2e-16 *** PC e e <2e-16 *** PC e e <2e-16 *** PC e e PC e e PC e e * --- Residual standard error: on 209 degrees of freedom (1334 observations deleted due to missingness) Multiple R-squared: , Adjusted R-squared: F-statistic: on 6 and 209 DF, p-value: < 2.2e-16
41 Predicted projecte leaf area Prediction vs manual Correlation 80% Total leaf area
42 Coefficient Regression coefficients Weight of each colour intensity count in predicting the leaf area index Intensity
43 Multivariate histograms Count the number of times each combination of the three colour components occurs Too many possibilities, so use bins of length 8 per component, leading to 16 3 = 4096 variables Again do Principal Components regression
44 Predicted projecte leaf area Multivariate histograms Correlation 83% Total leaf area
45 QTL analysis of automatically measured total leaf area for 151 genotypes The heritability of total leaf area was 0.55, and 20% of the variation was explained by QTLs 2 QTLs agree with 2 of 3 found from manual measurements
46 Work in progress: Automatically find fruits Measure plant development Image Fruit Probability
47 31 Aug 2 Sep 5 Sep 8 Sep 9 Sep
48 Summary Manual phenotyping is slow and expensive Two approaches to automatic phenotyping have been explored in SPICY: 1. Fluorescence 2. Image analysis Results are promising but more work is needed
Requirements and technology for smart materials in greenhouses
 Requirements and technology for smart materials in greenhouses Greenhouses in The Netherlands Workshop 13 April 2016, Bleiswijk Dr. Silke Hemming, Wageningen UR Greenhouse Horticulture About 10 000 Ha
HORTICOOP KENNIS EVENT GROENTEN
 HORTICOOP KENNIS EVENT GROENTEN 23 September 2015 Angelo Mencarelli What s happening Need for robotics?! Horticulture endorse robotics Huge robotic market (low cost) More frequent & automated monitoring
Basic Statistics and Data Analysis for Health Researchers from Foreign Countries
 Basic Statistics and Data Analysis for Health Researchers from Foreign Countries Volkert Siersma siersma@sund.ku.dk The Research Unit for General Practice in Copenhagen Dias 1 Content Quantifying association
Instrumentation for the Plant & Soil Sciences Short Form Catalog
 Instrumentation for the Plant & Soil Sciences Short Form Catalog www.ppsystems.com Trusted and tested technology CIRAS-2 Portable Photosynthesis System PLC6 (U) Automatic Universal Leaf Cuvette For High
Multiple Linear Regression
 Multiple Linear Regression A regression with two or more explanatory variables is called a multiple regression. Rather than modeling the mean response as a straight line, as in simple regression, it is
General. Requirements of Plastic Films for greenhouse application Latest Development in Research 1/22/2009. Requirements. General
 Requirements of Plastic Films for greenhouse application Latest Development in Research 6 th European Additives & Colors Conference, 11/12 March 29, Antwerpen Silke Hemming, Wageningen UR Greenhouse Horticulture
LED Research WUR Horticulture: Results & Bottlenecks. Tom Dueck, Wageningen UR Glastuinbouw 6 februari 2014
 LED Research WUR Horticulture: Results & Bottlenecks Tom Dueck, Wageningen UR Glastuinbouw 6 februari 2014 9960 ha horticulture in the Netherlands 3100 ha with artificial lighting Why LEDs in horticulture?
Light Interception and Plant Growth. Photo courtesy of B.A. Stewart
 Light Interception and Plant Growth Photo courtesy of B.A. Stewart Physiological Determinants of Crop Growth D.A. Charles-Edwards (Academic Press, 1982) The acquisition of knowledge of the potential yield
Introduction: Growth analysis and crop dry matter accumulation
 PBIO*3110 Crop Physiology Lecture #2 Fall Semester 2008 Lecture Notes for Tuesday 9 September How is plant productivity measured? Introduction: Growth analysis and crop dry matter accumulation Learning
Exchange Rate Regime Analysis for the Chinese Yuan
 Exchange Rate Regime Analysis for the Chinese Yuan Achim Zeileis Ajay Shah Ila Patnaik Abstract We investigate the Chinese exchange rate regime after China gave up on a fixed exchange rate to the US dollar
Lucky vs. Unlucky Teams in Sports
 Lucky vs. Unlucky Teams in Sports Introduction Assuming gambling odds give true probabilities, one can classify a team as having been lucky or unlucky so far. Do results of matches between lucky and unlucky
Statistical Models in R
 Statistical Models in R Some Examples Steven Buechler Department of Mathematics 276B Hurley Hall; 1-6233 Fall, 2007 Outline Statistical Models Linear Models in R Regression Regression analysis is the appropriate
EDUCATION AND VOCABULARY MULTIPLE REGRESSION IN ACTION
 EDUCATION AND VOCABULARY MULTIPLE REGRESSION IN ACTION EDUCATION AND VOCABULARY 5-10 hours of input weekly is enough to pick up a new language (Schiff & Myers, 1988). Dutch children spend 5.5 hours/day
Correlation and Simple Linear Regression
 Correlation and Simple Linear Regression We are often interested in studying the relationship among variables to determine whether they are associated with one another. When we think that changes in a
The Watergy greenhouse: Improved productivity and water use efficiency using a closed greenhouse
 The Watergy greenhouse: Improved productivity and water use efficiency using a closed greenhouse Guillermo Zaragoza PhD Physics Estación Experimental Fundación Cajamar (Almería - Spain) Closed greenhouses
5. Linear Regression
 5. Linear Regression Outline.................................................................... 2 Simple linear regression 3 Linear model............................................................. 4
AUTOMATED SOIL WATER TENSION-BASED DRIP IRRIGATION FOR PRECISE IRRIGATION SCHEDULING
 AUTOMATED SOIL WATER TENSION-BASED DRIP IRRIGATION FOR PRECISE IRRIGATION SCHEDULING Sabine Seidel sabine.seidel@tu-dresden.de Institute of Hydrology and Meteorology, Faculty of Environmental Sciences,
Logistic Regression (a type of Generalized Linear Model)
") Logistic Regression (a type of Generalized Linear Model) 1/36 Today Review of GLMs Logistic Regression 2/36 How do we find patterns in data? We begin with a model of how the world works We use our knowledge
Logistic Regression (a type of Generalized Linear Model) 1/36 Today Review of GLMs Logistic Regression 2/36 How do we find patterns in data? We begin with a model of how the world works We use our knowledge
ANOVA. February 12, 2015
 ANOVA February 12, 2015 1 ANOVA models Last time, we discussed the use of categorical variables in multivariate regression. Often, these are encoded as indicator columns in the design matrix. In [1]: %%R
We extended the additive model in two variables to the interaction model by adding a third term to the equation.
 Quadratic Models We extended the additive model in two variables to the interaction model by adding a third term to the equation. Similarly, we can extend the linear model in one variable to the quadratic
NCSS Statistical Software Principal Components Regression. In ordinary least squares, the regression coefficients are estimated using the formula ( )
") Chapter 340 Principal Components Regression Introduction is a technique for analyzing multiple regression data that suffer from multicollinearity. When multicollinearity occurs, least squares estimates
Chapter 340 Principal Components Regression Introduction is a technique for analyzing multiple regression data that suffer from multicollinearity. When multicollinearity occurs, least squares estimates
Comparing Nested Models
 Comparing Nested Models ST 430/514 Two models are nested if one model contains all the terms of the other, and at least one additional term. The larger model is the complete (or full) model, and the smaller
20-10-2015. DNA profiles in DUS testing of grasses. A new UPOV model? Lolium perenne (perennial ryegrass) Pilot study (2014)
 Pilot study (2014)") 2--25 DNA profiles in DUS testing of grasses A new UPOV model? Henk Bonthuis Naktuinbouw Aanvragersoverleg Rvp Wageningsche Berg 9 oktober 25 Lolium perenne (perennial ryegrass) Challenges Genetically
2--25 DNA profiles in DUS testing of grasses A new UPOV model? Henk Bonthuis Naktuinbouw Aanvragersoverleg Rvp Wageningsche Berg 9 oktober 25 Lolium perenne (perennial ryegrass) Challenges Genetically
Using R for Linear Regression
 Using R for Linear Regression In the following handout words and symbols in bold are R functions and words and symbols in italics are entries supplied by the user; underlined words and symbols are optional
CIRAS-2 Portable Photosynthesis System For Research
 CIRAS-2 Portable Photosynthesis System For Research www.ppsystems.com CIRAS-2 Portable Photosynthesis System Trusted and tested technology Measurement Ranges CO 2 0-2,000 μmol mol -1 (optimal) CO 2 0-9,999
Toward commercialization of robotic systems for high-value crops: state-of-theart review and challenges ahead
 Toward commercialization of robotic systems for high-value crops: state-of-theart review and challenges ahead Wouter Bac MSc 27 September 2012 Wageningen UR Greenhouse Horticulture Overview Introduction
MONITORING-PAM. Multi-Channel Chlorophyll Fluorometer. Long-Term Monitoring of Chlorophyll Fluorescence under Field Conditions
 Multi-Channel Chlorophyll Fluorometer Long-Term Monitoring of Chlorophyll Fluorescence under Field Conditions Multi-Channel Chlorophyll Fluorometer Measurements of chlorophyll fluorescence give easy and
Stat 5303 (Oehlert): Tukey One Degree of Freedom 1
: Tukey One Degree of Freedom 1") Stat 5303 (Oehlert): Tukey One Degree of Freedom 1 > catch
Stat 5303 (Oehlert): Tukey One Degree of Freedom 1 > catch
MIXED MODEL ANALYSIS USING R
 Research Methods Group MIXED MODEL ANALYSIS USING R Using Case Study 4 from the BIOMETRICS & RESEARCH METHODS TEACHING RESOURCE BY Stephen Mbunzi & Sonal Nagda www.ilri.org/rmg www.worldagroforestrycentre.org/rmg
Regression step-by-step using Microsoft Excel
 Step 1: Regression step-by-step using Microsoft Excel Notes prepared by Pamela Peterson Drake, James Madison University Type the data into the spreadsheet The example used throughout this How to is a regression
DEPARTMENT OF PSYCHOLOGY UNIVERSITY OF LANCASTER MSC IN PSYCHOLOGICAL RESEARCH METHODS ANALYSING AND INTERPRETING DATA 2 PART 1 WEEK 9
 DEPARTMENT OF PSYCHOLOGY UNIVERSITY OF LANCASTER MSC IN PSYCHOLOGICAL RESEARCH METHODS ANALYSING AND INTERPRETING DATA 2 PART 1 WEEK 9 Analysis of covariance and multiple regression So far in this course,
Collaborative research project pre agro
 Collaborative research project pre agro Extraction of phenology-dependent structural information from hyperspectral, directional CHRIS data for a better derivation of canopy parameters of winter-wheat
Elementary Statistics Sample Exam #3
 Elementary Statistics Sample Exam #3 Instructions. No books or telephones. Only the supplied calculators are allowed. The exam is worth 100 points. 1. A chi square goodness of fit test is considered to
n + n log(2π) + n log(rss/n)
 + n log(rss/n)") There is a discrepancy in R output from the functions step, AIC, and BIC over how to compute the AIC. The discrepancy is not very important, because it involves a difference of a constant factor that cancels
There is a discrepancy in R output from the functions step, AIC, and BIC over how to compute the AIC. The discrepancy is not very important, because it involves a difference of a constant factor that cancels
Light in the Greenhouse: How Much is Enough?
 Light in the Greenhouse: How Much is Enough? by: James W. Brown http://www.cropking.com/articlelghe Most of us know that green plants need light for photosynthesis, growth, and development. As important
Not Your Dad s Magic Eight Ball
 Not Your Dad s Magic Eight Ball Prepared for the NCSL Fiscal Analysts Seminar, October 21, 2014 Jim Landers, Office of Fiscal and Management Analysis, Indiana Legislative Services Agency Actual Forecast
Psychology 205: Research Methods in Psychology
 Psychology 205: Research Methods in Psychology Using R to analyze the data for study 2 Department of Psychology Northwestern University Evanston, Illinois USA November, 2012 1 / 38 Outline 1 Getting ready
Summer School Greenhouse Horticulture
 Programme Summer School Greenhouse Horticulture Campus Wageningen UR Course leader: Dr Cecilia Stanghellini Date: 24 August 4 September 2015 Lecturers Chris Blok MSc, rooting media and water quality, Wageningen
E(y i ) = x T i β. yield of the refined product as a percentage of crude specific gravity vapour pressure ASTM 10% point ASTM end point in degrees F
 = x T i β. yield of the refined product as a percentage of crude specific gravity vapour pressure ASTM 10% point ASTM end point in degrees F") Random and Mixed Effects Models (Ch. 10) Random effects models are very useful when the observations are sampled in a highly structured way. The basic idea is that the error associated with any linear,
Random and Mixed Effects Models (Ch. 10) Random effects models are very useful when the observations are sampled in a highly structured way. The basic idea is that the error associated with any linear,
Week 5: Multiple Linear Regression
 BUS41100 Applied Regression Analysis Week 5: Multiple Linear Regression Parameter estimation and inference, forecasting, diagnostics, dummy variables Robert B. Gramacy The University of Chicago Booth School
Photosynthesis Light for Horticulture
 Photosynthesis Light for Horticulture Horticulture Lamps Lighting for growth Lamps and lighting for horticulture Properly balanced Improves Specially developed More PAR Stable Wide range blue and red colours
SPSS Guide: Regression Analysis
 SPSS Guide: Regression Analysis I put this together to give you a step-by-step guide for replicating what we did in the computer lab. It should help you run the tests we covered. The best way to get familiar
LIST OF RECENT PLANTSCREEN TM INSTALLATIONS
 LIST OF RECENT PLANTSCREEN TM INSTALLATIONS The below-listed overview is example of recent PlantScreen TM high-throughput automated Systems manufactured and installed by the Photon Systems Instruments,
INTEGRATED IRRIGATION MANAGEMENT ON VITICULTURE
 INTEGRATED IRRIGATION MANAGEMENT ON VITICULTURE Posible evolución costes componentes 1 What is different in viticulture 2 3 4 Irrigation strategies Irrigation practices New technologies Posible evolución
Exercise 1.12 (Pg. 22-23)
") Individuals: The objects that are described by a set of data. They may be people, animals, things, etc. (Also referred to as Cases or Records) Variables: The characteristics recorded about each individual.
Individuals: The objects that are described by a set of data. They may be people, animals, things, etc. (Also referred to as Cases or Records) Variables: The characteristics recorded about each individual.
Summer School Greenhouse Horticulture
 Programme Summer School Greenhouse Horticulture Wageningen University Campus Course leader: Date: 24 August 4 September 2015 Lecturers Dr Sjaak Bakker, General Manager, Wageningen University, Greenhouse
Stat 412/512 CASE INFLUENCE STATISTICS. Charlotte Wickham. stat512.cwick.co.nz. Feb 2 2015
 Stat 412/512 CASE INFLUENCE STATISTICS Feb 2 2015 Charlotte Wickham stat512.cwick.co.nz Regression in your field See website. You may complete this assignment in pairs. Find a journal article in your field
COTTON WATER RELATIONS
 COTTON WATER RELATIONS Dan R. Krieg 1 INTRODUCTION Water is the most abundant substance on the Earth s surface and yet is the most limiting to maximum productivity of nearly all crop plants. Land plants,
AWESOME ADAPTATIONS WORKSHEETS. for. Rainforest Desert Mediterranean
 AWESOME ADAPTATIONS WORKSHEETS for Rainforest Desert Mediterranean IN THE RAINFOREST Write a sentence to record your experience in the Tropical House IT FEELS. IT SMELLS. THE TEMPERATURE is IT MAKES ME
SOLAR RADIATION AVAILABILITY FOR PLANT GROWTH IN ARIZONA CONTROLLED ENVIRONMENT AGRICULTURE SYSTEMS
 SOLAR RADIATION AVAILABILITY FOR PLANT GROWTH IN ARIZONA CONTROLLED ENVIRONMENT AGRICULTURE SYSTEMS Stephen Kania, Horticultural Engineer Gene Giacomelli, Professor & Director CEAC Controlled Environment
A Basic Introduction to Missing Data
 John Fox Sociology 740 Winter 2014 Outline Why Missing Data Arise Why Missing Data Arise Global or unit non-response. In a survey, certain respondents may be unreachable or may refuse to participate. Item
ESTIMATING YIELDS AND YIELD GAPS: Experiences from East Africa
 ESTIMATING YIELDS AND YIELD GAPS: Experiences from East Africa Godfrey Taulya, Lydia Wairegi, Piet van Asten PRESENTATION OUTLINE 1. General approach 2. Yield estimation in banana/plantain systems 3. On-farm
Chapter 7: Simple linear regression Learning Objectives
 Chapter 7: Simple linear regression Learning Objectives Reading: Section 7.1 of OpenIntro Statistics Video: Correlation vs. causation, YouTube (2:19) Video: Intro to Linear Regression, YouTube (5:18) -
Effects of Cage Stocking Density on Feeding Behaviors of Group-Housed Laying Hens
 Animal Industry Report AS 651 ASL R2018 2005 Effects of Cage Stocking Density on Feeding Behaviors of Group-Housed Laying Hens R. N. Cook Iowa State University Hongwei Xin Iowa State University, hxin@iastate.edu
Part 2: Analysis of Relationship Between Two Variables
 Part 2: Analysis of Relationship Between Two Variables Linear Regression Linear correlation Significance Tests Multiple regression Linear Regression Y = a X + b Dependent Variable Independent Variable
Shock test severity based on Shock Response Spectrum
 Shock test severity based on Shock Response Spectrum Frans Assink THALES NEDERLAND B.V. AND/OR ITS SUPPLIERS THIS INFORMATION CARRIER CONTAINS PROPRIETARY INFORMATION WHICH SHALL NOT BE USED, REPRODUCED
2. Regression and Correlation. Simple Linear Regression Software: R
 2. Regression and Correlation Simple Linear Regression Software: R Create txt file from SAS data set data _null_; file 'C:\Documents and Settings\sphlab\Desktop\slr1.txt'; set temp; put input day:date7.
Chapter 13 Introduction to Linear Regression and Correlation Analysis
 Chapter 3 Student Lecture Notes 3- Chapter 3 Introduction to Linear Regression and Correlation Analsis Fall 2006 Fundamentals of Business Statistics Chapter Goals To understand the methods for displaing
Data Analysis Tools. Tools for Summarizing Data
 Data Analysis Tools This section of the notes is meant to introduce you to many of the tools that are provided by Excel under the Tools/Data Analysis menu item. If your computer does not have that tool
Effect of Using Magnetized Treated Water in Irrigation of Bell Pepper and Beans in AL-Jeftlik Area / West Bank Palestine
 Effect of Using Magnetized Treated Water in Irrigation of Bell Pepper and Beans in AL-Jeftlik Area / West Bank Palestine Dia Radeideh Dia Karajeh Nawaf Abu Khalaf Amer Marei 25,Feb,2015 HOW TO MANGE WATER
The economic burden of lung disease in Europe. Online supplement.
 The economic burden of lung disease in Europe. Online supplement. 1. Introduction A bottom-up prevalence-based costing approach was used to estimate the economic burden of lung disease, using a methodology
Decision Support System for single truss tomato production
 Decision Support System for single truss tomato production Dr. K.C. Ting 1, Dr. G.A. Giacomelli 1 & Dr. W. Fang 2 1 Department of Bioresource Engineering, Rutgers University-Cook College, New Brunswick,
MISSING DATA TECHNIQUES WITH SAS. IDRE Statistical Consulting Group
 MISSING DATA TECHNIQUES WITH SAS IDRE Statistical Consulting Group ROAD MAP FOR TODAY To discuss: 1. Commonly used techniques for handling missing data, focusing on multiple imputation 2. Issues that could
Subjects. Subjects were undergraduates at the University of California, Santa Barbara, with
 Category-specific visual attention 1 SI Appendix 1 Method Subjects. Subjects were undergraduates at the University of California, Santa Barbara, with normal or corrected-to-normal vision. Exp 1: n=30;
Developing a Stock Price Model Using Investment Valuation Ratios for the Financial Industry Of the Philippine Stock Market
 Developing a Stock Price Model Using Investment Valuation Ratios for the Financial Industry Of the Philippine Stock Market Tyrone Robin 1, Carlo Canquin 1, Donald Uy 1, Al Rey Villagracia 1 1 Physics Department,
1. What is the critical value for this 95% confidence interval? CV = z.025 = invnorm(0.025) = 1.96
 = 1.96") 1 Final Review 2 Review 2.1 CI 1-propZint Scenario 1 A TV manufacturer claims in its warranty brochure that in the past not more than 10 percent of its TV sets needed any repair during the first two years
1 Final Review 2 Review 2.1 CI 1-propZint Scenario 1 A TV manufacturer claims in its warranty brochure that in the past not more than 10 percent of its TV sets needed any repair during the first two years
LIDAR Bathymetry in very shallow waters. Shachak Pe eri CCOM, UNH William Philpot Cornell University
 LIDAR Bathymetry in very shallow waters Shachak Pe eri CCOM, UNH William Philpot Cornell University Nd:YAG laser generates pulses in the infrared (164 nm) and green (532 nm) simultaneously IR radiation
Predicting Box Office Success: Do Critical Reviews Really Matter? By: Alec Kennedy Introduction: Information economics looks at the importance of
 Predicting Box Office Success: Do Critical Reviews Really Matter? By: Alec Kennedy Introduction: Information economics looks at the importance of information in economic decisionmaking. Consumers that
Tobii AB. Accuracy and precision Test report. Tobii Pro X3-120 fw 1.7.1. Date: 2015-09-14 Methodology/Software version: 2.1.7*
 Tobii AB Accuracy and precision Test report Tobii Pro X3-120 fw 1.7.1 Date: 2015-09-14 Methodology/Software version: 2.1.7* 1. Introduction This document provides an overview of tests in terms of accuracy
Testing for Lack of Fit
 Chapter 6 Testing for Lack of Fit How can we tell if a model fits the data? If the model is correct then ˆσ 2 should be an unbiased estimate of σ 2. If we have a model which is not complex enough to fit
Sugar Content Estimation of Date (Phoenix dactylifera, L.) Fruits in Tamr Stage
 Fruits in Tamr Stage") Sugar Content Estimation of Date (Phoenix dactylifera, L.) Fruits in Tamr Stage 1 Moustafa A. Fadel United Arab Emirates Univ., College of Food and Agric., Dep. of Aridland Agric. Al-Ain, B.O.Box 17555
Sugar Content Estimation of Date (Phoenix dactylifera, L.) Fruits in Tamr Stage 1 Moustafa A. Fadel United Arab Emirates Univ., College of Food and Agric., Dep. of Aridland Agric. Al-Ain, B.O.Box 17555
Spatial location in 360 of reference points over an object by using stereo vision
 EDUCATION Revista Mexicana de Física E 59 (2013) 23 27 JANUARY JUNE 2013 Spatial location in 360 of reference points over an object by using stereo vision V. H. Flores a, A. Martínez a, J. A. Rayas a,
Exchange Rate Regime Analysis for the Indian Rupee
 Exchange Rate Regime Analysis for the Indian Rupee Achim Zeileis Ajay Shah Ila Patnaik Abstract We investigate the Indian exchange rate regime starting from 1993 when trading in the Indian rupee began
DATA INTERPRETATION AND STATISTICS
 PholC60 September 001 DATA INTERPRETATION AND STATISTICS Books A easy and systematic introductory text is Essentials of Medical Statistics by Betty Kirkwood, published by Blackwell at about 14. DESCRIPTIVE
Régression logistique : introduction
 Chapitre 16 Introduction à la statistique avec R Régression logistique : introduction Une variable à expliquer binaire Expliquer un risque suicidaire élevé en prison par La durée de la peine L existence
Effects of salinity on fruit yield and quality of tomato grown in soil-less culture in greenhouses in Mediterranean climatic conditions
 agricultural water management 95 (2008) 1041 1055 available at www.sciencedirect.com journal homepage: www.elsevier.com/locate/agwat Effects of salinity on fruit yield and quality of tomato grown in soil-less
Asian Journal of Food and Agro-Industry ISSN 1906-3040 Available online at www.ajofai.info
 As. J. Food Ag-Ind. 008, (0), - Asian Journal of Food and Agro-Industry ISSN 906-00 Available online at www.ajofai.info Research Article Analysis of NIR spectral reflectance linearization and gradient
Utilization of the Dark Green Color Index to Determine Cotton Nitrogen Status
 Utilization of the Dark Green Color Index to Determine Cotton Nitrogen Status T.B. Raper 1, D.M. Oosterhuis 1, U. Siddons 1, L.C. Purcell 1, and M. Mozaffari 2 RESEARCH PROBLEM Inadequate or excessive
Stepwise Regression. Chapter 311. Introduction. Variable Selection Procedures. Forward (Step-Up) Selection
 Selection") Chapter 311 Introduction Often, theory and experience give only general direction as to which of a pool of candidate variables (including transformed variables) should be included in the regression model.
Chapter 311 Introduction Often, theory and experience give only general direction as to which of a pool of candidate variables (including transformed variables) should be included in the regression model.
2015 Certified Bermudagrass Preliminary Buyers Guide
 2015 Certified Bermudagrass Preliminary Buyers Guide IMPORTANT NOTICE! Final certification is contingent only on a satisfactory field inspection. This publication has been prepared to provide a list of
Data Mining Techniques Chapter 5: The Lure of Statistics: Data Mining Using Familiar Tools
 Data Mining Techniques Chapter 5: The Lure of Statistics: Data Mining Using Familiar Tools Occam s razor.......................................................... 2 A look at data I.........................................................
Forecasting Analytics. Group members: - Arpita - Kapil - Kaushik - Ridhima - Ushhan
 Forecasting Analytics Group members: - Arpita - Kapil - Kaushik - Ridhima - Ushhan Business Problem Forecast daily sales of dairy products (excluding milk) to make a good prediction of future demand, and
Tobii Technology AB. Accuracy and precision Test report. X2-60 fw 1.0.5. Date: 2013-08-16 Methodology/Software version: 2.1.7
 Tobii Technology AB Accuracy and precision Test report X2-60 fw 1.0.5 Date: 2013-08-16 Methodology/Software version: 2.1.7 1. Introduction This document provides an overview of tests in terms of accuracy
This can dilute the significance of a departure from the null hypothesis. We can focus the test on departures of a particular form.
 One-Degree-of-Freedom Tests Test for group occasion interactions has (number of groups 1) number of occasions 1) degrees of freedom. This can dilute the significance of a departure from the null hypothesis.
Roots and Stems and Leaves, Oh My!
 Roots and Stems and Leaves, Oh My! Objectives 1. The student will be able to identify parts of a plant. 2. The student will understand the function of plant parts. Grade Level 1-3 4-6 TEKS: 1.6B, 2.6C;
Multispectral stereo acquisition using 2 RGB cameras and color filters: color and disparity accuracy
 Multispectral stereo acquisition using 2 RGB cameras and color filters: color and disparity accuracy (a) and Bernhard Hill (b) (a) Institute of Imaging and Computer Vision (b) Research Group Color and
Future Internet Business Collaboration Networks in Agri-Food, Transport & Logistics
 Future Internet Business Collaboration Networks in Agri-Food, Transport & Logistics Short introduction webinar, 24 July 2014 Sjaak Wolfert Project Coordinator LEI Wageningen UR Outline Future Internet
Visualizing Data. Contents. 1 Visualizing Data. Anthony Tanbakuchi Department of Mathematics Pima Community College. Introductory Statistics Lectures
 Introductory Statistics Lectures Visualizing Data Descriptive Statistics I Department of Mathematics Pima Community College Redistribution of this material is prohibited without written permission of the
Financial Risk Models in R: Factor Models for Asset Returns. Workshop Overview
 Financial Risk Models in R: Factor Models for Asset Returns and Interest Rate Models Scottish Financial Risk Academy, March 15, 2011 Eric Zivot Robert Richards Chaired Professor of Economics Adjunct Professor,
Computer Vision: Machine Vision Filters. Computer Vision. Optical Filters. 25 August 2014
 Computer Vision Optical Filters 25 August 2014 Copyright 2001 2014 by NHL Hogeschool, Van de Loosdrecht Machine Vision BV and Klaas Dijkstra All rights reserved j.van.de.loosdrecht@nhl.nl, jaap@vdlmv.nl,
Logistic Regression (1/24/13)
") STA63/CBB540: Statistical methods in computational biology Logistic Regression (/24/3) Lecturer: Barbara Engelhardt Scribe: Dinesh Manandhar Introduction Logistic regression is model for regression used
STA63/CBB540: Statistical methods in computational biology Logistic Regression (/24/3) Lecturer: Barbara Engelhardt Scribe: Dinesh Manandhar Introduction Logistic regression is model for regression used
Chapter D9. Irrigation scheduling
 Chapter D9. Irrigation scheduling PURPOSE OF THIS CHAPTER To explain how to plan and schedule your irrigation program CHAPTER CONTENTS factors affecting irrigation intervals influence of soil water using
Reactive oxygen species in leaves and how to catch these
 Reactive oxygen species in leaves and how to catch these Éva Hideg Molecular Stress- & Photobiology Group, BRC Szeged EPPN Summer School 2013 Outline How to prove that ROS are involved? The central role
Growing your greenhouse business faster with gas engines.
 Growing your greenhouse business faster with gas engines. Our combined heat and power engines can increase the efficiency and profitability of your greenhouses. Because it s not just your plants that need
Visual Servoing Methodology for Selective Tree Pruning by Human-Robot Collaborative System
 Ref: C0287 Visual Servoing Methodology for Selective Tree Pruning by Human-Robot Collaborative System Avital Bechar, Victor Bloch, Roee Finkelshtain, Sivan Levi, Aharon Hoffman, Haim Egozi and Ze ev Schmilovitch,
How To Understand Light And Color
 PRACTICE EXAM IV P202 SPRING 2004 1. In two separate double slit experiments, an interference pattern is observed on a screen. In the first experiment, violet light (λ = 754 nm) is used and a second-order
Implementing Panel-Corrected Standard Errors in R: The pcse Package
 Implementing Panel-Corrected Standard Errors in R: The pcse Package Delia Bailey YouGov Polimetrix Jonathan N. Katz California Institute of Technology Abstract This introduction to the R package pcse is
DESCRIPTIVE STATISTICS AND EXPLORATORY DATA ANALYSIS
 DESCRIPTIVE STATISTICS AND EXPLORATORY DATA ANALYSIS SEEMA JAGGI Indian Agricultural Statistics Research Institute Library Avenue, New Delhi - 110 012 seema@iasri.res.in 1. Descriptive Statistics Statistics
Lets suppose we rolled a six-sided die 150 times and recorded the number of times each outcome (1-6) occured. The data is
 occured. The data is") In this lab we will look at how R can eliminate most of the annoying calculations involved in (a) using Chi-Squared tests to check for homogeneity in two-way tables of catagorical data and (b) computing
In this lab we will look at how R can eliminate most of the annoying calculations involved in (a) using Chi-Squared tests to check for homogeneity in two-way tables of catagorical data and (b) computing
2. Simple Linear Regression
 Research methods - II 3 2. Simple Linear Regression Simple linear regression is a technique in parametric statistics that is commonly used for analyzing mean response of a variable Y which changes according