Analysis of UCAS applications for 2012/13 admissions
|
|
|
- Winifred Freeman
- 7 years ago
- Views:
Transcription
1 Analysis of UCAS applications for 2012/13 admissions August 2012

2 Contents 1. Introduction Overall trends (all UK domiciled applicants) Trends in applicants by geographical measures of advantage Analysis of applications to selective universities Other areas of UCAS analysis Other areas of potential interest Findings

3 1. Introduction i. Background In response to the increase in university fees in the UK from 2012, the Independent Commission on Fees has been established to monitor the impact over the next three years. It will produce a series of reports assessing the impact of the increase in fees on application and admissions trends in universities, considering in particular the effect on young people from low and middle income backgrounds. At this stage, the Commission is analysing data on applications from UK domiciled subjects to HEIs for admission in The Commission is extremely grateful to UCAS for their cooperation in providing datasets to help with this phase of the Commission's work. Our aim is to complement work being undertaken by UCAS but the interpretation and analysis in this report is our own and independent of UCAS or any other organisation. The Commission will gather evidence from a number of sources to support future phases of its work. ii. Student fees from 2012 From 2012, universities in England can charge up to 9,000 per year for undergraduate courses, raising the cap from its 2011/12 level of 3,375. Universities wanting to charge more than 6,000 have to agree to put in place access measures, which will be assessed and monitored by the Office for Fair Access (OFFA). Students in Scotland attending Scottish universities do not pay fees. In 2011/12, students from elsewhere in the UK had to pay 1,820 per year to study at a Scottish university but, from 2012, these universities will be able to charge up to 9,000 for students from elsewhere in the UK. Welsh universities can charge fees of up to 9,000, as in England, but the Welsh Assembly will pay fee costs above 3,465 a year for Welsh students studying at any UK university. At universities in Northern Ireland, tuition fees for students from Northern Ireland in 2012 will be capped at 3,465, and will rise in line with inflation for the next four years. Fees for other UK students will not be capped but the Northern Ireland Executive has said that fees are not expected to exceed 9,000. iii. The data The Commission has independently analysed data (supplied by UCAS) for UCAS admission cycles, 2009 to 2012 inclusive, in each case using information available at the major application cut-off point in mid-january. This means that the datasets are comparable year on year, but they do not include all applications made in each cycle. All UK domiciled applicants are included. Alongside this analysis the Commission has reviewed longer term application trends produced by UCAS using data sets covering the period 2004 to These data sets use applications data at a different reference point of mid-march (each year) and use slightly definitions for some aspects of the analysis (for example, age), but the Commission is satisfied that the overall conclusions drawn here are not affected by these slight differences. UCAS published its findings on these data sets in July 2012 in their report How have applications for full-time undergraduate higher education in the UK changed in (the UCAS Report ), which is referred to further in this report. 1 How have applications for full-time undergraduate higher education in the UK changed in 2012, UCAS Analysis and Research, July Report and underlying data for results available at 3

4 The data covers all course types. The majority of applications relate to honours degrees, but other course types such as foundation degrees and HNDs are also included. Many of the comparisons in our independent analysis examine changes relative to Although the UCAS report finds no indication that application rates in 2011 were affected by the preannouncing of the 2012 changes, we take this step to give a different perspective on the changes. These comparisons also need to be seen in the context of varying year-on-year student population sizes. For this reason the overall application trends are better analysed by looking at the longer term application rate trends (using the data sets) which take the varying size of the cohort populations into account. This report examines both overall numbers of applicants and differentials between sub-groups. In our analyses, we have principally considered two groups of applicants: those aged up to 19 at the time of application, and those aged 20 or over. The UCAS report finds that, in terms of responses to the 2012 changes, 18 year olds and over 19 year olds behave as two distinct groups. They base their reporting around this with a focus on the 18 year old group who, having not had the opportunity to apply to HE before, are a particularly sensitive indicator group. We have generally taken a different approach and taken 18 year olds and 19 year olds together as a single young group. We do this since it is a common measure of young people accessing HE used by the Department for Business Innovation and Skills, and others, and because 19 year olds form a very substantial share of total young applicants. In our view the group needs to be seen together as a full description of the experience of young people. We understand why UCAS want to wait until there is another year of applications data before calculating cohort application rates on this basis, but have decided to use 18 and 19 year olds together as an intermediate measure in the meantime. It is also worth noting that although UCAS data covers the overwhelming majority of applications to higher education, it does not cover all UK institutions (or institutions overseas) although the relative number of these applications will be very small. 4

5 2. Overall trends (all UK domiciled applicants) i. Applicant numbers by country of domicile and age group Table 2.1: Number of applicants by country of domicile and year (January deadline) Year Country Age England Up to , , ,695 (1.2%) 276,629 (-7.2%) 20 and over 82, , ,513 (1.0%) 107,541 (-12.8%) Total 345, , ,208 (1.1%) 384,170 (-8.8%) NI Up to 19 12,771 13,875 14,110 (1.7%) 13,600 (-2.0%) 20 and over 3,168 4,560 5,020 (10.1%) 4,692 (2.9%) Total 15,939 18,435 19,130 (3.8%) 18,292 (-0.8%) Scotland Up to 19 22,635 26,619 26,686 (0.3%) 26,463 (-0.6%) 20 and over 6,914 12,144 13,075 (7.7%) 12,706 (4.6%) Total 29,549 38,763 39,761 (2.6%) 39,169 (1.0%) Wales Up to 19 13,922 14,908 14,951 (0.3%) 14,667 (-1.6%) 20 and over 4,406 5,897 6,338 (7.5%) 6,209 (5.3%) Total 18,328 20,805 21,289 (2.3%) 20,876 (0.3%) Total 408, , ,388 (1.4%) 462,507 (-7.4%) Note: Numbers in brackets are the percentage changes compared with 2010 Table 2.1 summarises the number of applications overall in the UK by age group. In all four regions, the number of applicants peaked in 2011 (the last year before the increase in fees). Overall increases were largely as a result of increased numbers of applicants aged over 19, where there was a particularly sharp increase from 2009 to Decline in total UK applicants The 2012 application cycle saw a noticeable dip in the total number of applicants from the comparable 2010 cycle of 7.4%. The comparison to 2010 is relevant since the 2011 cycle may have been affected by applicant decisions made ahead of the introduction of increased tuition fees, whereas this would not have been the case for the 2010 cycle (the data used in this report is recorded as of January, so 2010 numbers would not be affected by knowledge of the new fee regime). However 2012 applications were still ahead of the comparable number for The dip in applications was seen mainly in England. The increase in tuition fees did not effectively apply to applicants from Wales or Northern Ireland, and only to a minor extent to those from Scotland. The decline in English applicants from the 2010 level was 8.8 %, as compared to a nearly constant level from the other home nations across this period. This may indicate a link between the level of tuition fees and the numbers of applicants. The fall in the population of 18 and 5
 20 and over 3,168 4,560 5,020 (10.1%) 4,692 (2.9%) Total 15,939 18,435 19,130 (3.8%) 18,292 (-0.8%) Scotland Up to 19 22,635 26,619 26,686 (0.3%) 26,463 (-0.6%) 20 and over 6,914 12,144 13,075 (7.")
6 Number of Applicants Number of Applicants 19 year olds is a significant factor in explaining some of the overall decline in applications (see section 2.2. below) but this is relatively constant across the UK, and cannot account for the difference in application drop-offs between the four home countries. Chart Total number of applicants in England by year 500, , , , , Year 45,000 40,000 35,000 30,000 25,000 20,000 15,000 10,000 5,000 Chart Total number of applicants in Scotland, Wales and Northern Ireland by year Year NI Scotland Wales Decline in number of applicants by age group For the purposes of this report we split our analysis between those applicants aged up to 19, and those aged 20 and over. We have included 19 year old applicants in our younger group, since they include most gap year students, and can still be considered as school leavers. The largest single fall in applications was from English applicants aged 20 or over which declined from 123,293 in 2010 to 107,541 in 2012, a drop of 12.8%. This group represented 23% of the total 2012 applicant pool. English applicants aged up to 19, accounting for 60% of the pool, declined by 7%. Applications from the other home countries in all age groups either increased or showed significantly smaller declines. Charts 2.3 and 2.4 below summarise the number of applicants aged 19 and under by country of domicile for the period 2009 to (Note that England is shown on a separate chart to highlight the difference in scale between the numbers of applicants from England and those from other nations). Scotland shows greater percentage increases over the same period, and Wales and Northern Ireland smaller increases, than England for those aged up to 19. 6

7 Number of applicants Number of applicants Number of applicants Number of applicants Chart 2.3: Number of applicants 19 and under from England by year 310, , , , , , , , Year Chart 2.4: Number of applicants 19 and under from Scotland, Wales and Northern Ireland by year 30,000 25,000 20,000 15,000 10,000 5, Year NI Scotland Wales Charts 2.5 and 2.6 show the number of applicants aged 20 and over for each year. For older students, growth has been greater outside England. In particular, the percentage drop in the number of applications in Scotland and Wales in 2012 was much smaller than the percentage drop for England. Chart 2.5: Number of applicants aged 20 and over from England by year 140, , ,000 80,000 60,000 40,000 20, Year Chart 2.6: Number of applicants from students aged 20 and over from Scotland, Wales and Northern Ireland by year 14,000 12,000 10,000 8,000 6,000 4,000 2, Year Northern Ireland Scotland Wales 7

8 ii. Total applicant numbers: longer term trends The analysis in section 2.i should be seen in the context of longer term application rate trends, which take into account the changes in cohort populations and allow the assessment of whether application behaviour has changed. These trends are investigated in the UCAS report. Here we use data from that report to take a different perspective by looking at the trends in applicant numbers. Chart 2.7 shows the number of applicants by age group over the period from 2004, and shows that the decline in 2012 came after a long period of increasing numbers. It also shows 18 year olds as a separate group from 19 year olds It is also worth noting at this point that in 2011 there was no indication that more 18 year olds were applying during that cycle rather than taking a gap year and applying in UCAS own data analysis (see table 2.1 below) has shown no significant increase in the rate of applications from 18 year olds for that year. This makes it harder to explain the relatively substantial drop-off in applications from 19 year olds, since it would have been reasonable to expect this to have been caused by an acceleration of applications into the prior year. We will re-examine this trend in the light of subsequent year applications data. Source: Data from How have applications for full-time undergraduate higher education in the UK changed in 2012, UCAS July 2012, As already mentioned, the raw numbers of applicants does not take into account the variations over time in the size of the various age groups. UCAS have calculated application rates taking the population changes into account, and tables 2.1 and 2.2 below show these application rates for 18 8

9 year olds and 19 year olds over the full period. We can see that the application rates for both 18 and 19 year olds in England have dropped this year. In Wales and Scotland there has been no drop while in Northern Ireland the combined drop has been smaller( given the high overall application rate in Northern Ireland, the percentage decline is also smaller) Table 2.1: Application rates for 18 year olds over time (excluding nursing applications) England Wales Scotland N Ireland % 26% 27% 35% % 26% 27% 36% % 26% 27% 40% % 25% 26% 39% % 26% 26% 39% % 28% 27% 41% % 28% 29% 43% % 28% 29% 44% % 28% 29% 43% Table 2.2: Application rates for 19 year olds over time (excluding nursing applications) England Wales Scotland N Ireland % 7% 5% 6% % 7% 5% 7% % 6% 5% 7% % 7% 6% 7% % 7% 5% 7% % 8% 6% 7% % 9% 7% 9% % 9% 8% 11% % 9% 8% 9% Source: Data from Figures from How have applications for full-time undergraduate higher education in the UK changed in 2012, UCAS July 2012, Nursing applications are excluded in this analysis to avoid any effects from the introduction of nursing applications to the UCAS scheme. The UCAS analysis has used population data to calculate the application rates, which takes into account a 1.4% fall in the total UK population of 18 year olds this year. But, as can be seen, the comparative trends between the application rates from England and from the other home countries displays the same pattern as for the raw applicant numbers, and provide further evidence for a possible impact from the increase in tuition fees. If we look at English 18 year olds in isolation, UCAS have calculated that the change in application rate from the long run trend equates to the loss of one in twenty of those who would otherwise have applied (some 15,000 applicants). 9
 England Wales Scotland N Ireland 2004 27% 26% 27% 35% 2005 29% 26% 27% 36% 2006 27% 26% 27% 40% 2007 28% 25% 26% 39%")
10 3. Trends in applicants by geographical measures of advantage i. Indicators Both our analysis and UCAS analysis looked at applications in relation to some indicators of the types of area applicants come from. This includes: QYPR POLAR2 2 : This measure sorts the population into quintiles, depending on whether the neighbourhood they live in has historically seen relatively high or low numbers of young people progress into higher education. Specifically, it looks at those who were aged 18 between 2000 and 2004 and entered a course in a UK higher education institution or GB further education college, aged 18 or 19, between academic years 2000/01 and 2005/06. The POLAR2 classification is formed by ranking 2001 Census Area Statistics wards by their young participation rates for the combined 2000 to 2004 cohorts. This gives five young participation quintile groups (QYPR) of areas ordered from '1' (those wards with the lowest participation) to '5' (those wards with the highest participation), each representing 20 per cent of UK young cohort. Students have been allocated to the neighbourhoods on the basis of their postcode. Those students whose postcode falls within wards with the lowest participation (quintile 1) are denoted as being from a low participation neighbourhood. IDACI 3 The Income Deprivation Affecting Children Index (IDACI) shows the percentage of children in each super output area that live in families that are income deprived (ie, in receipt of Income Support, Income based Jobseeker's Allowance, Working Families' Tax Credit or Disabled Person's Tax Credit below a given threshold). This is a measure of economic disadvantage, rather than educational disadvantage. QAHE 4 QAHE is a measure similar to QYPR, but it is based on the proportion of adults with a higher education qualification in an applicant's home post code. It is therefore potentially more relevant in looking at older populations, rather than school leavers. ii. Analysis The UCAS Report also released in July of this year demonstrates that the application rates for young people from all backgrounds have fallen in 2012 with the largest declines, both proportionally and in percentage points, for those from the most advantaged backgrounds. This is encouraging in that any potential impact from higher tuition fees does not appear to be having a disproportionate impact on those from less advantaged neighbourhoods. This analysis looks at both the QYPR and IDACI measures. The fact that the decline is actually greatest in the most advantaged neighbourhoods needs to be seen in the context of the trend rate of growth over previous years, and the remaining very large differences between the application rates in these different areas. The UCAS analysis 2 Developed by HEFCE, see Developed by HEFCE, see Quintiles based on the proportion of HE-qualified adults at 10


11 demonstrates that once the trend rate of growth is taken into account, the declines in applications can be seen as having affected all neighbourhood types to approximately the same extent. Our own analysis looked at some slightly different measures: In the case of older applicants we looked at QAHE as our indicator of neighbourhood advantage/disadvantage. As elsewhere we grouped 19 year olds along with 18 year olds in looking at younger applicants In neither case did we uncover patterns that were meaningfully different from those seen in the UCAS analysis. Chart 3.1 and table 3.1 below look at younger English applicants and show an analysis of the number of applicants from different POLAR2 QYPR quintiles, which produces similar conclusions to the UCAS analysis of the data. Table 3.1: Applicants aged up to 19 and domiciled in England by year and QYPR QYPR Year (low participation) (high participation) ,017 44,968 54,363 63,736 79, (-5.1%) (-5.8%) (-6.9%) (-8.8%) (-8.3%) Note: Numbers in brackets are the percentage increase over Omits a small number of students (about 2,000 per year) with unknown QYPR. The number of applicants from lower participation areas saw smaller percentage drops in applicants than high participation areas between 2010 and This may reflect high participation areas reaching saturation point. The pattern was similar for both males and females. 11

12 4. Analysis of applications to selective universities In their report UCAS look at trends in applications to higher tariff institutions, that is, institutions whose accepted applicants have, on average, higher levels of entry qualifications. We have used the data sets supplied by UCAS to make our own initial analysis of the number of applications to highly selective universities but for our purposes we are interested in a similar, but different, grouping of institutions namely the Sutton Trust 13 5 and 30 6 groupings. We found some unexpected results that we could not find a sufficient explanation for. Therefore, at our request, UCAS undertook further analysis to see whether any underlying patterns emerged when we looked at those applicants who had made at least one application to a selective university (as defined by the Sutton Trust groupings). UCAS undertook this analysis using the longer term data sets that are used in the rest of the UCAS Report, and reported the results as application rates so as to allow fully for changes in cohort populations. UCAS also analysed the data further to see whether there was any noticeable patterns in application rates across the different geographical areas of advantage / disadvantage, as described in section 3 above. The graphs used in this report, and the underlying data are available from UCAS on request.. The analysis undertaken by UCAS at our request has shown (in charts 4.3 and 4.4 below) that for 18 year olds overall, there have been no significant changes in the application rates to highly selective universities this year compared to what would have been expected from previous years. This is consistent with UCAS analysis of applications to higher tariff institutions. Chart year old application rates to ST13 institutions by country 5 The ST13 consists of Birmingham, Bristol, Cambridge, Durham, Edinburgh, Imperial College, LSE, Nottingham, Oxford, St Andrews, UCL, Warwick and York. 6 The ST30 group also includes Bath, Cardiff, Exeter, Glasgow, King s College, Lancaster, Leeds, Leicester, Liverpool, Manchester, Newcastle, Reading, Royal Holloway College, Sheffield, Southampton, Strathclyde and Surrey. 12

13 Chart year old application rates to ST30 institutions by country Across the different nations we see much bigger declines in application rates to highly selective universities from Northern Ireland compared to the other nations, with an application rate to Sutton Trust 30 institutions this year of 15.0% compared to a rate of 18.2% in We do not currently have an explanation for this. For 19 year olds and those 20 and over (Charts 4.3 and 4.4), we do see a decrease in application rates to selective universities. Looking at the second graph below (which is on a logarithmic scale) we can see the biggest drop in application rate has been for the 19 year olds: 40,370 applicants from a population of 796k (5%) in 2010 to 34,360 from a population of 757k (4.5%) in This is broadly in line with the overall drop in the 19 year old application rate from 12% to 11% (Table 2.2). Chart 4.3 UK application rates to ST13 institutions by age group 13
, we do see a decrease in application rates to selective universities.")
14 Chart 4.4 UK application rates to ST30 institutions by age group To look at the relative effects that might be being experienced by applicants from different backgrounds the application rates for different POLAR2 quintiles were also considered. As discussed earlier in this report, POLAR2 is a measure of Higher Education participation rates in the area the applicant is from, with Q5 being the areas with the highest rates of HE participation and Q1 being the areas with the lowest participation. The analysis (charts ) found that there are no significant differences in the application patterns in 2012 to highly selective universities across the different POLAR2 quintiles for 18 year old English applicants. Chart

15 Chart 4.6 Chart

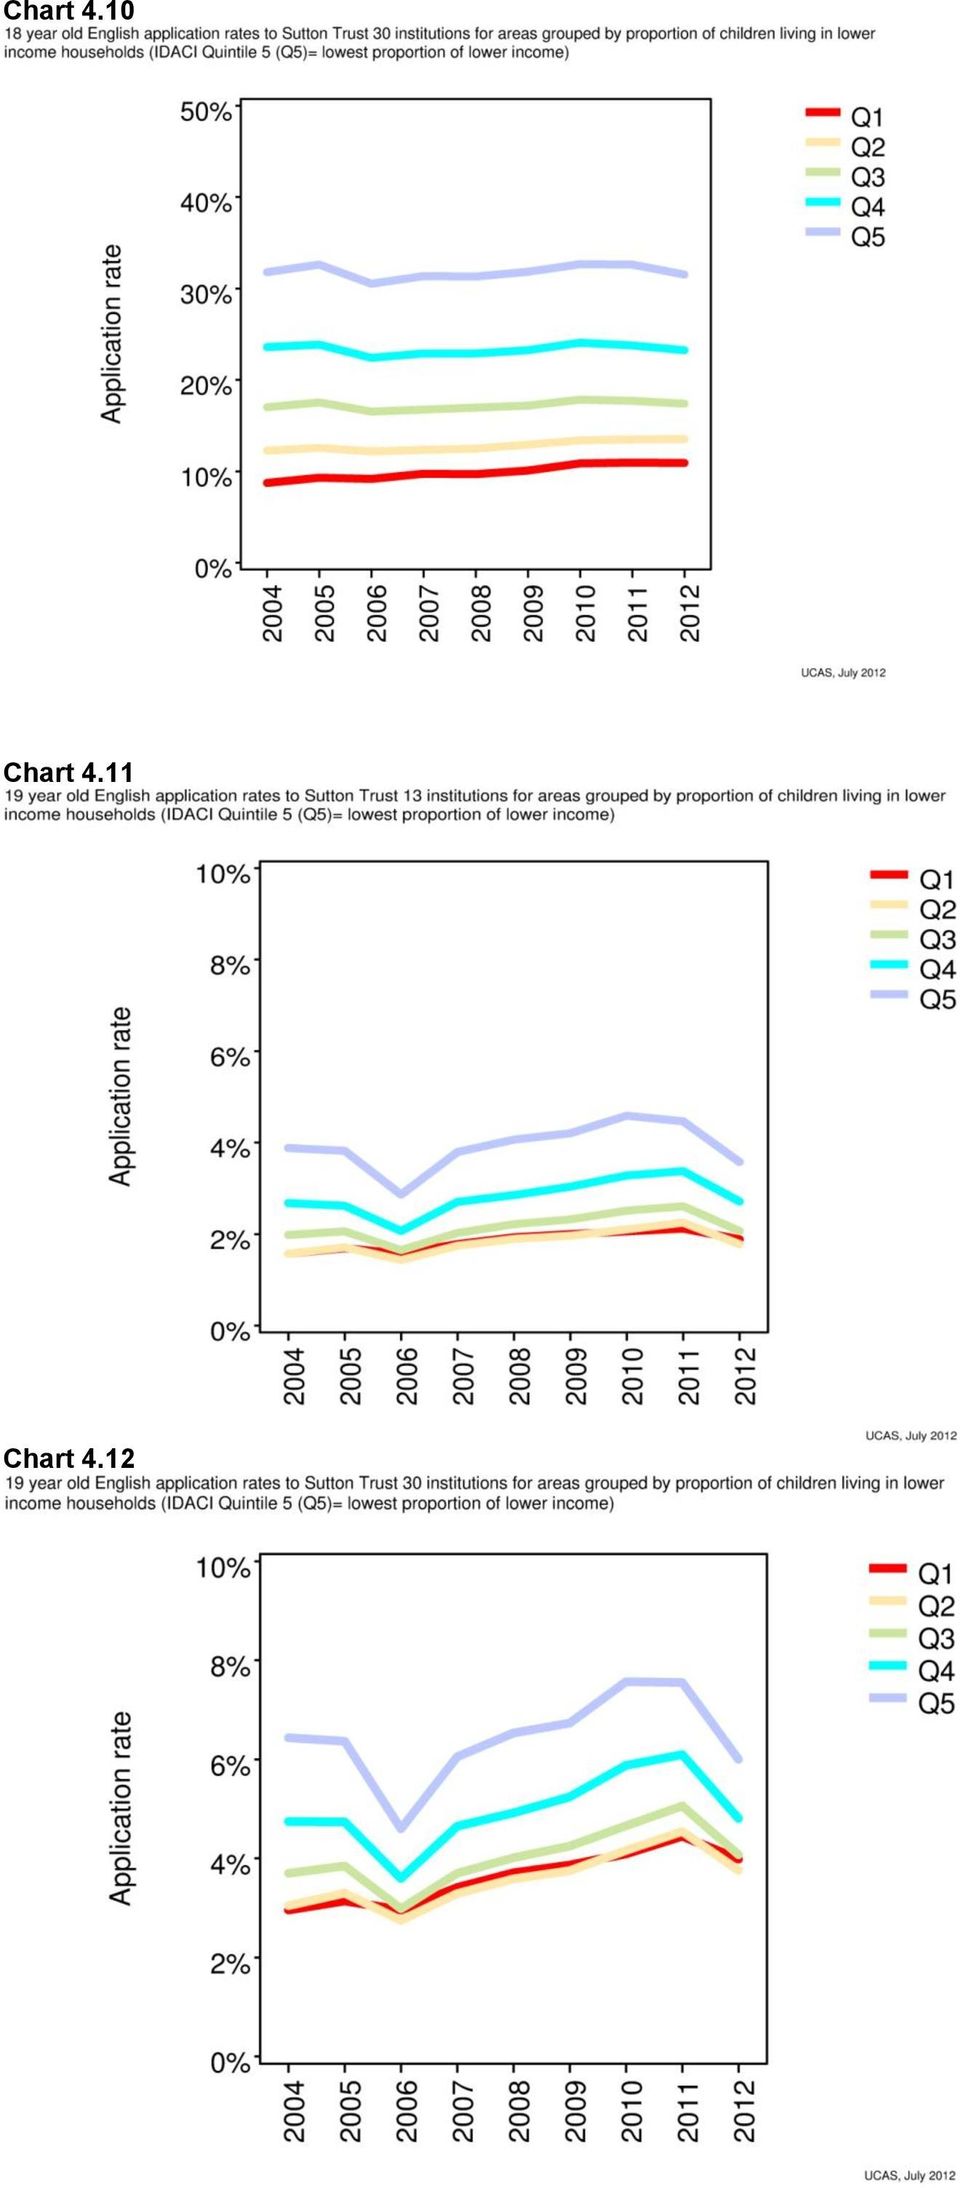
16 Chart 4.8 Again we see bigger decreases for English 19 year olds across the different POLAR2 quintiles in We also see larger relative declines from applicants in the most advantaged areas. Another measure of disadvantage that UCAS has used in its analysis is the IDACI measure of the percentage of children living in low income households in the area each applicant is from. Graphs 4.9 to 4.12 below show a very similar story to the analysis by POLAR2 quintiles in that the greatest decline in application rates in 2012 to Sutton Trust 13/30 institutions are amongst 19 year olds, particularly for the most advantaged quintiles. Chart

17 Chart 4.10 Chart 4.11 Chart
18 Overall, this further UCAS analysis looking at the trends of applications to highly selective universities does not indicate that those from poor or middle-income backgrounds are being more adversely impacted than those applicants from more advantaged backgrounds. 18

19 5. Other areas of UCAS analysis UCAS recent analysis of application data has also covered several areas where we have not performed any independent analysis. We welcome this additional analysis, which covers some important areas. In particular we have not studied the relationship between applications and the variable level of fees charged by UK institutions, nor whether applicant choices have moved towards subjects of study with higher reported salaries in response to the higher level of fees In relation to fee levels UCAS have reported that there has been no significant change in applications towards lower or higher fee courses when compared to the choices made by applicants in previous cycles. UCAS also show that the distribution of courses confirms that a large proportion of courses in England are offered at or near the maximum 9,000 fee (the average tuition fee applied to by English applicants is 8,527). In our view this means that the market place in tuition fees is perhaps less informative than originally expected given the high number of institutions that have chosen to charge the maximum level. We also have not considered independently the propensity of applicants to indicate that they intend to live at home for study. UCAS found that there have been no significant changes in the trends for students wishing to live at home. 19

20 6. Other areas of potential interest where we have performed an initial analysis, but are not able to report further at this stage In addition to the work referred to in sections 1 to 4 above, we have looked at additional data fields on applications and applicants, and done a preliminary analysis of certain other factors which, we believe, may need to be tracked over the coming years. We have discussed these issues with UCAS, and will work with them to produce further analysis if we believe it is required. At this stage we are not in a position to publish any detail since the more complex nature of these factors and their capture through the UCAS data means that sound conclusions needs more detailed analysis The factors which we have examined are: i. Applicants by parental HE experience As part of the application process, applicants are asked whether their parents, step-parents or guardians have undertaken a course at higher education level.. A high and variable proportion of applicants choose the 'I prefer not to say' option to this question and any patterns need to be considered with the underlying changing demographics by parental education. For these reasons it is not possible to have firm conclusions at this stage but parental education is an important dimension of advantage and will need to be looked at in depth at a later stage. ii. Applicants by socio-economic group (parental profession) The data includes a measure of applicants' socio-economic group (SEG), based on the occupation of the highest paid parent, step-parent or guardian, for 2010 onwards. No firm pattern emerges from this analysis, and the self-reported nature of this measure together with advice from UCAS that time-series can be misleading due to changes in the capturing of this information through job titles make us cautious. In addition, the changing demographics of young people by this classification, in particular the effect of increases in unemployment, means that no conclusions can be drawn at this stage. However the question of whether young people from such backgrounds are becoming less willing to apply to higher education, with the increase in fees contributing to more general financial uncertainty, is important. Again we feel this is an important dimension of advantage and needs more in depth analysis after the end of the cycle. iii. Applicants by school type We have looked at the pattern of applicants by the type of schools from which they come. The widespread changes to recorded school types in recent years (notably schools becoming Academies) makes the calculation of like for like trends difficult. A significant number of students also apply as individuals rather than through schools, typically when they apply at a slightly older age. No particularly strong patterns were seen, but we will continue to monitor this area as the effects on the trends of these issues becomes better understood. iv. Applications by subject Each applicant can apply for up to five courses and, for most applicants, UCAS derives a 'preferred subject group'. There are marked differences between subjects, and for males and females, 20

21 between 2010 and UCAS have released a separate analysis on subject matter preferences referred to in section 5 above. As our data also contained information relating to HNDs, for example, it can be difficult to draw conclusions on the data for certain subjects which have a large number of students studying for HNDs or Foundation Degrees. v. Applicants by Gender We have also made an initial assessment by gender. In all four years, there were significantly more female applicants than males. The pattern of change over time for males and females was similar, although with some indication that the number of female applicants is holding up better than for male applicants. There are substantially more females than males in the twenty and over group. The number of applicants aged 20 and over increased by 50% from 2009 to 2010, with a further small increase in Numbers fell back slightly in UCAS analysis of January application rates 7 showed that men were substantially underrepresented amongst UCAS applicants and that there were signs that this gap was increasing for
22 7. Findings i. Overall numbers of applicants In Scotland, Wales and, to a lesser extent, Northern Ireland, the number of applicants aged 20 and over increased between 2010 and In contrast, the number of such applicants in England fell by over 10%. The number of younger applicants (those aged up to 19) decreased by 7% in England during this period, but by only 1-2% in the other countries. For all age groups combined, the decline in England was 8.8% compared to a roughly constant level in the rest of the UK. Although a significant portion of the absolute decline in application numbers can be accounted for by a change in the cohort population size, the relative decline in English applications raises concerns about the impact of increased fees. ii. Application rates Data on longer term trends in application rates, released by UCAS, demonstrates a fall in application rates for young English applicants in 2012, both in absolute terms and relative to the rest of the UK. The fact that this fall was more pronounced for 19 year olds than 18 year olds is difficult to explain at this stage, since there was no apparent increase in the 18 year old application rate in the prior year. iii. Applicants from areas of advantage/ disadvantage The decline in applicants appears to have been proportionately higher in areas of high participation and low deprivation. Thus communities with low progression to higher education have seen a smaller percentage drop in applications. However the UCAS analysis demonstrates that once the trend rate of growth is taken into account, the declines in applications can be seen as having affected all neighbourhood types to approximately the same extent. iv. Applicants to selective universities There has been a decrease in raw applications to those universities with relatively high entry requirements, when compared to less selective universities. These figures relate to applications, and an applicant can make up to five applications. The further analysis done on our behalf by UCAS indicates that, for eighteen year olds, there are no fewer applicants (relative to the population) choosing to apply to at least one ST30 or ST13 universities. There is, however, a dropoff in the application rate from 19 year olds, mirroring the trend seen across applications to all institutions, and a significant fall in applications from Northern Ireland. We should continue to monitor these patterns. v. General The findings in this report come from our independent look at the UCAS applications data covering the new tuition fee arrangements. There are some indications that the patterns of applications may change but it is too early to conclude what the impacts of these significant fee increases are. This report, and UCAS publication on how applications have changed, address many key questions about demand for higher education in However, there are still further questions to be addressed. In particular we have highlighted some of the factors which need further analysis before a sound assessment of changes can be made. The Commission intends to continue to work in close cooperation with UCAS to develop the analysis for these more difficult factors. The Commission faces a challenging task over the next three years to determine the extent to which any of the early observed changes reported here can be attributed to increased fee levels, 22
23 and which groups of applicants and potential applicants who decide not to apply to university - are most affected. Over the next three years application and admissions trends will be monitored to provide an independent and impartial check on the reforms. These analyses will be combined with evidence from other sources to ensure the Commission is taking an informed view. This report has highlighted some areas that the Commission will keep a close eye on over the coming months. 23
UK application rates by country, region, constituency, sex, age and background. (2015 cycle, January deadline)
") UK application rates by country, region, constituency, sex, age and background () UCAS Analysis and Research 30 January 2015 Key findings JANUARY DEADLINE APPLICATION RATES PROVIDE THE FIRST RELIABLE INDICATION
UK application rates by country, region, constituency, sex, age and background () UCAS Analysis and Research 30 January 2015 Key findings JANUARY DEADLINE APPLICATION RATES PROVIDE THE FIRST RELIABLE INDICATION
UK application rates by country, region, sex, age and background. (2014 cycle, January deadline)
") UK application rates by country, region, sex, age and background (2014 cycle, January deadline) UCAS Analysis and Research 31 January 2014 Key findings Application rates for 18 year olds in England, Wales
UK application rates by country, region, sex, age and background (2014 cycle, January deadline) UCAS Analysis and Research 31 January 2014 Key findings Application rates for 18 year olds in England, Wales
Higher education and beyond
 July 2013/15 Issues paper This report is for information This report examines the degree outcomes and employment circumstances of young UKdomiciled students starting a full-time first degree course in
Not for use before: 00.01, Thursday 18 th December 2014
 SUTTON TRUST NEWS RELEASE Not for use before: 00.01, Thursday 18 th December 2014 STUDYING AT OXBRIDGE EARNS YOU 7,600 MORE THAN STUDYING AT A NEW UNIVERSITY - SUTTON TRUST RESEARCH Students who study
2. Incidence, prevalence and duration of breastfeeding
 2. Incidence, prevalence and duration of breastfeeding Key Findings Mothers in the UK are breastfeeding their babies for longer with one in three mothers still breastfeeding at six months in 2010 compared
consultation response
 consultation response Department for Education - Government proposals to reform vocational qualifications for 16-19 year olds Introduction UCAS is the UK s provider of admissions services for higher education
Foreword. End of Cycle Report 2014. Applicants
 Foreword The End of Cycle Report is our most comprehensive analysis to date of recruitment to full time undergraduate courses in the UK. It provides a rich picture of demand and outcomes for higher education
SUTTON TRUST BRIEFING NOTE: THE EDUCATIONAL BACKGROUNDS OF THE UK S TOP SOLICITORS, BARRISTERS AND JUDGES. June 2005
 SUTTON TRUST BRIEFING NOTE: THE EDUCATIONAL BACKGROUNDS OF THE UK S TOP SOLICITORS, BARRISTERS AND JUDGES June 2005 Executive Summary To establish whether there has been any change in the educational characteristics
architecture and race A study of black and minority ethnic students in the profession Research outcomes: 6
 > architecture and race A study of black and minority ethnic students in the profession Research outcomes: 6 CONTENTS List of Tables 4 Abbreviations 5 01 INTRODUCTION AND METHODS 1.1 The quantitative research
Do bursaries have an effect on retention rates? An interim report: Research. March 2014/02
 March 2014/02 Research This report analyses trends in continuation rates in English higher education, and uses statistical modelling techniques to isolate the effect of institutional bursaries on retention.
Full Report - Graduates in the UK Labour Market 2013
 Full Report - Graduates in the UK Labour Market 2013 Coverage: UK Date: 19 November 2013 Geographical Area: UK and GB Theme: Labour Market Theme: Children, Education and Skills Key points In 2013 there
The Decline in Student Applications to Computer Science and IT Degree Courses in UK Universities. Anna Round University of Newcastle
 The Decline in Student Applications to Computer Science and IT Degree Courses in UK Universities Introduction Anna Round University of Newcastle The research described in this report was undertaken for
Recruitment and Diversity in the Patent and Trade Mark Professions
 Recruitment and Diversity in the Patent and Trade Mark Professions Background The Legal Services Act requires legal regulators to act so far as is reasonably practical in a way which promotes eight regulatory
Scotland s Class of 99: the early career paths of graduates who studied in Scottish higher education institutions. Summary report
 Scotland s Class of 99: the early career paths of graduates who studied in Scottish higher education institutions Summary report Scotland s Class of 99: the early career paths of graduates who studied
Management Information
 Management Information Initial Teacher Training Performance Profiles: academic year 2012 to 2013 Date 23 October 2014 Coverage England Theme Initial Teacher Training Issued by Department for Education,
CLOSE THE GAP WORKING PAPER GENDER PAY GAP STATISTICS. April 2015 INTRODUCTION WHAT IS THE GENDER PAY GAP? ANNUAL SURVEY OF HOURS AND EARNINGS
 CLOSE THE GAP 14 WORKING PAPER GENDER PAY GAP STATISTICS April 2015 This paper is an updated version of Working Paper 11 Statistics published in 2014.It provides the latest gender pay gap statistics for
Introduction to Undergraduate Student Recruitment
 Introduction to Undergraduate Student Recruitment Jonathan Tinnacher Head of Student Recruitment www.le.ac.uk Overview What is in the White Paper? What does it mean for Leicester? Where are we? and what
TRADE UNION MEMBERSHIP 2014. Statistical Bulletin JUNE 2015
 TRADE UNION MEMBERSHIP 2014 Statistical Bulletin JUNE 2015 Contents Contents... 2 Introduction... 3 Key findings... 5 1. Long Term Trends... 6 2.Private and Public Sectors. 12 3. Personal and job characteristics...
Successful recipients will not be eligible for any other Sheffield Hallam scholarships or discounts.
 Sheffield Hallam University Masters Scholarship Scheme The University is offering up to 141 scholarships for home/eu students to study here as part of a Higher Education Funding Council for England (HEFCE)
Statistical First Release
 Statistical First Release Initial teacher training census for the academic year 2014 to 2015 Reference SFR 48/2014 Date 27 November 2014 Coverage England Theme Children, Education and Skills Issued by
National Insurance Fund - Long-term Financial Estimates
 Social Security Administration Act 1992 National Insurance Fund - Long-term Financial Estimates Report by the Government Actuary on the Quinquennial Review for the period ending 5 April 1995 under Section
A National Statistics Publication for Scotland
 Learning Disability Statistics Scotland, 2014 Published: 12 th August 2015 A National Statistics Publication for Scotland Key Findings Data users should note that this Statistics Release does not include
Higher Education Student Support in Scotland 2014-15
 Higher Education Student Support in Scotland 2014-15 Statistical summary of financial support provided to students by the Student Awards Agency for Scotland in academic session 2014-15 October 2015 A National
SIES - Comparisons between Scotland and England - Summary
 SIES - Comparisons between Scotland and England - Summary To begin, it is necessary to state the key features of the funding systems in each country at the time of the survey: Key features of the Scottish
Poverty among ethnic groups
 Poverty among ethnic groups how and why does it differ? Peter Kenway and Guy Palmer, New Policy Institute www.jrf.org.uk Contents Introduction and summary 3 1 Poverty rates by ethnic group 9 1 In low income
Beyond 2011: Administrative Data Sources Report: The English School Census and the Welsh School Census
 Beyond 2011 Beyond 2011: Administrative Data Sources Report: The English School Census and the Welsh School Census February 2013 Background The Office for National Statistics is currently taking a fresh
Social work education in England 2009-2014
 Social work education in England 2009-2014 A report for the Department of Health (DH) March 2015 Produced by Skills for Care for the Department of Health Contents Introduction 3 1. Enrolments 4 Interim
Financial capability and saving: Evidence from the British Household Panel Survey
 CRS02 NOVEMBER 2010 Financial capability and saving: Evidence from the British Household Panel Survey About the Consumer Financial Education Body The Consumer Financial Education Body (CFEB) is an independent
Loughborough University races to the top of the Lloyds Bank Quality of Student Life Survey
 This is the second Lloyds Bank University Quality of Student Life Survey. The survey covers 89 institutions where comparable data is available. Data has been gathered from a number of sources, including
INSURANCE UK TODAY: BEST CITY TO BE YOUNG.
 INSURANCE UK TODAY: BEST CITY TO BE YOUNG. A new report looking at the factors shaping the quality of life for young adults in the UK s 20 most populous cities. The report also helps to explain the different
Higher Degrees: Postgraduate Study in the UK 2000/01 to 2005/06. Jane Artess, Charlie Ball and Pearl Mok Higher Education Careers Service Unit (HECSU)
") Higher Degrees: Postgraduate Study in the UK 2000/01 to 2005/06 Jane Artess, Charlie Ball and Pearl Mok Higher Education Careers Service Unit (HECSU) DIUS Research Report 08 16 Higher Degrees: Postgraduate
Higher Degrees: Postgraduate Study in the UK 2000/01 to 2005/06 Jane Artess, Charlie Ball and Pearl Mok Higher Education Careers Service Unit (HECSU) DIUS Research Report 08 16 Higher Degrees: Postgraduate
How To Find Out How A University Degree Is Different From A Degree
 Earning by Degrees Differences in the career outcomes of UK graduates Dr Robert de Vries December 2014 Improving social mobility through education CONTENTS FOREWORD... 4 EXECUTIVE SUMMARY... 5 INTRODUCTION...
Public and Private Sector Earnings - March 2014
 Public and Private Sector Earnings - March 2014 Coverage: UK Date: 10 March 2014 Geographical Area: Region Theme: Labour Market Theme: Government Key Points Average pay levels vary between the public and
Learning from Futuretrack: Dropout from higher education
 BIS RESEARCH PAPER NO. 168 Learning from Futuretrack: Dropout from higher education MARCH 2014 1 Acknowledgments This report, written by Dr Andrew McCulloch and colleagues at the Higher Education Careers
Higher Education Student Finance Equality Analysis The Education (Student Support)(Amendment) Regulations 2015
(Amendment) Regulations 2015") Higher Education Student Finance Equality Analysis The Education (Student Support)(Amendment) Regulations 2015 NOVEMBER 2015 Contents Executive summary... 3 Introduction... 8 Overview of the proposed policy
Higher Education Student Finance Equality Analysis The Education (Student Support)(Amendment) Regulations 2015 NOVEMBER 2015 Contents Executive summary... 3 Introduction... 8 Overview of the proposed policy
LSBF Careers Report. Are UK professionals looking to change careers?
 LSBF Careers Report Are UK professionals looking to change careers? Foreword by Dr. Steve Priddy What we wanted to find out from this survey was how satisfied British professionals are with their current
Child Obesity and Socioeconomic Status
 NOO data factsheet Child Obesity and Socioeconomic Status September 2012 Key points There are significant inequalities in obesity prevalence for children, both girls and boys, and across different age
Tuition fees for graduate medical students in England
 Tuition fees for graduate medical students in England 21 st November 2005 Report submitted to the Southampton BMA Intra-School Committee Authors: Hannah Brotherstone & Jeremy Durston (Graduate entry medical
Income Tax Liabilities Statistics 2012-13 to 2014-15
 Coverage: United Kingdom Theme: The Economy Released: 13 February 2015 Next Release: May 2015 Frequency of release: Twice yearly (Jan/Feb and Apr/May) Income Tax Liabilities Statistics 2012-13 to 2014-15
Impact of the recession
 Regional Trends 43 21/11 Impact of the recession By Cecilia Campos, Alistair Dent, Robert Fry and Alice Reid, Office for National Statistics Abstract This report looks at the impact that the most recent
Education & Culture Committee Call for Evidence: Universities Scotland Submission
 Education & Culture Committee Call for Evidence: Universities Scotland Submission Availability and Balance of Student Support in Scotland 1. Universities Scotland, as the representative body of Scotland
When You Are Born Matters: The Impact of Date of Birth on Child Cognitive Outcomes in England
 When You Are Born Matters: The Impact of Date of Birth on Child Cognitive Outcomes in England Claire Crawford Institute for Fiscal Studies Lorraine Dearden Institute for Fiscal Studies and Institute of
Revised GCSE and equivalent results in England, 2014 to 2015
 Revised GCSE and equivalent results in England, 2014 to 2015 SFR 01/2016, 21 January 2016 Attainment in the headline 5+ A*-C including English and maths measure is stable in 2015 Percentage of pupils achieving
Careers Destinations Project Phase 1 Report
 Careers Destinations Project Phase 1 Report Dr Lisa Morrison Coulthard Lead Policy Advisor Background: In August 2011, the Society launched a longitudinal study to determine the career destinations of
Foundation Programme 2014 Recruitment Stats and Facts Final report December 2014
 Foundation Programme 2014 Recruitment Stats and Facts Final report December 2014 Summary information for FP and AFP 2014 recruitment 1. Applications submitted: A total of 7974 applications were submitted,
SMALL BUSINESS EQUITY INVESTMENT TRACKER
 SMALL BUSINESS EQUITY INVESTMENT TRACKER 2016 2 BRITISH BUSINESS BANK SMALL BUSINESS EQUITY INVESTMENT TRACKER 2016 3 CONTENTS 3 EXECUTIVE SUMMARY 6 INTRODUCTION 7 ABOUT BEAUHURST 8 CHAPTER 1: TRENDS IN
The size and structure
 The size and structure of the adult social care sector and workforce in England, 2015 September 2015 Acknowledgements We are grateful to many people who have contributed to this report. Particular thanks
The strategy should deliver improved participation of under-represented groups.
 SEN15D018 Title: WIDENING PARTICIPATION STRATEGY 2016-20 Author: Dr Louise Bohn (Assistant Head of Outreach) Date: 9.2.16 Circulation: Senate 17 February 2016 Agenda: SEN15A003 Version: Final Status: Open
Sports Coaching in the UK III. A statistical analysis of coaches and coaching in the UK
 Sports Coaching in the UK III A statistical analysis of coaches and coaching in the UK January 2011 Contents Executive Summary... 3 1. Introduction... 5 2. Participation in Sport... 6 3. Use of Coaching...
Educational Analytics Dashboard
 Educational Analytics Dashboard Contents 1. Introduction... 2 2. Accessing and running the dashboard... 3 3. Using the Dashboard... 4 Applications, Offers, Accepts and Enrolments... 5 National League Table
UK Commission s Employer Perspectives Survey 2012. Executive Summary 64 December 2012
 UK Commission s Employer Perspectives Survey 2012 Executive Summary 64 December 2012 UK Commission s Employer Perspectives Survey 2012 Jan Shury, David Vivian, Katie Gore, Camilla Huckle, IFF Research
widening access to university
 Widening access to university Widening access is about creating opportunities for individuals not postcodes or data-zones. Summary of Universities Scotland s position Every one of Scotland s universities
The Office of Public Services Reform The Drivers of Satisfaction with Public Services
 The Office of Public Services Reform The Drivers of Satisfaction with Public Services Research Study Conducted for the Office of Public Services Reform April - May 2004 Contents Introduction 1 Executive
Strategic Plan 2015-2020
 Strategic Plan 2015-2020 OFFA Strategic Plan 2015-2020 About this document This new strategy sets out the Office for Fair Access (OFFA s) vision for the period 2015 to 2020. It describes: our aims how
University Business & Start-up Support
 University Business & Start-up Support Below you will find a list of business and start-up support offer by Santander UK partner Universities: University of Aberdeen Scottish Institute for Enterprise Link:
IV. DEMOGRAPHIC PROFILE OF THE OLDER POPULATION
 World Population Ageing 195-25 IV. DEMOGRAPHIC PROFILE OF THE OLDER POPULATION A. AGE COMPOSITION Older populations themselves are ageing A notable aspect of the global ageing process is the progressive
North East Surrey College of Technology (NESCOT) Access Agreement 2016-2017
 Access Agreement 2016-2017") North East Surrey College of Technology (NESCOT) Access Agreement 2016-2017 Summary This Access Agreement sets out how North East Surrey College of Technology (Nescot) plans to widen access to Higher Education
North East Surrey College of Technology (NESCOT) Access Agreement 2016-2017 Summary This Access Agreement sets out how North East Surrey College of Technology (Nescot) plans to widen access to Higher Education
Age, Demographics and Employment
 Key Facts Age, Demographics and Employment This document summarises key facts about demographic change, age, employment, training, retirement, pensions and savings. 1 Demographic change The population
Recognition of UK degrees in Singapore
 Contents 1 General 2 Bona fide status of institutions 2a Association of Commonwealth Universities 3 Recognition by professional bodies 3a Accountancy 3b Architecture 3c Dentistry 3d Engineering 3e Land
Undergraduate Admissions Statistics. 2012 cycle
 Undergraduate Admissions Statistics 2012 cycle Published May 2013 Undergraduate Admissions Statistics 2012 cycle The following tables and charts are produced annually and are intended to provide a statistical
Student Living Index 2016 QUANTITATIVE STUDY AMONG UNIVERSITY STUDENTS IN THE UK
 Student Living Index 2016 QUANTITATIVE STUDY AMONG UNIVERSITY STUDENTS IN THE UK Initial headlines Key Findings Portsmouth has topped the Student Living Index charts as the most cost effective city. Students
Colliers UK Hotel Market Index
 Colliers UK Hotel Market Index 1 Colliers UK Hotel Market Index INTRODUCTION This is the first edition of the Colliers UK Hotel Market Index. The UK Hotel Market Index (UKHMI) is an innovative market tracking
THE WELSH GOVERNMENT. Loan, Grant and Fee Rates for Full and Part-Time Higher Education Study in Academic Year 2014/15
 To: Local Authorities in Wales (For the attention of Student Finance Officers). Higher Education Institutions in Wales providing designated Higher Education courses. Further Education Institutions in Wales
Statistical First Release
 Statistical First Release Revised GCSE and equivalents results in England, 2013 to 2014 Reference SFR 02/2015 Date 29 January 2015 Coverage England Theme GCSEs (key stage 4) Issued by Department for Education,
Investigating the Accuracy of Predicted A Level Grades as part of 2009 UCAS Admission Process
 RESEARCH PAPER NUMBER 37 Investigating the Accuracy of Predicted A Level Grades as part of 2009 UCAS Admission Process JUNE 2011 Authors: Nick Everett and Joanna Papageorgiou, UCAS The views expressed
Profile of Black and Minority ethnic groups in the UK
 Profile of Black and Minority ethnic groups in the UK David Owen, University of Warwick Ethnic composition of the population in 2001 The 2001 Census of Population provides the most up-to-date and comprehensive
POPULATION AND MIGRATION ESTIMATES NORTHERN IRELAND (2013) STATISTICAL REPORT
 STATISTICAL REPORT") POPULATION AND MIGRATION ESTIMATES NORTHERN IRELAND (2013) STATISTICAL REPORT 9.30am Thursday 26 June 2014 Key Points Northern Ireland population at 30 June 2013 is estimated to be 1.830 million people.
POPULATION AND MIGRATION ESTIMATES NORTHERN IRELAND (2013) STATISTICAL REPORT 9.30am Thursday 26 June 2014 Key Points Northern Ireland population at 30 June 2013 is estimated to be 1.830 million people.
Migration indicators in Kent 2014
 Business Intelligence Statistical Bulletin September 2015 Migration indicators in Kent 2014 Related information The and Census web page contains more information which you may find useful. change presents
Chapter 1: Introduction to the UK higher education system. A brief history
 Chapter 1: Introduction to the UK higher education system A brief history Higher education in the United Kingdom (UK) has a long history. Teaching in the city of Oxford is documented from 1096, making
Secondary Analysis of the Gender Pay Gap. Changes in the gender pay gap over time
 Secondary Analysis of the Gender Pay Gap Changes in the gender pay gap over time March 2014 Department for Culture, Media & Sport Department for Culture, Media & Sport 3 Contents Chapter 1: Introduction...
Medical Schools Entry Requirements (June 2011)
") Medical Schools Entry Requirements (June 2011) Until quite recently many medical schools would not allow both Mathematics and Further Mathematics qualifications to count towards meeting their offers. Fortunately
Medical Schools Entry Requirements (June 2011) Until quite recently many medical schools would not allow both Mathematics and Further Mathematics qualifications to count towards meeting their offers. Fortunately
How To Write A Benchmarking Statement For Accounting
 Accounting 2007 The Quality Assurance Agency for Higher Education 2007 ISBN 978 1 84482 672 1 All QAA's publications are available on our website www.qaa.ac.uk Printed copies of current publications are
Current and Proposed Higher Education Student Finance Arrangements in the UK Regions
 Research and Information Service 13 th May 2011 Eoin Murphy Current and Proposed Higher Education Student Finance Arrangements in the UK Regions NIAR 435-2010 This paper examines the existing Higher Education
Equality Impact Assessment Support for Mortgage Interest
 Welfare and Wellbeing Group Equality Impact Assessment Support for Mortgage Interest Planned change to the standard interest rate at which Support for Mortgage Interest is paid August 2010 Equality Impact
Coherence of UK Research & Development Statistics
 Information note Coherence of UK Research & Development Statistics Christopher Steer Abstract This information note examines the coherence between Office for National Statistics (ONS) estimates of research
TRENDS IN UNDERGRADUATE RECRUITMENT
 IN FOCUS Universities UK THE FUNDING ENVIRONMENT FOR UNIVERSITIES 2014 TRENDS IN UNDERGRADUATE RECRUITMENT HIGHER EDUCATION IN FOCUS Contents Summary and key findings... 2 Key points... 2 Introduction...
HIGHER EDUCATION. Student Finance - The Education (Student Support) (Amendment) Regulations 2014: Equality Analysis OCTOBER 2014
 (Amendment) Regulations 2014: Equality Analysis OCTOBER 2014") HIGHER EDUCATION Student Finance - The Education (Student Support) (Amendment) Regulations 2014: Equality Analysis OCTOBER 2014 Contents Contents... 2 Introduction... 4 1. Policy changes covered in this
HIGHER EDUCATION Student Finance - The Education (Student Support) (Amendment) Regulations 2014: Equality Analysis OCTOBER 2014 Contents Contents... 2 Introduction... 4 1. Policy changes covered in this
Full report - Women in the labour market
 Full report - Women in the labour market Coverage: UK Date: 25 September 2013 Geographical Area: UK Theme: Labour Market Key points The key points are: Rising employment for women and falling employment
Undergraduate Admissions Statistics. 2013 cycle
 Undergraduate Admissions Statistics 2013 cycle Published May 2014 Undergraduate Admissions Statistics 2013 cycle The following tables and charts are produced annually and are intended to provide a statistical
The value of apprenticeships: Beyond wages
 The value of apprenticeships: Beyond wages NIDA BROUGHTON June 2016 There is strong political commitment to the apprenticeships programme as a part of the strategy to achieve a high quality workforce that
Education: Historical statistics
 Education: Historical statistics Standard Note: SN/SG/4252 Last updated: 27 November 2012 Author: Paul Bolton Social & General Statistics The organisation of every stage of education has undergone significant
Voluntary Issues. Scottish Household Survey Analytical Topic Report: Volunteering
 Voluntary Issues Scottish Household Survey Analytical Topic Report: Volunteering SCOTTISH HOUSEHOLD SURVEY ANALYTICAL REPORT: VOLUNTEERING Norma Hurley, Lindsay Wilson, Ian Christie Blake Stevenson Ltd
English Housing Survey Headline Report 2014-15
 English Housing Survey Headline Report 214-15 Contents Introduction and main findings Section 1: Households Section 2: Housing stock Technical notes and glossary Introduction and main findings 1. English
COUNTRY NOTE GERMANY
 Education at a Glance 2011 OECD Indicators DOI: http://dx.doi.org/10.1787/eag-2011-en OECD 2011 Under embargo until 13 September, at 11:00 Paris time COUNTRY NOTE GERMANY Questions can be directed to:
TYPICAL IB ENTRY REQUIREMENTS FOR ECONOMICS DEGREE COURSES FOR UK UNIVERSITIES 2013
 This document is entirely based from the website: www.ucas.com so you should go to the websites of universities for the full details. 1) Blue for courses would be happy only with mathematics (sometimes
Non-completion at the University of North London and London Guildhall University: a case study
 Full Report Non-completion at the University of North London and London Guildhall University: a case study Bahram Bekhradnia & Libby Aston January 2005 Higher Education Policy Institute 1 Executive summary
Undergraduate Admissions Statistics. 2014 cycle
 Undergraduate Admissions Statistics 2014 cycle Published May 2015 Undergraduate Admissions Statistics 2014 cycle The following tables and charts are produced annually and are intended to provide a statistical
Exploring the UK Freelance Workforce in 2015
 Exploring the UK Freelance Workforce in 2015 Executive Summary John Kitching April 2016 Introduction Freelance workers are an important, but hidden, part of the small business population. United Kingdom
Climate change, justice and vulnerability
 Climate change, justice and vulnerability November 2011 Findings Informing change Climate change is expected to increase the frequency and intensity of extreme weather-related events in the UK, such as
Wakeham Review of STEM Degree Provision and Graduate Employability Annexes B-H
 Wakeham Review of STEM Degree Provision and Graduate Employability Annexes B-H Contents Annex B - Wakeham Review Terms of Reference... 3 Annex C - Accreditation case studies... 5 Annex D - Additional information
Patterns of higher education institutions in the UK:
 Patterns of higher education institutions in the UK: Seventh report This publication has been supported by Embargo til 00:00 hrs Thursday 13 September 2007 Patterns of higher education institutions in
Electoral Registration Analysis
 31 July 2013 Electoral Registration Analysis Analysis of factors driving electoral registration rates in local authorities in England and Wales This document is available in large print, audio and braille
Maidstone is the largest district in Kent with a resident population of 155,143. This grew by 11.7% between 2001 and 2011.
 Census 2011 Briefing Ethnicity & National Identity The 1991 Census was the first census to include a question about ethnic background to monitor equal opportunities /anti-discrimination policies. Over
Estimating differences in public and private sector pay
 Estimating differences in public and private sector pay Andrew Damant and Jamie Jenkins, July 2011 Summary It is difficult to make comparisons of the two sectors because of differences in the types of
June 2015. Federal Employee Participation Patterns in the Thrift Savings Plan 2008-2012
 June 2015 Federal Employee Participation Patterns in the Thrift Savings Plan 2008-2012 Federal Employee Participation Patterns in the Thrift Savings Plan, 2008-2012 Executive summary This report examines
Destination Measures: Technical notes
 Destination Measures: Technical notes January 2014 Contents Table of figures 4 Background 5 Definition of Destination Measures 5 Cohort 5 Key stage 4 (KS4) 5 Key stage 5 (KS5) 6 Alignment with Performance
RR887. Changes in shift work patterns over the last ten years (1999 to 2009)
") Health and Safety Executive Changes in shift work patterns over the last ten years (999 to 009) Prepared by Office for National Statistics for the Health and Safety Executive 0 RR887 Research Report Crown
Health and Safety Executive Changes in shift work patterns over the last ten years (999 to 009) Prepared by Office for National Statistics for the Health and Safety Executive 0 RR887 Research Report Crown
Monthly UK Hotel Trends February 2012
 Monthly UK Hotel Trends February 12 February 12 Summary of performance Hotel type / location Available Occupancy (%) AARR ( ) Rooms Yield ( ) rooms/day 12 11 % ch. 12 11 % ch. 12 11 % ch. Total UK Feb
The Social Dimensions of the Crisis: The Evidence and its Implications
 The Social Dimensions of the Crisis: The Evidence and its Implications Executive Summary ii Executive Summary iii The economic crash of 2008 has had profound social impacts, exacerbated by the subsequent
Private Sector Employment Indicator, Quarter 1 2015 (February 2015 to April 2015)
") STATISTICAL RELEASE Date: 14 July 2015 Status: Experimental Official Statistics Coverage: England; Regions Private Sector Employment Indicator, Quarter 1 2015 (February 2015 to April 2015) 1. Introduction
STATISTICAL RELEASE Date: 14 July 2015 Status: Experimental Official Statistics Coverage: England; Regions Private Sector Employment Indicator, Quarter 1 2015 (February 2015 to April 2015) 1. Introduction