St James's Ward Profile
|
|
|
- Roland Welch
- 7 years ago
- Views:
Transcription
1 Ward Profile May 2014 For further information about the Ward Profiles please contact the Intelligence and Analysis Team, Strategy and Communications Sian Melhuish: (Main contact) Damian Highwood: (Intelligence and Analysis Manager)
 Damian Highwood: 020 7641 3283 dhighwood@westminster.gov.")
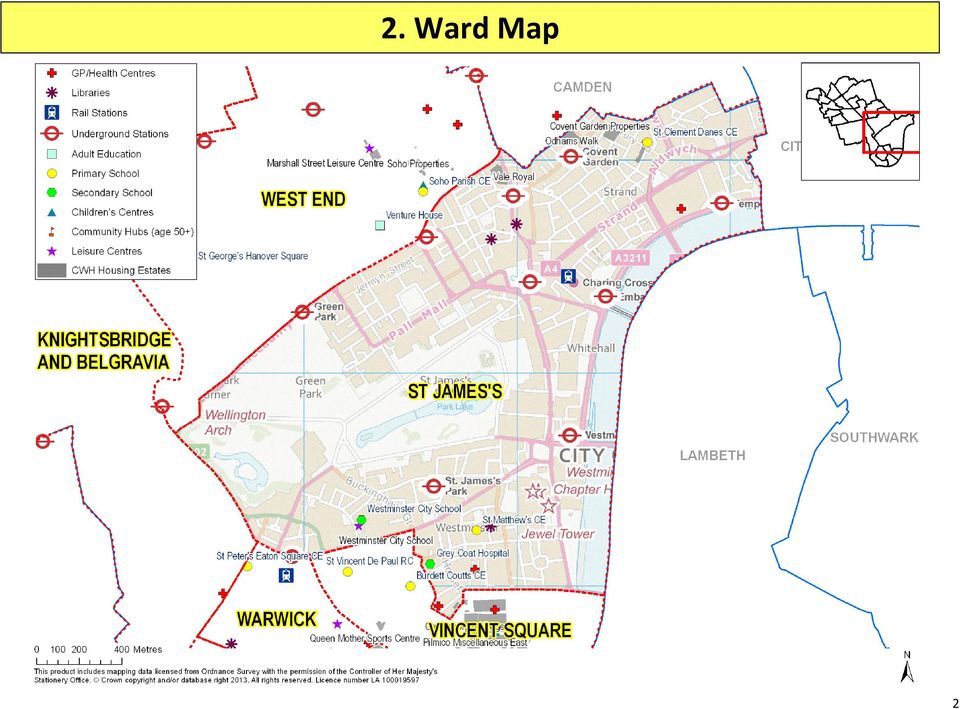
2 Index 1. Ward Information 2. Ward Map 3. Summary Chart 4. Population 5. Ethnicity/Nationality 6. Deprivation 7. Unemployment 8. Employment and Qualifications 9. Schools and Education 10. Housing 11. Household Composition 12. Crime, Disorder and Community Cohesion 13. Health and Wellbeing 14. Infrastructure, Service Usage and Satisfaction 15. Vulnerable Adults and Children 16. Transport, Travel and Visitors 17. Sources 1. Ward Information Ward Councillors Louise Hyams Tim Mitchell Cameron Thomson Conservative Conservative Conservative ward is home to Buckingham Palace, the Palace of, Abbey and Park. The area to the north of Park is predominantly commercial with some of the highest rents in London and, consequently, the world. Corporate offices in include the global headquarters of BP. The auction house Christie's is based in King Street, and the surrounding streets contain a great many upmarket art and antique dealers. The north of the ward encompasses Covent Garden and the Strand with their many theatres and tourist attractions. Based on the latest population figures the ward has 11,553 residents making up 5.2% of the total population. 1

3 2. Ward Map 2
4 Ward Ward WCC Range WCC Range Indicator Number Value WCC Avg From To Population 1 Population Size 11,553 11,193 8,437 13,247 Income and Deprivation Unemployment Housing 2 % Households in at least 1 dimension of deprivation 3,092 58% 61% 82% 39% 3 Average Household Income 40,258 38,567 25,355 46,969 4 % Lone Parents Not in Employment 72 44% 58% 68% 44% 5 % Worklessness (working age) 985 8% 9% 20% 1% 6 % Job Seekers Allowance Claimants 335 3% 2% 5% 0.1% 7 % Incapacity Claimants 415 5% 6% 12% 0.3% 8 Average Property Price 1,261,260 1,013, ,342 2,853,307 9 % of Social Renters 1,496 28% 26% 56% 4% 10 % Long-Term Vacant Dwellings 121 2% 2% 7% 1% 11 % Second Homes Located in the Area % 6% 0% 18% 12 % Living Alone 2,774 52% 45% 56% 33% 13 % of Over Crowded Households 479 9% 12% 22% 5% 14 % Households with Dependent Children % 19% 32% 9% Education 15 % Students with 5+ GCSEs A*-C in Eng & Maths 52% 68% 50% 93% Health Safety and Satisfaction 3. Summary Chart 16 % in Bad Health 528 5% 6% 11% 2% 17 Male Life Expectancy (age) Female Life Expectancy (age) Male Premature Mortality Ratio Female Premature Mortality Ratio % Feeling Safe in the Area in Which They Live 100% 97% 87% 100% 22 % Feel People from Different Backgrounds Get on Well 87% 85% 61% 95% 23 % Satisfied with the Area as a Place to Live 95% 94% 85% 100% 24 All Crime per 100 Residents 13,


5 Age 0-3 Age 4-10 Age Age Age Age Age Age Age Age 85 plus ,497 1,801 1,172 3, Population In April 2012, the population in ward reached 11,553 people. This accounts for 5.2% of the total population and is higher than other wards. The population has increased by 7% since March saw an increase of 2%. Compared to the average, has: o a similar proportion of people aged over 65 (11%) o a much higher proportion of working age adults (80%) o a much lower proportion of under 16s (8%) The majority of residents have lived in this ward between 3-10 years which is higher than the average. Length of Time Living in the Borough, City Survey and over Proportion of Population by Five Year Age Groups and Gender, MYE ONS, 2012 (M) (F) Males Females 8% 6% 4% 2% 0% 2% 4% 6% 8% 0% 5% 2% Less than 3 months Number of People per Age Group 33% 14% 9% 11% 24% 3-12 months 1 to 2 years 3 to 5 years 6 to 10 years 11 to 15 years 16 to 20 years More than 20 years 5,000 4,000 3,000 2,000 1,
 o a much higher proportion of working age adults (80%) o a much lower proportion of under 16s (8%) The majority of")
6 Church Street Westbourne Queen's Park Harrow Road Hyde Park Regent's Park Bryanston and Maida Vale Churchill Little Venice Abbey Road Lancaster Gate West End Bayswater Knightsbridge Marylebone Vincent Square Warwick Tachbrook Simpson Diveristy Index Score 5. Ethnicity/Nationality is not as ethnically diverse compared to the City as a whole. The ward is ranked in the top 5.2% of England according to its Simpson Diversity Index Score (ONS 2012). The main ethnic group in is White: British which makes up 45% of the ward population. This is much higher than the average of 35%. 29% of residents are from non-white ethnic groups. Just over half of the wards residents were born in the UK (51%). The 3 main places outside of the UK where residents were born are: o EU countries (14%) o Eastern Asia (5%) o North America (5%) Other than English (which is spoken by 67% of the ward population), the other main languages are: o Arabic o Persian/Farsi o Japanese o French o Spanish Detailed Ethnic Breakdown Count % of ward % of WCC White: British 4,880 45% 35% White: Other Western European 684 6% 7% Asian: Chinese 664 6% 3% Black: African 370 3% 4% Other: Arab 300 3% 7% White: Italian 286 3% 2% White: European Mixed 271 3% 3% Asian: Indian 267 3% 3% White: Irish 263 2% 2% White: North American 209 2% 2% Mixed: White and Asian 164 2% 2% Asian: Bangladeshi 158 2% 3% White: Commonwealth of (Russian) Ind. States 157 1% 1% White: Australian/New Zealander 121 1% 1% Asian: Japanese 107 1% 1% Black: Caribbean 98 1% 2% Asian: Pakistani 85 1% 1% White: Greek 82 1% 1% Source: 2011 Census 5
.")
7 6. Deprivation The 2011 Census collected information to classify households by four dimensions of deprivation; Employment, Education, Health and disability, and Household overcrowding. In 42% of households are not deprived in any dimension. The Index of Multiple Deprivation (2010) places 17% of the ward in the top 15% most deprived in England. The Income Deprivation Affecting Children Index (2010) shows that, on average, 23% of children live in income deprived households. Another measure of deprivation is the proportion of children who are eligible for free school meals. In 2013, in, 35% of children going to schools were eligible to receive free meals. A measure of deprivation in older people is those claiming pension credits. Of the residents aged 60 or over, 18% were claiming pension credits in August In 2014, 32% of households in earned more than 55,000 a year. Deprivation Dimensions: Census % 37% 15% 1% 5% 39% 35% 17% 7% 2% 0% 25% 50% 75% 100% Not Deprived in Any Dimension Deprived in 1 Dimension Deprived in 2 Dimensions Deprived in 3 Dimensions Deprived in 4 Dimensions Household Income: CACI Paycheck, 2014 Proportion of Pupils Receiving Free School Meals 18% 25% 26% 32% 50% 40% 30% 20% 10% 0% % 25% 26% 32% 0% 25% 50% 75% 100% Under 20K 20-35K 35-55k 55k+ 6

 7. Unemployment In August 2013, the workless rate in ward was 7.7% (985 people) which is lower than the average of 8.6%.")
8 Queen's Park Harrow Road Church Street Churchill Westbourne Vincent Square Warwick Maida Vale Tachbrook Bayswater West End Lancaster Gate Little Venice Bryanston and Hyde Park Marylebone Abbey Road Regent's Park Knightsbridge Claimant count Claimant rate (%) 7. Unemployment In August 2013, the workless rate in ward was 7.7% (985 people) which is lower than the average of 8.6%. There were 415 claimants of Employment Support Allowance/Incapacity Benefit (ESA/IB) within the ward. The ESA/IB claimant rate is 4.6%, which is lower than the average of 5.5%. The area has a lower proportion of its workless population who are lone parents (0.2% of the working age population) compared to the rest of. In August 2013, the Job Seekers Allowance (JSA) claimant rate in was 2.6%. This is higher than the city rate of 2%. The number of JSA claimants has decreased by -4% from the previous year from 350 claimants in August 2012 to 335 in August London England Count Rate Count Rate Rate Rate Jobseeker's allowance , ESA and IB , Lone parents , Other , Out-of-Work Benefits , Sources: NOMIS and DWP August 2013 Worklessness Job Seekers Allowance, Source: ONS Type of Benefit Claimed, August Claimant Count Claimant Rate 6% 5% 4% 3% 2% 1% 0% 4% 3% 3% 31% JSA ESA & IB Lone Parents Carers 54% Others on income related benefits 7
 compared to the rest of.")
9 No Qualifications Level 1: 1+ GCSEs (any grades), NVQ Level 1, or equivalent Level 2: 5+ GCSE A*-C, 1+ A-levels/AS-levels, NVQ Level 2, or equivalent Trade Apprenticeship Level 3: 2+ A-Levels, 4+ AS- Levels, NVQ Level 3 or equivalent Level 4 plus: First degree, Higher Degree, NVQ Level 4-5, or equivalent Other vocational/work related qualifications Part-time Full-time Self-Employed Unemployed Students Retired Student Looking after home Long term sick Other 8. Employment and Qualifications At the time of the 2011 Census, 70% of residents were economically active, which was higher than the average of 69% and lower than the London rate of 72%. Of the economically active residents, the majority were employed fulltime. Of the economically inactive residents, the majority were students (including full-time Students). The majority of residents who are in employment are likely to work full-time doing 31 to 48 hours a week. Those living in this area are more likely to be highly qualified (degree or above). 50% 40% 30% 20% 10% 0% Proportion of working age population who are Economically Active 46% and Inactive, Census % 5% 7% 12% 13% 4% 5% 3% 3% 7% 7% 12% 10% 3% 5% 4% 5% 4% 4% Economically active Economically inactive Top 5 Occupations Source: Census 2011 Associate Professional & Technical Occupations Professional Occupations Managers, Directors & Senior Officials Administrative & Secretarial Occupations Elementary Occupations Top 5 Industries Financial & Insurance Activities 60% 50% 40% 30% 20% 10% 0% Highest Level of Qualification, Census % 50% 11% 13% 7% 9% 10% 7% 8% 9% 1% 1% 12% 13% Professional, Scientific & Technical Activities Public Administration & Defence; Compulsory Social Security Accommodation & Food Service Activities Wholesale & Retail Trade; Repair of Motor Vehicles/Cycles Source: Census


10 9. Schools and Education In 2012, the majority of primary school pupils attended schools rather than schools outside the City or were being privately educated. However, the majority of secondary school pupils in this ward were either educated privately or educated outside of the Tri-borough. The main Tri-borough primary school attended by residents was St Matthew`s School, and the main secondary school was Pimlico Academy. During a child s early years at school a measure of their personal, social and emotional development as well as communication, language and literacy skills is scored. For St James's residents attending a school, the average score was lower than the average in % of resident pupils attending primary schools achieved at least level 4 in their Key stage 2 for both English and Maths in At secondary schools, pupils are instead performing below the average for GCSE results with 52% achieving at least 5 GCSE grades A* to C including Maths and English. The ward's grades were not as good compared to last year (72%). Main Primary Schools 2012 Primary pupils St Matthew`s School 51 Burdett Coutts Primary 47 Millbank 35 St Clement Dane`s CofE 33 Soho Parish CofE 33 St Vincent de Paul RC 26 St Peter`s Eaton Square 16 Source: WCC Children and Young People Qualification Level Achieved Location of Schools Attended 100% 75% 50% 25% 0% 61% 65% 78+ Early years inc. 6+ PSED & CLL 92% 92% 87% 85% 86% 81% Level 4+ Key stage 2 English Level 4+ Key stage 2 Maths Level 4+ KS2 Both Maths & English 52% 69% 5 GCSE A*-C inc. Maths & English Primary 4 1% 83 23% % 3 1% 10 3% Secondary 13 4% % % Attends school Attends other Tri-borough school Attends school outside of Tri-borough or privately educated Attends special needs school or alternative provision 9

11 10. Housing ward contains 5,343 residential properties. This is 5.1% of s total housing stock. Residents of are more likely to rent privately rather than own their property or live in the social rented sector. City West Homes manage 463 units in the ward. Under half (49%) of residents living in their properties are lessees. The largest CWH housing area in the ward is Martlett Court. The 2011 census recorded 2,165 (41%) privately rented households in St James's. In February 2014, both 1 and 2 bed household rents were more expensive than the average. The median average rent for a 1 bed household was 467 per week and a 2 bed household was 650. In February 2014, the average property price in was greater than the average. It increased from the previous year and is currently worth 1,261,260. During 2011, there were fewer than 8 mortgage repossession claims leading to orders, and approximately 50 landlord repossessions in the ward. In March 2014, Council Tax records show that 2% of properties in were long term empty or vacant. Council Tax also shows that there were more people who owned second homes located in this ward compared to other wards in. 711 properties were recorded as a second home, 13% of all households in the area. 2,734 people whose main home is located in the ward have a second address elsewhere in the UK or abroad. Based on the 2011 census, the ward has 61 communal establishments with 1,263 people living in them. o Medical and care establishments: 4 o Hotel, Guest House, B&B, Youth Hostel: 13 o Hostel or temporary shelter for the Homeless: 7 o All other establishments: Census: Tenure 1,400,000 1,200,000 1,000, , , , ,000 0 Average Property Price, Hometrack London England Count % % % % Owned: Outright Owned: With a mortgage Shared ownership Social rented: From Council Social rented: Other 1, Private rented: Landlord or letting agency 1, Private rented: Other Living rent free Total 5, Source: 2011 Census, ONS February 2010 February 2011 February 2012 February 2013 February
 privately rented households in St James's. In February 2014, both 1 and 2 bed household rents were more expensive than the average.")
12 1 Person 2 People 3 People 4 People 5 People 6 People 7 People 8 People plus Number of households 11. Household Composition In the most common household size is one person per household. Despite having a large proportion of single households, there are a number of families living in. No Dependent Children in Family 5343 of the households in this ward live as families. 11% of households have dependent children 6% of households have lone parents 31% of households are living as a couple (married, civil partnership or cohabiting) 17% of households have the household reference person in the Census as aged 65 years and older The occupancy rate suggests that: o 54% have the just the right number of bedrooms for their composition o 37% of households are under occupying their property o 9% of households are over-crowded Over-crowding here seems to be less of a problem compared to the rest of, where the over occupancy rate is 12%. 3,000 2,500 2,000 1,500 1, Number of People in Household, Census ,774 1, Census: Household Living Arrangements Count % % One person aged under % 35% Two adults aged 16 to 64 and no children % 22% One person aged 65 and over % 10% Three or more adults and no children 489 9% 10% Two adults with at least one aged 65+ and no children 289 5% 6% Two adults and one or two children 273 5% 8% No adults or one adult and one or more children 110 2% 4% Three or more adults and one or more children 101 2% 3% Two adults and three or more children 46 1% 2% 2011 Census: Households with dependent children Count % % No dependent children % 81% 1 dependent child 314 6% 9% 2 dependent children 189 4% 6% 3 plus dependent children 86 2% 4% Source: 2011 Census Number of children Age of youngest dependent child or more Age Age Age

13 Mar 2013 Jun 2013 Sep 2013 Dec 2013 Mar Crime, Disorder and Community Cohesion ward had 13,481 crimes reported in the past year which equates to crimes per 100 population. This is higher than the average of 24.1 crimes per 100 population and is higher than the London average of 0.0. These rates do not necessarily indicate how likely ward residents are to become victims of crime. Higher crime and ASB levels are expected in due to the area's tourist attractions, theatres, shops and restaurants. It has a vast number of visitors and a thriving night time economy. Crime levels in the past year ending March 2014 have decreased by 8% compared to the previous year in ward compared with a 13% decrease in overall. The number of residential burglaries for this ward has decreased by 19% compared to the previous year (39 compared to 48), this compares to the whole of where burglaries decreased by 7%. According to the City Survey, 2013, residents of perceive the top ASB issues to be: o Noisy building sites o Rubbish/litter o Homeless/begging o Noisy pubs/clubs o Noisy neighbours There were 2,177 London ambulance service attendances to alcohol related incidents in in the past year, this equates to 33.3% of the total for this type of incident. London Fire Service attendances to primary and secondary fires in the year ending March 2014 was 151, 16.0% of the total. The City Survey found that 100% of respondents felt safe in the area they lived and if walking alone after dark this changed to 72%. The City survey found that 87% of residents felt that the local area was a place where people from different backgrounds get on well together. This is higher than the City average of 85%. Annual Service Statistics Count Rate Count Rate Ambulance attendances for alcohol related incidents 2, , Fire service attendances for primary and secondary fires All notifiable offences 13, , Violence against the person 1, , Criminal damage , Robbery , Burglary in a Dwelling* , Drug crime 1, , Theft and Handling 8, , Sources: Met Police published CRIS data, Ambulance and Fire data from SafeStats London * Rate based per 100 households rather than 100 residents 16,000 14,000 12,000 10,000 8,000 6,000 4,000 2,000 0 All Recorded Crimes: Rolling year total number of crimes for month ending Rolling year crime total Trend 12


14 Age 13. Health and Wellbeing The 2011 census showed that 5% of the ward population felt they were in bad or very bad health which is similar to the average of 6%. The census also recorded 13% of the wards population as having a long-term limiting illness, lower than the average of 14%. In August 2013, 450 people in claimed Disability Living Allowance (DLA) which represents approximately 3.9% of the ward population. 95 Life Expectancy from Birth Male Female 425 people claimed under the care element of DLA and 400 people claimed for the mobility element (people can receive both elements). Life expectancy from birth is estimated using probability of survival, mortality and population for each age group between In this ward, life expectancy is lower than the average for males but for females the life expectancy is higher; however confidence ranges vary depending on the frequency of instances The premature mortality ratio is a comparison of observed deaths with the number of expected deaths in the population aged under 75. In, whilst the male ratio was higher than the average, the female ratio was lower than the average. The GLA Well-being index (2012) is based on a number of measures including health, economic security, safety, families, accessibility and community. is ranked 193 out of 625 London wards which means it records a well being score in the top 50% of London Approximately 87% of adults took part in one or more sessions of sport or active recreation per week which is better than the average (81%) (Sport England, 2008). 65 Proportion of the Ward in Good or Bad Health, Census % 1% 4% Very Good Health 60 average Good Health Fair Health 31% 54% Bad Health Very Bad Health 13
.")
.")
15 14. Infrastructure, Service Usage and Satisfaction After taking into account new developments, changes of use and residential conversions, there was a net gain of 99 units in the ward during the year ending March 2012, this represents 11.6% of all housing completions. In, 31% of the area is open space (Source: Greenspace Information for Greater London, GLA). 0% of homes have good access to nature; however, 4% of homes are deficient in access to a local, small pocket park. Based on the City Survey, 2013, it is estimated that 60% of the ward residents had used parks and open spaces in the area and they were less likely to use them compared to other wards. Of those who used them, 91% were satisfied with them which was a higher score than the average. By October 2012, approximately 9% of the wards population were active library members, however, the City Survey found that 41% of the ward used the libraries and 60% of them were satisfied with the service. The City Survey found there was poor use of swimming and sports facilities with 13% using them in the past three months leading up to the survey. The satisfaction was also lower than other wards. 88% are satisfied with the way City Council is running the area and 95% are satisfied with the area as a place to live. 40% agreed that they could influence decisions affecting the local area and 42% wanted to be more involved in the decisions the Council makes. For the Local Elections in 2014, 30% of the ward turned out to vote which was lower than the rate of 32% Residential Completions 111 March 2010 March 2011 March % Land Use 2005, Source: DCLG 9% 2% 0% 10% Service Usage and Satisfaction % of users % satisfied Libraries 41% 60% Swimming pools/sports facilities 13% 32% Parks and open spaces 60% 91% On street recycling/bins 62% 87% Door to door recycling 38% 78% Refuse collection 100% 92% Sources: City Survey % 1% 24% 27% Area of Domestic Buildings Area of Domestic Gardens Area of Non Domestic Buildings Area of Road Area of Rail Area of Path Area of Greenspace Area of Water Area of Other Land Uses 14

16 Church Street Hyde Park Churchill Westbourne Abbey Road Little Venice Harrow Road Maida Vale Queen's Park Bryanston and Bayswater Regent's Park Vincent Square Lancaster Gate West End Knightsbridge Warwick Tachbrook Marylebone High Count Proportion (%) 15. Vulnerable Adults and Children 27% of resident primary and secondary school pupils attending a school have specialist educational needs. 21% are children on School Action (where they have additional support to meet their learning difficulties) or School Action Plus (external advice and support) and 6% have statements (a formal document detailing the child s learning difficulties after a statutory assessment). In November 2012, 9 families were assessed as having complex needs. The 2011 Census showed that there are 72 lone parents who are not in employment with dependent children. There is a lower proportion of older people aged 65 plus living in this ward compared to other wards, they make up 11% of the wards population. Those aged 85 plus account for 1.0% of the wards population. 45% of older people aged 65 plus live alone. In August 2012, there were 106 people being supported in the community with older people/physical disability services from Council. This is lower than the average where the number supported is 120. Lone parents not in employment, 2011 Census Special Educational Needs Action/Action plus 21% 26% Statemented 6% 5% Source: Schools and Children WCC 100% 90% Older People Living Alone, 2011 Census Older people living alone Older people not living alone Number in ward Proportion of all lone parents 80% 70% 60% 50% 40% 30% 20% 10% 0% 80% 70% 60% 50% 40% 30% ,352 20% ,035 10% 0% 15
. In November 2012, 9 families were assessed as having complex needs.")
. This compares to the resident population of 11,553.")
17 16. Transport, Travel and Visitors Based on modelled experimental statistics in August 2011, it is estimated that the day time population in reaches approximately 268,200 people (this includes working population, residents at home in the day and visitors). This compares to the resident population of 11,553. There are nine Tube Stations in ward: Charing Cross (also a Rail Station), Covent Garden, Embankment, Green Park, Piccadilly Circus, Leicester Square, St. James's Park, Temple and. The annual entry and exits from the tube stations identified amounts to 214.9million, this represents 8.4% of all of London Underground entries and exits. The Business Register and Employment Survey shows that in 2012, there were 202,400 jobs in the area, this represents 31.5% of all jobs. The main method that residents use to travel to work is on foot; 36% use this method of travel. 36% 4% 1% Method of Travel to Work: 2011 Census 5% 2% 1% 1% 10% 9% 6% 25% Work mainly at or from home by underground/metro/light rail/tram by train by bus, minibus or coach by taxi by motorcycle, scooter or moped by driving a car or van by being a passenger in a car or van by bicycle on foot Other method of travel to work 16

18 17. Sources Population Mid Year Estimates, 2012 Total Population and Population per Age Group, Census 2011 Length of Time Living in the Borough, City Survey 2013 Deprivation Households by Deprivation Dimensions, Census 2011 Index of Multiple Deprivation, Department for Communities and Local Government 2010 Free School Meals, Tri-Borough Children s Services: Schools 2013 Pension Credits, Department of Work and Pensions (DWP): Office for National Statistics 2013 Household Income: CACI Limited: Paycheck data 2014 Unemployment Out of Work Benefits by Type of Claimant,, DWP: Office for National Statistics 2013 Job Seekers Allowance, DWP: Office for National Statistics 2013 Housing City West Homes Households and Lessees, City West Homes 2011 Residential Properties and Tenure, Census 2011 Average Property Price, Hometrack 2014 Average Rents, Hometrack 2014 Repossessions, Ministry of Justice 2011 Second Homes located in Ward, WCC Strategic Finance: Council Tax 2014 Second Homes located outside Ward, Census 2011 Communal Establishments, Census 2011 Household Composition Household size, Census 2011 Households Composition, Census 2011 Families with Dependent Children, Census 2011 Household Living Arrangements, Census 2011 Occupancy Rating (Bedrooms), Census 2011 Infrastructure, Service Usage and Satisfaction Residential Completions, WCC Built Environment: Planning 2012 Land Use, Department for Communities and Local Government from GLA London Data Store 2005 Open Space, Nature and Parks, Greener Information for Greater London GLA London Data Store 2012 Service Usage and Satisfaction, City Survey 2013 Active Library Users, Tri-Borough Libraries and Archives 2012 Council Involvement and Influencing Decisions, City Survey 2013 Electoral Turnout, London Elects from GLA London Data Store 2014 Transport, Travel and Visitors Experimental Day Time Population, WCC Strategic Finance: Intelligence and Analysis 2011 Underground Entry and Exits, Transport for London 2011 Area Employment, Business Register and Employment Survey from GLA London Data Store 2012 Method of Travel to Work, Census 2011 Ethnicity/Nationality Detailed Ethnic Breakdown, Census 2011 Simpsons Diversity Index Score, GLA: London Data Store 2011 Country of Birth, Census 2011 Language Spoken, Census 2011 Employment and Qualifications Economically Active and Inactive, Census 2011 Highest Level of Qualification, Census 2011 Hours Worked, Census 2011 Occupation Classification Major Group, Census 2011 Industry Classification, Census 2011 Schools and Education Primary and Secondary Schools Attended, Tri-Borough Children s Services: Schools 2012 Qualification Level Achieved, Tri-Borough Children s Services: Schools 2012 Health and Wellbeing General Health, Census 2011 Long Term Health Problem or Disability, Census 2011 Disability Living Allowance, DWP 2013 Life Expectancy from Birth, London Health Programmes: Health Needs Assessment Toolkit Premature Mortality Ratio, London Health Programmes: Health Needs Assessment Toolkit Well-being Index, GLA 2010 Sport and Active Recreation, Sport England, 2008 Crime, Disorder and Community Cohesion Ambulance Attendances, SafeStats London 2014 London Fire Brigade Attendances, SafeStats London 2014 Crime Data, Metropolitan Police Service 2014 Feelings of Safety, City Survey 2013 People Get On Well Together, City Survey 2013 Vulnerable Adults and Children Special Educational Needs, Tri-Borough Children s Services: Schools 2012 Troubled Families, Tri-Borough Children s Services: Family Recovery 2012 Older People Living Alone, Census 2011 Lone Parents with Dependent Children, Census 2011 Households Composition, Census 2011 Older People/Physical Disabilities Supported in the Community, Tri-Borough Adult Social Care

This briefing is divided into themes, where possible 2001 data is provided for comparison.
 Information Action 2011 Census Second Release December 2012 Consultation The Office for National Statistics (ONS) has now begun the Second Release of outputs from the 2011 Census at local authority level.
GOWER WARD PROFILE. Information, Research & GIS Team, City and County of Swansea, October 2015
 GOWER WARD PROFILE Information, Research & GIS Team, City and County of Swansea, October 2015 Population: 3,600 (source: mid-2013 estimates, rounded - Office for National Statistics / ONS) Councillors
Seaham Major Centre Area Profile
 Area Profile Crown Copyright. Durham County Council. LA 100019779. 2006 Corporate Research and Information, Durham County Council, County Hall, Durham, DH1 5UF. Tel: 0191 3834340 cri@durham.gov.uk June
Statistics about Bourne, South Kesteven. People Statistics. 32UG012 Bourne Parish is within South Kesteven LAD or UA. Resident Population and Age
 Statistics about Bourne, 32UG012 Bourne Parish is within LAD or UA People Statistics Resident Population and Age The resident population of Bourne as measured in the 2001 Census, was 11,933 of which 48.3
Statistics about Sleaford, North Kesteven. People Statistics. 32UE057 Sleaford Parish is within North Kesteven LAD or UA. Resident Population and Age
 Statistics about Sleaford, 32UE057 Sleaford Parish is within LAD or UA People Statistics Resident Population and Age The resident population of Sleaford as measured in the 2001 Census, was 14,494 of which
Neath Port Talbot County Borough Council. Neighbourhood Profile for Margam Ward
 Neath Port Talbot County Borough Council Neighbourhood Profile for Margam Ward 1 Introduction This profile covers the Margam ward and provides a general overview of the main characteristics of Margam.
Total 50,000 4,509,800 39,865,700 Male 25,000 2,244,900 19,851,500 Female 24,900 2,264,800 20,014,200. Blackpool South (numbers)
") Labour Market Profile - Parliamentary Constituency The profile brings together data from several sources. Details about these and related terminology are given in the definitions section. Resident Population
Labour Market Profile - Parliamentary Constituency The profile brings together data from several sources. Details about these and related terminology are given in the definitions section. Resident Population
Total 49,800 4,509,800 39,865,700 Male 24,900 2,244,900 19,851,500 Female 24,900 2,264,800 20,014,200. Blackpool North and Cleveleys (numbers)
") Labour Market Profile - North And Parliamentary Constituency The profile brings together data from several sources. Details about these and related terminology are given in the definitions section. Resident
Labour Market Profile - North And Parliamentary Constituency The profile brings together data from several sources. Details about these and related terminology are given in the definitions section. Resident
Great Britain (Numbers) All People 194,000 6,076,500 63,258,400 Males 97,000 2,993,400 31,165,300 Females 97,000 3,083,100 32,093,100
 All People 194,000 6,076,500 63,258,400 Males 97,000 2,993,400 31,165,300 Females 97,000 3,083,100 32,093,100") Labour Market Profile - The profile brings together data from several sources. Details about these and related terminology are given in the definitions section. Resident Population Total population (2015)
Labour Market Profile - The profile brings together data from several sources. Details about these and related terminology are given in the definitions section. Resident Population Total population (2015)
Barnet Census 2001 and Access to Services Focus on Rural Areas
 Census 2001 and Access to Services Focus on Rural Areas is in the Government Office Region 1 Map of the Government Office Region showing Authority boundaries and shaded by Output Area according to the
Kirklees (Numbers) All People 434,300 5,390,600 63,258,400 Males 215,000 2,658,400 31,165,300 Females 219,400 2,732,200 32,093,100. Kirklees (Numbers)
 All People 434,300 5,390,600 63,258,400 Males 215,000 2,658,400 31,165,300 Females 219,400 2,732,200 32,093,100. Kirklees (Numbers)") Labour Market Profile - The profile brings together data from several sources. Details about these and related terminology are given in the definitions section. Resident Population Total population (2015)
Labour Market Profile - The profile brings together data from several sources. Details about these and related terminology are given in the definitions section. Resident Population Total population (2015)
How has Hounslow s demographic profile changed? An analysis of the 2011 Census data based on releases available up to January 2013
 How has Hounslow s demographic profile changed? An analysis of the 2011 Census data based on releases available up to January 2013 Background Since 2001 Hounslow s population has grown by 19.6% from 212,341
Getting to know your parish
 Getting to know your parish What is this spotlight? 1 Contents This short spotlight brings together a range of information about your parish, both in terms of your congregations, but also the wider community
Poverty among ethnic groups
 Poverty among ethnic groups how and why does it differ? Peter Kenway and Guy Palmer, New Policy Institute www.jrf.org.uk Contents Introduction and summary 3 1 Poverty rates by ethnic group 9 1 In low income
Getting to know your parish
 Getting to know your parish What is this spotlight? 1 Contents This short spotlight brings together a range of information about your parish, both in terms of your congregations, but also the wider community
Equality Impact Assessment Support for Mortgage Interest
 Welfare and Wellbeing Group Equality Impact Assessment Support for Mortgage Interest Planned change to the standard interest rate at which Support for Mortgage Interest is paid August 2010 Equality Impact
QuickStats About Auckland Region
 QuickStats About Population/ Dwellings Number of people counted Total population 1,303,068 people usually live in. This is an increase of 144,177 people, or 12.4 percent, since the 2001 Census. Its population
TRADE UNION MEMBERSHIP 2014. Statistical Bulletin JUNE 2015
 TRADE UNION MEMBERSHIP 2014 Statistical Bulletin JUNE 2015 Contents Contents... 2 Introduction... 3 Key findings... 5 1. Long Term Trends... 6 2.Private and Public Sectors. 12 3. Personal and job characteristics...
Application Form ONLY APPLICATIONS SUBMITTED ON THIS FORM WILL BE PROCESSED BY THE OFFICER
 Application Form ONLY APPLICATIONS SUBMITTED ON THIS FORM WILL BE PROCESSED BY THE OFFICER Applicant s details Loan Member Amount of loan Repayment Terms X w/f/m Cheque /Cash Loan Approved/Refused Payment
The ageing of the ethnic minority populations of England and Wales: findings from the 2011 census
 The ageing of the ethnic minority populations of England and Wales: findings from the 2011 census A briefing paper from the Centre for Policy on Ageing June 2013 The Centre for Policy on Ageing was set
Cornwall s economy at a glance
 Cornwall s economy at a glance January 2013 An overview of the main economic measures and Census employment data for Cornwall and the Isles of Scilly compared to other areas, and changes over time. Headlines
Disability Rights Commission Disability Briefing June 2005
 Disability Rights Commission Disability Briefing June 2005 Contents Page Introduction 1 Definitions of disability used in the LFS 2 Some Key Facts and Figures 3 Section 1: Autumn 2004 Data 5 Table 1: Economic
2013 Round of GLA Population Projections, Ward Level and Ethnic Group
 Count 2013 Round of GLA Population Projections, Ward Level and Ethnic Group Headline statistics The total population of Barnet in is estimated to be 364,481 Colindale is Barnet s most populous ward containing
PAGE 2 INTRODUCTION. For the purpose of these Town Profiles, the defined Town Area covers the following wards:
 PAGE 1 INTRODUCTION The historic County Town of was the Durnovara of the Romans (who founded it in 70AD) and the fictional Casterbridge of Thomas Hardy s novels. The town has a busy shopping centre and
Newham, London. Local Economic Assessment. 2010 to 20279. Newham - Economic Development
 Newham, London Local Economic Assessment Newham - Economic Development 2010 to 20279 F and 3. 2BDemographics Summary The population in Newham is rising and is projected to continue to rise significantly.
Appendix 1. Local Area Profile. Gambling Premises: Hotspots of Recorded Crime, Vulnerable People and Vulnerable Places
 Appendix 1 Local Area Profile Gambling Premises: Hotspots of Recorded Crime, Vulnerable People and Vulnerable Places In the London Borough of Ealing there are currently 82 betting shops, 6 Adult Gaming
Population Size. 7.9% from a non-white ethnic group. Population: by ethnic group, April 2001
 Focus on Ethnicity and Identity paints a picture of the ethnic groups in the UK today. It includes information on their characteristics, lifestyles and experiences, placing particular emphasis on comparing
Impact Assessment (IA)
") Title: Welfare Reform and Work Bill: Impact Assessment for Converting Support for Mortgage Interest (SMI) from a benefit into a Loan Lead department or agency: Department for Work and Pensions Other departments
Title: Welfare Reform and Work Bill: Impact Assessment for Converting Support for Mortgage Interest (SMI) from a benefit into a Loan Lead department or agency: Department for Work and Pensions Other departments
APPLICATION FORM. Application for Housing Registration
 APPLICATION FORM Application for Housing Registration The purpose of this application form is to register your need for housing. Registration does not guarantee that you will be made an offer of accommodation.
Getting to know your parish
 Getting to know your parish What is this spotlight? 1 Contents This short spotlight brings together a range of information about your parish, both in terms of your congregations, but also the wider community
Age, Demographics and Employment
 Key Facts Age, Demographics and Employment This document summarises key facts about demographic change, age, employment, training, retirement, pensions and savings. 1 Demographic change The population
Customer Contact Strategy
 Strategy 2014-2017 V9 Jan 14 Index Section Description Page No. 1 2 3 4 5 Appendix A Appendix B Introduction Where are we now Insight into Oxford City Customers Strategic Overview Delivery of the Strategy
Full report - Women in the labour market
 Full report - Women in the labour market Coverage: UK Date: 25 September 2013 Geographical Area: UK Theme: Labour Market Key points The key points are: Rising employment for women and falling employment
Ethnic Minorities, Refugees and Migrant Communities: physical activity and health
 Ethnic Minorities, Refugees and Migrant Communities: physical activity and health July 2007 Introduction This briefing paper was put together by Sporting Equals. Sporting Equals exists to address racial
Dear Applicant, We look forward to hearing from you. Kind Regards. Admissions
 Dear Applicant, Please print the following application form (4 pages), complete all fields and send it to Admissions at the above address along with the 40.00 non-refundable Campus Fee. This application
Equality Impact Assessment Support for Mortgage Interest
 Welfare and Wellbeing Group Equality Impact Assessment Support for Mortgage Interest Clarification to the treatment of Excess Payments of Support for Mortgage Interest April 2010 Equality Impact Assessment
Eurobodalla. Area Profile. Key Industry: Tourism & accommodation, Retail, Health & Community Services, Education
 Eurobodalla Area Profile Population: 37,714 persons (2010 est. resident population) Growth Rate: 3.1% (2006-2010) 0.8% ave. annual growth Key Industry: Tourism & accommodation, Retail, Health & Community
Application for housing with 24hr support.
 Application for housing with 24hr support. Please state which Care Plus development you are applying for: Eligibility for assistance Are you and all members of your household either: British Citizens?
Loan Application Form
 FOR OFFICE USE ONLY Loan Number: Membership Number: Loan Application Form To apply for a loan, you must provide evidence of your income (and be an existing member of LASA Credit Union). Acceptable forms
Ethnic Minority Groups Living in Leicestershire
 Leicestershire County Council Ethnic Minority Groups Living in Leicestershire LEICESTERSHIRE COUNTY COUNCIL Research & Information Department of Planning and Transportation County Hall Glenfield Leicestershire
English Housing Survey Headline Report 2014-15
 English Housing Survey Headline Report 214-15 Contents Introduction and main findings Section 1: Households Section 2: Housing stock Technical notes and glossary Introduction and main findings 1. English
How Wakefield Council is working to make sure everyone is treated fairly
 How Wakefield Council is working to make sure everyone is treated fairly As part of meeting the Public Sector Equality Duty, the Council is required to publish information on how it is working to treat
Newham, London. Local Economic Assessment. 2010 to 20279. Newham - Economic Development
 Newham, London Local Economic Assessment Newham - Economic Development 2010 to 20279 4. 3BThe Labour Market: Employment, Worklessness and Skills Summary Newham has a very low employment rate with particularly
Sheaf Specialist Vocational College
 (Including New Routes and My Learning My Way) Application Form Sheaf Specialist Vocational College About the programme that you are applying for Individual Learning Programme You are applying for an education
Universal Credit and families: questions and answers
 August 2015 Universal Credit and families: questions and answers Q. What is Universal Credit? Universal Credit is a new benefit that supports people who are on a low income or out of work, and helps ensure
Leicester Charity Link Grant application form
 Leicester Charity Link Grant application form Client reference (for office use only) 20a Millstone Lane, Leicester LE1 5JN t: 0116 222 2200 f: 0116 222 2201 w: www.charity-link.org e: info@charity-link.org
Religious Populations
 Focus on Religion paints a picture of the different faith groups in the UK today. It looks separately at Great Britain and Northern Ireland. Information comparing and contrasting the characteristics of
PERFORMANCE MANAGEMENT SCRUTINY COMMITTEE TO FOLLOW REPORT (S)
") Public Document Pack Date: Wednesday, 5 November 2014 Time: Venue: SY2 6ND Contact: 10.00 am Shrewsbury Room, Shirehall, Abbey Foregate, Shrewsbury, Shropshire, Jane Palmer, Senior Democratic Services
Public Document Pack Date: Wednesday, 5 November 2014 Time: Venue: SY2 6ND Contact: 10.00 am Shrewsbury Room, Shirehall, Abbey Foregate, Shrewsbury, Shropshire, Jane Palmer, Senior Democratic Services
Inuvik - Statistical Profile
 Inuvik - Statistical Profile POPULATION Number of Births 2002 48 635 Population (2015) 2003 79 701 Total 3,265 44,088 2004 65 698 2005 67 712 Males 1,601 22,499 2006 63 687 Females 1,664 21,589 2007 68
Electoral Registration Analysis
 31 July 2013 Electoral Registration Analysis Analysis of factors driving electoral registration rates in local authorities in England and Wales This document is available in large print, audio and braille
Benefit and Pension Rates
 Benefit and Pension Rates This leaflet is only a copy of selected information taken from www.gov.uk on 6 April 2016. The latest information is always available online. This leaflet is for guidance only
Census 2011. Census 2011- Ethnicity in England and Wales 2011 01.03.2013. Doncaster Data Observatory
 Census 2011 Census 2011- Ethnicity in England and Wales 2011 01.03.2013 Doncaster Data Observatory Census 2011 Ethnicity in England and Wales 2011 01.03.13 1. Introduction Purpose 1.1. To detail the first
Housing List Application
 Answer all questions on this form fully & truthfully or your application will be delayed. Please use a black pen and write in BLOCK CAPITALS. If you need help filling in this form please contact 020 7364
2011 Census: Key Results on Population, Ethnicity, Identity, Language, Religion, Health, Housing and Accommodation in Scotland - Release 2A
 Statistical Bulletin Coverage: Scotland Date: 26 September 2013 Geographical Area: Scotland, Council Area, Health Board Area Theme: Population and Household estimates 2011 Census: Key Results on Population,
Briefing on ethnicity and educational attainment, June 2012
 Briefing on ethnicity and educational attainment, June 2012 Ethnicity in schools In state-funded primary schools 27.6 per cent of pupils (of compulsory school age and above) were classified as being of
Manchester City Council Report for Resolution. Report to: Finance Scrutiny Committee 19 July 2012
 Item 7 19 y 212 Manchester City Council Report for Resolution Report to: 19 y 212 Subject: Report of: Performance Management Framework Deputy Chief Executive (Performance) Summary The report outlines the
London Borough of Barnet Residents Perception Survey Quarter 2/3, 2013/14
 Opinion Research Services Opinion Research Services London Borough of Barnet Residents Perception Survey QTR 2/3, 2013 14 January 2014 London Borough of Barnet Residents Perception Survey Quarter 2/3,
Local Economic Assessment
 Local Economic Assessment Westminster City Council Local Economic Assessment Version II: 2014 October 2014 1 Document Title: Westminster Local Economic Assessment (V.II update 2014) Version: Final Date:
Tamworth Borough Council Housing Application Form
 Tamworth Borough Council Housing Application Form Please read this form carefully and complete all sections. An incomplete form will be returned to you for completion. The information you give us will
Universal Credit: Frequently Asked Questions October 2012
 Universal Credit: Frequently Asked Questions October 2012 Introduction Universal Credit (UC) is the Government s new, simplified working age welfare system, rolling several benefits and tax credits into
www.helptobuysw.org.uk
 Help to Buy South West Application Form Please circle the correct answers Would you consider buying a home? Would you consider renting a home? Yes / No Yes / No I/We can confirm that our household income
Housing Register Application Form
 Housing Register Application Form creating communities to be proud of Housing Register Application Form Page About Us...1 Section 1: You and Your Household...2 Section 2: Your Eligibility...4 Section 3:
Childcare and early years survey of parents 2014 to 2015
 Childcare and early years survey of parents 2014 to 2015 March 2016 Tom Huskinson, Sylvie Hobden, Dominic Oliver, Jennifer Keyes, Mandy Littlewood, Julia Pye, and Sarah Tipping Contents Executive Summary...
SAMPLE SUPPORTIVE HOUSING INTAKE/ASSESSMENT FORM
 SAMPLE SUPPORTIVE HOUSING INTAKE/ASSESSMENT FORM (This form must be completed within 30 days of program entry) IDENTIFYING INFORMATION Date Information is Gathered: 1. Applicant Last Name: First Name:
Just under a fifth of full time 16-18 year olds (19.4%) were aged 18 at the beginning of the 2012/13 academic year.
 were aged 18 at the beginning of the 2012/13 academic year.") Analysis of 18 Year in FE Colleges RCU ref. Analysis of 18 Year olds in FE Colleges 1. Introduction This report has been prepared by RCU to support the AoC s response to the recent proposal by EFA to cut
Analysis of 18 Year in FE Colleges RCU ref. Analysis of 18 Year olds in FE Colleges 1. Introduction This report has been prepared by RCU to support the AoC s response to the recent proposal by EFA to cut
APPLICATION FOR FINANCIAL ASSISTANCE
 APPLICATION FOR FINANCIAL ASSISTANCE BEFORE COMPLETING THE APPLICATION FORM, PLEASE CAREFULLY READ THE NOTES BELOW. When you have completed the application form, you should detach these notes and keep
Benefit and Pension Rates
 Benefit and Pension Rates April 2014 2 How much money you could get If you are claiming or are thinking of claiming a benefit, you may want to know how much money you could get. If you are already getting
Universal Credit. In this factsheet you can find out what benefits are being replaced by UC, who can get it and how much you could get.
 Universal Credit Universal Credit (UC) is a new benefit for people of working age. You can get it if you have a low income or do not work. Some people started getting it in April 2013. In this factsheet
Learning Agreement 2015-2016
 FOR OFFICE USE ONLY Student ID No. Learning Agreement 2015 2016 Employer/Sponsor On completion of this form, it must be signed and returned to the Student Advice Centre. Bath College, Avon Street, Bath,
Ethnic Group Profile of Hampshire. 2011 Census. Published by Research and Intelligence (Autumn 2013) www.hants.gov.uk
 www.hants.gov.uk") Ethnic Group Profile of Hampshire 2011 Census Published by Research and Intelligence (Autumn 2013) 1 www.hants.gov.uk Contents 1. Introduction 2. Ethnic Group by District 3. Ethnic Group by Age and Sex
Ethnic Group Profile of Hampshire 2011 Census Published by Research and Intelligence (Autumn 2013) 1 www.hants.gov.uk Contents 1. Introduction 2. Ethnic Group by District 3. Ethnic Group by Age and Sex
Referral Form. What benefits does the applicant receive? allocated?
 Please return to Christopher Davies Heantun Housing Association 3 Wellington Road Bilston West Midlands WV14 6AA 01902 571131 christopher.davies@heantun.co.uk Referral Form Personal details: Name of applicant:
St Albans Rent Secure Scheme Referral Form
 St Albans Rent Secure Scheme Referral Form Please provide the following information along with the supporting documents listed on the eligibility criteria to enable the STARSS co-ordinator to make an initial
Get Britain Working Measures Official Statistics
 Get Britain Working Measures Official Statistics Publication date: 9:30am Wednesday 21 August 2013 Contents Summary... 3 Introduction... 3 Get Britain Working Measures Policy Description... 3 Technical
Surname: Postcode: I can attend each day of the Summer School and all 16 Saturday sessions. I have completed all information in sections A, B, C and D
 CHOICE Study with the world s leading Social Science institution Summer School: Monday 17 Friday 21 August 2015 16 Saturday Sessions: 19 September 2015 5 March 2016 Deadline Friday 20 March 2015 First
What s Going On to safeguard children and young people from sexual exploitation? : A data monitoring Tool
 What s Going On to safeguard children and young people from sexual exploitation? : A data monitoring Tool Introduction In 2009 the government published guidance on Safeguarding children and young people
Consumer needs not being met by UK grocery market A British Brands Group research publication
 Consumer needs not being met by UK grocery market A British Brands Group research publication INTRODUCTION The British Brands Group provides the voice for brand manufacturers in the UK. It is a membership
APPLICATION FOR FINANCIAL ASSISTANCE
 CHARITY NUMBER 1106218 APPLICATION FOR FINANCIAL ASSISTANCE ALTERNATIVELY APPLY ONLINE VIA THE TRUST S WEBSITE WWW.BRITISHGASENERGYTRUST.ORG.UK BEFORE COMPLETING THE APPLICATION FORM, PLEASE CAREFULLY
EDf EnErGY trust. APPLiCAtion for financial ASSiStAnCE WHO CAN APPLY FOR A GRANT? HOW CAN THE TRUST HELP?
 EDf EnErGY trust APPLiCAtion for financial ASSiStAnCE BEforE CoMPLEtinG the APPLiCAtion form, PLEASE CArEfULLY read the notes BELoW. When you have completed the application form, you should detach these
Lambeth Business Survey 2015 Survey Report. A Report to London Borough of Lambeth March 2015
 Lambeth Business Survey 2015 Survey Report A Report to London Borough of Lambeth March 2015 Contents 1.0 Introduction... 1 1.1 Study Objectives... 1 1.2 Methodology... 2 1.3 Structure of Report... 7 2.0
A CLAIM FOR DISCRETIONARY HOUSING PAYMENTS (DHP) Claim Ref:
 Claim Ref:") A CLAIM FOR DISCRETIONARY HOUSING PAYMENTS (DHP) Claim Ref: SECTION 1 INFORMATION If you are getting Housing Benefit and Local Council Tax Support but you are still having problems meeting your rent and
A CLAIM FOR DISCRETIONARY HOUSING PAYMENTS (DHP) Claim Ref: SECTION 1 INFORMATION If you are getting Housing Benefit and Local Council Tax Support but you are still having problems meeting your rent and
Year 12 Young Persons University 2015 Residential Summer School Programme
 Year Young Persons University 2015 Residential Summer School Programme Application Form There are three sections to this application form: Section 1: To be completed by the applicant Please complete all
Chapter 1 Smoke alarms and fire safety measures in the home
 Chapter 1 Smoke alarms and fire safety measures in the home Smoke alarms and other fire safety equipment that are correctly installed and maintained, play a vital role in reducing fire deaths and injuries
HOUSING BENEFIT AND COUNCIL TAX SUPPORT 2015-16. www.havering.gov.uk
 HOUSING BENEFIT AND COUNCIL TAX SUPPORT 2015-16 www.havering.gov.uk What are Council Tax Support and Housing Benefit? Council Tax Support helps people pay their Council Tax. The Government decided to replace
A SNAPSHOT OF ALPENA COUNTY
 A SNAPSHOT OF ALPENA COUNTY agbioresearch.msu.edu msue.msu.edu About the Data This County Profile is to be used with the 2015-2016 Issue Identification process for State University Extension. Unless otherwise
APPLICATION FORM. Right Guard Security UK Ltd act as Managing Agents for Payroll Workshop Ltd to manage their employees on their behalf.
 APPLICATION FORM Right Guard Security UK Ltd is an expanding company that has a vast range of security services. We are dedicated to providing an excellent service through highly trained, loyal and committed
Black and Minority Ethnic Groups Author/Key Contact: Dr Lucy Jessop, Consultant in Public Health, Buckinghamshire County Council
 Black and Minority Ethnic Groups Author/Key Contact: Dr Lucy Jessop, Consultant in Public Health, Buckinghamshire County Council Introduction England is a country of great ethnic diversity, with approximately
English Housing Survey HOUSEHOLDS 2010-11
 English Housing Survey HOUSEHOLDS 2010-11 The United Kingdom Statistics Authority has designated these statistics as National Statistics, in accordance with the Statistics and Registration Service Act
2015-16 Your council tax explained
 2015-16 Your council tax explained how your council tax has been calculated page 2 answers to common questions page 7 how your council tax is spent page 10 www.islington.gov.uk/counciltax 1 Your council
DOMESTIC VIOLENCE POLICY
 OXFORD CITY COUNCIL HOUSING SERVICES DOMESTIC VIOLENCE POLICY If you need a larger print copy, audiotape or other means to have a copy of this publication, please contact the number below Translation available
FURTHER EDUCATION Place of education Type of training Qualification
 APPLICATION FORM POSITION APPLIED FOR HOW DID YOU HEAR OF THIS VACANCY? (Name of publication, web site, agency or source) PERSONAL DETAILS Surname: First Names: Title: Previous Names: Home Address: Post
DWP Work Psychology Service. Jehnna Stratford Work Psychologist DWP Work Psychology Services Durham & Tees Valley
 DWP Work Psychology Service Jehnna Stratford Work Psychologist DWP Work Psychology Services Durham & Tees Valley Improving Health Through Work The Government instigated review Working for a Healthier Tomorrow
Statistics on individuals in drug or alcohol treatment in receipt of working-age benefits. Figures for 2011/12, England
 Statistics on individuals in drug or alcohol treatment in receipt of working-age benefits Figures for 2011/12, England 31 st July 2015 Contents Overview... 3 Results Summary... 3 Methodology... 4 Data
Survey of Online Fundraisers, Sponsors, and Donors Summary of Responses
 Survey of Online Fundraisers, Sponsors, and Donors Summary of Responses JustGiving teamed up with researchers at Bristol University (UK), Warwick University (UK), and McMaster University (Canada) to conduct
This report provides the executive summary for Indicators of School Crime and Safety: 2014.
 1 Liability Report Number: LB-10-66 Release Date: August 6, 2015 Section Title: General Information Abstract School violence not only has a direct impact on students, but also on educators, parents, and
NEIGHBOURHOOD DESCRIPTION
 NEIGHBOURHOOD DESCRIPTION Prior to undergoing urban development in the late 1990s and early 2000s, the Blackmud Creek area was in agricultural use. The plan for Blackmud Creek was intended to take advantage
Mutual Exchange Application Form
 Mutual Exchange Application Form Translation service If you need help to complete this form, or need any part of it to be translated or in another format, please contact your local office. Please let us
Project Manager s Introduction
 Dear prospective volunteers, Project Manager s Introduction It is fantastic that you are interested in helping us support young and vulnerable people in Cheshire. Nightstop is a way of volunteering from
Do you have any restrictions to times and days you can work?
 Office Use Only Pre-screened by HR Yes By: Passed Pre Screen RTW Y / N Driving Licence Y / N / NA 5 Year History Y / N SIA Y / N Pre screen comments: Interview Date & Time: Proceed to Vetting? Post interview
Application form trainee solicitors
 Application form trainee solicitors for training contracts commencing in 2018 PERSONAL DETAILS Title: Name (in full): Telephone number(s): Email address: Home address (including postcode): Please give
How to make a claim for benefits
 GUIDE TO BENEFITS How to make a claim for benefits This is a basic guide to benefit entitlements; please ensure that you discuss with your Resettlement Officer before you make a claim for benefits. You