The Economic Impact of Pennsylvania Heritage Areas
|
|
|
- Miles Copeland
- 7 years ago
- Views:
Transcription
1 The Economic Impact of Pennsylvania Heritage Areas By: John M. McGrath, Ph.D., University of Pittsburgh at Johnstown and David Primm and William Lafe January 2016 This project was sponsored, in part, by a grant from the Center for Rural Pennsylvania, a legislative agency of the Pennsylvania General Assembly. The Center for Rural Pennsylvania is a bipartisan, bicameral legislative agency that serves as a resource for rural policy within the Pennsylvania General Assembly. It was created in 1987 under Act 16, the Rural Revitalization Act, to promote and sustain the vitality of Pennsylvania s rural and small communities. Information contained in this report does not necessarily reflect the views of individual board members or the Center for Rural Pennsylvania. For more information, contact the Center for Rural Pennsylvania, 625 Forster St., Room 902, Harrisburg, PA 17120, telephone (717) , info@rural.palegislature.us,
2 Executive Summary Research was conducted in five Pennsylvania Heritage Areas in to analyze their economic impact in Pennsylvania. The research involved a survey of heritage-area visitors, interviews with stakeholders in the five study heritage areas (HAs), and an estimation of the economic impact of the heritage-related visitation to all 12 HAs statewide. The five study HAs were: PA Route 6, National Road, Allegheny Ridge, Lincoln Highway and Susquehanna Gateway. Overall, the research found that tourists spent an estimated 7.5 million days/nights in Pennsylvania s 12 HAs in 2014, purchasing $2 billion worth of goods and services. The total contribution of heritage visitor spending (direct, indirect and induced effects) to the state s economy was 25,708 jobs and $798 million in labor income. The research also indicated that the five study HAs contribute positive economic benefits to their local geographic regions in two ways: HA organizational expenditures and the work of HA staff facilitate economic development projects in their regions. This involvement increases the economic impact within each local region. This also enhances the economic value of HAs as they may use technical expertise to promote economic development with partners. For example, the five study HAs documented specific examples of economic development success, including more than 151 new tourismrelated businesses in the past 5 to 10 years. These businesses provide evidence that the HAs play a role in their areas that yields beneficial economic and social returns. Heritage visitation to a local region was defined and attributed to each HA and its partners. Heritage-specific visitors were quantified via the research survey when respondents indicated that a visit to a heritage attraction or event was the primary reason for their visit. Heritage visitation provides substantial economic benefits for the local geographic region. Highlights of the economic impact of heritage-defined visitation in each of the five study HAs are shown in Table A. The Economic Impact of Pennsylvania Heritage Areas 2
3 Table A: 2014 Heritage-Defined Visitor Economic Impact of 5 Study Heritage Areas For example, the shaded area in Table A illustrates the economic impact on Allegheny Ridge. Specifically, visitors spent an estimated 344,903 party days/nights in the HA, spending nearly $66 million in (Party days/nights accounts for all visitors within a group and the time they spend in an area). Further, direct heritage-defined visitor spending supported 564 jobs. Adding indirect and induced effects, the total jobs supported were 699. Jobs include both full- and part-time, consistent with employment estimates of the Bureau of Labor Statistics. Similarly, Table A illustrates findings for labor income, value added (Gross Domestic Product), and total output (sales). For example, labor income is measured as income that includes wages and salaries, payroll benefits, and income of sole proprietors. The spending of heritage-defined visitors in 2014 directly affected Allegheny Ridge salaries and small business owner income by $14 million, which increased to nearly $21 million when including indirect and induced effects. Note: Party days/nights accounts for all visitors within a group and the time they spend in an area. Source: Survey of visitors to 5 study heritage areas, 2014; 3,524 total respondents. Allegheny Ridge direct heritage-visitation spending contributed nearly $20 million to its regional Gross Domestic Product (GDP). Including indirect and induced effects, the contribution increases to more than $31 million. GDP or value added includes labor income as well as profits and rents and indirect business taxes. Value added is the preferred measure of the contribution of an activity or industry to gross The Economic Impact of Pennsylvania Heritage Areas 3
4 regional product as it measures the value added by that activity/industry net of the costs of all non-labor inputs to production. Output represents the value of industry production or sales. For example, manufacturers would define output as sales plus/minus change in inventory. The output of service sector production is equal to its sales. Output in the retail trade sector is only the retail margin on retail sales and therefore excludes the cost of goods sold. Allegheny Ridge direct heritage-visitation spending contributed more than $33 million to the regional output. Including the indirect and induced effects, the economic benefit increases to more than $52 million. Intangible economic benefits included sustaining the culture and heritage of an area, as well as partnering with tourism promotion agencies (TPAs) to attract tourist dollars. HAs also work with local chambers of commerce to attract businesses and promote economic development in rural Pennsylvania. In addition to the five study HAs, the research team also used visitation estimates provided by all 12 Pennsylvania HAs to develop an estimate of heritage-visitation economic effects on jobs, income, and value added statewide (See Table B). Table B: 2014 Heritage-Defined Visitor Economic Impact of all 12 Pennsylvania Heritage Areas Statewide Model - Visitor Spending Impact/Non-Residents All 12 Heritage Areas Pennsylvania Visitors (Party days/nights) 7,539,755 Heritage Visitor Spending (000's) $2,089,077 Direct Effect Jobs 19,333 Labor Income (000's) $477,881 Value Added (GDP) (000's) $709,062 Output (000's) $1,208,247 Total Effect Jobs 25,708 Labor Income (000's) $798,114 Value Added (GDP) (000's) $1,263,295 Output (000's) $2,147,091 Source: Survey data of visitors to 5 study heritage areas, 2014; 3,524 total respondents, extrapolated using visitation data from the remaining 7 non-study heritage areas. Specifically, visitor parties spent an estimated 7.5 million party days/nights in the 12 HAs in 2014, spending an estimated $2 billion. Further, the direct impact of heritage visitor spending to the state The Economic Impact of Pennsylvania Heritage Areas 4
5 economy was 19,333 jobs and $477.9 million in labor income. Including indirect and induced effects, the total contribution of visitor spending to the state s economy was 25,708 jobs, $798 million in labor income, and nearly $1.3 billion in value-added effects. By comparison, recent research reported that total Pennsylvania travel and tourism-related economic activity supported 478,888 jobs (direct and indirect jobs) in The state s travel and tourism sector was directly responsible for an estimated $15.3 billion of the state s 2013 GDP (Tourism Economics, 2014). By comparison, this research estimated that 2014 HA visitation was directly responsible for $709 million. Based on the visitors sampled at the five study HAs, the research found approximately 70 percent of visitor spending and associated economic effects would be lost to these regions in the absence of specific heritage anchor attractions. The importance of these individual attractions is underlined by one finding that indicated low awareness of the concept of a heritage area as well as the existence of the overall HA Program. The data indicate that 67 percent of respondents were not aware of the HA Program, and that a majority of respondents were not aware of each individual HA with the exception of Lincoln Highway, where 60 percent of respondents indicated they were aware of the HA. This research suggests that the HA Program, although a component of the larger statewide tourism industry, supports a substantial number of jobs across the state, particularly within the restaurant, amusement, and retail industries, despite limited awareness of the specific HA. Heritage-defined visitors were responsible for more than $158.7 million in state and local tax revenues in State and local tax revenues include employee contributions, household taxes (income, real estate, etc.) and corporate profit taxes. The operations of HAs provide nominal economic benefits for their local region through salaries, grants and special projects; however, the administration of grant revenue from federal, state, or local funding agencies results in a significant effect on the regional income and value-added multipliers. Based on the research findings, the research team recommended several actions to improve aspects of the HA Program including: a meeting between HA staff and key Department of Conservation and Natural Resources (DCNR) leaders to develop a statewide roadmap for the future of the HA Program: the The Economic Impact of Pennsylvania Heritage Areas 5
6 adoption of a common visitor survey procedure for all HAs based on the methods used in this study; suggested refinements to the DCNR partnership grants program and enhancements to the mini-grants program; consideration of a more marketable name for the HA Program; and continued development of ways of to improve relationships with local partners and stakeholders. The research team also recommended enhancements to the ways HAs help preserve a sense of place within their regions and new efforts to encourage nature tourism. Table of Contents Introduction... 7 Goals and Objectives Methodology Results Conclusions Policy Considerations References Special Acknowledgements Appendices The Economic Impact of Pennsylvania Heritage Areas 6
7 Introduction The Department of Conservation and Natural Resources (DCNR) has authorized 12 Heritage Areas through its Heritage Areas Program throughout the commonwealth (Mahoney, 2014). HAs are geographic regions or corridors that span two or more counties that contain historic, recreational, natural and scenic resources, which collectively exemplify the heritage of Pennsylvania (DCNR, 2015). Through regional partnerships and grassroots planning strategies, these resources are identified, protected, enhanced and promoted to strengthen regional economies through increased tourism, new jobs and new investment opportunities. The overarching goal of the HA Program is to ensure that the legacy of the commonwealth and the natural, educational and recreational values inherent in it is preserved for future generations. The HA Program was first established in 1988 and funded directly from the state budget. In 1996, the management and coordination of the program shifted to DCNR, where it currently remains (Mahoney, 2014). Of the 12 HAs in the commonwealth, five have also been designated as National Heritage Areas. The 12 HAs are (National Heritage Areas noted with an asterisk): Oil Region Heritage Area*; Lumber Heritage Region; PA Route 6 Heritage Corridor; Endless Mountains; Lackawanna Heritage Valley*; Delaware & Lehigh National Heritage Corridor*; Schuylkill River National Heritage Area*; Susquehanna Gateway Heritage Area; Allegheny Ridge Heritage Area; Lincoln Highway Heritage Corridor; Rivers of Steel National Heritage Area*; and National Road Heritage Corridor. Figure 1 shows the location the 12 HAs (DCNR, 2015). The five study HAs are PA Route 6, National Road, Allegheny Ridge, Lincoln Highway, and Susquehanna Gateway. The Economic Impact of Pennsylvania Heritage Areas 7
8 Figure 1: Pennsylvania s 12 Heritage Areas and 5 Study Areas Source: Pennsylvania Department of Conservation and Natural Resources, Map by the Center for Rural Pennsylvania. Each HA represents a distinct program. Just as cities like Pittsburgh, Lancaster and Williamsport have different histories and cultural traditions, so do Pennsylvania s 12 HAs. There is no single, overarching definition of an HA, nor is there a shared thematic or programmatic emphasis. The HAs share many similar or comparable programs, but each has its own distinctive focus, management style and priorities. Pennsylvania HA revenues are generated primarily in the form of annual DCNR partnership grants, other awarded grants, and fundraising efforts initiated by each HA. Additional annual funding for HAs is provided through arrangements with municipal or state government entities. Five of Pennsylvania s HAs have received a national designation and subsequent funding from the National Park Service (NPS). Over the course of nearly three decades, the focus of HA programs has gradually shifted away from initiatives focused predominately on cities to regional efforts that center on: a) conservation of natural areas and the relationship of conservation programs to economic development, b) tourism, particularly The Economic Impact of Pennsylvania Heritage Areas 8
9 nature tourism, c) preserving a sense of place sustaining local pride by planning and implementing special events and heritage projects, d) community education, and e) preserving historic buildings and artifacts (Mahoney, 2014). HAs are not membership organizations. Any non-profit organization, business, government agency or individual citizen that is located or resides within the designated HA may be considered as part of the HAs constituency. Effective membership, however, comes not from geography, but from participation, either through voluntary action, contributions, board membership or collaboration on a specific project. This research builds on two previous Pennsylvania studies to analyze how the commonwealth s HAs impact the state economy. These studies employed both qualitative and quantitative data collection approaches. A qualitative approach was used successfully in a recent study that focused on case studies of three tourism promotion agencies in different geographic areas of the commonwealth (Holoviak, 2012). A quantitative approach was used in a 2010 study of Pennsylvania s HAs to gather information about visitors titled, The Economic Impact of Pennsylvania s Heritage Areas (Unpublished, 2010). The information collected in this study included the duration of visitors stay in the HA, the number of people in the travel party, and the home ZIP code of the traveling party. The 2010 analysis used data from the surveys to measure the economic impact of visitor spending in Pennsylvania HAs. The analysis paired the survey data with visitation statistics for specific sites within each HA and fed them into an economic impact model called the Money Generation Model (MGM2). According to the 2010 study, Pennsylvania HA visitors spent more than $299 million. This spending directly supported more than 4,300 jobs and contributed more than $95 million in local personal income. This research used the findings of the 2010 analysis as a baseline for comparison. The Economic Impact of National Heritage Areas, a Case Study Analysis of Six National Heritage Area Sites in the Northeast Region of the United States and Projections on the National Impact of All National Heritage Areas, (Tripp Umbach/ National Park Service, 2013) also helped guide the The Economic Impact of Pennsylvania Heritage Areas 9
10 qualitative interview methodology for this research, as it also included two HAs in Pennsylvania Rivers of Steel and the Delaware and Lehigh National Heritage Corridor. Goals and Objectives The primary goals of the research were to analyze the economic and non-economic impact of Pennsylvania s HAs. The analysis used data and information from five of the 12 HAs as a sample from which the economic impact of HAs throughout the commonwealth could be projected. Based on the overall goal, the researchers pursued the following research objectives: to gain an understanding of the role played by each HA and how it relates to non-economic community impact in the region; and to quantify the key drivers of economic value that HAs add to their local investment areas, and the commonwealth as a whole, in terms of direct visitation impact, operational impacts, and grant and funding support impacts. Methodology The five study HAs were selected to represent a diverse geographical range within the Commonwealth and did not include those that participated in a previous study of national HAs in Pennsylvania (Tripp Umbach/National Park Service, 2013). To conduct the research, the research team used both qualitative and quantitative methods. Following is a more detailed explanation of how these approaches were employed. Qualitative analysis The research team held conversations with a wide variety of individuals in each of the five selected HAs to gain a greater understanding of the role played by each HA and how it relates to non-economic community impact in the region. The research team examined four main areas of activity: a) The nature of relationship with local partners to assess the quality-of-life impact of HA programs. The team talked with tourism attractions, hospitality industry, recreation-sites, historical preservation organizations, and local funding groups. The Economic Impact of Pennsylvania Heritage Areas 10
11 b) The nature of relationships with other local stakeholders to understand the impact of the HA programs from the point of view of the local businesses, community leaders, and elected officials. c) The perceived effectiveness of HAs in performing their mission to gauge opinions about preservation efforts, business creation, job creation, and community impact such as housing values or population growth areas. d) The development an ongoing protocol for measuring economic impact to discuss ways in which HA staff, partners, and constituents can develop standard operating procedures on future economic impact measurement within their investment areas. The selection of individuals to be interviewed by the research team was based on criteria discussed with HA executive directors. The discussions were conducted in a variety of settings and consisted of both one-on-one interviews and small focus groups. Over the course of four months, the research team spoke with 91 individuals who were involved with the HAs either as employees, partners, or constituents. Quantitative analysis To estimate the number and different types of heritage visitors, and the dollar value of spending during their visit, the research team employed two types of surveys that were administered at HA anchor sites, selected attractions, and events among the five study HAs. The surveys were administered over an eight-month period during the spring, summer and fall of 2014 beginning in May and ending in December. Volunteers distributed the paper surveys to visitors in Visitors were encouraged to complete the simple paper questionnaire, which included questions derived from the 2010 Pennsylvania Heritage Area Study. To encourage response, visitors were who completed the survey were eligible to win a $200 gift card. The research team also developed a questionnaire for local officials, with a unique identifier for each area, in the five HAs. The survey questions were identical across all of the five HAs. Data collection supervisors were selected by the executive directors of each HA, and worked with a range of anchor sites scattered throughout each area. The anchors sites were chosen by the executive directors based on their knowledge of the local tourism environment. The number of sites varied by HA, The Economic Impact of Pennsylvania Heritage Areas 11
12 with the largest number of anchor attractions being located in PA Route 6, the largest HA. The executive directors and data collection supervisors determined the number of paper questionnaires (and online survey invitations) that each anchor site would receive. Most of the data collection was via the passive collection method whereby visitors to the site were advised about the survey, and then chose to complete either the paper or online version. Many anchor attractions using this method placed the survey instrument near high traffic locations, such as reception desks or visitor guest books. A small portion of the data collection was performed by either volunteers or data collection supervisors as a visitor intercept at the anchor attraction sites. This method was used during high-profile events. In this situation, data collection supervisors or volunteers would approach visitors and ask them to complete either the paper or online instrument. The same instruments were used in both passive and intercept methods. The online surveys were for visitors who did not want to fill out a paper survey. This option used an internet-based version of the paper questionnaire instrument, and was hosted on a secure site. Data collection was closed December After the paper and online data were tabulated, the research team examined a variety of measures including the total number of respondents, their awareness of HAs, their perceptions, and key demographic data. Since the survey was billed as an anonymous enterprise, it did not include any unique identifier information about respondents unless they voluntarily provided their telephone number for a chance to win the gift card. As shown in Chart 1, 93 percent of all completed questionnaires were the traditional paper type, and 7 percent were completed online. The research team believes there are two possible explanations for this outcome. First, the demographics of the sample skewed older (the largest single segment was age 55-64, representing 25 percent of respondents), suggesting that there may be less of an inclination for this population to use the smart phone technology required to scan the online invitation card s QR code or enter the URL address in a web browser. Second, the summer of 2014 included a number of highly publicized hacks of major retail databases, including Home Depot. These incidents may have discouraged potential respondents from using the online questionnaire out of security fears. The Economic Impact of Pennsylvania Heritage Areas 12
13 Number of Questionnaires Chart 1: Number of Completed Questionnaires 3292 (93%) 232 (7%) Paper Online Source: Survey of visitors to 5 study heritage areas, 2014; 3,524 total respondents. In total, 3,524 usable questionnaires were collected. Data collection varied considerably by HA with the National Road area being most successful in providing completed questionnaires for the research team s use, followed closely by PA Route 6 (See Chart 2). Chart 2: Number of Completed, Usable Questionnaires by Heritage Area National Road PA Route 6 Lincoln Highway Allegheny Ridge Susquehanna Gateway ,036 Source: Survey of visitors to 5 study heritage areas, 2014; 3,524 total respondents. The 3,524 usable questionnaires represented a response rate of percent of the total estimated visitors from all five HAs of 14,555,743. The total number of usable questionnaires was less than the 2010 study- 4,078- but that project surveyed visitors in eight HAs. Therefore, when compared to the 2010 HA study, the average number of responses per HA was higher in this study, with 705 questionnaires per HA, versus an average of 510 per HA in the 2010 study (Unpublished, 2010). According to the sample error estimate online calculator (Decision Support Systems, LP), this response rate yields an estimated error rate of approximately +/-1.7 percent. This error estimate is based The Economic Impact of Pennsylvania Heritage Areas 13
 representing visitors from 46 states.")
14 on a sample proportion of 50 percent and a confidence interval of 95 percent, and is calculated using a method that is most appropriate for a random sample. The sample included respondents from 1,678 different zip codes from throughout the U.S. (See Figure 2) representing visitors from 46 states. In addition, the sample included visitors from 16 foreign countries, including Canada, Australia, New Zealand, Japan, Colombia, Venezuela, Austria, Denmark, England, France, Germany, Ireland, Italy, the Netherlands, Spain and Sweden. Figure 2: Home Zip Codes of Sample Respondents Note: the number of respondents varies by dot. Source: Survey of visitors to 5 study heritage areas, 2014; 3,524 total respondents. The sample also included 240 different destination zip codes located throughout the commonwealth (See Figure 3). This compares with data collected at 106 sites in the 2010 study (Unpublished, 2010). The locations are primarily located within the boundaries of the five study HAs. The Economic Impact of Pennsylvania Heritage Areas 14

15 Figure 3: Destination Zip Codes of Sample Respondents Note: the number of respondents varies by dot on map. Source: Survey of visitors to 5 study heritage areas, 2014; 3,524 total respondents. Economic Impact and Contribution The research quantified the impact and contribution derived from two areas associated with an HA: organizational spending and heritage-defined visitor spending. The organizational spending analysis was completed with data provided from the HAs. The research team developed an estimate of the dollars generated by organizational spending of each of the five HAs by collecting data on HA salaries, organizational expenditures, grant dollars attributed to the organization, and money spent on capital projects. The organizational spending analysis was completed for each HA individually. Heritage area visitation was quantified from visitor survey data and spending estimates collected for this research. Additional data, including annual visitation data to heritage attractions, were provided by the HA organizations. The economic impact and contribution analysis of HA organizational spending and heritage visitor spending was conducted with IMPLAN data sets and software. IMPLAN uses county and zip-code level data to estimate the indirect and induced multiplier effects of spending in terms of sales, income and The Economic Impact of Pennsylvania Heritage Areas 15
16 employment. This method of quantifying economic impact is consistent with visitor economic impact studies, most notably conducted annually for the NPS. The research team projected the annual economic impact of heritage tourists visiting all 12 Pennsylvania HAs. Organizational Spending Impacts of a Heritage Area The annual budgets of the study HAs were assigned to one of the 440 IMPLAN sectors. This process is referred to as budget assignment, a Bill-of-Goods approach used to determine which set of industries are directly impacted by HA organization demand. The economic impact model is then able to look at the production function of each directly impacted industry to determine additional rounds of spending that will occur as these industries purchase additional local inputs to meet the initial demand. The research methods and details for calculating the organizational spending impacts of an HA follow: Each of the five study HAs provided an annual budget expenditures over a 2-year period ( ). These expenditures represented direct inputs into the modeling framework and drive all operational economic impact results. Each line item of a HA s budget was then assigned to one of 440 IMPLAN sectors. Once each budgetary line item was assigned to an IMPLAN sector, the budget was aggregated to serve as the direct inputs within the IMPLAN model. With the exception of employee compensation, all HA expenditures represent purchases of final goods or contracted services. IMPLAN s Industry Change event was used to model purchases of final goods and services. Employee compensation (salaries and wages) was assigned to IMPLAN s Labor Income category. In cases where the budget line item description was too broad to assign an IMPLAN sector, the researchers used estimates associated with the broader line item s intent to distribute spending. This procedure was repeated for each finalized budget provided by the HAs. For example, expenses for fundraising events and activities were applied to IMPLAN code 377, advertising related services, as these events essentially seek to promote the organization locally and raise The Economic Impact of Pennsylvania Heritage Areas 16
17 private donation dollars. The budget categories affected by this procedure constituted less than 5 percent of total HA organizational spending. Thus, the technique should not have overly biased impact results. Considered altogether, this procedure provides a reasonable way to approximate industry assignment in the absence of more detailed information. Of the five HA operational budgets, the National Road HA demonstrated economic activity via partnering and administering large grant awards for regional partner organizations. Outside of this difference, HA organization budgets were similar in terms of operational expenditures and salary and wages commensurate with the number of paid employees. Because HAs did not provide information about the location of industries from which they made purchases, it was difficult to determine how much of the demand was directed to local firms and how much was directed to firms outside the region. Accordingly, IMPLAN s Local Purchase Percentage (LPP) in all Industry Change Events was set at a level equal to the Regional Purchase Coefficient (RPC) for that particular industry. The RPC estimates what percent of commodity demand was available for purchase from local suppliers. The regional RPCs were set according to IMPLAN s econometric method. Although purchases made outside the region represent a leakage in the model, and thus reduce the total economic impact, the technique adds realism to the modeling endeavor. Last, in cases where an Industry Change Event is associated with a specific manufactured commodity, the research team applied retail purchase margins to avoid over-estimating the degree to which the commodity is manufactured locally. For retail purchases, only a portion of the transaction remains with the local area, estimated by the model software (IMPLAN, 2015) Without further information about specific wage rates for each impacted industry no further adjustments were made to Industry Change Events. Instead, the model estimated average compensation in these sectors. The following example illustrates the technical methods of the organizational spending impacts of an HA. As Allegheny Ridge makes payments for building maintenance to local contractors, the local The Economic Impact of Pennsylvania Heritage Areas 17
18 contractors will spend a portion of these payments at local establishments to provide services and engage in household consumption. In this example, the initial round of final demand spending occurs as Allegheny Ridge disburses payments to the local contractors. This is known as the direct effect and represents all economic activity supported directly by HA expenditures. Additional rounds of spending will occur as local contractors spend part of their payments to repair items such as HVAC. As they do, home improvement stores will be required to increase spending to meet demand. This, in turn, will spur additional production by a variety of manufacturing industries that supply inputs to the manufacturing process. This is known as the indirect effect and represents the sum of all local supply chain transactions that occur as companies increase spending to meet demand originating from the local contractor. Finally, local contractors are also likely to spend a portion of their payment on household consumption. As they do, grocery stores and food manufacturers will increase spending to meet this demand. This is known as the induced effect and represents all local economic activity that occurs as households spend additional income attributable to HA payments, wages or contracts (See Figure 4). Figure 4: Illustration of Heritage Area Impact Heritage Area Organization Direct Spending and Jobs Personnel Expenditure (Compensation) Purchase of goods and services Other Operations (Office admin, repairs, Utilities) Grants/financial assistance Indirect Spending & Jobs (Supplies, equipment, etc.) Induced Spending & Jobs (Retail purchases, restaurants, etc.) Source: Economic Impact Model of Heritage Area Organization Spending, Primm, 2015 The Economic Impact of Pennsylvania Heritage Areas 18
19 Individual Heritage Area-Defined Visitation Impact and Contribution Visitor expenditures are best viewed as the initial monetary activity that stimulates the production process and initiates realistic measurement of economic benefit or impact (Frechtling, 1994). For example, visitor spending at a local restaurant requires additional spending to purchase and prepare the food. Collecting visitation data is a challenge for Pennsylvania s HAs and other state and national heritage regions in general (Stynes and Sun, 2004) The researchers used several data types to generate economic impact estimates, including HA visitation estimates, visitor types, visitor expenditures, and multipliers at the regional and state level. The large size and ambiguous borders of HAs contributed to the difficulties associated with collecting visitor data. Some of the areas geographic boundaries typically follow non-defined economic or political boundaries, such as a county or state line. For example, PA Route 6 extends across multiple counties throughout northern Pennsylvania in a narrow corridor. Similar geographic circumstances exist for National Road and Lincoln Highway. Allegheny Ridge encompasses multiple counties, but in many cases, only portions of the zip code defined region are included as part of the geographic investment area, an area defined by an HA that relates to the organization s funding, volunteerism, and a wide-range of community projects. Survey data collection across vast geographic areas is often time consuming and cost prohibitive for the limited resources available to HAs. This research was fortunate to receive sufficient funding to conduct primary surveys among visitors to quantify visitor spending input variables. The survey used for this research can be integrated with future tourism and visitor related economic impact research efforts throughout Pennsylvania. Data Sources and Assumptions The visitor survey used in the five study HAs followed an information protocol as follows: The Economic Impact of Pennsylvania Heritage Areas 19
20 Made certain that the study HA executive directors provided a comprehensive list of attractions or regional anchor sites. Attractions and anchor site partners represented a geographic or mission-based significance and were selected by the HAs. Defined the heritage visitor through qualitative and quantitative research. Heritage visitors were quantified from the research survey. Aggregated the most recent annual visitation counts from a sample of attractions and events within the HA most representative of the organization s mission. HA executive directors selected the sites based on guidance provided from the research team. Developed and executed a comprehensive visitor survey, in which the research team identified specific variables that are used in tourism economic impact research. The economic impact variables included: visitor estimates and definition, trip purpose, number of visitors per travel party, visitor segments, average length of stay for an overnight visitor, and visitor expenditures. Details of the economic impact variables are discussed below. Visitor Estimates and Definition HA executive directors provided a comprehensive list of attractions or regional anchor sites that embody the work and mission of the HA. These sites were used to begin quantifying the heritagedefined annual visitation baseline estimate. Additional research was conducted with the HAs, and on their behalf when necessary, to aggregate the most recent annual visitation counts from a sample of attractions and events within the HA most representative of the organization s mission. Through a comprehensive visitor survey, the research team identified specific variables most frequently impacting the total visitation counts utilized in tourism economic impact research. Trip Purpose Attributing visitation to an attraction, region, county, or state to the presence or existence of a heritage-defined attraction is a challenge. Not all visits to a region are for such purposes. Many visits are The Economic Impact of Pennsylvania Heritage Areas 20
21 conducted for business or personal vacations that relate little to the work of HAs or their missions. The survey and qualitative research conducted among the five HAs provided the research team with the following necessary data points to conservatively define heritage visitation. Previous research estimated that about two-thirds of the spending by HA visitors would be lost to the local region in the absence of these facilities and programs. (Stynes and Sun, 2004). As noted in Table 1, the quantitative survey found that National Road recorded the highest percentage of visitors reporting that the attraction where they completed the survey was the primary reason they visited the HA. PA Route 6 was lowest among the study HAs. Table 1: Trip Purpose by Heritage Area Heritage Area Visit to Heritage Attraction Was Primary Purpose of Trip Allegheny Ridge 64% Lincoln Highway 74% National Road 82% Route 6 58% Susquehanna Gateway 66% Overall Average 69% Source: Survey of visitors to 5 study heritage areas, 2014; 3,524 total respondents Number of Visitors per Travel Party It is essential for the quantitative analysis to translate visitation counts provided by each of the heritage attractions, events, and sites to visitation estimates per party. To estimate spending averages per day/night, the researchers treated the travel party as the spending unit. See Table 2 for the average party size for the five HAs. The Economic Impact of Pennsylvania Heritage Areas 21
22 Table 2: Average Number of Visitors Per Travel Party Heritage Area Average Number of Visitors Per Party Allegheny Ridge 3.13 Lincoln Highway 3.05 National Road 3.54 Route Susquehanna Gateway 3.98 Overall Average 3.91 Source: Survey of visitors to 5 study heritage areas, 2014; 3,524 total respondents. Members per party ranged from 1 to 21. The researchers established a total party number cap of 21 to be consistent with the methodology of the 2010 HA study (Unpublished, 2010) and to minimize the impact of large group tours. The researchers calculated the number of parties and the duration of their visit for the entire sample and by HA. Given the attempts to refine the visitor definition, the research team suggests this spending model presents a comprehensive and conservative quantification of heritage-defined visitors travelling to the region and their effect on economic impact and contribution. Visitor Segments The research methodology classified visitor segments into four unique spending patterns that were common with the 2010 HA study: 1) Local day users were defined as those day visitors living within 60 miles of the facility, attraction, or event where the completed survey was collected. The 60-mile distance was consistent with an NPS Visitor Spending study (Cullinane, Huber, and Koontz, 2014). Given the geographic irregularities, it is possible for a visitor to travel more than 60 miles yet still reside within the geographic boundaries of a single HA. One example would be a visitor from Gettysburg touring the grounds of Fort Ligonier in Ligonier, PA. Despite remaining in the HA, the visitor s spending patterns would relate more to that of a visitor traveling from outside of the geographic region. Therefore, visitors traveling more than 60 miles The Economic Impact of Pennsylvania Heritage Areas 22
23 beyond the attraction from which they completed the survey were defined as non-local, regardless of their location of residence within or beyond the HA. 2) Non-local day visitors were defined as those visitors living beyond 60 miles of the facility, attraction, or event where the completed survey was collected. 3) Overnight-hotel/motel visitors were defined as those visiting a heritage attraction, site, or facility for multiple days, including an overnight stay. These visitors spend their overnight stays at either a hotel, motel, or bed and breakfast, quantified within the visitor survey. 4) Overnight-other visitors were defined as those visiting a heritage attraction, site, or facility for multiple days, including an overnight stay. These visitors spend their overnight stays at a campground, campsite, private residence, or with friends and family (See Table 3). Table 3: Visitor Segments by Type to Heritage Areas Visitor Segment Allegheny Ridge Lincoln Highway National Road Route 6 Susquehanna Gateway Overall Visitor Average Local Day 24% 33% 29% 12% 22% 24% Non-local Day 6% 11% 11% 9% 6% 9% Overnight- Motel Overnight Other 21% 27% 34% 31% 49% 32% 49% 29% 27% 48% 23% 35% Note: Totals do not add to 100% due to rounding. Source: Survey of visitors to 5 study heritage areas, 2014; 3,524 total respondents. Average length of stay for an overnight visit To include overnight visitors and properly allocate the average daily spending amounts, the research team needed to calculate the average length of stay for overnight visitor groups within each HA. The Economic Impact of Pennsylvania Heritage Areas 23
24 Spending estimates by visitor group and industry segment type Spending estimates by category of industry type (such as hotels or restaurants) were collected through the visitor survey. The research team calculated the breakouts across visitor spending segments for the entire sample and for each HA (See Table 4). The characteristics between visitors daily spending by party varies, primarily with the largest amount spent on hotel or motel accommodations. Table 4: Average Daily Per Party Spending by Heritage Area and Visitor Segment Visitor Segment Allegheny Ridge Lincoln Highway National Road PA Route 6 Susquehanna Gateway Overall Visitor Average Local Day $ $ $87.48 $ $ $ Non-local Day $ $ $ $ $ $ Overnight - Motel $ $ $ $ $ $ Overnight - Other $ $ $ $ $ $ Source: Survey of visitors to 5 study heritage areas, 2014; 3,524 total respondents. IMPLAN Industry Multipliers and Regional Purchase Coefficient Multipliers were provided from input-output models estimated with IMPLAN. Only the margins from retail purchases were included to guard against over-estimating the degree to which the service, industry, or commodity was manufactured locally. Visitors typically do not make purchases directly from manufacturing firms (for example a factory or a farm). Instead, they are likely to make purchases at retail or wholesale establishments (restaurants). For retail purchases, only a portion of the transaction remains with the local retailer (known as the retail margin). Without further information about specific industry spending, no further adjustments were made to the Industry Change Events. Instead, the IMPLAN model estimated average compensation in these sectors. Accordingly, the Local Purchase Percentage (LPP) in all Industry Change Events was set equal to the econometric Regional Purchase Coefficient (RPC) for that particular industry. All regional model trade flows, as well as the state analysis model, use econometric RPC s calculated by IMPLAN for consistency. The Economic Impact of Pennsylvania Heritage Areas 24
25 Economic Impact and Contribution Traditionally, economic impact has been reserved to describe a change in regional output that is attributable to a change in exogenous final demand, a change in final demand that originates outside the region. In this analysis, visitor economic impact refers to results that do not include the Local Day visitor segment. Economic contribution includes all visitor segments. Essentially, for the five regional models developed for this research, visitors from beyond 60 miles of the research region were considered as originating outside the local region, therefore all economic impact references do not include the local day visitor segment. Spending by local day visitors was excluded because if local visitors choose not to visit an HA attraction, they would still likely spend a similar amount of money within the local economy at another attraction or event (Stynes, 2007). The term contribution analysis is often used when describing changes in regional output that are attributable to intermediate demand or sources of final demand that originate within the region. This report used total visitor spending and local and non-local visitors when referring to economic contributions. Note that the statewide economic impact analysis of all 12 HAs was only completed using visitors not residing in Pennsylvania. Geographic Considerations Analysis at the local level was modeled according to the specific geographic investment areas of each HA. The geographic investment area was defined by the HAs, shared with the research team, and comprised of counties and zip codes bordering the HA. Analysis at the state level was modeled with the Pennsylvania State Total IMPLAN data file. Economic Impact: Total PA Heritage Area Program (projection) Qualitative interviews suggested that not every visitor travelling to regional attractions or events could warrant the term heritage visitor; therefore not every out-of-state visitor to these attractions could be a The Economic Impact of Pennsylvania Heritage Areas 25
26 heritage-defined visitor. The research estimated conservatively those out- of-state heritage visitor s annual economic impact on Pennsylvania. The process began with annual visitation estimates for each HA. Each HA only selected the most recent available annual visitation (2014 or 2013) from specific anchor sites most representative of their mission, partnerships, and collaborators. The statewide analysis of HA visitation economic impact projections only included the proportion of visitor's residing outside of Pennsylvania (37 percent of the total sample). Out-ofstate visitors represent new dollars for Pennsylvania. A visitor segment type (day or overnight) was applied to the estimated number of out-of-state visitors.visitor segment types were calculated from the total sample of out-of-state respondents. The impact analysis only included the percentage of out-of-state visitors that indicated a heritage attraction, site, or event was their primary reason for visit. Visitation data were then adjusted to visitor parties. Finally, overnight visitation spending was tabulated by including the average number of nights an overnight group remained in Pennsylvania. This conservative calculation projected 7.5 million out-of-state party days/nights primarily attributed to HAs and their heritage defined partners, attractions, and events. The estimated 7.5 million heritage visitor party days/nights accounted for more than $2 billion of visitor related expenditures, an average of approximately $277 per party day/night. IMPLAN Definitions Bill-of-Goods Approach: A method of budget assignment used to determine which set of industries are directly impacted by HA organization demand. The annual budget of the study HAs were assigned to one of the 440 IMPLAN sectors. Jobs: Calculated as total revenue (output) divided by the output per worker for a given industry. Total employment is the sum of employment generated by direct, indirect and induced spending. Jobs are not The Economic Impact of Pennsylvania Heritage Areas 26
27 full time equivalents but include full and part time jobs, consistent with employment estimates of the Bureau of Labor Statistics. Gross Domestic Product (GDP): Calculated as the proportion of total revenue (output) that is paid to the components of value added, such as employee compensation, proprietor income, taxes on production, and profits. The contribution to GDP of a particular business or program would then be the total Value- Added associated with that business or program. Value-added is the preferred measure of the contribution of an activity or industry to gross domestic product as it measures the value added by that activity/industry net of the costs of all non-labor inputs to production. Industry Change Event: An ideal tool for modeling changes in final demand as it spreads the initial payment across the industry s entire production function. By using an industry change event to model a final demand payment, the model initiates all rounds of spending that would be expected to occur in the real world and the entire payment is accounted for in the results table. Labor Income Change: An ideal tool for modeling changes in labor income. It makes adjustments for payroll taxes and then applies the remainder of the payment to household savings and consumption. Local Purchase Percentage (LPP): The percent of direct spending that occurs within the local study area. Retail Margin: The portion of the retail purchase that remains with the local retailer (known as the retail margin). The remainder of the transaction flows to manufacturing, transportation or wholesale firms that may or may not exist in the study area. Wholesale margins that accrue to Pennsylvania firms would be included at the state level, but excluded when estimating impacts on local regions. Regional Purchase Coefficient (RPC): The percent of indirect and induced spending that is purchased within the local study area. IMPLAN s econometric methods were used. Total Output: The gross value of all financial transactions that occur in a region over a given time. It is often reported by industry. Total output differs from Gross Domestic Product (GDP) in that it includes the value of all intermediate and final goods and services. GDP only includes the value of final goods and services. The Economic Impact of Pennsylvania Heritage Areas 27
28 Limitations of the Analysis Limitations exist in all tourism research. Considering possible errors and inconsistencies in use estimates at different facilities and limited information about use patterns, the total visit estimates shared with the research team are approximations. The economic impact of HA visitation was based on methodologies observed in previous research. One challenge was attributing visitation to an attraction, region, county, or state to the presence or existence of a heritage attraction. Not all visitation to a region is for such purposes. Many visits are conducted for business or other reasons that relate little to the work of HAs or their missions. The heritage-visitor definition continues to be a challenge within the field. The research methodology attempted to quantify the difference of a heritage visit. This was done with classification questions in the visitor survey. Another challenge is the potential of travelling parties visiting multiple attractions per day, resulting in over-allocation of daily visitor party spending within the HA. The quantitative survey provided the research team with data on the occurrence of multiple heritage area attraction visits within a specific HA and even to a bordering HA: however, it did not quantify the daily occurrence or frequency of this effect. The model discounted local heritage area spending for visitor parties travelling beyond the HA during the same visit. Limitations of the survey may also include recall of spending. The survey attempts to ease the process for visitors by providing multiple choice ranges. The spending averages themselves present an average of estimated per party daily spending and not exact amounts recorded at the point of sale. Additional limitations of an input/output model, such as IMPLAN, include the accuracy of leakage measures, the emphasis on short-term effects, and the absence of supply constraints. The Economic Impact of Pennsylvania Heritage Areas 28
29 Results Qualitative Analysis The research looked to define consistencies and nuances of HA partnerships with regional stakeholders. From the qualitative analysis, the research found that the groups are really interchangeable (for example, a heritage attraction that is an HA anchor site is also a key stakeholder for the HA). The results did not reveal a distinction between partners or stakeholders. The interviews with local stakeholders confirmed that HAs were actively engaged with local partner organizations. The scope of partnerships included regional offices of the National Park Service (NPS), local historical organizations, and the local business community. Some consistencies and patterns across the five area included: the nature of HA partnerships depended on the organizational focus or needs of the HA, such as fundraising, promotion, conservation, and/or preservation; HAs often sought technical assistance, funding opportunities, or cross promotional marketing opportunities with NPS or local tourism agencies; and HAs typically served the role of technical advisor or facilitator on behalf of local businesses, conservation groups, or historical societies. Table 5 illustrates the classification type of partner or stakeholder interviewed as part of the research. The Economic Impact of Pennsylvania Heritage Areas 29
30 Table 5: Summary of Partner and Local Stakeholder Interviewees Allegheny Ridge Lincoln Highway National Road PA Route 6 Susquehanna Gateway Partners and Local Stakeholder Types Count Count Count Count Count NPS or National Forest Service Attraction or site Conservation, Trails, Greenways Local Business Community Tourism & Visitor Organization Board member Local government (elected, planner, or developer) Heritage association, museum, arts Staff member Academic or consultant Total Source: Research team qualitative data gathering, Note #1: Totals may not add due to multiple classifications of an individual stakeholder. Note #2: HAs were asked to select 10 representatives to be interviewed. The research team accommodated additional interviews, especially when associated with a focus group format. HA partners comprise two general definitions: those providing technical support and funding (for example DCNR, regional tourism organizations, and other state funded organizations) and those seeking technical support and funding (for example local museums, arts and cultural organizations, and local businesses). Beyond the general partner definitions of supporter or supported, the nature of partner relationships were consistent among the HAs. The nature of partner relationships included promotion, fundraising, preservation, and conservation, all of which contribute to the economic benefits of HAs either through operational spending or heritage related visitor spending within the region. In terms of promotion/education, HAs and their partners developed marketing ideas and implemented plans to educate visitors about attractions or events. One example was the Route 6 partnership with the Crawford County Tourism Promotion Agency to advertise sites along the corridor in Crawford County. The Economic Impact of Pennsylvania Heritage Areas 30
31 Fundraising partnerships included HAs receiving funds from partners and HAs partnering with organizations to facilitate or attract funding. The primary funding source for most HAs was DCNR. Additional funders included private donors, businesses, and public agencies. In terms of facilitating funds, HAs provided technical assistance for grant development, such as National Road and the funding of the Sheepskin Trail Feasibility Study. HAs also worked with local historical and heritage organizations to preserve culturally and historically significant places and spaces. The Lumber Museum in PA Route 6 exemplified this as well as numerous projects in the Susquehanna Gateway, including bridge lighting and Zimmerman Center for Heritage. HAs also worked with public and private organizations on conservation efforts to restore or improve natural spaces for recreation and beauty. An example is the Pittsburgh-to-Harrisburg Main Line Canal Greenway coordinated by Allegheny Ridge, which includes a large environmental conservation component. Perceived Effectiveness of HAs in Performing Their Mission The research analyzed qualitative data as they related to how each HA understood and supported the five mission statements of the statewide program including: conservation of natural areas; tourism; preserving a sense of place; community education; and preservation of historical artifacts and buildings. The research found that, while all five HAs understood and supported the mission statements, there is wide divergence among HAs in regard to specific program objectives. A number of factors accounted for this divergence, including location (rural vs. urban or semi-urban), demographics (variations in education and income levels), leadership style, geography (size of the HA) and the range of natural and historical attractions (major attractions vs. less well-known attractions). Each of these factors has impacted the organizational style and the choice of priorities. A more specific summary of findings for each mission statement area follow. The Economic Impact of Pennsylvania Heritage Areas 31
32 Conservation of Natural Areas a. Allegheny Ridge has evolved over the years to focus much of its program efforts on the conservation of natural areas with environmental significance. Its signature project is the Pittsburgh to Harrisburg Main Line Canal Greenway, a swath of land roughly two miles wide and 320 miles long. The Greenway is not a single unimpeded trail, but rather a grouping of land and water trails that follow the path of the historic Pennsylvania Main Line Canal. In developing the Greenway, Allegheny Ridge has worked closely with local partner organizations and stakeholders as well as county planning officials to promote outdoor recreation and to encourage appropriate use of natural areas that can contribute to community growth. Blairsville s River Town Village, a small development near the Conemaugh River, is a prime example of the link between conservation and community development. b. Lincoln Highway collaborates with DCNR and Trout Unlimited to conserve and promote the Laurel Highlands Trout Trail. According to a representative of Trout Unlimited, this program, though still in a developmental stage, has strong potential for tourism development. c. National Road oversees two conservation-related projects: the construction of the Sheepskin Trail, a 34-mile hiking trail that, when completed, will connect the Great Allegheny Passage to the West Virginia Mon River Trails; and the Mon River Town Program, which is helping local communities organize economic development initiatives that make use of the Monongahela River. In both of these projects, there is extensive collaboration with local citizen groups. d. PA Route 6 serves as an organizational mortar that links several organizations in the region, including Pennsylvania Wilds, Lumber Heritage Area, and Allegheny National Forest. The primary objective of this collaboration, called the PA Route Six Alliance, is to promote tourism. There have been, however, significant conservation projects, such as the Lyman Reservoir, which have involved participation by local citizens and small businesses that rely on tourism. e. Susquehanna Gateway promotes the preservation, conservation and interpretation of the Susquehanna River's cultural and natural heritage. It collaborates with several other local environmental and historical preservation organizations (Rivertownes PA, and the Conservation Society of York The Economic Impact of Pennsylvania Heritage Areas 32
33 County) as well as several small towns (Marietta, Columbia and Wrightsville that border the river) and uses local volunteers in organizing river-related events. A key project is the Lower Susquehanna Water Trail, which are 21 interpretive panels that explain the rivers history and usage. Tourism HAs generally seem to attract three kinds of tourists: Outdoor activists, age 25 to 62, who are interested in hiking, boating, rock climbing, camping, fishing and related activities. According to the Tourist Promotion Agency (TPA) representatives interviewed by the research team, this segment of the tourism industry has significant growth potential. Traditionalists, age 50 and up, who enjoy sightseeing in small towns, staying at B&Bs, nature watching (particularly for the fall foliage) and low-challenge hiking. Traditionalists are often interested in antiques and restaurants that have local charm. Families, mixed ages, who tend to stay for a weekend or a few days. Activity choices combine the outdoors and traditionalist tourism. Camping and picnicking are typical activities. All five study HAs were looking to connect regional assets to visitor destinations. All five recognize that tourism is an important driver of economic development--jobs, new businesses, tax revenue, lodging, special events, meals, etc. The study HAs, however, use different approaches to tourism development. For example, Allegheny Ridge and Susquehanna Gateway place a high priority on participation by local residents in nature-related activities. Traditional tourism marketing is left to the tourism promotion agencies. Lincoln Highway is, in effect, a tourism/preservationist organization. Its efforts to support the restoration of a number of highly unusual roadside displays and tourist attractions have been successful in capturing a moment in history the era of the family automobile vacation. In recent years, Lincoln Highway, in collaboration with the Laurel Highlands Visitors Bureau, has initiated efforts to promote the Laurel Highlands Trout Trail, which is ten high quality streams located in picturesque woodland areas. National Road has, within its boundaries, several high quality, high impact tourist attractions, including The Economic Impact of Pennsylvania Heritage Areas 33
34 Fallingwater, Ohiopyle State Park and Fort Necessity, all of which are promoted by the Laurel Highlands Visitors Bureau. Small-scale festivals and other attractions in the western part of the Heritage Area have, according to the National Road Executive Director, limited potential for tourism development, although the Whiskey Rebellion Festival in Washington, Pa., may be an exception as it has shown growth over several years. PA Route 6 collaborates with the Allegheny National Forest, the Lumber Heritage Area, and various county-based Convention and Visitors Bureaus to form the PA Route Six Alliance. This entity promotes a wide range of tourist attractions outdoor nature-based activities as well as the traditional appeal of events in small towns. Pymatuning Reservoir, Presque Isle State Park and the Kinuzua Skywalk are popular attractions. Preserving a Sense of Place Preserving a sense of place refers to programs (usually in small towns) that help maintain hometown pride through volunteer activities that preserve local traditions, special events and celebrations. For Allegheny Ridge and Susquehanna Gateway, a sense of place is the link between conservation and development: the effort to promote the use of trails and waterways by local residents as the basis for community renewal. Lincoln Highway has contributed to preserving a sense of place along the 220-mile highway by providing mini-grants and planning advice for the construction and placement of various roadside exhibits. As an example, The Mountain Playhouse in Jennerstown was able to purchase updated theater seats as a result of a mini-grant. The theater and other tourism-related organizations along the corridor have also benefited from Lincoln Highway s on organizational governance and long-term viability. The key sense of place project for Lincoln Highway is the Lincoln Highway Experience, a restored 18th century building that has been converted into a Lincoln Highway Museum (near Ligonier, Pa.) with a wide range of exhibits and a first rate video. National Road has used mini-grants to help local communities plan and develop projects. Its current collaboration with the Mon River Town Program, through which economic development projects are The Economic Impact of Pennsylvania Heritage Areas 34
35 identified, analyzed and planned, is an example that relates to pride of place as well as economic development. PA Route 6 manages a Heritage Communities Program in which some 20 communities have received small grants to develop plans for local projects. In some cases, they were able to secure significant additional project grants. The value of the program is a stimulus for local citizens to take responsibility for the future of their own communities. Community Education All five study HAs are engaged in the dissemination of information about their programs. This involves organizing volunteers, planning committees, collaboration with local organizations and government officials as well as the dissemination of printed information. National Road has developed learning tools for pre-school, 3 rd and 4 th grades to infuse local history into the classroom. Preservation of Historic Artifacts and Buildings All five HAs have committed financial and volunteer resources to the preservation of historic buildings and sites. The process of restoring historic buildings and sites, however, is often complicated and costly because of the need for experts from various fields, such as historians, engineers, architects, planners and local officials. Recent examples of successful restorations include the Zimmerman Center for Heritage of Susquehanna Gateway (formerly an 18 th century residence), the Sheetz Center for Entrepreneurial Excellence of Allegheny Ridge (formerly a department store in downtown Altoona), and the Lincoln Highway Experience, an 18 th century residence that has been converted to a Lincoln Highway museum. The Kinzua Skywalk, a spectacular historical restoration project, is a 600-foot walkway over the Kinzua gorge. Completed in 2011, it attracts thousands of visitors each year and, as such, is an important economic generator and tourism center. Designed and constructed with funds from the Pennsylvania General Assembly awarded through DCNR, it serves today as an increasingly popular tourist attraction in PA Route 6. The Economic Impact of Pennsylvania Heritage Areas 35
36 Recent historical restoration projects carried out by the five HAs also have value as administrative offices, information centers for tourists, and meeting/convening centers, but rarely as an effective economic development strategy for Pennsylvania s rural communities (The Kinzua Skywalk is an exception to this finding, but the Skywalk was not developed or coordinated by PA Route 6). However, when partnered with effective tourism promotion strategies executed by the TPAs, the historic restoration program can fill a preservation/ developmental niche in a way that benefits the regional economy. Discussing an Ongoing Protocol for Measuring Economic Impact According to the interview findings, there was no consistent pattern for collecting economic impact data. However, the research found that executive directors and staff at each of the five HAs were actively involved in collecting data using paper and online questionnaires. Quantitative Analysis The data collected from the 3,524 usable questionnaires offered the following results. Demographics The majority of respondents were females (See Chart 3). Chart 3 Respondent Gender "What is your gender?" Male 40% Female 60% Source: Survey of visitors to 5 study heritage areas, 2014; 3,524 total respondents. The Economic Impact of Pennsylvania Heritage Areas 36
37 The largest segment of respondents (25 percent) reported household incomes of $50,000 to $75,000. Sixty-eight percent of all respondents reported income of more than $50,000 (See Chart 4). 30% 20% 10% 9% Chart 4 Respondent Household Income "Which best describes your total household income?" 25% 23% 20% 23% 0% Less than $25k $25-50k $50-75k $75-100k $100k+ Source: Survey of visitors to 5 study heritage areas, 2014; 3,524 total respondents. The largest proportion of respondents was in the age group (See Chart 5). A minority (35 percent) of respondents was in the age group. Chart 5 Respondent Age "Which best describes your age?" 30% 20% 10% 6% 12% 15% 20% 25% 22% 0% Source: Survey of visitors to 5 study heritage areas, 2014; 3,524 total respondents. A majority of respondents (55 percent) had at least a bachelor s degree (See Chart 6). The Economic Impact of Pennsylvania Heritage Areas 37
38 40% 30% 20% 10% 0% 29% Some high school/trade school Chart 6 Respondent Education Level "Which best describes your education?" 17% High school grad 30% Bachelor's degree 25% Master's degree+ Source: Survey of visitors to 5 study heritage areas, 2014; 3,524 total respondents. The 2010 HA study did not include references to the demographic measures noted above, so no comparison could be made between the two studies. Awareness of Heritage Program and Areas Only one-third (33 percent) of respondents reported that they were aware of the Pennsylvania HA Program (See Chart 7). Chart 7 Awareness of PA Heritage Area Program "Have you ever heard of the PA Heritage Areas Program?" Yes 33% No 67% Source: Survey of visitors to 5 study heritage areas, 2014; 3,524 total respondents. In the 2010 HA study, 44 percent of respondents reported that they were either not familiar or not sure about the existence of the HA program. Lincoln Highway enjoyed the highest awareness of all five study HAs, with 60 percent of respondents saying they were aware of the area before their visit. It was also the only HA where more than 50 percent of respondents reported awareness prior to their visit (See Chart 8). The Economic Impact of Pennsylvania Heritage Areas 38
39 Allegheny Ridge Chart 8 Awareneness of Heritage Area "Were you aware of the Heritage Area before this visit?" 0% 10% 20% 30% 40% 50% 60% 70% 80% 44% 56% Lincoln Highway National Road 37% 40% 60% 63% Yes No PA Route 6 44% 56% Susquehanna Gateway 25% 75% Source: Survey of visitors to 5 study heritage areas, 2014; 3,524 total respondents. Nature of Visits/Attitudes Thirty-nine percent of respondents said this was their first trip to the HA where they completed the questionnaire (See Chart 9). Chart 9 First Trip to This Area? "Is this your first trip to this area?" Yes 39% No 61% Source: Survey of visitors to 5 study heritage areas, 2014; 3,524 total respondents. This percentage of first-time visitors was exactly the same as reported in the 2010 HA study. Word of mouth was the overwhelming source (58 percent) of information about the attraction. The Internet was the second most-cited source, with 17 percent of total respondent mentions, followed by traditional media like newspapers, magazines, billboards, TV, and radio, all with single digit responses. The Economic Impact of Pennsylvania Heritage Areas 39
40 Social networks represented only 6 percent of total mentions, although some respondents may have included this medium within the other category of the Internet, (See Chart 10). Word of Mouth Internet Newspaper Magazine Social Network Billboard TV Radio Chart 10 Source of Attraction Information? "How did you hear about the attraction you are visiting today?" 0% 20% 40% 60% 80% 3% 2% 1% 6% 6% 6% 17% 58% Source: Survey of visitors to 5 study heritage areas, 2014; 3,524 total respondents. This measure was not reported in the 2010 HA study. Seeing heritage attractions was the top reason (39 percent) cited by respondents for visiting the HA where they received their questionnaire. Outdoor recreation was also a strong lure for visitors, with 22 percent of respondents reporting it was the reason they visited the HA (See Chart 11). See heritage attractions For outdoor recreation I live here Visiting friends/family Just passing through Chart 11 Primary Reason for Visiting "What is your primary reason for being in this area?" 0% 10% 20% 30% 40% 50% 8% 13% 19% 22% 39% Source: Survey of visitors to 5 study heritage areas, 2014; 3,524 total respondents. The survey also asked respondents to identify if the attraction they visited was their primary reason for visiting. These results differed slightly from the 2010 HA study, which reported that 62 percent of respondents said the attraction they were visiting was the primary reason for their trip to the HA. The Economic Impact of Pennsylvania Heritage Areas 40
41 Ninety-one percent of respondents reported being very or somewhat satisfied with their visit (See Chart 12) and 89 percent said they were very or somewhat likely to return in the future (See Chart 13). Source: Survey of visitors to 5 study Chart heritage 12 areas, 2014; 3,524 total respondents Satisfaction With Visit "Overall, how satisfied have you been with your visit to the Heritage Area?" 100% 77% 50% 0% Very satisfied 14% Somewhat satisfied 6% 1% 2% Neutral Somewhat dissatisfied Very Dissatisfied Source: Survey of visitors to 5 study heritage areas, 2014; 3,524 total respondents. Chart 13 Likelihood To Visit Again "How likely would you be to come back to the Heritage Area?" 100% 50% 0% 67% 22% 8% 2% 1% Very likely Probably Neutral Probably not Very unlikely Source: Survey of visitors to 5 study heritage areas, 2014; 3,524 total respondents Neither of the measures noted above were reported in the 2010 HA study. Economic Impact HA visitation provides a significant economic impact to a region s economy (Stynes and Sun, 2004). Attraction of tourists to a region is not the primary function of HAs although their work is very much interconnected with local TPAs and partners. Tourism and the promotion of sustainable economic development associated with tourism varies among the HAs studied. Collecting accurate visitation estimates to the HAs is a challenge, as noted in previous research and this study s limitations. The quantification of visitor numbers used visitation data provided by the staff of The Economic Impact of Pennsylvania Heritage Areas 41
42 each HA and their partners. The visitation counts did not include every attraction, site, or event located within boundaries of an HA to avoid overestimating total visitation. Qualitative interviews suggested that not every visitor travelling to regional attractions or events could warrant the term heritage visitor. For this reason, the survey attempted to capture this variable of economic impact/contribution by asking: was one or more of these attractions the primary reason for your trip to our area?. As shown in Chart 14, a majority of respondents visited each HA primarily for the heritage attractions; however, the proportion varied from a high of 82 percent for National Road to a low of 58 percent for PA Route % 80% 60% 40% 20% 64% Chart 14 Primary Reason for Visit "Was one or more of these attractions the primary reason for you trip to our area?" 36% 74% 26% 82% 18% 58% 42% 66% 34% 70% 30% Yes No 0% Allegheny Ridge Lincoln Highway National Road PARoute 6 Susquehanna Gateway Total Sample Source: Survey of visitors to 5 study heritage areas, 2014; 3,524 total respondents. Finally, qualitative interviews also identified another unique aspect of HA visitation estimates. It is possible, and more likely in some HAs, for visitors to shuffle between HAs during a single visit. This is often noted among the areas that share borders or tourism promotion organizations. This nuance of HA visitors was accounted for by discounting responses that indicated the respondents were visiting attractions beyond the HA local region for which they completed the survey. As Chart 15 shows, more than 90 percent of visitors for three of the five study HAs said their visit was strictly within HA geographic borders while two (National Road and Lincoln Highway) recorded a larger percentage of visitors who crossed over the geographic border of the HA to visit another HA during their trip. The research team believes this is due to the unique nature of these two HAs, and to two major The Economic Impact of Pennsylvania Heritage Areas 42
43 attractions, in particular, which received cross-visitorship (Flight 93 in Lincoln Highway received many visits from National Road visitors, and Fallingwater in National Road received many visits from Pittsburgh visitors.) Chart 15 Visitation Beyond Heritage Area Borders Comparison of results of "Please lis a few of the facilities/attractions you have visited/or will visit during your stay in our area" 0% 50% 100% Allegheny Ridge Lincoln Highway National Road PA Route 6 Susquehanna Gateway 6% 12% 15% 4% 2% 94% 88% 85% 96% 98% Visited attractions in HA only on trip Visited attractions outside HA on trip Source: Survey of visitors to 5 study heritage areas, 2014; 3,524 total respondents. In terms of total visitation data, Table 6 indicates that PA Route 6 enjoyed the largest number of total and overnight party days/nights, based largely on its unique geographic nature. Table 6: Annual Visitor Types and Duration of Visit Heritage Areas Allegheny Lincoln National PA Susquehanna Ridge Highway Road Route 6 Gateway Local Day Party 33, , , ,964 19,190 Non-local Party 8,296 61,724 49, ,512 5,234 Overnight - 81, , ,123 1,161, ,658 Motel Party Overnight - 254, , ,633 3,056,555 78,643 Other Party Total # of Party Days/Nights 378,085 1,219, ,633 4,497, ,725 Source: Survey of visitors to 5 study heritage areas, 2014; 3,524 total respondents. Table 7 shows that the majority of spending for day visitors was concentrated in restaurants and bars, amusements (admissions and activities), and retail purchase categories, while the majority of spending for overnight visitors were attributed to lodging expenditures. The Economic Impact of Pennsylvania Heritage Areas 43
44 Table 7: Percent of Average Spending Categories by Visitor Type Total Sample Motel, Camping Restaurants Local hotel, Amusements Groceries Gas & oil fees & bars transport Visitor Type B&B Local Day 0% 0% 32% 29% 6% 13% 0% 19% 0% 0% 30% 30% 5% 13% 1% 20% Non Local- Day Overnight - Hotel/Motel Overnight - Other To estimate the economic impact of each of these tourism-related spending categories, the research team matched the data collected in the paper and online surveys with the following IMPLAN industry activity sectors as noted in Table 8. Retail purchases 34% 0% 22% 16% 3% 8% 1% 16% 0% 5% 30% 22% 8% 12% 2% 20% Note: Totals may not add to 100% due to rounding. Source: Survey of visitors to 5 study heritage areas, 2014; 3,524 total respondents. Table 8: IMPLAN Economic Model Industry Sectors IMPLAN Sector Sector Name Spending Type 324 Retail stores Food and beverage Groceries 326 Retail stores Gasoline stations Gas & oil 329 Retail stores General Retail Purchases merchandise 336 Transit and ground passenger Local transportation transportation 410 Other amusement and recreation Amusements industries 411 Hotels and motels, including Motel, hotel, B&B casinos 412 Other lodging accommodations Camping fees 413 Food service and drinking place Restaurants & bars Source: IMPLAN Group, LLC. In terms of the different types of visitors, PA Route 6 received the greatest proportion of overnight visitors (See Chart 16), with 79 percent of respondents reporting overnight stays. Nearly half of the PA Route 6 and Allegheny Ridge visitors represented overnight guests at a camp, a private residence, or with friends. Approximately one-third of visitors to Lincoln Highway and National Road anchor sites The Economic Impact of Pennsylvania Heritage Areas 44
45 were local day visitors. Visitor segment type correlates to the total amount spent per day by a heritagedefined visitor party. 120% 100% 80% 60% 40% 20% 0% 49% 21% 6% 24% Chart 16 Visitor Type by Segment 29% 27% 27% 34% 11% 11% 33% 29% 48% 31% 9% 12% 23% 49% 6% 22% Allegheny Ridge Lincoln Highway National Road Route 6 Susquehanna Gateway Local Day Party Visits Overnight - Motel Party Visits Non-local Day Party Visits Overnight - Other Party Visits Source: Survey of visitors to 5 study heritage areas, 2014; 3,524 total respondents. Economic Impact: 5 Study Areas The economic impact of heritage-defined visitation provides substantial economic benefits for the local region and state. Heritage tourism is a key segment of Pennsylvania's overall tourism economy, and in particular the five study HAs. As noted in Table 9, the research estimated that the five study HAs had a range of total visitor spending from $64.5 million in Susquehanna Gateway to $1.1 billion in PA Route 6 across the industry segments, ranging from hotel stays to retail purchases. Total jobs supported ranged from 764 in Susquehanna Gateway to 12,529 in PA Route 6, and total output ranged from $58.32 million in Susquehanna Gateway to $909 million in PA Route 6. Given the significantly larger visitation estimates provided by PA Route 6, it is not surprising their heritage-visitation impact was substantially greater than the other participating HAs. The Economic Impact of Pennsylvania Heritage Areas 45
46 Table 9: Heritage Visitor Contribution Results for 5 Study Heritage Areas Spending Impact Allegheny Ridge Lincoln Highway Heritage Areas National Road Route 6 Susquehanna Gateway Visitors (# of Party days/nights) 378,085 1,219, ,633 4,497, ,724 Heritage Visitor Spending (000's) $69,203 $279,991 $163,436 $1,077,590 $64,454 Direct Effect Jobs 599 2,827 1,816 9, Labor Income (000's) $15,013 $58,138 $32,792 $221,485 $12,584 Value Added (GDP) (000's) $20,671 $88,776 $52,600 $324,874 $20,168 Output (000's) $35,332 $159,547 $97,596 $569,675 $35,527 Total Effect Jobs 741 3,537 2,230 12, Labor Income (000's) $22,155 $84,894 $49,593 $322,712 $19,873 Value Added (GDP) (000's) $32,952 $136,849 $81,804 $509,309 $33,612 Output (000's) $55,352 $243,492 $148,317 $908,800 $58,297 Source: Survey of visitors to 5 study heritage areas, 2014; 3,524 total respondents. Table 9 shows how heritage visitors contribute substantial economic benefit to the local region. The regional contribution noted in Table 9 represents the benefit of all visitor party spending. The research team also looked at regional impacts to measure the likely loss in economic activity within the local region in the absence of the heritage area identified attraction, event, or park. This analysis excludes spending by local residents and focuses on dollars entering the region from the outside (spending of visitors from the immediate vicinity of the attraction visited was excluded). As Table 10 indicates, outside visitors to the five study HAs (either non-local day visitors or overnight visitors) attract annual spending ranging from $62.3 million for Susquehanna Gateway to $1.06 billion for PA Route 6. The Economic Impact of Pennsylvania Heritage Areas 46
47 Table 10: Non-Local, Heritage Visitor Impact Results for 5 Study Heritage Areas Spending Impact Non-Local or Overnight Visitors Visitors (Party days/nights) Heritage Visitor Spending (000's) Allegheny Ridge Lincoln Highway Heritage Areas National Road Route 6 Susquehanna Gateway 344,903 1,034, ,045 4,336, ,535 $65,606 $258,873 $151,750 $1,056,641 $62,251 Direct Effect Jobs 564 2,603 1,667 9, Labor Income (000's) $14,164 $53,628 $30,318 $216,916 $12,117 Value Added (GDP) (000's) $19,534 $82,316 $48,862 $318,603 $195,01 Output (000's) $33,386 $147,854 $90,403 $558,669 $34,326 Total Effect Jobs 699 3,260 2,050 12, Labor Income (000's) $20,914 $78,396 $45,873 $316,157 $19,152 Value Added (GDP) (000's) $31,137 $126,814 $75,890 $499,413 $32,470 Output (000's) $52,300 $225,530 $137,340 $891,101 $56,282 Total jobs supported ranged from 735 in Susquehanna Gateway to 12,271 in PA Route 6, and total output ranged from $56.2 million in Susquehanna Gateway to $891 million in PA Route 6. Table 11 illustrates the aggregate regional multipliers used for per party spending. Aggregate event multipliers are the cumulative result of the individual industry multipliers impacted by tourism spending. For example, for every four jobs directly supported by heritage visitor spending another indirect job is supported annually. Source: Survey of visitors to 5 study heritage areas, 2014; 3,524 total respondents. Table 11: Regional Impact Aggregate Event Multipliers - Visitor Party Spending Allegheny Ridge Lincoln Highway National Road Route 6 Susquehanna Gateway Jobs Labor Income ($000's) Value Added (GDP) ($000's) Output ($000's) Note: The model used 2012 Pennsylvania data sets with the event year adjusted to 2014 to correspond with the survey data. Source: Survey of visitors to 5 study heritage areas, 2014; 3,524 total respondents. The Economic Impact of Pennsylvania Heritage Areas 47
48 Findings from the 2010 HA study aggregated spending and job impact across all eight of its study HAs, including Allegheny Ridge, Lincoln Highway, National Road, PA Route 6, Susquehanna Gateway, Delaware and Lehigh, Lumber Heritage, and the Oil Region HA Impact Study (8 HAs) Total visitor spending: $301 million Total job impact: 6,030 Total value added: $247 million Source: Economic Impact of Pennsylvania s Heritage Areas, In the economic impact and economic contribution analyses, total heritage visitor spending is reported as well as the direct and total (direct and secondary) effects of spending in terms of jobs, income, value added, and output (sales) at a regional level. Jobs are not full-time equivalents but include full- and part-time jobs, consistent with employment estimates of the Bureau of Labor Statistics. Output represents the sales of businesses in the region, with the exception that sales in the retail trade sector are only the retail margins on retail sales and therefore exclude the cost of goods sold. Income is measured as labor income, which includes wages and salaries, payroll benefits, and income of sole proprietors. Value added includes labor income as well as profits and rents and indirect business taxes. The research team believes value added is a preferred measure of the contribution of an activity or industry to gross state product because it measures the value added by that activity/industry net of the costs of all non-labor inputs to production. Visitation estimates provided by PA Route 6 represent the organization s close partnerships within the expansive rural geographic region in which state parks and tourism promotion agencies collaborate on strategies to connect the visitors travel through the corridor. PA Route 6 visitation included many of state park partnerships including visitation to some heavily visited state parks including Presque Isle and Pymatuming. Lincoln Highway visitation includes key anchor attractions such as Gettysburg Visitor s Center and Idlewild Park at the bookends of the corridor. Flight 93 and Linn Run State Park are two additional visitor attractions identified as key partners in visitor attraction to Lincoln Highway. The Economic Impact of Pennsylvania Heritage Areas 48
49 Fallingwater and Ohiopyle State Park provide National Road with two unique and powerful attractions within the HA. The economic impact of individual HA organizations provide a nominal economic benefit to the local economy. Evidence from interviews with HAs and their partners suggest HAs work diligently to extend every DCNR dollar invested. This was also made evident to the research team through the review of the operating budgets. Direct efforts of the HA organizations include fundraising with private donors and funding agreements with local government. The indirect and induced impacts associated with HA spending and payrolls provide additional nominal economic benefits for the local economy, as noted in Table 12. Each HA s operational expenditures and regional impact were analyzed individually. Table 12: Detailed Operational Economic Effects of the 5 Individual Study Heritage Areas Operational Impact - Allegheny Ridge Local Geographic Investment Area - FY 2014 Budget Impact Type Jobs Income GDP Output Direct Effect 4 $222,642 $241,933 $263,436 Indirect Effect 0 $5,735 $9,113 $14,893 Induced Effect 1 $41,742 $73,612 $117,925 Total Effect 5 $270,119 $324,658 $396,254 Event Multiplier Operational Impact - Lincoln Highway Local Geographic Investment Area - FY 2013 Budget Impact Type Jobs Income GDP Output Direct Effect 2 $100,763 $111,985 $127,774 Indirect Effect 0 $2,677 $4,747 $8,721 Induced Effect 1 $21,895 $40,042 $67,856 Total Effect 3 $125,335 $156,774 $204,351 Event Multiplier The Economic Impact of Pennsylvania Heritage Areas 49
50 Table 12 (continued): Detailed Operational Economic Effects of the 5 Individual Study Heritage Areas Operational Impact - National Road Local Geographic Investment Area - FY 2014 Budget Impact Type Jobs Income GDP Output Direct Effect 5 $185,589 $163,916 $255,600 Indirect Effect 0 $14,740 $29,137 $50,501 Induced Effect 1 $42,228 $75,915 $129,322 Total Effect 6 $242,557 $268,968 $435,423 Event Multiplier Operational Impact - PA Route 6 Local Geographic Investment Area - FY 2014 Budget Impact Type Jobs Income GDP Output Direct Effect 3 $105,005 $112,988 $131,481 Indirect Effect 0 $3,203 $5,709 $10,737 Induced Effect 1 $24,033 $44,212 $77,583 Total Effect 3* $132,241 $162,909 $219,801 Event Multiplier *Note, Totals may not add due to rounding, Operational Impact - Susquehanna Gateway Local Geographic Investment Area - FY 2013 Budget Impact Type Jobs Income GDP Output Direct Effect 5 $278,150 $305,522 $335,564 Indirect Effect 0 $7,273 $11,949 $20,405 Induced Effect 2 $68,546 $127,948 $210,900 Total Effect 7 $353,969 $445,419 $566,869 Event Multiplier Source: Survey of visitors to 5 study heritage areas, 2014; 3,524 total respondents. Direct effects represent spending by employees of the HA organization and direct spending by the organization within the local geographic investment region. Of the five HA operational expenditure budgets analyzed, National Road demonstrated substantial economic activity partnering with regional organizations and administering grant awards. More than $140,000 of the National Road FY 2014 expenditures represented payments to organizations in the form of grant award administration. The grant funds were used to complete a feasibility study regarding a shuttle and transit service for visitors through the National Road and planning stage funding for the Sheepskin Trail, construction of 1.4 miles from the West Virginia line through Point Marion Borough. The Economic Impact of Pennsylvania Heritage Areas 50
51 These dollars provided the research team an ideal opportunity to illustrate the effects of grant award funding and the increased economic effect of an HA within the local economy. Table 12 illustrated the increased effect of grant expenditures on National Road s GDP (Value Added) event multiplier (1.64) compared to the four other HAs. The ability and opportunity for HAs to facilitate and partner on larger economic development planning and execution grants increases the economic impact within the local region. This activity also enhances the economic value of HAs as they may use technical expertise to promote economic development with partners. Lincoln Highway had a successful history of administering grants awarded by DCNR from 1996 through During that time, approximately $1.6 million was administered to partner organizations within the six-county corridor. The size and frequency of DCNR grants has decreased during the past several years. Based on interviews with Lincoln Highway staff, the HA has received approximately $50,000 in grants to administer each of the last 3 years (Herbert Interview). DCNR has encouraged HA organizations to capitalize on technical expertise to pursue non-dcnr grant sources. The intangible economic benefits of HAs include sustaining the culture and heritage of an area, as well as partnering with TPAs to attract tourist dollars and with local chambers to attract businesses and promote economic development in rural Pennsylvania. Economic Impact: Total PA Heritage Area Program (projection) All 12 Pennsylvania HAs collectively work together to support tourism and its related economic impact. However, quantifying visitation to HAs at the statewide level is very challenging. To address this challenge, the heritage-defined visitor spending impact calculation began with visitation data provided by the HAs and their partners. The visitation counts did not include every attraction, site, event, or park located within the boundaries of an HA to avoid overestimating total heritage related visitation. The total number of heritage-related visitors shared with the research team was estimated at approximately 38 million (See Table 13). The Economic Impact of Pennsylvania Heritage Areas 51
52 Table 13: Visitation Estimates by Heritage Area Heritage Area Annual Visitation Estimates Allegheny Ridge 676,177 Delaware & Lehigh 1,741,115 Endless Mountains 345,583 Lackawanna Heritage Valley 525,092 Lincoln Highway 2,312,736 Lumber Heritage 4,346,634 National Road 1,988,656 Oil Region 226,665 Rivers of Steel 2,523,431 Route 6 9,236,882 Schuylkill River 13,787,361 Susquehanna Gateway 526,000 Total 38,236,332 Source: All data provided by staffs at each heritage area, The qualitative interview results suggested that not every visitor travelling to regional attractions or events could warrant the term heritage visitor, therefore, not every out-of-state visitor to these attractions could be a heritage-defined visitor. The research survey allowed the research team to temper the raw estimate of 38.2 million total visitors to an estimate of those that can be conservatively counted as out-of-state heritage visitors spending money in Pennsylvania. The conservative calculation projected 7.5 million out-of-state party days/nights primarily attributed to HAs and their heritage defined partners, attractions, and events. The estimated 7.5 million heritage visitor party days/nights accounted for more than $2 billion of visitor-related expenditures, an average of approximately $277 per party day/night. Margins are applied for retail purchases to account for only the portion of a transaction remaining with the local retailer (known as the retail margin). The research team then adjusted the amounts in each IMPLAN sector for regional availability or local purchase percentage (LPP), the percent of direct spending that occurs within the local study area. The IMPLAN econometric RPC model was used for the state analysis, corresponding with the regional RPC method. The Economic Impact of Pennsylvania Heritage Areas 52
53 Overnight visitor parties staying at motels spent the most, on average, of approximately $341 per day/night of their party visit (See Table 14). A small portion, approximately 5 percent of the Day Trip visitors not residing in Pennsylvania, were classified as Local, within the 60 mile radius of the HA site where the survey was completed. These out-of-state residents live in towns bordering the Pennsylvania border. Type of Visitor Table 14: Per Party Spending Out of State Visitors Total Per Party Spending Average Motel, hotel, B&B Camping fees Restaurants & bars Amusements Groceries Gas & oil Local transport Retail purchases Local Day $ % 0% 32% 29% 6% 13% 0% 19% Non-local Day $ % 0% 30% 30% 5% 13% 1% 20% Overnight - Motel Overnight Other $ % 0% 22% 16% 3% 8% 1% 16% $ % 5% 30% 22% 8% 12% 2% 20% Sources: Survey of visitors to 5 study heritage areas, 2014; Visitation estimates from heritage area staffs, Based on these data, the estimated direct contribution of visitor spending to the state economy was 19,333 jobs, $477.8 million in labor income, and $709 million in value-added effects (See Tables 15 and 16). Including secondary effects, the total contribution of visitor spending to the state economy was 25,708 jobs, $798 million in labor income, and nearly $1.3 billion in value added effects. Table 15: Overall Annual Visitor Impact Results for All 12 Pennsylvania Heritage Areas Statewide Model Spending - Impact/Non-Residents 12 Pennsylvania Heritage Areas Visitors (Party days/nights) 7,539,755 Heritage Visitor Spending (000's) $2,089,077 Direct Effect Jobs 19,333 Labor Income (000's) $477,881 Value Added (GDP) (000's) $709,062 Output (000's) $1,208,247 Total Effect Jobs 25,708 Labor Income (000's) $798,114 Value Added (GDP) ($000's) $1,263,295 Output ($000's) $2,147,091 Sources: Survey of visitors to 5 study heritage areas, 2014; Visitation estimates from heritage area staffs, The Economic Impact of Pennsylvania Heritage Areas 53
54 Table 16: Detailed Impact Results for All 12 Pennsylvania Heritage Areas Direct Effects Sector Jobs Labor Income (Millions) Value Added (GDP) (Millions) Output (Millions) Restaurants and bars 7,926 $174,606 $240, ,153 Other amusement and recreation industries 6,214 $150,228 $199, ,430 Hotels, motels, and B&Bs 2,294 $69,292 $155, ,074 Retail establishments 1,491 $39,207 $59,087 82,335 Grocery and convenience stores 507 $14,182 $18,959 28,172 Transit and ground transportation services 353 $10,175 $9,141 16,640 Gas stations 311 $9,620 $14,066 $21,018 Camping and other accommodations 235 $10,566 $12,802 $22,422 Total 19,333 $477,881 $709,062 $1,208,247 Secondary Effects 6,375 $320,233 $554,233 $938,844 Total Effects 25,708 $798,114 $1,263,295 $2,147,091 Note: Rounding totals may not add exactly. Sources: Survey of visitors to 5 study heritage areas, Visitation estimates from heritage area staffs, The heritage-defined visitation aggregate multipliers used to develop the impact estimates are provided in Table 17. The indirect effects are calculated to represent how $1 of direct spending redistributes through the Pennsylvania economy. Table 17: Heritage Visitor Impact Results Statewide Visitation Aggregate Multipliers Jobs Event Multiplier 1.33 Labor Income Event Multiplier 1.67 Value Added Event Multiplier 1.78 Output Event Multiplier 1.78 Source: IMPLAN software and analysis, A recently published report for the entire Pennsylvania tourism industry estimated traveler spending generated $68.4 billion in total economic activity throughout all industries in Pennsylvania in 2013 (Tourism Economics, 2014). According to this report, travel and tourism-related economic activity supported 478,888 jobs in total (direct and indirect jobs) in Pennsylvania in 2013, representing 6.5 percent of total employment. The Economic Impact of Pennsylvania Heritage Areas 54
55 The state s travel and tourism sector was directly responsible for an estimated $15.3 billion of the state s 2013 GDP. Comparably, the HA value-added effect was directly responsible for $709 million in This research and the conservative definition of heritage visitation suggests heritage tourism, a subcomponent of the larger statewide tourism industry, supports a substantial number of jobs across the state, particularly within the restaurant, amusement, and retail industries. To put this impact into perspective, heritage tourism employs nearly 23,000 jobs, including direct and indirect effects. Heritage-defined visitors were responsible for more than $126.5 million in state and local tax revenues in State and local tax revenue includes employee contributions, household taxes (income, real estate, etc.) and corporate profits taxes. New Business Development In addition to the economic impact findings, the research team looked at new tourism-related business start-ups within the five study HAs. The following tables are a listing of businesses, which started operations in the past 5 to 10 years, which were provided by the executive directors in each of the five HAs. The Economic Impact of Pennsylvania Heritage Areas 55
56 Table 18: New Tourism-Related Businesses Startups in the Allegheny Ridge HA New business Name Location New business Name Location The Olde Salt Restaurant Feiling's Farm Market Tony s Dog House Heritage Inn Rockhoppers Twisted Thistle Coco s Coffee Shop Rivertown Pub Red Rose Baskets The Canvas Art and Gift Shop Simple Gatherings Gift Shop Mary s déjà vu This, That & More Market Street Resale Shop Scoop s Ice Cream Parlor The Koffee Shoppe Crumpets Tea Shop Founders Gallery & Gifts Lehosky s Curiosity Shop Karst Conservancy Education Ctr. ARTWORKS Gallery Asiago s Tuscan Italian Restaurant B & L Wine Cellars Coal Tubin Raft Rentals Flood City Cafe Grande Halle Hey Day Diner JR s Café Johnstown Tomahawk s Hockey Press Bistro Quaker Steak & Lube Slim Adams Bakery Bill Sell s BOLD Restaurant Bombshell Vintiques DiVersity Salon Altoona s My Girl Bridal & Formal Saltsburg Avonmore Avonmore Apollo Apollo Leechburg Leechburg Leechburg Freeport Freeport Freeport Blairsville Blairsville Blairsville Blairsville Blairsville Blairsville Blairsville Blairsville Blairsville Johnstown Johnstown Johnstown Johnstown Johnstown Johnstown Johnstown Johnstown Johnstown Johnstown Johnstown Johnstown Altoona Altoona Altoona Altoona Bloom Yoga Soul Platter (restaurant)dining Car Café (PSU) 321 Gallery Bandito Burrito JEMS Funky Consignments & More Ozzie s Sandwich Shop Radiance Day Spa Dutch Hill Chocolates FINDS Calico Cat Gifts Cheryl s Critter Cuts Playtime Pottery, LLC Allegheny Street Coffee Co. Roxanne s Renaissance Kevin Charles Clothing The Mimosa Courtyard Inn Allegheny Street B&B Thompson s Pharmacy Delightful Ewe Yarn Shop All Capture Flash Photography Front Street Deli Lindsey s Cupcakes Allegheny Creamery and Crepe Carmelina s New & Used Unique Home Décor Honey Creek Bill & Beak Nature s Harmony Snowflake s Fine Points Screen Printing Mifflin County Huskies Merchandise Bittersweet Studios Bliss Skate & Bike Smith s Sub House Source: All information provided by staff at each of the 5 study heritage areas. Altoona Altoona Altoona Altoona Hollidaysburg Hollidaysburg Hollidaysburg Hollidaysburg Hollidaysburg Hollidaysburg Hollidaysburg Hollidaysburg Hollidaysburg Hollidaysburg Hollidaysburg Hollidaysburg Hollidaysburg Hollidaysburg Hollidaysburg Hollidaysburg Hollidaysburg Hollidaysburg Hollidaysburg Hollidaysburg Hollidaysburg Hollidaysburg Huntingdon Huntingdon Lewistown Lewistown Lewistown Lewistown Lewistown The Economic Impact of Pennsylvania Heritage Areas 56
57 Table 19: New Tourism-Related Businesses Startups in Lincoln Highway HA New business Name Location New business Name Location Sundawg Café Chef Mark s Palate The Pier Lapp Family Market Latrobe Family Cinema Jaffre s Springhill Suites Steel Wheel Grille Conte Design Batter Up Cakes Black Bunny Thistledown at Seger House B & B Country Cupboard The Lincoln Cafe the Gulf Station Millstone Inn Greensburg Latrobe Latrobe Latrobe Latrobe Youngstown Youngstown Ligonier Ligonier Ligonier Ligonier Ligonier Laughlintown Buckstown Reels Corner Schellsburg Seasoned Grille Horn o Plenty Everything Tea Deb s Vintage and Variety Briar Valley Winery Unique Stitches Beverly s Touch of Class 1758 Fair Trade Locality Alpaca Shop Finely Bee Antiques Bird s Nest Farm and Café HeBrews Coffee Union Hotel and Restaurant Barndollar House B & B Schellsburg Wolfsburg Bedford Bedford Bedford Bedford Bedford Bedford Bedford Bedford Bedford Bedford Bedford Everett Everett Source: All information provided by staff at each of the 5 study heritage areas. Table 20: New Tourism-Related Businesses Startups in National Road HA New business Name Location New business Name Location Simply Sweet Boutique Maywood Grille Hartzell House B & B Fernwalk Guest House The Thompson House Restaurant Comfort Inn & Suites Olive Garden El Patron Restaurant Liberty Bell Antiques Yesterday s Today Antiques Sonny s Sports Bar and Restaurant Shogun Hibachi The Food Bar Scenery Hill Chalk Hill Addison Addison Addison Brownsville Uniontown Uniontown Uniontown Uniontown Uniontown Uniontown Brownsville Sweetie s Cinnamon House Joe s Dogs Ohiopyle Bakery Firefly Chocolates Sunoco Gas Station Route 40 Diner Nemacolin Wooflands Pet Resort & Spa Hearts in the Attic Shop Fall s Market (expansion) Historic Summit Inn (expansion) Nemacolin Woodlands (Lady Luck Casino) Source: All information provided by staff at each of the 5 study heritage areas. Scenery Hill Farmington Ohiopyle Ohiopyle Farmington Brownsville Farmington Washington Ohiopyle Farmington Farmington Table 21: New Tourism-Related Businesses Startups in the PA Route 6 HA New business Name Location New business Name Location Comfort Inn Cobblestone Inn GiGi s Route 6 Diner Painted Finch Gallery CJ Spirits Mansion District Inn PA Wilds Executive Suites Rose Boutique Cooper s Generation Edinboro Corry Corry Corry Kane Smethport Smethport Smethport Port Allegany Froggy Bottom Outfitters Potter County Artisan Center Mountain Mama Merchantile Alleghany River Campground Card Creek Winery Crystal Spheres Pop s Culture Shoppe Grovedale Winery The Cooperage Port Allegany Coudersport Coudersport Roulette Roulette Genesee Wellsboro Wyalusing Honesdale Source: All information provided by staff at each of the 5 study heritage areas. The Economic Impact of Pennsylvania Heritage Areas 57
58 Table 22: New Tourism-Related Businesses Startups in the Susquehanna Gateway HA Garth Gallery and Cafe Turkey Hill Experience Chiques Outfitters Kettleworks Brew Pub Columbia Columbia Columbia and Marietta Columbia Bootleg Antiques Burning Bridge Tavern Half Nuts Popcorn John Wright Restaurant (expansion) Source: All information provided by staff at each of the 5 study heritage areas. Columbia Wrightsville Wrightsville Wrightsville Conclusions Qualitative Organizational Challenges All five study HAs were extremely active in their respective communities as planners, partners and advisors. Executive directors and their small staffs manage a broad range of responsibilities and maintain relationships with a wide variety of constituents. However, the research team believes the HA Program can be viewed, in general, as an endeavor in a state of flux. There are opportunities for projects that have economic impact, but funding for these projects is extremely difficult to obtain. In light of the current financial status of the commonwealth and the tendency of foundations to identify specific, often narrow, areas of focus, it does not seem likely, in the research team s view, that the financial dilemma of the HA organizations will have a solution at any time in the near future. Given this challenging funding situation, the research team believes there is a need for entrepreneurial and well-connected leadership in each HA. Effective leadership in today s climate requires that both the executive director and the board of directors are committed to developing contacts that have funding potential: foundations, corporations and individuals. The latter is particularly important in rural or semirural areas where few institutional sources of funds are available. Also, executive directors are expected to collaborate effectively with local non-profit organizations and volunteers engaged in small town projects. The interaction of these two very different responsibilities fundraising and project collaboration is daunting and poses challenges for any executive director. The Economic Impact of Pennsylvania Heritage Areas 58
59 The research team believes that the executive directors of the five study HAs are committed, competent and knowledgeable. All of them have been on board for a significant number of years in some cases more than a decade. During their tenure, however, HA funding has changed. Partnership grants from DCNR have declined, causing reductions in staff and an inability to undertake major projects. Other funding sources are sporadic and have not taken up the slack caused by the decline in DCNR funding. In light of this difficult and evolving situation, the research team believes that it would be useful for HA boards of directors to review annually all fundraising activities, including efforts to identify potential individual donors, and to foster a more entrepreneurial approach to securing additional HA funding. These issues may be dealt with at annual meetings or leadership retreats. If HAs are to continue to make significant contributions to the quality of life in Pennsylvania, intense efforts must be geared to fundraising from sources other than DCNR. Tourism Marketing Challenges The five HAs support the tourism industry supply chain by connecting communities, conserving natural areas, preserving heritage sites, re-shaping perceptions, and educating residents. In terms of marketing, HAs generally rely on the appeal of their own websites and the campaigns of their local TPAs and Convention and Visitors Bureaus. The result is an uneven level of exposure and information about tourism assets in Pennsylvania s HAs. Some assets are very recognizable, well established and/or well developed. Other attractions, particularly some of the historical assets or natural assets, are not as well promoted and recognizable as visitor attractions. In each of the five areas studied, there were stakeholders who expressed skepticism or doubt about the capacity of their region to be a tourist attraction. This parallels a widely held point of view that tourism is not an industry because it doesn t build anything and it doesn t dig anything from the ground. Both attitudes were particularly evident in the PA Route 6 area. The Economic Impact of Pennsylvania Heritage Areas 59
60 Quantitative The quantitative data gathered in this research provides evidence that heritage tourism is an important segment of Pennsylvania's overall tourism economy, supporting significant numbers of businesses and jobs. As noted above, the five study HAs attract thousands of annual heritage defined visitors and those visitors spend millions of dollars supporting thousands of jobs in each of these regions. Projecting the results from the five study HAs to the entire state, the direct contribution of visitor spending to the state economy in 2014 was 19,333 jobs, $477.8 million in labor income, and $709 million in value-added effects. Including secondary effects, the total contribution of visitor spending to the state s economy was 25,708 jobs, $798.1 million in labor income, and $1.26 billion in value-added effects. Heritage defined visitors were responsible for more than $126.5 million in state and local tax revenues. State and local tax revenues include employee contributions, household taxes (income, real estate, etc.) and corporate profits taxes. HAs play a key role in sustaining tourism throughout the regions they operate. Although regional tourism promotion is not their only significant organizational objective, the HAs make strong efforts to maximize the impact of heritage tourism by partnering with their regional TPAs. In all cases, the objective is to extend the visitor's length of time within the region. An excellent example of the "connecting the dots" strategy is the PA Route 6 interactive itinerary map (PA Route 6, 2014) available on the website and for mobile device download. The website allows the trip planner to envision what the next town or site may be, pushing or pulling the travel party either east or west along the corridor, hopefully to spend an extra day or night in the region or in Pennsylvania due to the work of the Route 6 HA and their partners. This is economically important because this research confirms that visitors who extend their stay overnight spend substantially more within the region. The research required collaboration among the five HA participants. Collaboration on visitation and visitor spending data collection should be continued and expanded throughout the HA programs. The The Economic Impact of Pennsylvania Heritage Areas 60
61 visitor surveys provided detailed information about spending patterns in specific HAs. More precise estimates of spending patterns should also take into account how spending varies among all HAs. Policy Considerations Convene Summit Meeting to Improve Interaction Between DCNR and HAs The goals of DCNR and the HA Program seem to mesh together well. Both DCNR and the HAs are committed to the appropriate use of historic and natural assets and both sets of entities see advantages in linking these assets to opportunities for economic growth. The HA Program effectively fills this niche for the benefit of both the statewide and regional economies. Despite these similarities, the research team observed that the integration of HA programs into the overall DCNR mission has not always been an easy fit. HAs are engaged in a broad range of activities that are relevant to the cultural, historical and environmental heritage of the commonwealth, but to relate these wide ranging activities into the structure of DCNR has been, at times, challenging. The linkage is easiest in regard to those HAs that clearly emphasize conservation of heritage and natural assets. It is more difficult in regard to the HAs that are more eclectic and varied in their program choices. The research team recommends an informal summit meeting between all HA staff and key representatives of DCNR to develop a road map for the future of the HA Program statewide. The research team believes this meeting could be an important interaction, not only to clarify administrative matters, but to share new ideas. The overall goal of such a review would be to enable the HAs to fit more effectively into the DCNR system while providing some flexibility in the implementation of specific objectives. Employ Common Visitor Survey Method Prior to this project, the five study HAs did not employ a common approach to collecting visitor data. The research team recommends that DCNR work with all HAs to implement a common survey technique, built on the practices used in this study. The work guide developed by the research team for this project The Economic Impact of Pennsylvania Heritage Areas 61
62 would be a good template to build upon in the future (Appendix A). The research team has already provided templates of the paper questionnaires and online questionnaires to executive directors in each of the five study HAs for their use going forward. The research team has also offered to assist HA staff on how to input data for further analysis. The questionnaire instruments were easy to administer and have yielded an impressive amount of data, as outlined in this report. If this protocol were employed across all 12 Pennsylvania HAs at frequent intervals (perhaps 3-5 years), DCNR and the HAs would benefit from up-to-date data on visitation and economic impact. Simplify DCNR Partnership Grant Process Partnership grants are awarded annually to each of the HAs through a grant application. Partnership grants provide basic support to a wide range of HA activities. Based on interviews and observations, the research team believes that these grants are appropriately defined to meet the needs of the HA organizations. Although the application process has recently been streamlined, the research team recommends that further simplification of the process, with the objective of a quicker turnaround time. This is in recognition of the small HA staffs (often only one person) that delays make it necessary for HAs to take out short term loans to meet basic expenditures. Offer Mini-Grants The research team observed that HA organizations can be very effective when they foster collaboration among local citizenry, connecting communities, re-shaping perceptions, educating residents and providing forums for the exploration of new ideas and new programs. Mini-grants are an essential part of this process. As part of the annual grant application process, any HA may apply to DCNR for funds that will enable the HA to award mini-grants to local non-profit entities. Mini-grants are generally awarded for the cost of studies, consultants, short-term staff assistance or special projects. Mini-grants enable HAs to facilitate the development of new projects. Their continuation and, where possible, expansion is an important element in the HA program. The Economic Impact of Pennsylvania Heritage Areas 62
63 Continue to Build Relationships with Local Partners and Stakeholders. The research indicated that the five HAs were generally effective in their ability to maintain contact with local partners and stakeholders. These interactions are largely attributable to the interpersonal skills and hard work of the executive directors. However, the research team believes the HAs could broaden the range of contacts with local businesses and increase the collaboration with TPAs in their areas to stimulate more heritage-defined tourism development. To address the challenges noted earlier, the research team recommends that each HA develops an annual protocol of having each HA board of directors review all fundraising activities, including efforts to identify potential individual donors, and to foster a more entrepreneurial approach to securing additional HA funding. These issues may be dealt with at an annual meeting or at a leadership retreat. Develop a More Marketable Name In marketing terms, success in attracting tourists or visitors (regardless of the term used), whether for several days or several hours, depends to a significant degree on the name of the attraction. A name that is catchy, that has contemporary appeal, and marketability is a critical element that often determines whether travelers visit or not. The name heritage area did not resonate among some participants in the qualitative portion of this research. Some interviewees believed it means history, while some relate it to antiques and even genealogy. Also, based on the quantitative research there was low awareness for the Pennsylvania HA Program (33 percent) and even lower awareness for some of the individual HAs. The research team recommends that DCNR and the Pennsylvania HA Program conduct research into the development of a new name that may have greater marketing impact. Preserving a Sense of Place Preserving a sense of place refers to programs (usually in small towns) that help maintain hometown pride through volunteer activities that keep alive local traditions, special events and celebrations. The Economic Impact of Pennsylvania Heritage Areas 63
64 Programs like PA Route 6 s Heritage Communities Program, through which some 20 communities have received small grants to develop plans for local projects, play a vital role in helping local citizens take responsibility for the future of their own communities. The research team recommends to continue these grants for economic development purposes, whenever possible. Continue to Expand Nature Tourism Attractions that draw visitors to the commonwealth, such as hiking, camping, water sports, fishing, hunting, rock climbing and even geo-caching, are an important part of the HA program. These attractions represent a significant economic resource that has direct implications for Pennsylvania businesses, tax revenues, and investments. Tourism is not only a source of revenue, but it also has a positive impact on rural and small town areas. Furthermore, the appeal of nature tourism (or wilderness tourism) as a segment of the overall tourism industry is growing and likely to continue to grow, according to industry representatives. A recent article in the Journal of Vacation Marketing confirmed that wilderness areas in Pennsylvania represent a resource that has significant potential for expansion (Dong, Wang, Morais and Brooks, 2013). The research team recommends that DCNR consider sponsoring a review of nature tourism assets in the HAs. A review of this type could measure economic impact as well as the potential for future tourism. Based on the research team s qualitative field interviews, the study team should include at least one person who has knowledge of national and international trends in nature tourism. Specific HA Recommendations Allegheny Ridge. The research team believes that resources of Allegheny Ridge are stretched thin and that the HA has less visibility in the Johnstown area than in the Altoona and Blairsville areas. This is somewhat ironic because Allegheny Ridge was very involved in the early development of key Johnstownarea organizations, such as the Johnstown Area Heritage Association, and provided significant funding for the construction of several key anchor sites in Johnstown. The research team recommends that Allegheny Ridge work with DCNR to explore ways for the organization to augment its staff and also The Economic Impact of Pennsylvania Heritage Areas 64
65 upgrade its visibility in the Johnstown area: perhaps through renewed and enhanced partnerships with the Johnstown Area Heritage Association, a group that administers the Johnstown Flood Museum and Johnstown Heritage Discovery Center, and which is also involved in events such as the Flood City Music Festival and the Allegheny Adventure X-Fest. Lincoln Highway. The research team is concerned that the current focus on Lincoln Highway memorabilia may retain interest for some segment of the traveling population, but the appeal of these historic items is not likely to grow visitation by significant numbers in the future. The research team recommends that the HA work with DCNR to more aggressively link two relatively new attractions along Route 30. First, the most impact could come from boosting awareness of the Flight 93 National Memorial as a key anchor site (the main entrance to the Memorial is physically located on the Lincoln Highway between Stoystown and Buckstown). The team recommends that this enhanced link be pursued soon due to the opening of the new visitors center at the site (based upon the research team s interviews, NPS officials believe this will increase annual attendance to approximately 500,000). Second, the recent addition of the Laurel Highlands Trout Trail has the potential to create additional impact and the opportunity to redefine the HA. Trout streams represent not only a conservation opportunity, but also a major tourism draw. To devote more resources on the Trout Trail Project would require a review of priorities and organizational structure a task that could only be undertaken with increased assistance and participation of DCNR. National Road. National Road s heritage visitation is bolstered by two major anchor attractions: Fallingwater, and Ohiopyle State Park. Nevertheless, the research team believes there is an opportunity for the HA to work with DCNR to explore new ideas to increase the visibility of the Whiskey Rebellion Festival in Washington, PA. PA Route 6. The research team observed that the current PA Route 6 boundaries 20 miles wide and 427 miles long are an organizational anomaly that presents unusual management and operational challenges. Currently the PA Route 6 staff is doing an excellent job of trying to meet these challenges despite a tight budget, limited staff, and extensive travel demands. The overall impression gained from The Economic Impact of Pennsylvania Heritage Areas 65
66 interviews is that there are significant variations in vacation preferences between the eastern half of the HA and the western half. On one hand, the Endless Mountain HA, Pocono Forests and Waters, and the eastern portion of the PA Route 6 are increasingly focused on developing short-term visitors from New York City, New Jersey and Philadelphia. In general, this region has become an East Coast playground with attractions that appeal to urban residents, such as summer cottages, hiking tours, restaurants, theatres and concerts. Based on the research team s qualitative research, tourism in this area is growing rapidly so much so that the demand for the purchase of summer cottages has grown to such a degree that there is a shortage of local real estate agents to handle cottage rentals. On the other hand, the western half of the PA Route 6 has an appeal that is based primarily on wilderness experience and traditional attractions such as small towns, fall foliage and scenic vistas of various kinds. There are day-trippers who go to Pymatuning or Presque Isle; families who enjoy camping; outdoor activists who prefer wilderness sites; and traditional tourists who enjoy the drive through small towns and rural areas. The research team observed that there may be more cottages in the east versus more campsites in the west. There may also be more organized tour activities in the east and more short term one- or two-day family outings in the west. The amenities lodging, restaurants etc. - are not as abundant in the west and the number of individuals or families who own or rent a campsite is greater. The research team also observed that the cultures of the two sides of the PA Route 6 area is quite different, perhaps reflective of the cultural difference between the East Coast and western Pennsylvania, and also perhaps indicative of the findings of recent research suggesting that tourism in rural areas does not fit a homogenous rural tourist profile due to their broad travel preferences (Dong, Wang, Morais and Brooks, 2013). In terms of management, communication, resource use and visitor attraction strategies, it is not difficult to conceive a two-part northern tier entity that would see the existing PA Route 6 HA expand its western zone to include the Lumber Heritage region and follow the outline of Pennsylvania Wilds, and an expanded eastern zone that includes Endless Mountains and follows the boundary of Pocono Forests and Waters. As a result, the research team suggests that there may be value for the HA to work with DCNR to consider restructuring the geographic boundaries of PA Route 6 as outlined above to draw The Economic Impact of Pennsylvania Heritage Areas 66
67 together a wider range of resources and attractions that may have a better chance of attracting financial resources from their respective areas than is presently the case. Perhaps the most significant advantage of this redistricting concept would be to merge the staffs so that the new northern tier entity would have a larger staff with greater levels of specialization and greater capacity to raise funds. To keep boots on the ground along the vast expanse of the new HA, the research teams suggests that two anchor offices could be staffed, one in the western zone and one in the eastern zone. Susquehanna Gateway. The research team recommends that Susquehanna Gateway work with DCNR to increase its local public profile. The quantitative survey research also indicated that it had the lowest awareness levels of all the HA areas among survey respondents. Some suggestions include working with DCNR to fund more aggressive promotional efforts, and the development of more special events to which the public is invited, and closer relationships with local officials. Many of the Lancaster County representatives were less familiar with the Susquehanna Gateway Heritage Area organization compared to those representing York County. References Cullinane, Thomas, C., Christopher Huber, and Lynne Koontz National Park Visitor Spending Effects: Economic Contributions to Local Communities, States, and the Nation. Natural Resource Report, National Park Service, Fort Collins, CO. Decision Support Systems, LP DSS Research Toolkit, Ft. Worth, TX. Department of Conservation and Natural Resources, Commonwealth of Pennsylvania Heritage Areas of Pennsylvania (map). Available at: Dong, Erwei, Yawei Wang, Duarte Morais and David Brooks Segmenting the Rural Tourism Market: The Case of Potter County, Pennsylvania USA, Journal of Vacation Marketing, 19(2): Fettling, Douglas C Assessing the Impacts of Travel and Tourism Measuring Economic Benefits, in Chapter 32, Travel, Tourism and Hospitality Research: A Handbook for Managers and Researchers, 2nd edition, J.R. Brent Ritchie and Charles R. Goeldner, editors, John Wiley & Sons, New York, NY. Holoviak, Paula An Evaluation of Strategies and Finances of the Rural Tourism Industry, the Center for Rural Pennsylvania, Harrisburg, PA. IMPLAN Group, LLC IMPLAN System (data and software), Birkdale Commons Parkway, Suite 206, Huntersville, NC ( The Economic Impact of Pennsylvania Heritage Areas 67
68 Mahoney, Eleanor History of the Pennsylvania Heritage Areas, Pennsylvania Department of Conservation and Natural Resources, Harrisburg, PA. PA Route 6 Heritage Area Do 6; Pennsylvania s Route 6 (interactive map). Available at: Stynes, Daniel J National Park Visitor Spending and Payroll Impacts, National Park Service Social Science Program Report. Stynes, Daniel J. and Ya-Yen Sun Economic Impacts of National Heritage Area Visitor Spending; Summary Results from Seven National Heritage Area Visitor Surveys, Department of Community, Agriculture, Recreation and Resource Studies, Michigan State University, East Lansing, MI. Tourism Economics The Economic Impact of Travel and Tourism in Pennsylvania. Available at: Tripp Umbach/National Park Service The Economic Impact of National Heritage Areas, a Case Study Analysis of Six National Heritage Area Sites in the Northeast Region of the United States and Projections on the National Impact of All National Heritage Areas, National Park Service Report. Available at: /heritageareas/the%20economic%20impact%20of%20national%20heritage%20areas_final%20report.pdf. United States Census Bureau American Fact Finder Analysis. Unpublished The Economic Impact of Pennsylvania s Heritage Areas. Special Acknowledgments The researchers thank the following individuals for their contributions to the research. For help with study logistics and data collection: Michael Piaskowski, DCNR. Executive Directors of the study heritage areas and their staff: Allegheny Ridge - Jane Sheffield and Broderick Irons; Lincoln Highway - Olga Herbert and Kelsey Harris; National Road - Donna Holdorf, Amy Camp and Kathleen Radock; Route 6 - Terri Dennison and Jennifer Rossman; Susquehanna Gateway - Mark Platts, Betsy Buckingham and Zach Flaharty. Pitt-Johnstown faculty and students: Sharon Bertsch, Ph.D., Ola Johansson, Ph.D., Ahmad Massasati, Ph.D., Kaitlyn Bowser, Julie Dolges, Jordan Harter, Olivia Lewis, Matthew Malacki, Nicholas Roth, Katie Saylor, and Emily Reynolds. The Center for Rural Pennsylvania gratefully acknowledges the additional funding from HERITAGE PA in support of this research project. The Economic Impact of Pennsylvania Heritage Areas 68
69 Appendix A Project Work Guide The Economic Impact of Pennsylvania Heritage Areas 69
70 MAY 1, 2014 PENNSYLVANIA HERITAGE A REAS ECONOMIC IMPACT STUDY WORK GUIDE PROJECT SPONSORS: OC IMPACT STUDY The Economic Impact of Pennsylvania Heritage Areas 70
71 Contents Introduction & Overview The Project Goal The Project Team Section 1: Quantitative Data Collection Anchor Site Data Collection The Visitor Survey Research Process Section 2 - Qualitative interviews Interviews Section 3 - Secondary Data Requested Suggested Order for Site Visits - Focus Groups/Interviews Overall Project Schedule Research Team Contact Information Attachment 1 Invitation Letter Template... 0 Attachment 2 Template... 0 Attachment 3 Phone Script Template... 0 Attachment 4 Paper Questionnaire Example... 0 Attachment 5 Online Questionnaire Reminder Card Example... 0 Attachment 6 Personal Intercept Script Example... 0 Attachment 7 Data Collection Volunteer Supervisor Timesheet... 0 Economic Impact of Pennsylvania Designated Heritage Areas Study... 0 Data Collection Volunteer Supervisor Timesheet FAYETTE COUNTY... 0 SOMERSET COUNTY... 0 The Economic Impact of Pennsylvania Heritage Areas 71
72 Introduction & Overview Thank you for your cooperation and participation in this important research initiative. Our research team has been awarded a grant to quantify the economic impact of Pennsylvania Heritage Areas (DHAs). This Work Guide is intended to serve as a helpful resource for you and your staff during the upcoming year as we work together to make the project a success. The Project Goal The main goal of the proposed study is to provide an analysis of the economic benefits DHAs have on their home communities and the Commonwealth in general. This analysis would provide a clear, timely understanding of the issue for DHA administrators and local constituents, as well as Commonwealth policymakers. Our research team is targeting five DHAs for study in the spring, summer and fall of 2014: the Allegheny Ridge Heritage Area, Susquehanna Gateway Heritage Valley, National Road Heritage Corridor, Route 6 Heritage Corridor, and Lincoln Highway Heritage Corridor. Our plan calls for two researchers, Bill Lafe, and David Primm, to visit your DHA during the early spring with three objectives in mind: 1) To establish a working relationship with you and your staff that will continue throughout the study s duration and hopefully beyond. We will also provide phone and contact info where members of our team can be reached if you have any questions about any aspect of the project or need any assistance. 2) To conduct qualitative interviews with you and your local staff and DHA partners to learn more about the nature of relationships with DHA local partners and other local stakeholders and to determine their perceptions of the effectiveness of the DHA in performing its mission. We also hope this qualitative portion of the project will help us develop an improved, standardized procedure for measuring DHA economic impacts in the future. 3) To lay the groundwork for the administration of quantitative survey gathering in your DHA. We hope to speak directly with members of your staff and volunteers in order to provide direction on how best to administer the survey questionnaire to visitors at key sites throughout the DHA. We also plan a follow-up visit by either Bill or David in the late summer or early fall to meet again with you and to check on how the project is proceeding. We will also be able to provide advice and assistance on issues related to the survey collection process. The Project Team John McGrath, Ph.D. is an associate professor at the University of Pittsburgh at Johnstown, and is serving as the principal investigator on the project. David Primm has 10 years experience conducting economic impact analyses for use by organizations representing tourism, healthcare, higher education and government. David was the lead project manager and analyst of an economic impact analysis for the Alliance of National Heritage Areas in Bill Lafe has more than 30 years of experience in the non-profit and philanthropic fields including with the Pittsburgh Foundation and the Heinz The Economic Impact of Pennsylvania Heritage Areas 72
73 Endowments. Since 1989, he has managed William Lafe Associates, a consulting firm that works with non-profit organizations and government agencies in strategic planning and project development. Section 1: Quantitative Data Collection This portion of the project involves the distribution of a survey to visitors at key sites throughout your DHA. The questionnaire for the survey is very simple in design so that visitors can complete it in just a couple of minutes. We will be asking for your help in both a) selecting sites and; b) encouraging staff and volunteers at these sites to distribute the questionnaire to visitors and to collect and return completed questionnaires to you. More details on each task follows: Anchor Site Data Collection Anchor site selection goal is to identify 5-10 sites within your DHA as locations where the visitor survey will be distributed and conducted throughout the duration of the data collection phase. 1) How to select anchor sites - With your assistance, we would like to identify sites, based upon the following criteria: The sites are heritage-related attractions The sites are spread geographically around your DHA The sites draw a representative percentage of their visitors from inside and outside your geographic boundaries The sites represent a reasonable cross section of different attractions (that is, they should not all be trail-related, or water-related) The sites represent both gated and not-gated; as well as free and paid admission Your initial list of 5-10 attractions: - Please identify 5-10 attractions in your DHA that would be your target list : 1) 2) 3) 4) 5) 6) 7) 8) 9) 10) The Economic Impact of Pennsylvania Heritage Areas 73
74 2) Anchor Site Contact Plan In preparation for the researchers visit to your DHA this spring, we encourage you to communicate news about the project, its goals, and procedures to attractions on your target list. We would like to meet as many representatives from your target list as possible during our visit so we can explain the project in person. To help ease this process along, we are suggesting three forms of communication, and even providing samples of what to say, within the Attachment. Feel free to use all, some or none of the templates. You will know the best ways to reach your partners. Sample Letter - This is a sample letter we suggest that you send to members of your target Anchor Site list. It provides details about the project. The full letter is included in Attachment 1. Sample - A copy of the template is included in Attachment 2 Sample Phone Script - A full copy of the sample phone script is included in Attachment 3. The Visitor Survey Research Process Once the 5-10 anchor sites have agreed to participate, the next step will be to explain their role in the research process. Representatives from each site may be interviewed by the researchers during the qualitative research step (explained later in this guide), but the primary contribution of each of the anchor sites will be the collection of quantitative survey data. To encourage visitors to take the time to complete questionnaires, the research team will enter all respondents who voluntarily supply their contact information into a sweepstakes to win a $200 MasterCard gift card. The research team will administer the sweepstakes with at no cost or involvement by your staff and volunteers. The research team has developed three survey techniques that are designed to be as easy, quick, and painless as possible for your volunteers to distribute and for respondents to complete. The three techniques are: 1) A traditional paper questionnaire placed in a prominent location accessible to visitors at all anchor sites the entire spring, summer and fall and distributed by volunteers at the site This instrument is a simple, one page piece of paper, printed on card stock to make it a little easier to handle by respondents who may be completing it on a bench or in a waiting area at your regional attraction. The researchers will supply a large quantity of copies of this questionnaire to your site free of charge. All we are asking is that your staff and volunteers simply invite visitors to take one of these questionnaires and complete it during their visit and then to return it to your staff. We are also asking that your staff or volunteer simply write in the name of your attraction and the The Economic Impact of Pennsylvania Heritage Areas 74
 An online questionnaire This instrument is designed to be used by visitors who are in a hurry, or who simply would prefer to take the survey at their leisure at home or anywhere.")
75 date on the line at the bottom of the second page of the questionnaire. The image below depicts how the questionnaire will look, and an actual full-size copy is attached in Attachment 4. 2) An online questionnaire This instrument is designed to be used by visitors who are in a hurry, or who simply would prefer to take the survey at their leisure at home or anywhere. The questionnaire is identical to the paper version in every respect, except that it can be accessed via any computer or wireless device including smart phones and tablet computers. The questionnaire will be hosted by a respected, secure vendor called Qualtrics, which is recommended by the University of Pittsburgh for all their sensitive online research projects. To encourage and remind visitors to take the online questionnaires, the researchers will be providing a small reminder card, also printed on card stock paper, that provides the URL for the online questionnaire and reminds them that they will also be eligible to win the $200 gift card sweepstakes. The image below depicts how the questionnaire will look, and an actual full-size copy is attached in Attachment 5. The Economic Impact of Pennsylvania Heritage Areas 75
")
76 After entering the URL noted on the card above or scanning the QR graphic, respondents will be directed to the online version of the study, as depicted below: 3) A personal "intercept" procedure encouraging visitors to use either the paper or online survey The research team feels that it is important to augment the techniques described above (administered entirely by anchor site volunteers) with an active approach. To accomplish this, the research team has allocated a special $1,ooo discretionary fund for each DHA executive director to hire a "Data Collection Volunteer Coordinator" to visit each DHA and work with local volunteers to "intercept" visitors during peak visitation times in the spring, summer and fall. The process would work like this: a) Each DHA executive director is authorized to hire a Data Collection Volunteer Coordinator(s). b) Each coordinator's responsibilities would include: - Coordinating intercept field days within the DHA - One visit would be scheduled in the spring, one in the summer and one in the fall - Visits should be scheduled in advance by the DHA executive director in consultation with anchor site managers The Economic Impact of Pennsylvania Heritage Areas 76
77 - Field intercepts should be conducted at multiple locations throughout the DHA, not necessarily at participating anchor sites - Spending up to two eight-hour days managing the data collection volunteers, working in partnership with the Executive Director to recruit and coordinate volunteers - During each visit, the coordinator would personally intercept as many visitors as possible, and work with site volunteers to also intercept as many visitors as possible c) Each coordinator (and the volunteers they supervise) should follow the script outlined in Attachment 6. d) The coordinators (and the volunteers they supervise) have the discretion of inviting visitors to complete either the paper questionnaire, or to give them a reminder card to encourage them to use the online questionnaire. e) Coordinators should keep track of their hours on the Timesheet Form in Attachment 7 and submit their hours to the DHA executive director for approval. The executive director will then forward the forms to John McGrath (see contact information later in this document) for approval and disbursement of funds. Funds for each DHA are strictly limited to a maximum of $1,ooo for the entire project duration (spring, summer and fall). The bottom line goal for each DHA s involvement with the quantitative survey portion of the project is easy. The research team will provide copies of the paper questionnaires and reminder cards, as well as administer all aspects of the $200 sweepstakes free of charge. The researchers will also do all the tabulation and analysis of results, again at no charge to you or the anchor sites that agree to participate. All we ask you to do are five actions: 1) Please have staff and volunteers encourage visitors to complete the questionnaires either in person (paper version) or online 2) Please write in the name of your attraction and date on the line at the bottom of the questionnaire 3) Please try to distribute and encourage visitors on an ongoing basis throughout the spring, summer and fall of ) Please call or the researchers if you need extra copies of the paper questionnaire or online reminder card at (814) or mcgrath@pitt.edu 5) Please mail all completed paper questionnaires to John McGrath on a monthly basis at the following address: 133 D Biddle Hall University of Pittsburgh at Johnstown Johnstown PA, The Economic Impact of Pennsylvania Heritage Areas 77
78 Section 2 - Qualitative interviews The study of economic impact in the District Heritage Sites of Pennsylvania is, in reality, a study in two parts: the perceived economic impact as viewed by local citizens and the measurable impact based on the data generated. To be complete, the study, in our view, needs to take both elements into consideration. Consequently, the consultants would like to schedule small group and individual meetings with local residents in each of the five DHA s involved in this study. The purpose of these interviews is to gain a broad understanding of what the public believes about the economic impact of the DHA programs. Public perception may not agree in all aspects with the numbers generated by the computer program, but it is, nevertheless, an important part of the overall study. Interviews David Primm and Bill Lafe will visit each of the five participating DHA s in April-May 2014 for a two-day to five-day period (depending on scope) to hold meetings and conduct interviews with a variety of local residents. Prior to each visit, Lafe and Primm will discuss with the Executive Director (ED) of each participating DHA the nature and purpose of the meetings. It is our intention that through the meeting and subsequent conversation we will be able to develop a schedule and a format for the interviews. We will also be able to answer questions and/or make any necessary adjustments that would be suggested by the ED. Three key areas of discussions in the interviews will be: 1) What value added does the local heritage area provide that helps member and partner tourism-related organizations sustain themselves and thrive? 2) What is the economic impact of this "value added in concrete terms? 3) In a perfect world, what could the heritage area (and by extension, DCNR) do to help member and partner tourism-related organizations be even more effective? We anticipate that each of the two-day visits will include the following: Day 1: 10:00 11:30am -- Informal meeting with DHA staff. Purpose: To gain an understanding of the scope and nature of the programs sponsored by the DHA and the various projects that are currently underway. For that meeting, it would be helpful if the DHA staff could provide the following information: 1. A brief (one-page) history of the DHA that would include the following information: how it started, what the original goals were and how they have changed over time; a list (with dates) of major initiatives or projects undertaken by the DHA within the past five years and a brief summary of the project, that in the view of the DHA staff, has most effectively captured public interest in the past five years. The list should include those projects that were fully realized and those that were only partially completed. If the above information is already available in a printed report or in some other document, then, by all means, use those ready-made sources. The Economic Impact of Pennsylvania Heritage Areas 78
79 2. A list of current Board members and their affiliations. Does the Board have term limits i.e. is there regular turnover? 3. If the DHA conducts regular fundraising campaigns to support special projects or general operating needs, a summary of recent fundraising campaigns. 4. A list of four or five local agencies and individuals that work closely with the DHA as well as some individuals or companies that have not been willing to collaborate with the work of the DHA. 5. Any research specific to your region that identifies the number of visitors and the attractions that they visited. Day 1: 12:00 2:00 -- Group meeting. Research team members Primm and Lafe would like to meet with 4-6 persons who are active in supporting and/or working with the DHA on current projects. This group may include 1-2 Board members, as well as community representatives and/or other persons who are active in tourism promotion. Day 1: Individual meetings -- Primm and Lafe would like to schedule individual one-on-one afternoon meetings (two for Primm and two for Lafe) with residents of the District who, because of their position, their business or their voluntary activity, have some knowledge or experience with tourism development in the DHA. The individuals in question may be long time supporters of the programs of the DHA or they may be individuals who do not participate in DHA programs. The one-on-one meetings do not need to take place in the main city or town where the offices of the DHA are located. By interviewing residents that do not live in the principal city or town, the consultants hope to get a broad range of perspectives. Day Two: Group meeting. 10:00 11:30 am -- Primm and Lafe would like to schedule a second joint meeting with 4-6 persons somewhere in the DHA, but preferably not in the major town. Preferably, the individuals invited to the meeting should be persons engaged in tourism development, either in business or non-profit activity or government programs, who are familiar with the work of the DHA, but not necessarily supportive or collaborative. Day Two: Individual meetings -- Primm and Lafe would like to schedule two meetings (each) with individuals who have had some interaction or knowledge of the work of the DHA. As was the case during the first day, these meetings may be scheduled with individuals who have connections, either though business or government or non-profit organizations, with tourism development. Day 3 5: Additional group meetings and individual meetings, following a format similar to the first two days but attempting to visit different locations within the Heritage Area. - If necessary, the consultants may follow up with a phone call to one or two individuals that were not available during the two-day visit. The consultants will wrap up with a phone call to the Executive Director of each DHA. The Economic Impact of Pennsylvania Heritage Areas 79
80 -Please note: The consultants recognize that in two days it will not be possible to contact and interview all of the individuals who have some interaction and/or experience with the DHA and its programs. Our goal is to collect information, opinion and points of view from as many knowledgeable and informed local citizens as possible. Section 3 - Secondary Data Requested The following questions are designed to provide the research team with a better understanding of the existing or readily-available data sources required for conducting the economic impact research project. We would ask that this data be collected and addressed in conjunction with the Qualitative Interviews conducted in April Please share an Excel file of the Heritage Area s operating budget from the past three years? 2. Did your organization distribute grant money or awards to partners or stakeholders within your Heritage Area? If yes, can you share the grant types and amounts for the past three years? 3. Are you aware of the total dollars invested for projects that your organization provided grantfunded seed money? 4. Does your heritage area include National Park Service entities? State Parks? 5. Do you collect visitation data from your partners (reason for trip, overnight stay, where they are from, how much do visitors to the region spend in the area)? 6. Our survey will collect visitor expenditures on a variety of spending categories. Are you or your partners familiar with research related to this in your region? 7. Do you currently work with your Heritage Area partners to track annual visitation numbers to their sites? 8. Are you familiar with any research specific to your region that identifies visitor types such as overnight or day-trips? 9. Could you identify a sample (sub-set) of all your Heritage Area partners and sites within your geographic region to best represent overall visitation to attractions and sites that define your organization s mission? These could include ticketed events, gated attractions or heritage and natural attractions. 10. Have you participated in a joint research project (as a partner or participant) with local universities or colleges? The Economic Impact of Pennsylvania Heritage Areas 80
81 Suggested Order for Site Visits - Focus Groups/Interviews Heritage Area Days on-site (Visit 1 Tentative Days on-site (Visit 2 Tentative Dates) Dates) Allegheny Ridge 3 (3/31 4/2) 2 (October 2014) National Road 2 (4/7-4/8) 1 (October 2014) Lincoln Highway 2 (4/14 4/15) 1 (October 2014) Susquehanna Gateway 3 (4/16-4/18) 2 (September 2014) Route 6 5 (4/21-4/25) 3 (September 2014) The Economic Impact of Pennsylvania Heritage Areas 81
82 Overall Project Schedule Project Component Description Timing Responsible Party 1) Project Kickoff Meeting and Planning Selection of case study sites, review of project objectives and finalization of research protocol. March 25, 2014 McGrath, Primm, Lafe; CFRPA 2) 2) Qualitative Research with 3) DHA Executives and 4) Regional Partners 5) and research collected at three annual meeting of PA Heritage in Harrisburg 3) Primary Data Collection Survey The research protocol will facilitate focus groups with regional partners at each case study site. In depth interviews with DHA leaders to identify existing data sources related to visitation, operating budgets and revenue sources. Collect visitation data from other DHAs Design and finalize the visitor spending survey Identify anchor sites for selfservice survey administration Work with local DHA staff to arrange for the collection of April-May 2014 May October 2014 McGrath, Primm, Lafe; DHA leadership and staff McGrath, Primm, Lafe; DHA leadership and staff 4) Economic Impact Analysis Identify economic, employment and fiscal impacts of the DHAs on the local and state economy Complete analysis to quantify the overall economic impacts of all PA DHAs on Pennsylvania 5) Reporting & Policy Recommendations Final written technical report highlighting policy recommendations based on the research and analysis. Two to four page executive summary document highlighting key findings. November 2014 December 2014 January 2015 McGrath, Primm, Lafe McGrath, Primm, Lafe The Economic Impact of Pennsylvania Heritage Areas 82
83 Research Team Contact Information Name Address Phone Dr. John McGrath 133 D Biddle Hall University of Pittsburgh Johnstown, PA mcgrath@pitt.edu (814) Bill Lafe David Primm 1160 Windermere Drive, Pittsburgh PA, Jackson Street Pittsburgh, PA williamlafe@gmail.com (412) david@primmresearch.com (412) (215) The Economic Impact of Pennsylvania Heritage Areas 83
84 Attachment 1 Invitation Letter Template Mr. Samuel Jackson Heritage Attraction Number 1 Hometown, PA RE: Tourism Impact Study of Your Attraction Being Funded by Center for Rural PA and DCNR Dear Sam: I d like to invite you to be part of an exciting project that will be kicking off in the next few weeks. It s a major new initiative to measure the impact of tourism in the Commonwealth of Pennsylvania including your attraction. Here s the best news of all: the project will be conducted free of charge through a cooperative joint venture of Heritage PA, the Center for Rural PA (CfRPA) and the PA Department of Conservation and Natural Resources (DCNR). All we are asking is for a little bit of your time and involvement. What s in it for you? The project will pay dividends for your facility in three ways: 1) The researchers plan to talk with representatives from your organization and others throughout our DHA to learn more about best practices for enhancing tourism and visitation information that will be shared among all attractions in our region. 2) The researchers also will be asking for your help in distributing a survey at your facility that will collect visitor data and other measures all information that will be shared with you 3) Upon collection of the data from #1 and #2 above, the researchers will provide us all with a report that estimates the economic (and non-economic) impact of your facility and others like it throughout the commonwealth. In sum, we all will be gaining the benefit of a free economic impact study- a study you can share with your staff, volunteers, board, local legislators, and community leaders. What are we asking? All we ask is that a representative from your organization join us for a brief meeting with me and the researchers at an informal information gathering session. Details of the session are noted below: - What: informal info gathering - When: April, am-12 noon - Where: Allegheny Ridge Corporation headquarters/altoona That s it for now. We just wanted to see if you are interested in being part of this exciting project. Someone from Allegheny Ridge will be calling you in the next few days to confirm that you received this note and to see if you can join us on April. Jane Sheffield Executive Director Allegheny Ridge Heritage Area
85 Attachment 2 Template Sample text to communicate with members of your target list I d like to invite you to be part of an exciting project that will be kicking off in the next few weeks. It s a major new initiative to measure the impact of tourism in the Commonwealth of Pennsylvania including your attraction. Here s the best news of all: the project will be conducted free of charge through a joint venture of Heritage PA, the Center for Rural PA and the PA Department of Conservation and Natural Resources--and the results will be shared with you, again free of charge. All we are asking at this point is for a representative from your organization to join us for a meeting with the researchers at the following informal session: - What: informal info gathering - When: April, am-12 noon - Where: Allegheny Ridge Corporation headquarters/altoona That s it for now. Someone from Allegheny Ridge will be calling you in the next few days to confirm that you received this note and to see if you can join us on April.
86 Attachment 3 Phone Script Template Sample phone script for phone call following up on letter and to members of your target list CALLER: Hello. This is from the Allegheny Ridge Corporation. I m calling to follow up on a letter and that our executive director Jane Sheffield sent a week or so ago. She was inquiring about your interest in a new research project. RESPONDENT: Oh yeah. You can count us in. What are the details again? (SKIP TO all we are asking LINE BELOW) I don t remember receiving any message from Jane (PROCEED WITH NEXT LINE) CALLER: That s OK; I can fill you in on some of the main details: It s a major new initiative to measure the impact of tourism in the Commonwealth of Pennsylvania including your attraction. And the best news is that the project will be conducted free of charge through a cooperative joint venture of Heritage PA, the Center for Rural PA and the PA Department of Conservation and Natural Resources. All we are asking is for a little bit of your time and involvement. Are you interested? RESPONDENT: CALLER: REPONDENT: CALLER: RESPONDENT: CALLER: RESPONDENT: CALLER: RESPONDENT: CALLER: Yes, what are next steps? All we are asking at this point is that a representative from your organization join us for a brief meeting with Jane and the researchers at an informal information gathering session on day, April, 2014 from 10am to 12 noon here at the Allegheny Ridge offices in Altoona Thanks; we ll have someone there (THANK THE RESPONDENT AND END CALL) No, I don t think we re interested. (MAY I HAVE JANE CALL YOU TO EXPLAIN IT A LITTLE MORE?) Yes, have her call me (THANK THE RESPONDENT, SAY JANE WILL PHONE SOON, AND END CALL) or No, I m still not interested (THANK THE RESPONDENT AND END CALL)

87 Attachment 4 Paper Questionnaire Example
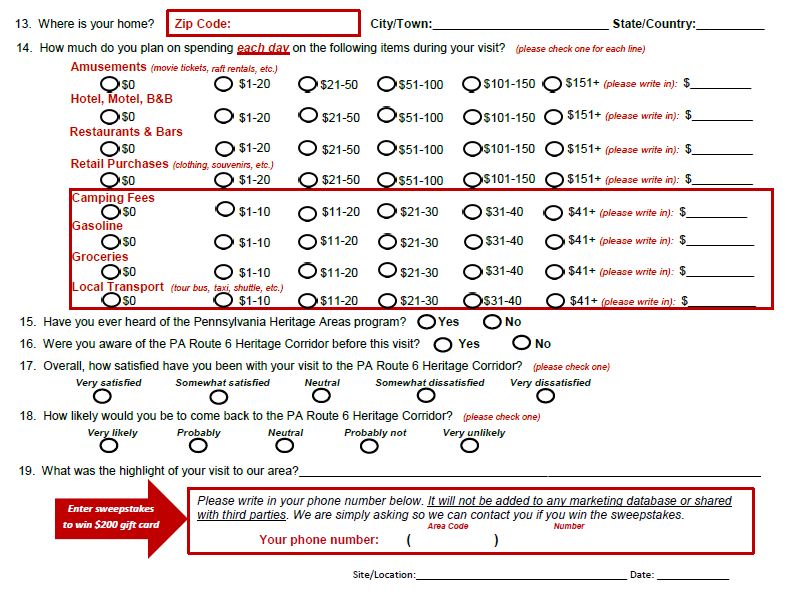
88

89 Attachment 5 Online Questionnaire Reminder Card Example
90 Attachment 6 Personal Intercept Script Example Script for Data Collection Volunteer Coordinator (and volunteers) to use when approaching visitors Typical intercept time frame: 10:00 a.m. to 3:00 p.m. Initial contact with visitor: "Hello, how are you today?" "l am a volunteer with (your DHA name) conducting research on tourism in Pennsylvania. If you don't mind, l would like to ask that you complete this brief questionnaire--it's only one piece of paper and you have the chance to win a $2oo MasterCard gift card." (SHOW THEM THE PAPER QUESTIONNAIRE) lf they agree: (HAND THEM THE PAPER QUESTIONNAIRE) (After they return it to you, please write in the name of the attraction you are at, and the date at the bottom right hand side of the card lf they don't agree: "l understand that you're in a hurry today. We totally get that. And we have designed an online version of the questionnaire that you can take in your car on the way home, and anytime in the next week. And you also get the same chance to win the $200 MasterCard gift card. Would you be interested in this easy online option?" lf they agree: (SHOW THEM THE ONLINE INVITATION CARD) (HAND THEM THE ONLINE INVITATION CARD) "Thank you. Here's the card that will remind you about the online survey. You can take it on any smart phone, tablet computer, laptop, or desktop computer. Simply scan the QR image or type in the web address noted on the card, and you should be good to go." lf they still do not agree: "Thank you for your time and have a good day."
91 Attachment 7 Data Collection Volunteer Supervisor Timesheet Economic Impact of Pennsylvania Designated Heritage Areas Study Data Collection Volunteer Supervisor Timesheet Heritage Area: Supervisor Name: Project Sponsors: Supervisor Address: Supervisor Phone: Supervisor Date Hours (may include half hours) Attraction Location where intercepts were conducted Description of Intercept Activities (how many conducted, how many forms completed by respondents) A) Total Number of Hours: B) Wage agreed with Heritage Area Executive Director: $ per hour Total wages earned: (A x B) $ (may not exceed $1,000 per heritage area) Your Signature (supervisor) Heritage Area Executive Director Approval Signature Date Date Please note: Funds for this project are provided by the Commonwealth of Pennsylvania and are subject to audit. You are responsible for the accurate and truthful reporting of all activities and earnings noted above.
92 Appendix B Comprehensive List of Qualitative Research Interviewees Heritage Area Date(s) of Interview Allegheny Ridge April 29 and May 1 June 3 Individuals in Conversation Jane Sheffield, Executive Director a) Ethan Imhoff, President of Rails to Trails of Central PA b) Karl King, recently retired ARCorp Greenway Coordinator c) Lee Slusser, City of Altoona, Planning Director d) Thomas Shaffer, Penn State Altoona Center for Community Based Studies e) Claudia Montero Pequignot, PR Director for ARCorp; manager of Altoona Discovery Center f) Mark Ickes, Executive Director of Explore Altoona g) Keith Newlin, U.S. Park Service manager for Allegheny Portage RR historic site h) Laura Hawkins, Allegheny Ridge Kiski-Conemaugh Greenway Coordinator i) Linda Gwinn, Blairsville Community Development Authority j) Ronald Evanko, Borough President, Blairsville k) Leann Chaney l) Carol Parshetti m) Rod Ruddock, Commissioner, Indiana County n) Hazel Johnston, Blairsville Historical Society a) Richard Truscello, Manager of Planning Services, EADS Group Architects b) Rose Lucey-Noll, Executive Director, Cambria County Transit Authority, operator of the Inclined Plane c) Richard Burkert, Executive Director, Johnstown Area Heritage Association, operators of the Johnstown Flood Museum, The Johnstown Heritage Discovery Center, and the Peoples Natural Gas Festival Park July 15 a) Brad Clemenson, lead external partner, Laurel Highlands Conservation Landscape Initiative, facilitator for the Stonycreek-Quemahoning Initiative b) Stephen Podratsky, past president, Benscreek Canoe Club, board member of the Stonycreek-Quemahoning Initiative, and a member of the Laurel Highlands On/Off Road Bike Association (LHORBA) c) Leslie Clemenson, participant in the LORHBA rails-totrails segment Lincoln Highway May 5 Olga Herbert, Executive Director a) Barbara Ciampini, Greensburg City Planning Commission b) Karen Brantner, Board President, owner of small motel on Lincoln Highway c) Monty Murty, Trout Unlimited. Founder of the Laurel Highlands Trout Trail d) Melissa Jacobs, owner of the Jean Bonnet Tavern e) Chris Tomsey, volunteer f) Theresa Marafino, Exeutive Director of the Mountain Playhouse/Green Gables restaurant
93 National Road April 21 and 28 PA Route 6 May 19 through 22 g) Carl Whitehill, Director of Communications, Destination Gettysburg h) Kelsey Harris, Lincoln Highway Heritage Corridor i) Paul Cullinane, Economic Development Specialist, Borough of Chambersburg j) Ann Nemanic, Vice President of Laurel Highlands Visitors Bureau Donna Holdorf, Executive Director a) Lynda Waggoner, Director and Vice President. b) Jeffrey Reinbold, Superintendent, Western PA Parks, National Park Service c) Erica Miller, Production Manager, State Theatre. d) Ed Hyjurick, Union Bank e) Norene Halvonik, former board chair f) Clay Kilgore, director of Washington County Historical Society, David Bradford House and a new member of the NRHC Board g) Jan Dunker - owner of Jan's Tea Shoppe in Scenery Hill on the National Road also coordinator of the National Road Festival events in Scenery Hill. h) Jeff Leighthouser and Jason Theakston from Washington County Planning office i) Scott Becker - Director of the PA Trolley Museum j) Harlan Shober, County Commissioner k) Joe Thomas - former City of Washington Manager and NRHC Board member and current Director of the City of Washington Transit Authority. Terri Dennison, Executive Director a) Jennifer Rossman, PA Route 6 staff b) Merry Ryding, PA Route 6 Artisan Trail c) Juanita Hampton, Crawford County Visitors Bureau d) Bill Eldridge, Conneaut Lake Borough Council e) Dave Sample, Corry business owner f) Emily Beck, Visit Erie g) Mike Baker, Erie County Planner h) Dan Glotz, Warren County Planner i) Doug Firestone, PA Route 6 Artisan Trail/ Potter County Visitors Association j) David Brooks, Potter County Visitors Association k) Cindy Pflug, Galeton business person l) Chip Harrison, Lyman Run State Park Complex m) Dawn Hull, Mansfield Chamber of Commerce n) Doug Morley, Potter County Commissioner o) Jeff Bliemeister, PA Lumber Museum p) Lori Copp, Tioga County Visitors Bureau, Wellsboro q) Connie Sickler, Settlement House, Sylvania--artisan trail participant r) Kevin Abrams, Northern Tiers Regional Planning and Development Commission s) Jen Swain, Bradford County Regional Arts Council t) Wendy Gustad, Wyalusing Chamber of Commerce u) Christine Tucki-Mulvey, City of Carbondale v) Keith Williams, Pocono Mt Visitor Bureau/ Lake Wallenpaupack Visitor Center w) Linda Devlin, Executive Director, Allegheny National
94 Susquehanna Gateway May 13 and 14 Forest Mark Platts, Executive Director a) Scott Standish, Lancaster County Planning Commission b) Sam Allen, SGHA Board of Directors/Bube s Brewery c) Anne Druck, York County Convention & Visitors Bureau d) Al Duncan, Miller s Smorgasbord/PA Dutch Convention & Visitors Bureau e) Kathleen Frankford, PA Dutch Convention & Visitors Bureau f) Kathleen Hohenadel, Susquehanna Valley Chamber of Commerce g) Fritz Schroeder, Lancaster County Conservancy h) Liz Winand, Shanks Mare Outfitters/York County Convention & Visitors Bureau i) Lori Yeich, PA DCNR j) Craig Lehman, Lancaster Board of Commissioners k) Tom Baldridge, President & CEO, Lancaster Chamber of Commerce & Industry l) Chris Barton, representing Marietta Borough Mayor Ray Vegso m) Mike Beury, Columbia Borough Council President n) Justin Eby, Program Manager, Lancaster Housing & Redevelopment Authority o) Rob Evans, Artist/PA Arts Experience p) Jim Hooper, President, Mason-Dixon Trail System q) Claire Storm, Former President, Rivertownes PA USA r) Marty Weiss, Executive Director, Conservation Society of York County (Indian Steps Museum) t) Jim Warner, Chair/Executive Director, Lancaster County Solid Waste Authority u) Alex Snyder, Vice Chair/Attorney with Barley Snyder, LLC v) Wendy Tippetts, Secretary/Principal, Tippetts Weaver Architects w) Doug Hoke, York County Board of Commissioners/SGHA Board x) Darrel Auterson, Director, York county economic Alliance y) Blanda Nace, York County Economic Alliance z) Dennis Stuckey, Lancaster Board of Commissioners a-1) Scott Martin, Lancaster County Board of Commissioners Source: Compilation of all project interviewees, arranged by each of the 5 study heritage areas staffs

95 Appendix C Paper Questionnaire Sample

96 Appendix D Online Questionnaire Invitation Card and Sample Questionnaire Page
97 Appendix E Heritage Areas Geographic Investment Areas Defined by Zip Code Source: Department of Conservation and Natural Resources Allegheny Ridge Heritage Area ALLEGHENY COUNTY PORTAGE CASSANDRA PITTSBURGH LILLY CRESSON BLAIR COUNTY DUNCANSVILLE HOLLIDAYSBURG WILLIAMSBURG MILLVALE ETNA HUNTINGDON COUNTY SHARPSBURG ASPINWALL ALEXANDRIA FOX CHAPEL PETERSBURG BLAWNOX HUNTINGDON CHESWICK MILL CREEK SPRINGDALE MAPLETON TARENTUM BRACKENRIDGE MOUNT UNION WESTMORELAND MIFFLIN COUNTY COUNTY KISTLER NEW KENSINGTON NEWTON HAMILTON ARNOLD MCVEYTOWN LOWER BURRELL LEWISTOWN WEST LEECHBURG JUNIATA TERRACE HYDE PARK VANDERGRIFT OKLAHOMA AVONMORE BOLIVAR JUNIATA COUNTY NEW FLORENCE ARMSTRONG COUNTY MIFFLIN MIFFLINTOWN PORT ROYAL THOMPSONTOWN FREEPORT PERRY COUNTY LEECHBURG MILLERSTOWN NORTH APOLLO APOLLO NEWPORT INDIANA COUNTY SALTSBURG BLAIRSVILLE CAMBRIA COUNTY DUNCANNON MARYSVILLE DAUPHIN COUNTY LOWER YODER DAUPHIN JOHNSTOWN HARRISBURG FRANKLIN EAST CONEMAUGH SOUTH FORK EHRENFELD SUMMERHILL WILMORE 15962
98 Lincoln Highway Heritage Corridor ADAMS COUNTY BUFFALO MILLS CLEARVILLE FAYETTEVILLE EVERETT ABBOTTSTOWN MANNS CHOICE ARENDTSVILLE NEW PARIS BIGLERVILLE SCHELLSBURG CASHTOWN IMLER EAST BERLIN FAIRFIELD SOMERSET COUNTY GETTYSBURG MC KNIGHTSTOWN BOSWELL NEW OXFORD JENNERS ORRTANNA JENNERSTOWN KANTNER FRANKLIN COUNTY MEYERSDALE QUECREEK CHAMBERSBURG SPRINGS CHAMBERSBURG STOYSTOWN FAYETTEVILLE CENTRAL CITY FORT LOUDON HOLLSOPPLE MERCERSBURG MONT ALTO SAINT THOMAS WESTMORELAND COUNTY SCOTLAND SOUTH MOUNTAIN GREENSBURG ADAMSBURG FULTON COUNTY DERRY IRWIN BREEZEWOOD JEANNETTE HARRISONVILLE LATROBE HUSTONTOWN LAUGHLINTOWN MC CONNELLSBURG LIGONIER LOYALHANNA BEDFORD COUNTY RECTOR STAHLSTOWN BEDFORD UNITED BREEZEWOOD YOUNGSTOWN National Road Heritage Corridor FAYETTE COUNTY UNIONTOWN BRIER HILL BROWNSVILLE CHALK HILL CONFLUENCE FARMINGTON GRINDSTONE HILLER HOPWOOD MARKLEYSBURG OHIOPYLE WASHINGTON COUNTY WASHINGTON AMITY BEALLSVILLE BENTLEYVILLE CLAYSVILLE EIGHTY FOUR FREDERICKTOWN RICHEYVILLE SCENERY HILL STRABANE TAYLORSTOWN WEST ALEXANDER BROWNSVILLE DAISYTOWN SOMERSET COUNTY ADDISON CONFLUENCE URSINA
99 PA Route 6 Heritage Corridor PIKE COUNTY DALTON ELMHURST BUSHKILL FACTORYVILLE CANADENSIS FLEETVILLE DINGMANS FERRY FOREST CITY MATAMORAS GOULDSBORO MILFORD JERMYN MILLRIFT JESSUP TAMIMENT LAKE ARIEL UNITY HOUSE LA PLUME GREELEY MOSCOW GREENTOWN OLYPHANT HAWLEY OLYPHANT LACKAWAXEN PECKVILLE NEWFOUNDLAND WAVERLY PAUPACK SCRANTON ROWLAND SCRANTON SHOHOLA SCRANTON STERLING SCRANTON TAFTON SCRANTON MOOSIC WAYNE COUNTY SCRANTON SCRANTON BEACH LAKE SCRANTON DAMASCUS SCRANTON EQUINUNK SCRANTON FOREST CITY TAYLOR GOULDSBORO OLD FORGE HAMLIN SCRANTON HAWLEY SCRANTON HONESDALE SCRANTON LAKE ARIEL PITTSTON LAKE COMO RANSOM LAKEVILLE LAKEWOOD WYOMING COUNTY MILANVILLE MOSCOW DALTON NEWFOUNDLAND FACTORYVILLE ORSON NICHOLSON PLEASANT MOUNT DALLAS POYNTELLE DUSHORE PRESTON PARK FALLS PROMPTON HARVEYS LAKE SOUTH CANAAN LACEYVILLE SOUTH STERLING LAKE WINOLA STARLIGHT MEHOOPANY STARRUCCA MESHOPPEN STERLING NOXEN THOMPSON TUNKHANNOCK TYLER HILL SUGAR RUN WAYMART WHITE MILLS BRADFORD COUNTY SUSQUEHANNA ALBA LACKAWANNA COUNTY COLUMBIA CROSS ROADS GILLETT ARCHBALD GRANVILLE SUMMIT CARBONDALE MILLERTON CHINCHILLA SYLVANIA CLARKS SUMMIT TROY
100 17724 CANTON SABINSVILLE GROVER ULYSSES DUSHORE WESTFIELD LACEYVILLE CROSS FORK ATHENS BURLINGTON CAMPTOWN MCKEAN COUNTY EAST SMITHFIELD LE RAYSVILLE WILCOX MILAN LUDLOW MONROETON BRADFORD NEW ALBANY AUSTIN ROME CROSBY SAYRE CUSTER CITY STEVENSVILLE CYCLONE SUGAR RUN DERRICK CITY TOWANDA DUKE CENTER ULSTER EAST SMETHPORT WARREN CENTER ELDRED WYALUSING GIFFORD WYSOX HAZEL HURST KANE TIOGA COUNTY LEWIS RUN MOUNT JEWETT WELLSBORO PORT ALLEGANY ARNOT REW BLOSSBURG RIXFORD COVINGTON SHINGLEHOUSE ELKLAND SMETHPORT GAINES TURTLEPOINT KNOXVILLE LAWRENCEVILLE LIBERTY MAINESBURG WARREN COUNTY MANSFIELD MIDDLEBURY CENTER CHANDLERS VALLEY MILLERTON CLARENDON MORRIS IRVINE MORRIS RUN PITTSFIELD NELSON RUSSELL OSCEOLA SHEFFIELD SABINSVILLE SUGAR GROVE TIOGA TIDIOUTE TROY TIONA WESTFIELD TITUSVILLE CANTON WARREN ROARING BRANCH WARREN WARREN WARREN POTTER COUNTY WARREN YOUNGSVILLE AUSTIN BEAR LAKE PORT ALLEGANY COLUMBUS ROULETTE CORRY SHINGLEHOUSE GARLAND COUDERSPORT GRAND VALLEY GAINES SPARTANSBURG GALETON SPRING CREEK GENESEE HARRISON VALLEY MILLS GENESEE
101 16401 ALBION ERIE COUNTY ERIE CAMBRIDGE SPRINGS ERIE CORRY ERIE CRANESVILLE ERIE EAST SPRINGFIELD ERIE EDINBORO ERIE ELGIN ERIE FAIRVIEW GIRARD CRAWFORD COUNTY HARBORCREEK LAKE CITY ADAMSVILLE MC KEAN ATLANTIC MILL VILLAGE GREENVILLE NORTH EAST HARTSTOWN NORTH SPRINGFIELD JAMESTOWN UNION CITY COCHRANTON WATERFORD CONNEAUT LAKE WATTSBURG COOPERSTOWN WEST SPRINGFIELD GUYS MILLS EDINBORO HYDETOWN ALBION MEADVILLE ERIE TITUSVILLE ERIE TOWNVILLE ERIE MEADVILLE ERIE ALBION ERIE CAMBRIDGE SPRINGS ERIE CENTERVILLE ERIE CONNEAUTVILLE ERIE CORRY ERIE EDINBORO ERIE HARMONSBURG ERIE LINESVILLE ERIE RICEVILLE ERIE SAEGERTOWN ERIE SPARTANSBURG ERIE SPRINGBORO ERIE UNION CITY ERIE VENANGO ERIE WATERFORD ERIE
102 Susquehanna Gateway Heritage Area LANCASTER COUNTY TERRE HILL WASHINGTON BORO ELIZABETHTOWN WEST WILLOW AKRON WILLOW STREET BAINBRIDGE WITMER BART LANCASTER BAUSMAN LANCASTER BIRD IN HAND LANCASTER BLUE BALL LANCASTER BOWMANSVILLE LANCASTER BROWNSTOWN LANCASTER CHRISTIANA LANCASTER COLUMBIA LANCASTER CONESTOGA LANCASTER DENVER LANCASTER DRUMORE LANCASTER EAST EARL ATGLEN EAST PETERSBURG HONEY BROOK ELM NOTTINGHAM EPHRATA OXFORD GAP ADAMSTOWN GOODVILLE GORDONVILLE YORK COUNTY HOLTWOOD HOPELAND DILLSBURG INTERCOURSE NEW CUMBERLAND KINZERS AIRVILLE KIRKWOOD BROGUE LAMPETER CODORUS LANDISVILLE CRALEY LEOLA DALLASTOWN LITITZ DELTA MANHEIM DOVER MARIETTA EAST BERLIN MARTINDALE EAST PROSPECT MAYTOWN EMIGSVILLE MILLERSVILLE ETTERS MOUNT JOY FAWN GROVE MOUNTVILLE FELTON NARVON FRANKLINTOWN NEW HOLLAND GLEN ROCK NEW PROVIDENCE GLENVILLE PARADISE HANOVER PEACH BOTTOM HANOVER PENRYN HANOVER PEQUEA HANOVER QUARRYVILLE HANOVER REAMSTOWN LEWISBERRY REFTON LOGANVILLE REINHOLDS MANCHESTER RHEEMS MOUNT WOLF RONKS NEW FREEDOM LANCASTER NEW PARK SILVER SPRING PORTERS SIDELING SMOKETOWN RAILROAD STEVENS RED LION STRASBURG ROSSVILLE TALMAGE SEVEN VALLEYS
103 17361 SHREWSBURY SPRING GROVE STEWARTSTOWN THOMASVILLE WELLSVILLE WINDSOR WRIGHTSVILLE YORK HAVEN YORK NEW SALEM YORK SPRINGS YORK YORK YORK YORK YORK YORK YORK YORK YORK
104 Appendix F Allegheny Ridge Heritage Area Detailed Information Allegheny Ridge Top Attractions and Visitation Estimated by HA Staff Total Visitation: 676, , , ,000 Altoona Railroaders Museum 50,000 Allegheny Portage Railroad Visitor Center 10,061 Allegheny Portage Railroad 6-10 Trail 48,693 Holidaysburg Canal Basin Park 20,000 Horseshoe Curve 50,000 Lower Trail 130,000 Johnstown Heritage Discovery Center 20,000 Johnstown Flood Museum 25,000 Johnstown Flood National Memorial 121,923 Johnstown Inclined Plane 25,000 Juniata River Trail 30,000 Rock Run Recreation Area 10,500 Roaring Run Recreation Area 75,000 West Penn Trail 60,000 Source: Survey of visitors to 5 study heritage areas, 2014; 3,524 total respondents
105 Allegheny Ridge Results: Visitor Breakout Visitor Type Frequency Percent Local Day Visitor (less than 60 miles) % Non Local Day Visitor (60 miles or more) 31 6% Overnight visitor, Motel % Overnight visitor, Other % Total % Pennsylvania or Out-of State Visitors Frequency Pennsylvania residents Percent % Out of state visitors % Total % Travel Party Size Frequency Mean How many adults are in your travel party? How many youths are in your travel party (under 18)? Reason for Visit Frequency Percent I live here % Visiting friends 91 17% See heritage sites % Outdoors 49 9% Passing through 36 7% % Source: Survey of visitors to Allegheny Ridge HA, 2014; 524 total respondents
106 Allegheny Ridge Top 30 Attractions Cited by Respondents Attraction Frequency Percent 1 Horseshoe Curve % 2 Inclined Plane % 3 Altoona Railroaders Museum % 4 X Fest % 5 Johnstown Flood Museum % 6 Staple Bend Tunnel % 7 Prince Gallitzin Apple Cider Fest % 8 Johnstown % 9 Allegheny Portage Railroad % 10 Flood City Music Festival % 11 Hartslog Day % 12 Johnstown Flood Memorial % 13 6 to 10 Trail % 14 Flight 93 Memorial % 15 Johnstown Heritage Discovery Center % 16 Altoona % 17 Gallitzin Tunnels Museum % 18 Canoe Creek State Park 9 0.9% 19 Ghost Town Trail 9 0.9% 20 Lemmon House 9 0.9% 21 War Memorial Arena 9 0.9% 22 Altoona Curve Baseball 8 0.8% 23 Potatofest 8 0.8% 24 Prince Gallitzin State Park 8 0.8% 25 DelGrosso's Amusement Park 7 0.7% 26 Pittsburgh 7 0.7% 27 Penn State 6 0.6% 28 Boyer's Candy Factory 5 0.5% 29 Stonycreek River 5 0.5% 30 Asiago's Restaurant 4 0.4% Source: Survey of visitors Allegheny Ridge HA, 2014; 524 total respondents

107 Allegheny Ridge Distribution of Visitation Sites and Visitor Home Locations Respondents completed the survey at attractions located in 14 zip codes within the Allegheny Ridge Heritage Area, some of which overlap in the map below. Source: Survey of visitors to Allegheny Ridge HA, 2014; 524 total respondents Respondents in the Allegheny Ridge Heritage Area came from 254 zip codes and 24 states in the U.S. (plus the District of Columbia) and three other nations (Canada, Spain, and Venezuela). Source: Survey of visitors to Allegheny Ridge HA, 2014; 524 total respondents
108 Appendix G Lincoln Highway Heritage Corridor Detailed Information Lincoln Highway Top Attractions and Visitation Estimated by HA Staff Total Visitation: 2,128, , ,000 1,200,000 Bedford Fall Foliage Days 70,000 Flight ,000 Fort Ligonier 19,300 Idlewild Park 400,000 Lincoln Highway Experience 1,800 Linn Run State Park Gettysburg Tour Center 30,612 Gettysburg Visitor s Center 1,281,132 Old Bedford Village 25,000 Source: Survey of visitors to Lincoln Highway HC, 2014; 668 total respondents
109 Lincoln Highway Results: Visitor Breakout Visitor Type Frequency Percent Local Day Visitor (Less than 60 miles) % Non Local Day Visitor (60 miles or more) 75 11% Overnight visitor, Motel Overnight visitor, Other % % % Pennsylvania or Out-of State Visitors Frequency Percent Pennsylvania residents Out of state visitors Total Travel Party Size Frequency Mean How many adults are in your travel party How many youths are in your travel party (under 18) Reason for Visit Frequency Percentage I live here % Visiting friends 82 12% See heritage sites % Outdoors % Passing through 47 7% % Source: Survey of visitors to Lincoln Highway HC, 2014; 668 total respondents
110 Lincoln Highway Top 30 Attractions Cited by Respondents Attraction Frequency Percent 1 Lincoln Highway Experience % 2 Lincoln Highway % 3 Fort Ligonier % 4 Flight 93 Memorial % 5 Bedford Fall Foliage Festival % 6 Ohiopyle % 7 Old Bedford Village % 8 Idlewild Park % 9 Gettysburg Battlefield % 10 Compass Inn % 11 Gettysburg Heritage Center % 12 Fallingwater % 13 Ligonier % 14 Gettysburg % 15 Pittsburgh % 16 Gettysburg Tour Center % 17 Ligonier Valley Railroad % 18 Bedford % 19 Fort Necessity % 20 Pie Shoppe/Laughlintown % 21 Bedford Springs Resort 9 0.7% 22 Latrobe 9 0.7% 23 Seven Springs Resort 9 0.7% 24 Gettysburg Visitors Center 7 0.5% 25 Johnstown Flood Museum 7 0.5% 26 Coffee Pot/Bedford 6 0.5% 27 Fort Bedford 6 0.5% 28 Latrobe Airport Museum 6 0.5% 29 Ship Hotel Site 6 0.5% 30 St. Vincent College 6 0.5% Source: Survey of visitors to Lincoln Highway HC, 2014; 668 total respondents
111 Lincoln Highway Distribution of Visitation Sites and Visitor Home Locations Respondents completed the survey at attractions located in 9 zip codes within the Lincoln Highway Heritage Corridor, as noted on the map below. Source: Survey of visitors to Lincoln Highway HC, 2014; 668 total respondents Respondents in the Lincoln Highway Heritage Corridor came from 320 zip codes and 23 states in the U.S. (plus the District of Columbia) and one other nation (Canada). Source: Survey of visitors to Lincoln Highway HC, 2014; 668 total respondents
112 Appendix H National Road Heritage Corridor Detailed Information National Road Top Attractions and Visitation Estimated by HA Staff Total Visitation: 1,988, ,000 1,000,000 1,500,000 2,000,000 Christian Klay Winery 32,000 Fallingwater 165,283 Fort Necessity 71,673 Friendship Hill 43,373 GAP Trailhead 115,000 Historic Summit Inn 6,327 Ohiopyle State Park 1,500,000 PA Trolley Museum 30,000 Washington, PA Whiskey Rebellion 25,000 Source: Survey of visitors to National Road HC, 2014; 1036 total respondents
113 National Road Results: Visitor Breakout Visitor Type Frequency Percent Local Day Visitor (less than 60 miles) % Non-Local Day Visitor (60 miles or more) % Overnight visitor, Motel % Overnight visitor, Other % % Travel Party Size How many adults are in your travel party How many youths are in your travel party (under 18) Pennsylvania or Out-of State Visitors Frequency Percent Pennsylvania residents % Out of state visitors % Total % Reason for Your Visit Frequency Percentage I live here 91 8% Visiting friends % See heritage sites % Outdoors % Passing through 72 7% % Source: Survey of visitors to National Road HC, 2014; 1036 total respondents
114 National Road Top 30 Attractions Cited by Respondents Attraction Frequency Percent 1 Fallingwater % 2 Ohiopyle % 3 Kentuck Knob % 4 Nemacolin % 5 Fort Necessity % 6 Pittsburgh % 7 Laurel Caverns % 8 GAP Trail % 9 Hartzell House B&B % 10 Friendship Hill % 11 Summit Inn % 12 Flight 93 Memorial % 13 Nemacolin Woodlands Resort % 14 Seven Springs Resort % 15 Nemacolin Castle % 16 Whiskey Rebellion Festival % 17 Ligonier % 18 Christian Klay Winery % 19 Confluence % 20 Stone House Inn % 21 Yough River % 22 Polymath Park 9 0.5% 23 Grey Towers, Milford 8 0.4% 24 Jumonville 8 0.4% 25 Braddock's Grave 7 0.4% 26 Firefly Grill 6 0.3% 27 Gettysburg 6 0.3% 28 Deep Creek, MD 5 0.3% 29 Ferncliff Trail 5 0.3% 30 Mount Washington Tavern 5 0.3% Source: Survey of visitors to National Road HC, 2014; 1036 total respondents

115 National Road Distribution of Visitation Sites and Visitor Home Locations Respondents completed the survey at attractions located in 17 zip codes within the National Road Heritage Corridor, some of which overlap on the map below. Source: Survey of visitors to National Road HC, 2014; 1036 total respondents Respondents in the National Road Heritage Corridor came from 622 zip codes and 40 states in the U.S. (plus the District of Columbia) and four other nations (Australia, Canada, France and Italy). Source: Survey of visitors to National Road HC, 2014; 1036 total respondents
116 Appendix I PA Route 6 Heritage Corridor Detailed Information PA Route 6 Top Attractions and Visitation Estimated by HA Staff Total Visitation: 9,236, ,000,000 2,000,000 3,000,000 4,000,000 Archbald Pothole Austin Dam Chapman Cherry Springs Colton Point (PA Grand Canyon) Denton Hill Dorflinger Glass Museum Goodell Gardens Grey Towers Hills Creek Kinzua Lackawanna Lake Wallenpaupak VC Leonard Harrison (PA Grand Canyon) Lyman Run Mt. Pisgah Ole Bull PA Lumber Museum Patterson Presque Isle & Erie Bluffs Promised Land Prompton Pymatuning Salt Springs Sizerville Steamtown Tioga County VB Warren County VB Worlds End 14,420 5, ,919 47,864 96,885 63,805 1,711 15,102 12,297 84, , ,673 29, , ,949 59,017 56,796 4,784 3, ,773 9,137 32,423 78,675 32,713 5,416 2, ,733 3,162,671 3,726,796 Source: Survey of visitors to PA Route 6 HC, 2014; 781 total respondents
117 PA Route 6 Results: Visitor Breakout Visitor Type Local Day Visitor (less than 60 miles) Non Local Day Visitor (60 miles or more) Frequency Percent 91 12% 67 9% Overnight visitor, Motel % Overnight visitor, Other % % Pennsylvania or Out-of State Visitors Frequency Percent Pennsylvania residents % Out of state visitors % Total % Travel Party Size How many adults are in your travel party How many youths are in your travel party (under 18) Frequency Mean Reason for Visit Frequency Percent I live here % Visiting friends % See heritage sites % Outdoors % Passing through 96 12% % Source: Survey of visitors to PA Route 6 HC, 2014; 781total respondents
118 PA Route 6 Top 30 Attractions Cited by Respondents Attraction Frequency Percent 1 Kinzua Bridge State Park 114 8% 2 Kinzua Bridge Skywalk 99 7% 3 Dorflinger Glass Museum 84 6% 4 PA Lumber Museum % 5 Lake Wallenpaupack % 6 Pymatuning State Park % 7 PA Grand Canyon % 8 Grey Towers, Milford % 9 Kinzua Dam % 10 Warren County Visitors Bureau % 11 Kinzua % 12 Pymatuning Fish Hatchery % 13 Flickerwood Winery % 14 Wellsboro % 15 Elk Country Viewing Center % 16 Allegheny National Forest % 17 Tioga County Visitors Bureau % 18 Zippo Museum % 19 Bushkill Falls % 20 Honesdale % 21 Rim Rock % 22 Hawley Silk Mill % 23 Leonard Harrison State Park % 24 Linesville % 25 Pymatuning Wildlife Learning Center % 26 Lyman Lake 9 0.6% 27 Ice Mine 8 0.6% 28 Milford 8 0.6% 29 Pymatuning Deer Park 8 0.6% 30 Tioga Central Railroad 8 0.6% Source: Survey of visitors to PA Route 6 HC, 2014; 781 total respondents
.")
119 PA Route 6 Distribution of Visitation Sites and Visitor Home Locations Respondents completed the survey at attractions located in 21 zip codes within the PA Route 6 Heritage Corridor, some of which overlap on the map below. Source: Survey of visitors PA Route 6 HC, 2014; 781 total respondents Respondents in the PA Route 6 Heritage Corridor came from 504 zip codes and 35 states in the U.S. and four other nations (Canada, France Germany and Denmark). Source: Survey of visitors to PA Route 6 HC, 2014; 781 total respondents
120 Appendix J Susquehanna Gateway Heritage Area Detailed Information Susquehanna Gateway Top Attractions and Visitation Estimated by HA Staff Total Visitation: 526, ,000 80, ,000 Amishview Inn 47,000 Burning Bridge Antiques 50,000 Chiques Rock Outfitters 2,000 Indian Steps Museum 7,000 John Wright Restaurant 131,000 National Watch & Clock Museum 15,000 PA Dutch CVB 107,000 Shank s Mare Outfitters Susquhanna Valley Chamber Visitor Center 5,000 10,000 Turkey Hill Experience 125,000 York County CVB 25,000 Zimmerman Center 2,000 Source: Survey of visitors to Susquehanna Gateway HA, 2014; 515 total respondents
121 Susquehanna Valley Results: Visitor Breakout Type of Visitor Frequency Percent Local Day Visitor (less than 60 miles) % Non-local Day Visitor (60 miles or more) 32 6% Overnight visitor, Motel % Overnight visitor, Other % Total % Pennsylvania or Out-of State Visitors Frequency Percent Pennsylvania residents % Out of state visitors % Total % Travel Party Size Frequency Mean How many adults are in your travel party How many youths are in your travel party (under 18) Reason for Visiting Frequency Percentage I live here % Visiting friends 59 11% See heritage sites % Outdoors 46 9% Passing through 44 8% % Source: Survey of visitors to Susquehanna Gateway HA, 2014; 515 total respondents
122 Susquehanna Gateway Top 30 Attractions Cited by Respondents Attraction Frequency Percent 1 Amishview Inn % 2 Turkey Hill Experience % 3 Zimmerman Center % 4 Kitchen Kettle Village % 5 National Watch & Clock % 6 Sight and Museum Sound Theatre % 7 PA Dutch Visitor Center % 8 Bridge Bust % 9 Hershey % 10 Hershey Park % 11 Lancaster Visitors Center % 12 Lancaster % 13 Wrightsville % 14 Susquehanna Gateway % 15 Bird in Hand Heritage Farmers Area Market % 16 John Wright Restaurant % 17 Indian Steps Museum % 18 quilt shops % 19 Tanger Outlets % 20 Columbia % 21 Hershey Chocolate World % 22 Rockvale Outlets % 23 outlets % 24 Strasburg Railroad Museum % 25 Sight and Sound Theater % 26 American Music Theater % 27 Harley Davidson Factory % 28 buggy rides 9 0.8% 29 Gettysburg 9 0.8% 30 Amish country 8 0.7% Source: Survey of visitors to Susquehanna Gateway HA, 2014; 515 total respondents

123 Susquehanna Gateway Distribution of Visitation Sites and Visitor Home Locations Respondents completed the survey at attractions located in 16 zip codes within the Susquehanna Gateway Heritage Area, some of which overlap in the map below. Source: Survey of visitors to Susquehanna Gateway HA, 2014; 515 total respondents Respondents in the Susquehanna Gateway Heritage Area came from 317 zip codes and 30 states in the U.S. (plus the District of Columbia) and two other nations (Australia and the Netherlands).
billion paid to private sector workers during 2012. Focus on Meeting and Convention Segment. The convention and
 Executive Summary Applied Analysis was retained by the Las Vegas Convention and Visitors Authority (the LVCVA ) to review and analyze the economic impacts associated with its various operations and southern
ECONOMIC IMPACT TOOL: SENSITIVITY ANALYSIS Cherokee Hills National Scenic Byway CASE STUDY AMERICA S BYWAYS RESOURCE CENTER AUGUST 16, 2012
 AMERICA S BYWAYS RESOURCE CENTER ECONOMIC IMPACT TOOL: SENSITIVITY ANALYSIS Cherokee Hills National Scenic Byway CASE STUDY AUGUST 16, 2012 mountainview@utah.gov www.udot.utah.gov/mountainview CONTENTS
The Economic Impact of Tourism in New York. 2010 Calendar Year Catskills Focus
 The Economic Impact of Tourism in New York 2010 Calendar Year Catskills Focus Key themes in 2010 The New York State visitor economy rebounded in 2010, recovering 94% of the losses experienced during the
The Economic Impact of Tourism in New York. 2010 Calendar Year Central New York Focus
 The Economic Impact of Tourism in New York 2010 Calendar Year Central New York Focus Key themes in 2010 The New York State visitor economy rebounded in 2010, recovering 94% of the losses experienced during
2013 Cape Breton Celtic Classic Sydney, Nova Scotia
 2013 Cape Breton Celtic Classic Sydney, Nova Scotia Economic Impact Assessment December 2013 The following analysis details the economic impact of the PGA Tour of Canada 2013 Cape Breton Celtic Classic
The Economic Benefits of Oil and Natural Gas Production: An Analysis of Effects on the United States and Major Energy Producing States
 August 2014 The Economic Benefits of Oil and Natural Gas Production: An Analysis of Effects on the United States and Major Energy Producing States THE PERRYMAN GROUP 510 N. Valley Mills Dr. Suite 300 Waco,
Economic Impact of Trade & Consumer Shows
 Economic Impact of Trade & Consumer Shows R ESEARCH C ONDUCTED BY M ARION J OPPE, P H.D. HS CHRIS C HOI, P H.D. D ONGKOO YUN, P H.D. ON BEHALF OF TOURISM TORONTO IN PARTNERSHIP WITH INTERNATIONAL CENTRE,
The Economic Impact of One WVU Home Football Game on the Monongalia County Economy. Dr. Christiadi Demographer
 The Economic Impact of One WVU Home Football Game on the Monongalia County Economy Dr. Christiadi Demographer October 2012 The Economic Impact of One WVU Home Football Game on the Monongalia County Economy
The Economic Impact of Technical College System of Georgia Institutions on their Service Delivery Areas Economies in FY 2012
 The Economic Impact of Technical College System of Georgia Institutions on their Service Delivery Areas Economies in FY 2012 January 2014 A Study Commissioned by The Technical College System of Georgia
International Education in the Comox Valley: Current and Potential Economic Impacts
 International Education in the Comox Valley: Current and Potential Economic Impacts FINAL REPORT March 2012 Prepared by: Vann Struth Consulting Group Inc. Vancouver, BC www.vannstruth.com Prepared for:
Economic Contributions of Pacific Gas and Electric Company
 Economic Contributions of Pacific Gas and Electric Company February 2014 Prepared for: Pacific Gas and Electric Company 77 Beale Street San Francisco, CA 94105 www.pge.com Prepared by: 400 Capitol Mall,
Economic Impact Analysis of School Facility Construction
 Wright State University CORE Scholar Economic Development Center for Urban and Public Affairs 2010 Economic Impact Analysis of School Facility Construction Wright State University, Center for Urban and
Tourism: jobs and growth The economic contribution of the tourism economy in the UK
 Tourism: jobs and growth The economic contribution of the tourism economy in the UK November 2013 Contents The Tourism Economy: contributing to UK growth 1 Tourism: Benefitting all of Britain 2 Executive
Women Business Owners Create Jobs and Income - A Review
 The Economic Impact of Women-Owned Businesses In the United States Underwritten by: Walmart National Women s Business Council Center for Women s Business Research October 2009 1760 Old Meadow Road, Suite
Economic Impact of The Charleston International Airport Complex
 Economic Impact of The Charleston International Airport Complex Conducted by: Center for Business Research Charleston Metro Chamber of Commerce PO Box 975, Charleston SC 940 January 05 Economic Impact
The Airbnb Community in Vancouver
 The Airbnb Community in Vancouver With more than two million listings in 34,000 cities and 192 countries, Airbnb is proud of the positive impact our hosts and guests are having in communities around the
M E M O R A N D U M. IUP Researchers. Tracy Eisenhower, IUP Research Institute. DA: April 15, 2013. 2014 Center for Rural PA Funding Opportunities
 M E M O R A N D U M TO: FR: IUP Researchers Tracy Eisenhower, IUP Research Institute DA: April 15, 2013 RE: 2014 Center for Rural PA Funding Opportunities I am pleased to be able to announce and share
Economic Impact of the Queen of Peace Hospital and Related Health Sectors of Scott County
 Economic Impact of the Queen of Peace Hospital and Related Health Sectors of Scott County March 17, 2011 Minnesota Department of Health- Office of Rural Health and Primary Care The health care sector is
Economic and Fiscal Impacts of the New Mexico Film Production Tax Credit
 Economic and Fiscal Impacts of the New Mexico Film Production Tax Credit Prepared for the New Mexico State Film Office and State Investment Council January 2009 Executive Summary New Mexico has provided
Economic Impact of Redeveloping The World Trade Center Site: New York City, New York State, And the New York-New Jersey Area
 Economic Impact of Redeveloping The World Trade Center Site: New York City, New York State, And the New York-New Jersey Area Appleseed October 30, 2003 Executive Summary The redevelopment of the World
THE PROJECTED ECONOMIC AND FISCAL IMPACTS OF A TENNESSEE HISTORIC REHABILITATION INVESTMENT INCENTIVE
 THE PROJECTED ECONOMIC AND FISCAL IMPACTS OF A TENNESSEE HISTORIC REHABILITATION INVESTMENT INCENTIVE February 2014 Prepared by: Economic Impact Group, LLC. Copyright 2014 Economic Impact Group, LLC. EXECUTIVE
VII. DIRECT, INDIRECT, AND INDUCED ECONOMIC IMPACTS OF UC SAN DIEGO
 VII. DIRECT, INDIRECT, AND INDUCED ECONOMIC IMPACTS OF UC SAN DIEGO THE CONCEPT OF INDIRECT AND INDUCED ECONOMIC IMPACTS The impact of UC San Diego on the local, regional, and state economies is greater
The Economic Impact of Commercial Airports in 2010
 The Economic Impact of Commercial Airports in 2010 January 2012 Prepared for: Airports Council International North America Prepared by: CDM Smith 8805 Governor s Hill Drive Cincinnati, Ohio 45249 Table
The Value of Ski Areas to the British Columbia Economy Phase Two: All Alpine Ski Areas
 The Value of Ski Areas to the British Columbia Economy Phase Two: All Alpine Ski Areas Table of Contents 1. Acknowledgements... 3 2. Executive Summary... 4 3. Introduction... 6 4. Project Rationale...
THE ECONOMIC IMPACT OF
 THE ECONOMIC IMPACT OF April 13, 2016 L. William Seidman Research Institute W. P. Carey School of Business Arizona State University Research Team: Michael Mokwa, Daniel McIntosh, John Eaton, Anthony Evans,
Estimating the Effects of Spending
 Economic Impacts of Protecting Rivers, Trails, and Greenway Corridors Estimating the Effects of Spending Contents Page Direct, Indirect, and Induced Effects 6-3 Multipliers 6-5 Economic Impact Models 6-7
The Economic and Community Impact of Downsizing Postal Sorting Operations in New Orleans
 The Economic and Community Impact of Downsizing Postal Sorting Operations in New Orleans A Fiscal Policy Institute Report www.fiscalpolicy.org November 10, 2014 The Economic and Community Impact of Downsizing
Key facts on tourism
 Key facts on tourism 2008 edition Economic impact of tourism in France in 2007 Foreign trade Expenditure by foreign visitors in France: EUR 39.6 billion (+7.2%*) Expenditure by French residents abroad:
The Economic Impacts of Angelo State University
 The Economic Impacts of Angelo State University Prepared by: Bradley T. Ewing, Ph.D. Rawls Professor of Operations Management Texas Tech University Rawls College of Business (806) 742-3939 bradley.ewing@ttu.edu
The Economic Impact of Texas State University
 The Economic Impact of Texas State University James P. LeSage 1 Fields Endowed Chair for Urban and Regional Economics McCoy College of Business Administration Department of Finance and Economics Texas
Regional Economic Impact Analysis
 Section III: Applying Knowledge Regional Economic Impact Analysis Summary In this activity, teachers present a lecture related to assessing regional economic impacts and students use this knowledge to
The Economic Impact of Golf In South Carolina
 The Economic Impact of Golf In South Carolina By Dudley Jackson Research Director South Carolina Department of Parks, Recreation and Tourism For South Carolina Golf Course Owners Association April 2012
The economic impact of the University of West London
 The economic impact of the University of West London Contents Executive Summary 2 1 Introduction 4 1.1 Purpose of report 1.2 Acknowledgements 2 Measuring the economic impact of the University 6 2.1 How
Economic Impact Analysis of PSE&G s Capital Expenditure Program
 Economic Impact Analysis of PSE&G s Capital Expenditure Program Submitted to: PSE&G June 2014 Joseph J. Seneca, Michael L. Lahr, Will Irving Contents Introduction... 1 Project Expenditure Data... 2 Methodology...
Economic Impact Report 2014
 Economic Impact Report 2014 Prepared by: Scott Minto, Director San Diego State University Sports MBA Program Executive Summary Total Participants 10,918 Total Finishers 10,229 Total Economic Impact $8,125,417
THE ECONOMIC IMPACT OF AEROSPACE AND DEFENSE FIRMS ON THE STATE OF ARIZONA
 THE ECONOMIC IMPACT OF AEROSPACE AND DEFENSE FIRMS ON THE STATE OF ARIZONA Final Report September 2010 L. William Seidman Research Institute W. P. Carey School of Business Arizona State University Tempe,
Tourism s. 1997 98 to 2011 12. Tourism s. Economy
 Tourism s Contribution to the Australian Economy 1997 98 to 2011 12 Tourism s Contribution to the Australian Economy Authors: Jai Kookana and Tien Duc Pham ISBN 978-1-922106-91-9 (PDF) 978-1-922106-92-6
The Negative Employment Impacts of the Medicare Cuts in the Budget Control Act of 2011. September 2012
 The Negative Employment Impacts of the Medicare Cuts in the Budget Control Act of 2011 September 2012 Table of Contents Executive Summary... 3 Introduction... 4 Methodology Employed in the Economic Impact
May 2015. The economic impact of the UK Maritime Services Sector: Business Services
 May 2015 The economic impact of the UK Maritime Services Sector: Business Services Contents 1 Executive summary... 2 2 Introduction... 4 2.1 The channels of economic impact... 4 2.2 Report structure...
The Economic Impact of the New Hospital on the Economy of Drumright, Creek County, Oklahoma
 The Economic Impact of the New Hospital on the Economy of Drumright, Creek County, Oklahoma Drumright Creek County Oklahoma Cooperative Extension Service Oklahoma Office of Rural Health Rural Health Policy
A REPORT OF THE ECONOMIC IMPACT OF ABC CORPORATION IN AUSTIN, TEXAS
 A REPORT OF THE ECONOMIC IMPACT OF ABC CORPORATION IN AUSTIN, TEXAS Prepared for: XYZ Economic Development Corporation 123 Oak Street Austin, TX 78701 March 5, 2009 Economic Consulting, Research & Analysis
Estimated Economic Impact of Gulf Oil Spill on Virginia s Oyster Industry July 2010
 Estimated Economic Impact of Gulf Oil Spill on Virginia s Oyster Industry July 2010 Thomas J. Murray and James E. Kirkley Virginia Institute of Marine Science College of William & Mary Gloucester Point,
THE ECONOMIC IMPACT OF BICYCLING IN COLORADO. Summary of Findings
 THE ECONOMIC IMPACT OF BICYCLING IN COLORADO Summary of Findings Total economic benefit from bicycling in Colorado is over $1 billion annually Manufacturing Total annual revenue $763 million 513 FTEs -
Flickr: Randy Pertiet. Baltimore s Inner Harbor: Economic Impact, Importance, and Opportunities for Investment October 31, 2013
 Flickr: Randy Pertiet Baltimore s Inner Harbor: Economic Impact, Importance, and Opportunities for Investment October 31, 2013 Executive Summary: Baltimore s Inner Harbor drives substantial economic and
NOV 2015. The ECONOMIC VALUE of IDAHO PUBLIC COLLEGES & UNIVERSITIES. Main Report. Analysis of the Economic Impact & Return on Investment of Education
 NOV 2015 The ECONOMIC VALUE of IDAHO PUBLIC COLLEGES & UNIVERSITIES Main Report Analysis of the Economic Impact & Return on Investment of Education 1 CONTENTS 4 ACKNOWLEDGMENTS 5 EXECUTIVE SUMMARY 5 Economic
Economic Impacts of Utah Valley University
 Economic Impacts of Utah Valley University Prepared For: Utah Valley University (UVU) Prepared By: Jack Faucett Associates, Inc. (JFA) Date: November 9, 2011 1 Purpose The purpose of this presentation
Economic Impact of the September 11 World Trade Center Attack
 Economic Impact of the September 11 World Trade Center Attack Preliminary Report Prepared for the New York City Central Labor Council and the Consortium for Worker Education By the Fiscal Policy Institute
Tourism. Capacity and occupancy of tourist accommodation establishments
 Tourism The current information system on tourism statistics produced by ISTAT relies on several sources that analyse the phenomenon from the point of view of both demand and supply. The oldest sources
Eli Lilly. and Company. in Indiana
 Economic Eli Lilly Impact of and Company in Indiana The Economic Impact of Eli Lilly and Company on the State of Indiana and the Indianapolis-Carmel Metropolitan Statistical Area June 2009 Prepared by
2014 AICUP Economic and Community Impact Report Methodology and Data Sources
 2014 AICUP Economic and Community Impact Report Methodology and Data Sources Definitions Independent colleges and universities in Pennsylvania This universe is the 96 non-profit, degree-granting institutions
The economic impact of the UK s Maritime Services Sector
 The economic impact of the UK s Maritime Services Sector A Report prepared for Maritime UK April 2011 Contents 1 Executive summary...2 2 Introduction...4 2.1 The channels of economic impact... 4 2.2 Report
ECONOMIC IMPACT ANALYSIS
 ECONOMIC IMPACT ANALYSIS 2010 Prepared For: Clinton Regional Development Corporation & Clinton Area Chamber of Commerce August 2010 The London Group 2010 Report Prepared by: Gary H. London, President Nathan
The Economic Impact of AAMC-Member Medical Schools and Teaching Hospitals
 The Economic Impact of AAMC-Member Medical Schools and Teaching Hospitals Conducted for the AAMC by Tripp Umbach September 2009 Association of American Medical Colleges For additional information about
Economic Impacts of Tourism. Daniel J. Stynes
 Economic impacts of Tourism Page # 1 Economic Impacts of Tourism Daniel J. Stynes Businesses and public organizations are increasingly interested in the economic impacts of tourism at national, state,
Background on the Economic Impact Methodology Used in the Analysis
 Background on the Economic Impact Methodology Used in the Analysis Approach and Models Developed A. Strauss-Wieder, Inc. (ASWinc) constructed a multi-regional input-output model using the IMPLAN version
DEMONSTRATING ECONOMIC
 FEBRUARY 2015 DEMONSTRATING THE COLLECTIVE ECONOMIC COLLECTIVE VALUE OF DEMONSTRATING ECONOMIC VALUE OF NORTH CAROLINA COMMUNITY COLLEGES NORTH CAROLINA COMMUNITY COLLEGES FEBRUARY 2015 MAIN REPORT 1 CONTENTS
The Economic Impact of Long Distance Cycle Routes North Sea Cycle Route (NSCR)
") The Economic Impact of Long Distance Cycle Routes North Sea Cycle Route (NSCR) Les Lumsdon and Paul Downward CAST, Staffordshire University Stoke-on-Trent SK10 1LT, UK p.m.downward@staffs.ac.uk Summary
The Economic Impact of Long Distance Cycle Routes North Sea Cycle Route (NSCR) Les Lumsdon and Paul Downward CAST, Staffordshire University Stoke-on-Trent SK10 1LT, UK p.m.downward@staffs.ac.uk Summary
Downtown Los Angeles Streetcar Economic Analysis
 Downtown Los Angeles Streetcar Economic Analysis Executive Briefing Prepared for: Los Angeles Streetcar, Inc. 550 S. Hope Street, Ste. 2300 Los Angeles, CA 90071 Prepared by: AECOM 515 S. Flower Street,
The Economic Impact of Destin Tourism on Okaloosa County
 The Economic Impact of Destin Tourism on Okaloosa County Final Report Prepared for: The City of Destin, Florida April 2004 Prepared by: Melissa Neal, M.A. Phyllis Pooley, MBA, JD Haas Center for Business
The Economic Impact of Local Parks
 The Economic Impact of Local Parks An Examination of the Economic Impacts of Operations and Capital Spending on the United States Economy Executive Summary National Recreation and Park Assocation 1 Table
Assessing the Use of Local Preferences in Local Government Contracting. Kendra Jensen
 Assessing the Use of Local Preferences in Local Government Contracting By Kendra Jensen A paper submitted to the faculty of The University of North Carolina at Chapel Hill in partial fulfillment of the
World Tourism Organisation
 World Tourism Organisation Capacity Building Program, Asia Workshop II Manila, Philippines 4 6 July 2011 Tourism Satellite Account - Why do we have it and what does it do? Why is tourism not identified
Final Report. Measuring the Economic Impact of Improved Electricity Distribution in Connecticut. Prepared by Regional Economic Models, Inc.
 Measuring the Economic Impact of Improved Electricity Distribution in Connecticut Final Report Prepared by Regional Economic Models, Inc. For Connecticut Light & Power July 2007 TABLE OF CONTENTS Executive
The National Accounts and the Public Sector by Casey B. Mulligan Fall 2010
 The National Accounts and the Public Sector by Casey B. Mulligan Fall 2010 Factors of production help interpret the national accounts. The factors are broadly classified as labor or (real) capital. The
The Economic Impact of Capital Availability to Minority-Owned Small Businesses in Baltimore
 The Economic Impact of Capital Availability to Minority-Owned Small Businesses in Baltimore Submitted by: Sage Policy Group, Inc. Submitted to: Meridian Management Group, Inc. Empower Baltimore Management
Business Finance Center Loan Programs
 Northeastern Pennsylvania Alliance Business Finance Center Loan Programs Providing low-cost financing to help businesses fund their land/building, machinery/equipment and working capital needs TABLE OF
Expedia.com 2008 International Vacation Deprivation Survey Results
 Expedia.com 2008 International Vacation Deprivation Survey Results History: This is the eighth year of the annual Expedia.com Vacation Deprivation survey which spotlights the growing trend of employed
May 2015. The economic impact of the UK Maritime Services Sector in Scotland
 May 2015 The economic impact of the UK Maritime Services Sector in Scotland Contents 1 Executive summary... 2 2 Introduction... 4 2.1 The channels of economic impact... 4 2.2 Report structure... 4 3 Direct
6 Ways to Describe Your Community
 APPENDIX 10 6 Ways to Describe Your Community Lifestyles & Interests Groups & Affiliations Agencies & Services Social & Economic Factors Community Assets Changes occurring Public libraries are deeply inclusive
Tourism and Travel. Overseas trips to Ireland increased by 0.2% in 2012. 21 March 2013. The main results for 2012 are as follows:
 An Phríomh-Oifig Staidrimh Central Statistics Office 21 March 2013 Number of trips by reason for journey - 2012 000's 4000 3500 3000 2500 2000 1500 1000 500 0 Business VFR HLR Other 2012 Trips to Ireland
HOTEL OCCUPANCY TAX USE GUIDELINES UNDER TEXAS STATE LAW FUNDING APPLICATION FORM
 HOTEL OCCUPANCY TAX USE GUIDELINES UNDER TEXAS STATE LAW FUNDING APPLICATION FORM State Law: By law of the State of Texas, the City of Victoria collects a Hotel Occupancy Tax (HOT) from hotels, bed & breakfasts,
Pennsylvania Act 129 Phase I Economic Impact Assessment Report
 Pennsylvania Act 129 Phase I Economic Impact Assessment Report Bureau of Technical Utility Services PA Public Utility Commission August 2014 Statement of Intent On February 25, 2014 Commissioner Cawley
Transportation Infrastructure Investment: Macroeconomic and Industry Contribution of the Federal Highway and Mass Transit Program
 Transportation Infrastructure Investment: Macroeconomic and Industry Contribution of the Federal Highway and Mass Transit Program Prepared for: Transportation Construction Coalition Submitted by: IHS Global
Economic base approach
 This memorandum is preliminary in nature and subject to revision and review. Any views expressed are not necessarily those of the Federal Reserve Bank of Boston or of the Federal Reserve System. To: Dr.
The Economic Impact of the Health Sector on the Economy of Dallas County, Iowa a. Daniel Otto and Georgeanne Artz b
 The Economic Impact of the Health Sector on the Economy of Dallas County, Iowa a Daniel Otto and Georgeanne Artz b The importance of medical and health facilities as community service providers is well
II. WAGE AND SALARY DISBURSEMENTS
 II. WAGE AND SALARY DISBURSEMENTS Wage and salary disbursements consist of the monetary remuneration of employees (including the salaries of corporate officers, commissions, tips, bonuses, and severance
2003 Annual Survey of Government Employment Methodology
 2003 Annual Survey of Government Employment Methodology The U.S. Census Bureau sponsors and conducts this annual survey of state and local governments as authorized by Title 13, United States Code, Section
WM RECYCLE AMERICA, L.L.C.
 WM RECYCLE AMERICA, L.L.C. CITY OF SPOKANE MRF ECONOMIC IMPACT STUDY Conducted by: BUSINESS RESEARCH DIVISION Leeds School of Business University of Colorado at Boulder 420 UCB Boulder, CO 80309-0420 Telephone:
City of Beverly. Impact ECONOMIC STUDY. conducted for ENDICOTT RESEARCH CENTER ENDICOTT COLLEGE BEVERLY, MASSACHUSETTS
 City of Beverly Impact ECONOMIC STUDY conducted for by ENDICOTT RESEARCH CENTER ENDICOTT COLLEGE BEVERLY, MASSACHUSETTS City of Beverly Impact ECONOMIC STUDY conducted for CONTENTS Executive Summary.............................
The Economic Impact of Health Services on the Economy of Sumter County, Alabama
 The Economic Impact of Health Services on the Economy of Sumter County, Alabama Hospitals Nursing Homes Physicians, Dentists, Etc. Pharmacies Other Services Prepared by: National Center for Rural Health
The Economic Benefits of Aviation and Performance in the Travel & Tourism Competitiveness Index
 CHAPTER 1.4 The Economic Benefits of Aviation and Performance in the Travel & Tourism Competitiveness Index JULIE PEROVIC International Air Transport Association (IATA) The aviation industry supports tourism
The Economic Contributions of U.S. Mining (2012)
") The Economic Contributions of U.S. Mining (2012) September 2014 A report prepared by the National Mining Association TABLE OF CONTENTS Executive Summary...E-1 National Results...E-1 State Results...E-1
The Economic Contributions of U.S. Mining (2012) September 2014 A report prepared by the National Mining Association TABLE OF CONTENTS Executive Summary...E-1 National Results...E-1 State Results...E-1
INSPIRING THE NEXT GENERATION WORKFORCE THE 2014 MILLENNIAL IMPACT REPORT EXECUTIVE SUMMARY
 INSPIRING THE NEXT GENERATION WORKFORCE THE 2014 MILLENNIAL IMPACT REPORT EXECUTIVE SUMMARY ABOUT THE RESEARCH For the 2014 Millennial Impact Report, Achieve gathered information from two different sources:
TRAVEL BY AUSTRALIANS
 TRAVEL BY AUSTRALIANS Quarterly results of the National Visitor Survey JUNE 2013 TRAVEL BY AUSTRALIANS Travel by Australians June 2013 Quarterly Results of the National Visitor Survey Image: Sailing,
ECONOMIC IMPORTANCE OF CLUBS IN THE RAIFFEISEN SUPER LEAGUE 2013/14 FINAL REPORT REALISED BY SUPPORTED BY ON BEHALF OF
 ECONOMIC IMPORTANCE OF CLUBS IN THE RAIFFEISEN SUPER LEAGUE 2013/14 FINAL REPORT REALISED BY SUPPORTED BY ON BEHALF OF EDITORIAL 3 The Raiffeisen Super League consists of myriad companies in Switzerland,
PRINEVILLE DATA CENTER
 PRINEVILLE DATA CENTER Economic and Fiscal Impact Study EXECUTIVE SUMMARY PREPARED BY: KEY TERMS Direct Spending and employment that occurs at the site location of the business. For example, the jobs on
Economic Impacts of the University of California, Riverside
 Economic Impacts of the University of California, Riverside Fiscal Year 2009-10 Prepared for: UNIVERSITY OF CALIFORNIA, RIVERSIDE Prepared by: CBRE CONSULTING Page intentionally left blank for duplex printing
MEASURING ECONOMIC IMPACTS OF PROJECTS AND PROGRAMS
 Economic Development Research Group April 1997 MEASURING ECONOMIC IMPACTS OF PROJECTS AND PROGRAMS GLEN WEISBROD, ECONOMIC DEVELOPMENT RESEARCH GROUP BURTON WEISBROD, ECONOMICS DEPT., NORTHWESTERN UNIV.
Dallas Cowboys Training Camp
 UCSB Economic Forecast Project Dallas Cowboys Training Camp Economic Impact Study: City of Oxnard and Ventura County UCSB Economic Forecast Project December 4, 2012 Executive Summary 52,141 people attended
The Contribution of the Dairy Industry to the Idaho Economy: 2011 and 2012. Analysis for. Idaho Dairymen s Association.
 The Contribution of the Dairy Industry to the Idaho Economy: 2011 and 2012 Analysis for Idaho Dairymen s Association August 2014 Principal Investigators: Philip Watson Lead P.I. Anna Brown Paul Lewin Garth
Economic Impact of the University of Gloucestershire
 Economic Impact of the University of Gloucestershire A report to BiGGAR Economics Midlothian Innovation Centre Pentlandfield Roslin, Midlothian EH25 9RE 0131 440 9032 info@biggareconomics.co.uk www.biggareconomics.co.uk
IMPACT OF THE HOMECARE AND HOSPICE INDUSTRY ON PENNSYLVANIA S ECONOMY
 IMPACT OF THE HOMECARE AND INDUSTRY ON PENNSYLVANIA S ECONOMY OCTOBER 2013 Prepared by: APPENDIX A: DEFINITION OF ECONOMIC IMPACT TERMS Study Year Fiscal Year 2012 (FY 12) APPENDIX B: DEFINITION OF INDUSTRY
EXAMINING DIRECT & INTERACTIVE MARKETING APPLICATIONS IN A VARIETY OF SECTORS
 1 CHAPTER 14-2E EXAMINING DIRECT & INTERACTIVE MARKETING APPLICATIONS IN A VARIETY OF SECTORS Summary The applications of direct and interactive marketing are almost endless. This chapter has explored
The Economic Contribution of the Oil and Gas Industry In Kern County
 INTRODUCTION The Economic Contribution of the Oil and Gas Industry In Kern County Kern Economic Development Foundation (KEDF) was contracted by the Western States Petroleum Association (WSPA) to conduct
Sitka Charter Fishing Visitor Profile and Impact Analysis Alaska Travelers Survey
 Sitka Charter Fishing Visitor Profile and Impact Analysis Alaska Travelers Survey PREPARED FOR: Sitka Charter Boat Operators Association January 2005 Sitka Charter Fishing Visitor Profile and Impact Analysis
Return on Investment for Select Economic Development Programs (VISIT FLORIDA, Sports, and the Entertainment Industry)
") Return on Investment for Select Economic Development Programs (VISIT FLORIDA, Sports, and the Entertainment Industry) January 20, 2015 Presented by: The Florida Legislature Office of Economic and Demographic
Return on Investment for Select Economic Development Programs (VISIT FLORIDA, Sports, and the Entertainment Industry) January 20, 2015 Presented by: The Florida Legislature Office of Economic and Demographic
A Habitat for Humanity East Bay/Silicon Valley Study Written in collaboration with. Building More Than Houses
 A Habitat for Humanity East Bay/Silicon Valley Study Written in collaboration with Building More Than Houses Habitat envisions a world where everyone has a decent place to live. 2015 Habitat for Humanity
Economic Impact Historic Preservation as Economic Development
 Economic Impact Historic Preservation as Economic Development The argument for historic preservation as economic development is a compelling one. Although the magnitude of the economic impact of historic
Photo: James Horan Courtesy Destination New South Wales. Blue Mountains Tourism Industry Profile. Issue 1: 2014/15
 Photo: James Horan Courtesy Destination New South Wales Blue Mountains Tourism Industry Profile Issue 1: 2014/15 1 BELL MT TOMAH MT WILSON MT IRVINE BILPIN BERAMBING MEGALONG VALLEY MT VICTORIA BLACKHEATH
Tourism and Travel Statistics at Statistics Austria
 Tourism and Travel Statistics at Statistics Austria Methodology, concepts and results Voorburg Group Meeting 20 24 September 2010 We are moving information STATISTICS AUSTRIA Content (1) Tourism and Travel