OCEANIC CIRCULATION 434 OCEAN CURRENTS
|
|
|
- Shanon Byrd
- 8 years ago
- Views:
Transcription

1 CHAPTER 31 OCEAN CURRENTS TYPES AND CAUSES OF CURRENTS Definitions The movement of ocean water is one of the two principal sources of discrepancy between dead reckoned and actual positions of vessels. Water in motion is called a current; the direction toward which it moves is called set, and its speed is called drift. Modern shipping speeds have lessened the impact of currents on a typical voyage, and since electronic navigation allows continuous adjustment of course, there is less need to estimate current set and drift before setting the course to be steered. Nevertheless, a knowledge of ocean currents can be used in cruise planning to reduce transit times, and current models are an integral part of ship routing systems. Oceanographers have developed a number of methods of classifying currents in order to facilitate descriptions of their physics and geography. Currents may be referred to according to their forcing mechanism as either wind driven or thermohaline. Alternatively, they may be classified according to their depth (surface, intermediate, deep or bottom). The surface circulation of the world s oceans is mostly wind driven. Thermohaline currents are driven by differences in heat and salt and are associated with the sinking of dense water at high latitudes; the currents driven by thermohaline forces are typically subsurface. Note that this classification scheme is not unambiguous; the circumpolar current, which is wind driven, extends from the surface to the bottom. A periodic current is one for which the speed or direction changes cyclically at somewhat regular intervals, such as a tidal current. A seasonal current is one which changes in speed or direction due to seasonal winds. The mean circulation of the ocean consists of semi-permanent currents which experience relatively little periodic or seasonal change. A coastal current flows roughly parallel to a coast, outside the surf zone, while a longshore current is one parallel to a shore, inside the surf zone, generated by waves striking the beach at an angle. Any current some distance from the shore may be called an offshore current, and one close to the shore an inshore current. General information on ocean currents is available from NOAA s National Ocean Data Center at: Satellite graphics and other data can be found at: Causes of Ocean Currents The primary generating forces are wind and differences in water density caused by variations in heat and salinity Currents generated by these forces are modified by such factors as depth of water, underwater topography including shape of the basin in which the current is running, extent and location of land, and deflection by the rotation of the Earth Wind Driven Currents The stress of wind blowing across the sea causes a surface layer of water to move. Due to the low viscosity of water, this stress is not directly communicated to the ocean interior, but is balanced by the Coriolis force within a relatively thin surface layer, m thick. This layer is called the Ekman layer and the motion of this layer is called the Ekman transport. Because of the deflection by the Coriolis force, the Ekman transport is not in the direction of the wind, but is 90 to the right in the Northern Hemisphere and 90 toward the left in the Southern Hemisphere. The amount of water flowing in this layer depends only upon the wind and the Coriolis force and is independent of the depth of the Ekman layer and the viscosity of the water. The large scale convergence or divergence of Ekman transport serves to drive the general ocean circulation. Consider the case of the Northern Hemisphere subtropics. To the south lie easterly winds with associated northward Ekman transport. To the north lie westerly winds with southward Ekman transport. The convergence of these Ekman transports is called Ekman pumping and results in a thickening of the upper ocean and a increase in the depth of the thermocline. The resulting subsurface pressure gradients, balanced by the Coriolis force, give rise to the anticyclonic subtropical gyres found at mid latitudes in each ocean basin. In subpolar regions, Ekman suction produces cyclonic gyres. These wind driven gyres are not symmetrical. Along the western boundary of the oceans, currents are narrower, stronger, and deeper, often following a meandering course. These currents are sometimes called a stream. In contrast, currents in mid-ocean and at the eastern boundary, are often broad, shallow and slow-moving. Sometimes these are called drift currents. Within the Ekman layer, the currents actually form a 433

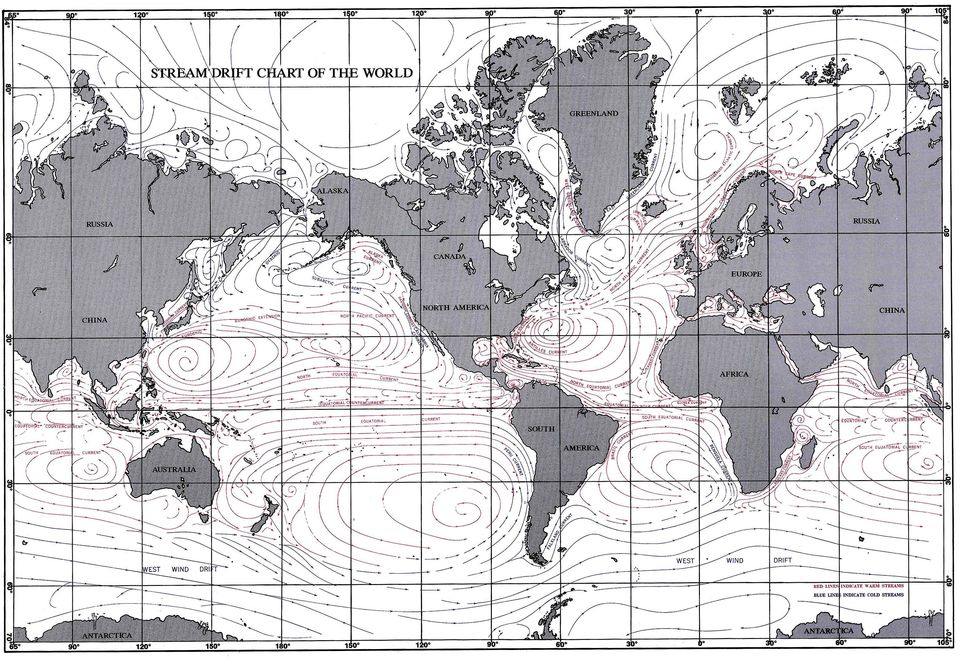
2 434 OCEAN CURRENTS spiral. At the surface, the difference between wind direction and surface wind-current direction varies from about 15 along shallow coastal areas to a maximum of 45 in the deep oceans. As the motion is transmitted to successively deep layers, the Coriolis force continues to deflect the current. At the bottom of the Ekman layer, the current flows in the opposite direction to the surface current. This shift of current directions with depth, combined with the decrease in velocity with depth, is called the Ekman spiral. The velocity of the surface current is the sum of the velocities of the Ekman, geostrophic, tidal, and other currents. The Ekman surface current or wind drift current depends upon the speed of the wind, its constancy, the length of time it has blown, and other factors. In general, however, wind drift current is about 2 percent of the wind speed, or a little less, in deep water where the wind has been blowing steadily for at least 12 hours Currents Related to Density Differences The density of water varies with salinity, temperature, and pressure. At any given depth, the differences in density are due only to differences in temperature and salinity. With sufficient data, maps showing geographical density distribution at a certain depth can be drawn, with lines connecting points of equal density. These lines would be similar to isobars on a weather map and serve an analogous purpose, showing areas of high density and those of low density. In an area of high density, the water surface is lower than in an area of low density, the maximum difference in height being about 1 meter in 100 km. Because of this difference, water tends to flow from an area of higher water (low density) to one of lower water (high density). But due to rotation of the Earth, it is deflected by the Coriolis force or toward the right in the Northern Hemisphere, and toward the left in the Southern Hemisphere. This balance, between subsurface pressure fields and the Coriolis force, is called geostrophic equilibrium. At a given latitude, the greater the density gradient (rate of change with distance), the faster the geostrophic current. OCEANIC CIRCULATION Introduction A number of ocean currents flow with great persistence, setting up a circulation that continues with relatively little change throughout the year. Because of the influence of wind in creating current, there is a relationship between this oceanic circulation and the general circulation of the atmosphere. The oceanic circulation is shown on the chart following this page (winter N. hemisphere), with the names of the major ocean currents. Some differences in opinion exist regarding the names and limits of some of the currents, but those shown are representative. Speed may vary somewhat with the season. This is particularly noticeable in the Indian Ocean and along the South China coast, where currents are influenced to a marked degree by the monsoons Southern Ocean Currents The Southern Ocean has no meridional boundaries and its waters are free to circulate around the world. It serves as a conveyor belt for the other oceans, exchanging waters between them. The northern boundary of the Southern Ocean is marked by the Subtropical Convergence zone. This zone marks the transition from the temperate region of the ocean to the polar region and is associated with the surfacing of the main thermocline. This zone is typically found at 40 S but varies with longitude and season. In the Antarctic, the circulation is generally from west to east in a broad, slow-moving current extending completely around Antarctica. This is called the Antarctic Circumpolar Current or the West Wind Drift, and it is formed partly by the strong westerly wind in this area, and partly by density differences. This current is augmented by the Brazil and Falkland Currents in the Atlantic, the East Australia Current in the Pacific, and the Agulhas Current in the Indian Ocean. In return, part of it curves northward to form the Cape Horn, Falkland, and most of the Benguela Currents in the Atlantic, and the Peru Current in the Pacific. In a narrow zone next to the Antarctic continent, a westward flowing coastal current is usually found. This current is called the East Wind Drift because it is attributed to the prevailing easterly winds which occur there Atlantic Ocean Currents The trade winds set up a system of equatorial currents which at times extends over as much as 50 of latitude or more. There are two westerly flowing currents conforming generally with the areas of trade winds, separated by a weaker, easterly flowing countercurrent. The North Equatorial Current originates to the northward of the Cape Verde Islands and flows almost due west at an average speed of about 0.7 knot. The South Equatorial Current is more extensive. It starts off the west coast of Africa, south of the Gulf of Guinea, and flows in a generally westerly direction at an average speed of about 0.6 knot. However, the speed gradually increases until it may reach a value of 2.5 knots, or more, off the east coast of South America. As the current approaches Cabo de Sao Roque, the eastern extremity of South America, it divides, the southern part curving toward the south along the coast of Brazil, and the

3
4 OCEAN CURRENTS 435 northern part being deflected northward by the continent of South America. Between the North and South Equatorial Currents, the weaker North Equatorial Countercurrent sets toward the east in the general vicinity of the doldrums. This is fed by water from the two westerly flowing equatorial currents, particularly the South Equatorial Current. The extent and strength of the Equatorial Countercurrent changes with the seasonal variations of the wind. It reaches a maximum during July and August, when it extends from about 50 west longitude to the Gulf of Guinea. During its minimum, in December and January, it is of very limited extent, the western portion disappearing altogether. That part of the South Equatorial Current flowing along the northern coast of South America which does not feed the Equatorial Countercurrent unites with the North Equatorial Current at a point west of the Equatorial Countercurrent. A large part of the combined current flows through various passages between the Windward Islands and into the Caribbean Sea. It sets toward the west, and then somewhat north of west, finally arriving off the Yucatan peninsula. From there, the water enters the Gulf of Mexico and forms the Loop Current; the path of the Loop Current is variable with a 13-month period. It begins by flowing directly from Yucatan to the Florida Straits, but gradually grows to flow anticyclonically around the entire Eastern Gulf; it then collapses, again following the direct path from Yucatan to the Florida Straits, with the loop in the Eastern Gulf becoming a separate eddy which slowly flows into the Western Gulf. Within the Straits of Florida, the Loop Current feeds the beginnings of the most remarkable of American ocean currents, the Gulf Stream. Off the southeast coast of Florida this current is augmented by the Antilles Current which flows along the northern coasts of Puerto Rico, Hispaniola, and Cuba. Another current flowing eastward of the Bahamas joins the stream north of these islands. The Gulf Stream follows generally along the east coast of North America, flowing around Florida, northward and then northeastward toward Cape Hatteras, and then curving toward the east and becoming broader and slower. After passing the Grand Banks, it turns more toward the north and becomes a broad drift current flowing across the North Atlantic. The part in the Straits of Florida is sometimes called the Florida Current. A tremendous volume of water flows northward in the Gulf Stream. It can be distinguished by its deep indigo-blue color, which contrasts sharply with the dull green of the surrounding water. It is accompanied by frequent squalls. When the Gulf Stream encounters the cold water of the Labrador Current, principally in the vicinity of the Grand Banks, there is little mixing of the waters. Instead, the junction is marked by a sharp change in temperature. The line or surface along which this occurs is called the cold wall. When the warm Gulf Stream water encounters cold air, evaporation is so rapid that the rising vapor may be visible as frost smoke. Investigations have shown that the current itself is much narrower and faster than previously supposed, and considerably more variable in its position and speed. The maximum current off Florida ranges from about 2 to 4 knots. Northward, the speed is generally less, and it decreases further after the current passes Cape Hatteras. As the stream meanders and shifts position, eddies sometimes break off and continue as separate, circular flows until they dissipate. Boats in the Newport-Bermuda sailing yacht race have been known to be within sight of each other and be carried in opposite directions by different parts of the same current. This race is generally won by the boat which catches an eddy just right. As the current shifts position, its extent does not always coincide with the area of warm, blue water. When the sea is relatively smooth, the edges of the current are marked by ripples. A recirculation region exists adjacent to and southeast of the Gulf Stream. The flow of water in the recirculation region is opposite to that in the Gulf Stream and surface currents are much weaker, generally less than half a knot. As the Gulf Stream continues eastward and northeastward beyond the Grand Banks, it gradually widens and decreases speed until it becomes a vast, slowmoving current known as the North Atlantic Current, in the general vicinity of the prevailing westerlies. In the eastern part of the Atlantic it divides into the Northeast Drift Current and the Southeast Drift Current. The Northeast Drift Current continues in a generally northeasterly direction toward the Norwegian Sea. As it does so, it continues to widen and decrease speed. South of Iceland it branches to form the Irminger Current and the Norway Current. The Irminger Current curves toward the north and northwest to join the East Greenland Current southwest of Iceland. The Norway Current continues in a northeasterly direction along the coast of Norway. Part of it, the North Cape Current, rounds North Cape into the Barents Sea. The other part curves toward the north and becomes known as the Spitsbergen Current. Before reaching Svalbard (Spitsbergen), it curves toward the west and joins the cold East Greenland Current flowing southward in the Greenland Sea. As this current flows past Iceland, it is further augmented by the Irminger Current. Off Kap Farvel, at the southern tip of Greenland, the East Greenland Current curves sharply to the northwest following the coastline. As it does so, it becomes known as the West Greenland Current, and its character changes from that of an intense western boundary current to a weaker eastern boundary current. This current continues along the west coast of Greenland, through Davis Strait, and into Baffin Bay. In Baffin Bay the West Greenland Current generally follows the coast, curving westward off Kap York to form the southerly flowing Labrador Current. This cold current flows southward off the coast of Baffin Island, through Davis Strait, along the coast of Labrador and Newfoundland, to the Grand Banks, carrying with it large

5 436 OCEAN CURRENTS quantities of ice. Here it encounters the warm water of the Gulf Stream, creating the cold wall. Some of the cold water flows southward along the east coast of North America, inshore of the Gulf Stream, as far as Cape Hatteras. The remainder curves toward the east and flows along the northern edge of the North Atlantic and Northeast Drift Currents, gradually merging with them. The Southeast Drift Current curves toward the east, southeast, and then south as it is deflected by the coast of Europe. It flows past the Bay of Biscay, toward southeastern Europe and the Canary Islands, where it continues as the Canary Current. In the vicinity of the Cape Verde Islands, this current divides, part of it curving toward the west to help form the North Equatorial Current, and part of it curving toward the east to follow the coast of Africa into the Gulf of Guinea, where it is known as the Guinea Current. This current is augmented by the North Equatorial Countercurrent and, in summer, it is strengthened by monsoon winds. It flows in close proximity to the South Equatorial Current, but in the opposite direction. As it curves toward the south, still following the African coast, it merges with the South Equatorial Current. The clockwise circulation of the North Atlantic leaves a large central area between the recirculation region and the Canary Current which has no well-defined currents. This area is known as the Sargasso Sea, from the large quantities of sargasso or gulfweed encountered there. That branch of the South Equatorial Current which curves toward the south off the east coast of South America, follows the coast as the warm, highly-saline Brazil Current, which in some respects resembles a weak Gulf Stream. Off Uruguay it encounters the colder, less-salty Falkland or Malvinas Current forming a sharp meandering front in which eddies may form. The two currents curve toward the east to form the broad, slowmoving, South Atlantic Current in the general vicinity of the prevailing westerlies and the front dissipates somewhat. This current flows eastward to a point west of the Cape of Good Hope, where it curves northward to follow the west coast of Africa as the strong Benguela Current, augmented somewhat by part of the Agulhas Current flowing around the southern part of Africa from the Indian Ocean. As it continues northward, the current gradually widens and slows. At a point east of St. Helena Island it curves westward to continue as part of the South Equatorial Current, thus completing the counterclockwise circulation of the South Atlantic. The Benguela Current is also augmented somewhat by the West Wind Drift, a current which flows easterly around Antarctica. As the West Wind Drift flows past Cape Horn, that part in the immediate vicinity of the cape is called the Cape Horn Current. This current rounds the cape and flows in a northerly and northeasterly direction along the coast of South America as the Falkland or Malvinas Current Pacific Ocean Currents Pacific Ocean currents follow the general pattern of those in the Atlantic. The North Equatorial Current flows westward in the general area of the northeast trades, and the South Equatorial Current follows a similar path in the region of the southeast trades. Between these two, the weaker North Equatorial Countercurrent sets toward the east, just north of the equator. After passing the Mariana Islands, the major part of the North Equatorial Current curves somewhat toward the northwest, past the Philippines and Taiwan. Here it is deflected further toward the north, where it becomes known as the Kuroshio, and then toward the northeast past the Nansei Shoto and Japan, and on in a more easterly direction. Part of the Kuroshio, called the Tsushima Current, flows through Tsushima Strait, between Japan and Korea, and the Sea of Japan, following generally the northwest coast of Japan. North of Japan it curves eastward and then southeastward to rejoin the main part of the Kuroshio. The limits and volume of the Kuroshio are influenced by the monsoons, being augmented during the season of southwesterly winds, and diminished when the northeasterly winds are prevalent. The Kuroshio (Japanese for Black Stream ) is so named because of the dark color of its water. It is sometimes called the Japan Current. In many respects it is similar to the Gulf Stream of the Atlantic. Like that current, it carries large quantities of warm tropical water to higher latitudes, and then curves toward the east as a major part of the general clockwise circulation in the Northern Hemisphere. As it does so, it widens and slows, continuing on between the Aleutians and the Hawaiian Islands, where it becomes known as the North Pacific Current. As this current approaches the North American continent, most of it is deflected toward the right to form a clockwise circulation between the west coast of North America and the Hawaiian Islands called the California Current. This part of the current has become so broad that the circulation is generally weak. Near the coast, the southeastward flow intensifies and average speeds are about 0.8 knot. But the flow pattern is complex, with offshore directed jets often found near more prominent capes, and poleward flow often found over the upper slope and outer continental shelf. It is strongest near land. Near the southern end of Baja California, this current curves sharply to the west and broadens to form the major portion of the North Equatorial Current. During the winter, a weak countercurrent flows northwestward, inshore of the southeastward flowing California Current, along the west coast of North America from Baja California to Vancouver Island. This is called the Davidson Current. Off the west coast of Mexico, south of Baja California the current flows southeastward during the winter as a continuation of part of the California Current. During the

6 OCEAN CURRENTS 437 summer, the current in this area is northwestward as a continuation of the North Equatorial Countercurrent. As in the Atlantic, there is in the Pacific a counterclockwise circulation to the north of the clockwise circulation. Cold water flowing southward through the western part of Bering Strait between Alaska and Siberia, is joined by water circulating counterclockwise in the Bering Sea to form the Oyashio. As the current leaves the strait, it curves toward the right and flows southwesterly along the coast of Siberia and the Kuril Islands. This current brings quantities of sea ice, but no icebergs. When it encounters the Kuroshio, the Oyashio curves southward and then eastward, the greater portion joining the Kuroshio and North Pacific Current. The northern branch of the North Pacific Current curves in a counterclockwise direction to form the Alaska Current, which generally follows the coast of Canada and Alaska. When the Alaska Current turns to the southwest and flows along the Kodiak Island and the Alaska Peninsula, its character changes to that of a western boundary current and it is called the Alaska Stream. When this westward flow arrives off the Aleutian Islands, it is less intense and becomes known as the Aleutian Current. Part of it flows along the southern side of these islands to about the 180th meridian, where it curves in a counterclockwise direction and becomes an easterly flowing current, being augmented by the northern part of the Oyashio. The other part of the Aleutian Current flows through various openings between the Aleutian Islands, into the Bering Sea. Here it flows in a general counterclockwise direction. The southward flow along the Kamchatka peninsula is called the Kamchatka Current which feeds the southerly flowing Oyashio. Some water flows northward from the Bering Sea through the eastern side of the Bering Strait, into the Arctic Ocean. The South Equatorial Current, extending in width between about 4 N latitude and 10 S, flows westward from South America to the western Pacific. After this current crosses the 180th meridian, the major part curves in a counterclockwise direction, entering the Coral Sea, and then curving more sharply toward the south along the east coast of Australia, where it is known as the East Australian Current. The East Australian Current is the weakest of the subtropical western boundary currents and separates from the Australian coast near 34 S. The path of the current from Australia to New Zealand is known as the Tasman Front, which marks the boundary between the warm water of the Coral Sea and the colder water of the Tasman Sea. The continuation of the East Australian Current east of New Zealand is the East Auckland Current. The East Auckland Current varies seasonally: in winter, it separates from the shelf and flows eastward, merging with the West Wind Drift, while in winter it follows the New Zealand shelf southward as the East Cape Current until it reaches Chatham Rise where it turns eastward, thence merging with the West Wind Drift. Near the southern extremity of South America, most of this current flows eastward into the Atlantic, but part of it curves toward the left and flows generally northward along the west coast of South America as the Peru Current or Humboldt Current. Occasionally a set directly toward land is encountered. At about Cabo Blanco, where the coast falls away to the right, the current curves toward the left, past the Galapagos Islands, where it takes a westerly set and constitutes the major portion of the South Equatorial Current, thus completing the counterclockwise circulation of the South Pacific. During the northern hemisphere summer, a weak northern branch of the South Equatorial Current, known as the New Guinea Coastal Current, continues on toward the west and northwest along both the southern and northeastern coasts of New Guinea. The southern part flows through Torres Strait, between New Guinea and Australia, into the Arafura Sea. Here, it gradually loses its identity, part of it flowing on toward the west as part of the South Equatorial Current of the Indian Ocean, and part of it following the coast of Australia and finally joining the easterly flowing West Wind Drift. The northern part of New Guinea Coastal Current both curves in a clockwise direction to help form the Pacific Equatorial Countercurrent and off Mindanao turns southward to form a southward flowing boundary current called the Mindanao Current. During the northern hemisphere winter, the New Guinea Coastal Current may reverse direction for a few months Indian Ocean Currents Indian Ocean currents follow generally the pattern of the Atlantic and Pacific but with differences caused principally by the monsoons, the more limited extent of water in the Northern Hemisphere, and by limited communication with the Pacific Ocean along the eastern boundary. During the northern hemisphere winter, the North Equatorial Current and South Equatorial Current flow toward the west, with the weaker, eastward Equatorial Countercurrent flowing between them, as in the Atlantic and Pacific (but somewhat south of the equator). But during the northern hemisphere summer, both the North Equatorial Current and the Equatorial Countercurrent are replaced by the Southwest Monsoon Current, which flows eastward and southeastward across the Arabian Sea and the Bay of Bengal. Near Sumatra, this current curves in a clockwise direction and flows westward, augmenting the South Equatorial Current, and setting up a clockwise circulation in the northern part of the Indian Ocean. Off the coast of Somalia, the Somali Current reverses direction during the northern hemisphere summer with northward currents reaching speeds of 5 knots or more. Twice a year, around May and November, westerly winds along the equator result in an eastward Equatorial Jet which feeds warm water towards Sumatra. As the South Equatorial Current approaches the coast of Africa, it curves toward the southwest, part of it flowing

7 438 OCEAN CURRENTS through the Mozambique Channel between Madagascar and the mainland, and part flowing along the east coast of Madagascar. At the southern end of this island the two join to form the strong Agulhas Current, which is analogous to the Gulf Stream. This current, when opposed by strong winds from Southern Ocean storms, creates dangerously large seas. South of South Africa, the Agulhas Current retroflects, and most of the flow curves sharply southward and then eastward to join the West Wind Drift; this junction is often marked by a broken and confused sea, made much worse by westerly storms. A small part of the Agulhas Current rounds the southern end of Africa and helps form the Benguela Current; occasionally, strong eddies are formed in the retroflection region and these too move into the Southeastern Atlantic. The eastern boundary currents in the Indian Ocean are quite different from those found in the Atlantic and Pacific. The seasonally reversing South Java Current has strongest westward flow during August when monsoon winds are easterly and the Equatorial jet is inactive. Along the coast of Australia, a vigorous poleward flow, the Leeuwin Current, runs against the prevailing winds Arctic Currents The waters of the North Atlantic enter the Arctic Ocean between Norway and Svalbard. The currents flow easterly, north of Siberia, to the region of the Novosibirskiye Ostrova, where they turn northerly across the North Pole, and continue down the Greenland coast to form the East Greenland Current. On the American side of the Arctic basin, there is a weak, continuous clockwise flow centered in the vicinity of 80 N, 150 W. A current north through Bering Strait along the American coast is balanced by an outward southerly flow along the Siberian coast, which eventually becomes part of the Kamchatka Current. Each of the main islands or island groups in the Arctic, as far as is known, seems to have a clockwise nearshore circulation around it. The Barents Sea, Kara Sea, and Laptev Sea each have a weak counterclockwise circulation. A similar but weaker counterclockwise current system appears to exist in the East Siberian Sea. OCEANIC CURRENT PHENOMENA Ocean Eddies and Rings Eddies with horizontal diameters varying from km have their own pattern of surface currents. These features may have either a warm or a cold core and currents flow around this core, either cyclonically for cold cores or anticyclonically for warm cores. The most intense of these features are called rings and are formed by the pinching off of meanders of western boundary currents such as the Gulf Stream. Maximum speed associated with these features is about 2 knots. Rings have also been observed to pinch off from the Agulhas retroflexion and to then drift to the northwest into the South Atlantic. Similarly, strong anticyclonic eddies are occasionally spawned by the loop current into the Western Gulf Mexico. In general, mesoscale variability is strongest in the region of western boundary currents and in the Circumpolar Current. The strength of mesoscale eddies is greatly reduced at distances of km from these strong boundary currents, because mean currents are generally weaker in these regions. The eddies may be sufficiently strong to reverse the direction of the surface currents Undercurrents At the equator and along some ocean boundaries, shallow undercurrents exist, flowing in a direction counter to that at the surface. These currents may affect the operation of submarines or trawlers. The most intense of these flows, called the Pacific Equatorial Undercurrent, is found at the equator in the Pacific. It is centered at a depth of 150m to the west of the Galapagos, is about 4 km wide, and eastward speeds of up to 1.5 m/s have been observed. Equatorial Undercurrents are also observed in the Atlantic and Indian Ocean, but they are somewhat weaker. In the Atlantic, the Equatorial Undercurrent is found to the east of 24 W and in the Indian Ocean, it appears to be seasonal. Undercurrents also exist along ocean boundaries. They seem to be most ubiquitous at the eastern boundary of oceans. Here they are found at depths of m, may be 100 km wide, and have maximum speeds of 0.5 m/s Ocean Currents and Climate Many of the ocean currents exert a marked influence upon the climate of the coastal regions along which they flow. Thus, warm water from the Gulf Stream, continuing as the North Atlantic, Northeast Drift, and Irminger Currents, arrives off the southwest coast of Iceland, warming it to the extent that Reykjavik has a higher average winter temperature than New York City, far to the south. Great Britain and Labrador are about the same latitude, but the climate of Great Britain is much milder because of the relatively warm currents. The west coast of the United States is cooled in the summer by the California Current, and warmed in the winter by the Davidson Current. Partly as a result of this circulation, the range of monthly average temperature is comparatively small. Currents exercise other influences besides those on temperature. The pressure pattern is affected materially, as air over a cold current contracts as it is cooled, and that over a warm current expands. As air cools above a cold ocean

8 OCEAN CURRENTS 439 current, fog is likely to form. Frost smoke occurs over a warm current which flows into a colder region. Evaporation is greater from warm water than from cold water, adding to atmospheric moisture Ocean Current Observations Historically, our views of the surface circulation of the ocean have been shaped by reports of ocean currents provided by mariners. As mentioned at the start of this chapter, these observations consist of reports of the difference between the dead reckoning and the observed position of the vessel. These observations were routinely collected until the start of World War II. Today, two observation systems are generally used for surface current studies. The first utilizes autonomous freedrifting buoys which are tracked by satellite or relay their position via satellite. These buoys consist of either a spherical or cylindrical surface float which is about 0.5m in diameter with a drogue at a depth of about 35m. The second system utilizes acoustic Doppler current profilers. These profilers utilize hull mounted transducers, operate at a frequency of 150 khz, and have pulse repetition rates of about 1 second. They can penetrate to about 300m, and, where water is shallower than this depth, track the bottom. Merchant and naval vessels are increasingly being outfitted with acoustic Doppler current profilers which, when operated with the Global Positioning System, provide accurate observations of currents.

9 440 OCEAN CURRENTS

Chapter Overview. Seasons. Earth s Seasons. Distribution of Solar Energy. Solar Energy on Earth. CHAPTER 6 Air-Sea Interaction
 Chapter Overview CHAPTER 6 Air-Sea Interaction The atmosphere and the ocean are one independent system. Earth has seasons because of the tilt on its axis. There are three major wind belts in each hemisphere.
Hurricanes. Characteristics of a Hurricane
 Hurricanes Readings: A&B Ch. 12 Topics 1. Characteristics 2. Location 3. Structure 4. Development a. Tropical Disturbance b. Tropical Depression c. Tropical Storm d. Hurricane e. Influences f. Path g.
Geography affects climate.
 KEY CONCEPT Climate is a long-term weather pattern. BEFORE, you learned The Sun s energy heats Earth s surface unevenly The atmosphere s temperature changes with altitude Oceans affect wind flow NOW, you
How Do Oceans Affect Weather and Climate?
 How Do Oceans Affect Weather and Climate? In Learning Set 2, you explored how water heats up more slowly than land and also cools off more slowly than land. Weather is caused by events in the atmosphere.
2. The map below shows high-pressure and low-pressure weather systems in the United States.
 1. Which weather instrument has most improved the accuracy of weather forecasts over the past 40 years? 1) thermometer 3) weather satellite 2) sling psychrometer 4) weather balloon 6. Wind velocity is
Name Period 4 th Six Weeks Notes 2015 Weather
 Name Period 4 th Six Weeks Notes 2015 Weather Radiation Convection Currents Winds Jet Streams Energy from the Sun reaches Earth as electromagnetic waves This energy fuels all life on Earth including the
How to analyze synoptic-scale weather patterns Table of Contents
 How to analyze synoptic-scale weather patterns Table of Contents Before You Begin... 2 1. Identify H and L pressure systems... 3 2. Locate fronts and determine frontal activity... 5 3. Determine surface
1) Summary of work performed and progress made during preceding month
 Summary of work performed and progress made during preceding month") Mapping and Characterization of Recurring Spring Leads and Landfast Ice in the Chukchi and Beaufort Seas, Coastal Marine Institute Project (NOFA MMS09HQPA0004T) Monthly progress report, June 2010 1) Summary
Mapping and Characterization of Recurring Spring Leads and Landfast Ice in the Chukchi and Beaufort Seas, Coastal Marine Institute Project (NOFA MMS09HQPA0004T) Monthly progress report, June 2010 1) Summary
The Oceans Role in Climate
 The Oceans Role in Climate Martin H. Visbeck A Numerical Portrait of the Oceans The oceans of the world cover nearly seventy percent of its surface. The largest is the Pacific, which contains fifty percent
Regents Questions: Plate Tectonics
 Earth Science Regents Questions: Plate Tectonics Name: Date: Period: August 2013 Due Date: 17 Compared to the oceanic crust, the continental crust is (1) less dense and more basaltic (3) more dense and
8.5 Comparing Canadian Climates (Lab)
") These 3 climate graphs and tables of data show average temperatures and precipitation for each month in Victoria, Winnipeg and Whitehorse: Figure 1.1 Month J F M A M J J A S O N D Year Precipitation 139
These 3 climate graphs and tables of data show average temperatures and precipitation for each month in Victoria, Winnipeg and Whitehorse: Figure 1.1 Month J F M A M J J A S O N D Year Precipitation 139
Dynamics IV: Geostrophy SIO 210 Fall, 2014
 Dynamics IV: Geostrophy SIO 210 Fall, 2014 Geostrophic balance Thermal wind Dynamic height READING: DPO: Chapter (S)7.6.1 to (S)7.6.3 Stewart chapter 10.3, 10.5, 10.6 (other sections are useful for those
What Causes Climate? Use Target Reading Skills
 Climate and Climate Change Name Date Class Climate and Climate Change Guided Reading and Study What Causes Climate? This section describes factors that determine climate, or the average weather conditions
ES 106 Laboratory # 3 INTRODUCTION TO OCEANOGRAPHY. Introduction The global ocean covers nearly 75% of Earth s surface and plays a vital role in
 ES 106 Laboratory # 3 INTRODUCTION TO OCEANOGRAPHY 3-1 Introduction The global ocean covers nearly 75% of Earth s surface and plays a vital role in the physical environment of Earth. For these reasons,
ATMS 310 Jet Streams
 ATMS 310 Jet Streams Jet Streams A jet stream is an intense (30+ m/s in upper troposphere, 15+ m/s lower troposphere), narrow (width at least ½ order magnitude less than the length) horizontal current
Week 1. Week 2. Week 3
 Week 1 1. What US city has the largest population? 2. Where is Aachen? 3. What is the capitol of Florida? 4. What is the longest mountain range in Spain? 5. What countries border Equador? Week 2 1. What
SOUTHERN OCEAN CURRENTS. http://www.polar.org/antsun/oldissues2002-2003/sun121502/current.html
 Map from: SOUTHERN OCEAN CURRENTS http://www.polar.org/antsun/oldissues2002-2003/sun121502/current.html FROM: The Antarctic Coastal Current Joanna Gyory, John Cangialosi, Ieng Jo, Arthur J. Mariano, Edward
Intra-seasonal and Annual variability of the Agulhas Current from satellite observations
 Intra-seasonal and Annual variability of the Agulhas Current from satellite observations Marjolaine Krug Ecosystem Earth Observation (CSIR NRE) Pierrick Penven Laboratoire de Physique des Océans (IRD)
Southern AER Atmospheric Education Resource
 Southern AER Atmospheric Education Resource Vol. 9 No. 5 Spring 2003 Editor: Lauren Bell In this issue: g Climate Creations exploring mother nature s remote control for weather and Climate. g Crazy Climate
Module 11: The Cruise Ship Sector. Destination #3
 Module 11: The Cruise Ship Sector Destination #3 Cruise Destinations Welcome to your third destination. Use the following resource article to learn about the different oceans and time zones. Seen from
Lecture 4: Pressure and Wind
 Lecture 4: Pressure and Wind Pressure, Measurement, Distribution Forces Affect Wind Geostrophic Balance Winds in Upper Atmosphere Near-Surface Winds Hydrostatic Balance (why the sky isn t falling!) Thermal
Exploring Florida: Teaching Resources for Science 1 of 6
 Exploring Florida: Teaching Resources for Science 1 of 6 Tropical Cyclones This document describes tropical cyclones and the dangers they pose to coastal populations. It is intended to help teachers improve
Basics of weather interpretation
 Basics of weather interpretation Safety at Sea Seminar, April 2 nd 2016 Dr. Gina Henderson Oceanography Dept., USNA ghenders@usna.edu Image source: http://earthobservatory.nasa.gov/naturalhazards/view.php?id=80399,
NEAR-SHORE CIRCULATION IN THE CALIFORNIA CURRENT
 Calif. Mar. Res. Comm., CalCOFZ Rept., 16 : 5i65, 1972 NEARSHORE CRCULATON N THE CALFORNA CURRENT RCHARD A. SCHWARTZLOSE and JOSEPH 1. RED Scripps nstitution of Oceanography La Jolla, California A great
The concepts developed in this standard include the following: Oceans cover about 70% of the surface of the Earth.
 Name Date Grade 5 SOL 5.6 Review Oceans Made by SOLpass - www.solpass.org solpass100@comcast.net Reproduction is permitted for SOLpass subscribers only. The concepts developed in this standard include
TIDES. 1. Tides are the regular rise and fall of sea level that occurs either once a day (every 24.8 hours) or twice a day (every 12.4 hours).
 or twice a day (every 12.4 hours).") TIDES What causes tides? How are tides predicted? 1. Tides are the regular rise and fall of sea level that occurs either once a day (every 24.8 hours) or twice a day (every 12.4 hours). Tides are waves
TIDES What causes tides? How are tides predicted? 1. Tides are the regular rise and fall of sea level that occurs either once a day (every 24.8 hours) or twice a day (every 12.4 hours). Tides are waves
Chapter 15. Hydrology of the Atlantic Ocean
 Chapter 15 Hydrology of the Atlantic Ocean The hydrology of the Atlantic Ocean basins is deeply affected by the formation and recirculation of North Atlantic Deep Water, which was discussed in Chapter
Quadrant 1 Sea Breeze: Routing Considerations Table of Contents
 Quadrant 1 Sea Breeze: Routing Considerations Table of Contents Introduction Quadrant 1 Sea Breeze Description 2 3 Introduction Four Sea Breeze Quadrants (Figure 1) When considering a sea breeze and its
Georgia Performance Standards Framework for Natural Disasters 6 th Grade
 The following instructional plan is part of a GaDOE collection of Unit Frameworks, Performance Tasks, examples of Student Work, and Teacher Commentary. Many more GaDOE approved instructional plans are
WEATHER AND CLIMATE practice test
 WEATHER AND CLIMATE practice test Multiple Choice Identify the choice that best completes the statement or answers the question. 1. What role does runoff play in the water cycle? a. It is the process in
Water & Climate Review
 Water & Climate Review 1. The cross section below shows the direction of air flowing over a mountain. Points A and B are at the same elevation on opposite sides of the mountain. 4. The graph below shows
Thompson/Ocean 420/Winter 2005 Tide Dynamics 1
 Thompson/Ocean 420/Winter 2005 Tide Dynamics 1 Tide Dynamics Dynamic Theory of Tides. In the equilibrium theory of tides, we assumed that the shape of the sea surface was always in equilibrium with the
CGC1D1: Interactions in the Physical Environment Factors that Affect Climate
 Name: Date: Day/Period: CGC1D1: Interactions in the Physical Environment Factors that Affect Climate Chapter 12 in the Making Connections textbook deals with Climate Connections. Use pages 127-144 to fill
Step 2: Learn where the nearest divergent boundaries are located.
 What happens when plates diverge? Plates spread apart, or diverge, from each other at divergent boundaries. At these boundaries new ocean crust is added to the Earth s surface and ocean basins are created.
Present Status of Coastal Environmental Monitoring in Korean Waters. Using Remote Sensing Data
 Present Status of Coastal Environmental Monitoring in Korean Waters Using Remote Sensing Data Sang-Woo Kim, Young-Sang Suh National Fisheries Research & Development Institute #408-1, Shirang-ri, Gijang-up,
1. The diagram below shows a cross section of sedimentary rock layers.
 1. The diagram below shows a cross section of sedimentary rock layers. Which statement about the deposition of the sediments best explains why these layers have the curved shape shown? 1) Sediments were
SIXTH GRADE WEATHER 1 WEEK LESSON PLANS AND ACTIVITIES
 SIXTH GRADE WEATHER 1 WEEK LESSON PLANS AND ACTIVITIES WATER CYCLE OVERVIEW OF SIXTH GRADE WATER WEEK 1. PRE: Evaluating components of the water cycle. LAB: Experimenting with porosity and permeability.
Tropical Cyclone Climatology
 Tropical Cyclone Climatology Introduction In this section, we open our study of tropical cyclones, one of the most recognizable (and impactful) weather features of the tropics. We begin with an overview
ENVIRONMENTAL STRUCTURE AND FUNCTION: CLIMATE SYSTEM Vol. II - Low-Latitude Climate Zones and Climate Types - E.I. Khlebnikova
 LOW-LATITUDE CLIMATE ZONES AND CLIMATE TYPES E.I. Khlebnikova Main Geophysical Observatory, St. Petersburg, Russia Keywords: equatorial continental climate, ITCZ, subequatorial continental (equatorial
Continents join together and split apart.
 KEY CONCEPT Continents change position over time. BEFORE, you learned Earth s main layers are the core, the mantle, and the crust The lithosphere and asthenosphere are the topmost layers of Earth The lithosphere
Mid latitude Cyclonic Storm System. 08 _15 ab. jpg
 Mid latitude Cyclonic Storm System 08 _15 ab. jpg Mid Latitude Cyclone Storm System (MLCSS) It has several names. Cyclone, Cyclonic Storm, Cyclonic System, Depression. Cyclonic Storms are the weather maker
Air Masses and Fronts
 Air Masses and Fronts Air Masses The weather of the United States east of the Rocky Mountains is dominated by large masses of air that travel south from the wide expanses of land in Canada, and north from
Lab Activity on Global Wind Patterns
 Lab Activity on Global Wind Patterns 2002 Ann Bykerk-Kauffman, Dept. of Geological and Environmental Sciences, California State University, Chico * Objectives When you have completed this lab you should
Chapter 3: Weather Map. Weather Maps. The Station Model. Weather Map on 7/7/2005 4/29/2011
 Chapter 3: Weather Map Weather Maps Many variables are needed to described weather conditions. Local weathers are affected by weather pattern. We need to see all the numbers describing weathers at many
Analyze Weather in Cold Regions and Mountainous Terrain
 Analyze Weather in Cold Regions and Mountainous Terrain Terminal Learning Objective Action: Analyze weather of cold regions and mountainous terrain Condition: Given a training mission that involves a specified
Ocean Floor Continental Slope Begins at the Continental Shelf Very sharp drop to depths over 2 miles Covered with thick layers of sand, mud, and rocks
 Ocean Floor Continental Shelf Begins at the shoreline Gently slopes underwater Average depth of 430 feet Thick layers of sand, mud, and rocks The beach is part of the Continental Shelf Ocean Floor Continental
Chapter Overview. Bathymetry. Measuring Bathymetry. Echo Sounding Record. Measuring Bathymetry. CHAPTER 3 Marine Provinces
 Chapter Overview CHAPTER 3 Marine Provinces The study of bathymetry charts ocean depths and ocean floor topography. Echo sounding and satellites are efficient bathymetric tools. Most ocean floor features
How Did These Ocean Features and Continental Margins Form?
 298 10.14 INVESTIGATION How Did These Ocean Features and Continental Margins Form? The terrain below contains various features on the seafloor, as well as parts of three continents. Some general observations
6. Base your answer to the following question on the graph below, which shows the average monthly temperature of two cities A and B.
 1. Which single factor generally has the greatest effect on the climate of an area on the Earth's surface? 1) the distance from the Equator 2) the extent of vegetative cover 3) the degrees of longitude
Storm tide is the water level rise during a storm due to the combination of storm surge and the astronomical tide.
 INTRODUCTION TO STORM SURGE Introduction to Storm Surge BOLIVAR PENINSULA IN TEXAS AFTER HURRICANE IKE (2008) What is Storm Surge? Inland Extent Storm surge can penetrate well inland from the coastline.
Near Real Time Blended Surface Winds
 Near Real Time Blended Surface Winds I. Summary To enhance the spatial and temporal resolutions of surface wind, the remotely sensed retrievals are blended to the operational ECMWF wind analyses over the
Tectonic plates push together at convergent boundaries.
 KEY CONCEPT Plates converge or scrape past each other. BEFORE, you learned Plates move apart at divergent boundaries In the oceans, divergent boundaries mark where the sea floor spreads apart On land,
Seasonal & Daily Temperatures. Seasons & Sun's Distance. Solstice & Equinox. Seasons & Solar Intensity
 Seasonal & Daily Temperatures Seasons & Sun's Distance The role of Earth's tilt, revolution, & rotation in causing spatial, seasonal, & daily temperature variations Please read Chapter 3 in Ahrens Figure
Real-time Ocean Forecasting Needs at NCEP National Weather Service
 Real-time Ocean Forecasting Needs at NCEP National Weather Service D.B. Rao NCEP Environmental Modeling Center December, 2005 HYCOM Annual Meeting, Miami, FL COMMERCE ENVIRONMENT STATE/LOCAL PLANNING HEALTH
FOURTH GRADE WEATHER
 FOURTH GRADE WEATHER 1 WEEK LESSON PLANS AND ACTIVITIES WATER CYCLE OVERVIEW OF FOURTH GRADE WATER WEEK 1. PRE: Comparing different reservoirs of water. LAB: Experimenting with surface tension and capillary
Storm tide is the water level rise during a storm due to the combination of storm surge and the astronomical tide.
 INTRODUCTION TO STORM SURGE Introduction to Storm Surge National Hurricane Center Storm Surge Unit BOLIVAR PENINSULA IN TEXAS AFTER HURRICANE IKE (2008) What is Storm Surge? Inland Extent Storm surge can
SECOND GRADE PLATE TECTONICS 1 WEEK LESSON PLANS AND ACTIVITIES
 SECOND GRADE PLATE TECTONICS 1 WEEK LESSON PLANS AND ACTIVITIES PLATE TECTONIC CYCLE OVERVIEW OF SECOND GRADE VOLCANOES WEEK 1. PRE: Investigating the parts of a volcano. LAB: Comparing the parts of a
TECTONICS ASSESSMENT
 Tectonics Assessment / 1 TECTONICS ASSESSMENT 1. Movement along plate boundaries produces A. tides. B. fronts. C. hurricanes. D. earthquakes. 2. Which of the following is TRUE about the movement of continents?
A Few Facts about Antarctica
 A Few Facts about Antarctica Antarctica is the continent that surrounds the South Pole, the southernmost point at the bottom of the earth. Antarctica is a continent because it is land that is covered by
ES Chapter 10 Review. Name: Class: Date: Multiple Choice Identify the choice that best completes the statement or answers the question.
 Name: Class: Date: ES Chapter 10 Review Multiple Choice Identify the choice that best completes the statement or answers the question. 1. Scientists used the pattern of alternating normal and reversed
Ocean in Motion 2: What Causes Ocean Currents and How Do We Measure Them?
 Ocean in Motion 2: What Causes Ocean Currents and How Do We Measure Them? A. Overview 1. The Ocean in Motion -- Circulation In this program, students will learn about the driving forces responsible for
6. The greatest atmospheric pressure occurs in the 1) troposphere 3) mesosphere 2) stratosphere 4) thermosphere
 troposphere 3) mesosphere 2) stratosphere 4) thermosphere") 1. The best evidence of the Earth's nearly spherical shape is obtained through telescopic observations of other planets photographs of the Earth from an orbiting satellite observations of the Sun's altitude
1. The best evidence of the Earth's nearly spherical shape is obtained through telescopic observations of other planets photographs of the Earth from an orbiting satellite observations of the Sun's altitude
An Introduction to Coordinate Systems in South Africa
 An Introduction to Coordinate Systems in South Africa Centuries ago people believed that the earth was flat and notwithstanding that if this had been true it would have produced serious problems for mariners
Tectonic plates have different boundaries.
 KEY CONCEPT Plates move apart. BEFORE, you learned The continents join and break apart The sea floor provides evidence that tectonic plates move The theory of plate tectonics helps explain how the plates
ebb current, the velocity alternately increasing and decreasing without coming to
 Slack water (slack tide): The state of a tidal current when its velocity is near zero, especially the moment when a reversing current changes its direction and its velocity is zero. The term is also applied
World Ocean Atlas (WOA) Product Documentation
 Product Documentation") World Ocean Atlas (WOA) Product Documentation This document describes WOA statistical and objectively analyzed field files. This description includes the types of statistical fields available, for which
World Ocean Atlas (WOA) Product Documentation This document describes WOA statistical and objectively analyzed field files. This description includes the types of statistical fields available, for which
Storms Short Study Guide
 Name: Class: Date: Storms Short Study Guide Multiple Choice Identify the letter of the choice that best completes the statement or answers the question. 1. A(n) thunderstorm forms because of unequal heating
Earth In Space Chapter 3
 Earth In Space Chapter 3 Shape of the Earth Ancient Greeks Earth casts a circular shadow on the moon during a lunar eclipse Shape of the Earth Ancient Greeks Ships were observed to disappear below the
Chapter 3: Weather Map. Station Model and Weather Maps Pressure as a Vertical Coordinate Constant Pressure Maps Cross Sections
 Chapter 3: Weather Map Station Model and Weather Maps Pressure as a Vertical Coordinate Constant Pressure Maps Cross Sections Weather Maps Many variables are needed to described dweather conditions. Local
Chapter 8. The Pacific Ocean
 Chapter 8 The Pacific Ocean After these two lengthy excursions into polar oceanography we are now ready to test our understanding of ocean dynamics by looking at one of the three major ocean basins. The
Tides and Water Levels
 Tides and Water Levels What are Tides? Tides are one of the most reliable phenomena in the world. As the sun rises in the east and the stars come out at night, we are confident that the ocean waters will
6 th Grade Science Assessment: Weather & Water Select the best answer on the answer sheet. Please do not make any marks on this test.
 Select the be answer on the answer sheet. Please do not make any marks on this te. 1. Weather is be defined as the A. changes that occur in cloud formations from day to day. B. amount of rain or snow that
Indian Ocean and Monsoon
 Indo-French Workshop on Atmospheric Sciences 3-5 October 2013, New Delhi (Organised by MoES and CEFIPRA) Indian Ocean and Monsoon Satheesh C. Shenoi Indian National Center for Ocean Information Services
Meteorology: Weather and Climate
 Meteorology: Weather and Climate Large Scale Weather Systems Lecture 1 Tropical Cyclones: Location and Structure Prof. Roy Thompson Crew building Large-scale Weather Systems Tropical cyclones (1-2) Location,
Storm Surge: A Rising Danger by Andrew M. Dzambo
 Storm Surge: A Rising Danger by Andrew M. Dzambo Citizens of the United States are migrating towards the nation s coasts; according to the U.S. Census Bureau, the U.S. coastal watershed county population
ENSO Cycle: Recent Evolution, Current Status and Predictions. Update prepared by Climate Prediction Center / NCEP 9 May 2011
 ENSO Cycle: Recent Evolution, Current Status and Predictions Update prepared by Climate Prediction Center / NCEP 9 May 2011 Outline Overview Recent Evolution and Current Conditions Oceanic Niño Index (ONI)
Chapter 4 Atmospheric Pressure and Wind
 Chapter 4 Atmospheric Pressure and Wind Understanding Weather and Climate Aguado and Burt Pressure Pressure amount of force exerted per unit of surface area. Pressure always decreases vertically with height
COASTAL DAMAGE INSPECTION SOUTHWEST VITI LEVU, FIJI AFTER CYCLONE SINA
 COASTAL DAMAGE INSPECTION SOUTHWEST VITI LEVU, FIJI AFTER CYCLONE SINA Brendan J. Holden SOPAC Technical Secretariat July 1992 SOPAC Technical Report 148 Prepared for: South Pacific Applied Geoscience
The Atmosphere and Winds
 Oceanography 10, T. James Noyes, El Camino College 8A-1 The Atmosphere and Winds We need to learn about the atmosphere, because the ocean and atmosphere are tightly interconnected with one another: you
Queensland rainfall past, present and future
 Queensland rainfall past, present and future Historically, Queensland has had a variable climate, and recent weather has reminded us of that fact. After experiencing the longest drought in recorded history,
COASTLINING THE ZODIAC
 COASTLINING THE ZODIAC Astronomy books and skywatching guides offer a wide variety of charts for naked-eye observation of the skies. What works best for each person will depend on various factors such
PMEL Press Releases and NOAA News Stories FY09- FY14
 PMEL Press Releases and NOAA News Stories FY09- FY14 PMEL WIDE Oceanographer named to head NOAA s Seattle research laboratory http://www.noaanews.noaa.gov/stories2011/20111018_pmel.html CLIMATE THEME most
ENSO: Recent Evolution, Current Status and Predictions. Update prepared by: Climate Prediction Center / NCEP 29 June 2015
 ENSO: Recent Evolution, Current Status and Predictions Update prepared by: Climate Prediction Center / NCEP 29 June 2015 Outline Summary Recent Evolution and Current Conditions Oceanic Niño Index (ONI)
SIXTH GRADE PLATE TECTONICS 1 WEEK LESSON PLANS AND ACTIVITIES
 SIXTH GRADE PLATE TECTONICS 1 WEEK LESSON PLANS AND ACTIVITIES PLATE TECTONIC CYCLE OVERVIEW OF SIXTH GRADE VOLCANOES WEEK 1. PRE: Comparing the structure of different types of volcanoes. LAB: Plotting
Henry Hudson by Kelly Hashway
 Before planes, people traveled by boat. And getting goods from one place to another took a long time, especially when ships had to sail around continents. In the early 1600s, European trading companies
Horn of Africa: Threat Factors for Commercial Shipping and Forecast of Pirate Activity Through 2009
 Horn of Africa: Threat Factors for Commercial Shipping and Forecast of Pirate Activity Through 2009 Scope Note This assessment of factors affecting pirate success and the ability of commercial vessels
DIURNAL CYCLE OF CLOUD SYSTEM MIGRATION OVER SUMATERA ISLAND
 DIURNAL CYCLE OF CLOUD SYSTEM MIGRATION OVER SUMATERA ISLAND NAMIKO SAKURAI 1, FUMIE MURATA 2, MANABU D. YAMANAKA 1,3, SHUICHI MORI 3, JUN-ICHI HAMADA 3, HIROYUKI HASHIGUCHI 4, YUDI IMAN TAUHID 5, TIEN
Investigation 6: What happens when plates collide?
 Tectonics Investigation 6: Teacher Guide Investigation 6: What happens when plates collide? In this activity, students will use the distribution of earthquakes and volcanoes in a Web GIS to learn about
Goal: Understand the conditions and causes of tropical cyclogenesis and cyclolysis
 Necessary conditions for tropical cyclone formation Leading theories of tropical cyclogenesis Sources of incipient disturbances Extratropical transition Goal: Understand the conditions and causes of tropical
Hot Spots & Plate Tectonics
 Hot Spots & Plate Tectonics Activity I: Hawaiian Islands Procedures: Use the map and the following information to determine the rate of motion of the Pacific Plate over the Hawaiian hot spot. The volcano
Satellite Derived Dynamic Ocean Currents in the Arctic. Jens Olaf Pepke Pedersen Polar DTU / DTU Space www.polar.dtu.dk www.space.dtu.
 Satellite Derived Dynamic Ocean Currents in the Arctic Jens Olaf Pepke Pedersen Polar DTU / DTU Space www.polar.dtu.dk www.space.dtu.dk Benefits of exploiting ocean currents Benjamin Franklins map of the
FOR SUBSCRIBERS ONLY! - TRIAL PASSWORD USERS MAY NOT REPRODUCE AND DISTRIBUTE PRINTABLE MATERIALS OFF THE SOLPASS WEBSITE!
 FOR SUBSCRIBERS ONLY! - TRIAL PASSWORD USERS MAY NOT REPRODUCE AND DISTRIBUTE PRINTABLE MATERIALS OFF THE SOLPASS WEBSITE! 1 NAME DATE GRADE 5 SCIENCE SOL REVIEW WEATHER LABEL the 3 stages of the water
Earth-Sun Relationships. The Reasons for the Seasons
 Earth-Sun Relationships The Reasons for the Seasons Solar Radiation The earth intercepts less than one two-billionth of the energy given off by the sun. However, the radiation is sufficient to provide
Interactive Plate Tectonics
 Interactive Plate Tectonics Directions: Go to the following website and complete the questions below. http://www.learner.org/interactives/dynamicearth/index.html How do scientists learn about the interior
Convective Clouds. Convective clouds 1
 Convective clouds 1 Convective Clouds Introduction Convective clouds are formed in vertical motions that result from the instability of the atmosphere. This instability can be caused by: a. heating at
Tide - rhythmic oscillation of the ocean surface due to gravitational & centrifugal forces ( inertia ) between the Earth, Moon and Sun.
 between the Earth, Moon and Sun.") Chapter 4: The Changing Level of the Sea Tides Longer Scale Variations Influence on Beaches Tide - rhythmic oscillation of the ocean surface due to gravitational & centrifugal forces ( inertia ) between
Chapter 4: The Changing Level of the Sea Tides Longer Scale Variations Influence on Beaches Tide - rhythmic oscillation of the ocean surface due to gravitational & centrifugal forces ( inertia ) between
User s Guide. Zuniga Point. Point Loma
 User s Guide Welcome to the Location File for San Diego Bay, located in the southwestern corner of the U.S. San Diego Bay has an excellent natural harbor, which has made it a busy commercial port. San
Waves disturbances caused by the movement of energy from a source through some medium.
 Oceanography Chapter 10 Waves disturbances caused by the movement of energy from a source through some medium. Floating Gull- Figure 10.1 water is not moving only the energy is moving through the water.
Jessica Blunden, Ph.D., Scientist, ERT Inc., Climate Monitoring Branch, NOAA s National Climatic Data Center
 Kathryn Sullivan, Ph.D, Acting Under Secretary of Commerce for Oceans and Atmosphere and NOAA Administrator Thomas R. Karl, L.H.D., Director,, and Chair of the Subcommittee on Global Change Research Jessica
THE CURIOUS CASE OF THE PLIOCENE CLIMATE. Chris Brierley, Alexey Fedorov and Zhonghui Lui
 THE CURIOUS CASE OF THE PLIOCENE CLIMATE Chris Brierley, Alexey Fedorov and Zhonghui Lui Outline Introduce the warm early Pliocene Recent Discoveries in the Tropics Reconstructing the early Pliocene SSTs