Career Academies LONG-TERM IMPACTS ON LABOR MARKET OUTCOMES, EDUCATIONAL ATTAINMENT, AND TRANSITIONS TO ADULTHOOD
|
|
|
- Jocelin Garrison
- 7 years ago
- Views:
Transcription
1 Career Academies LONG-TERM IMPACTS ON LABOR MARKET OUTCOMES, EDUCATIONAL ATTAINMENT, AND TRANSITIONS TO ADULTHOOD JAMES J. KEMPLE JUNE 2008 mdrc BUILDING KNOWLEDGE TO IMPROVE SOCIAL POLICY

2

3 Career Academies Long-Term Impacts on Labor Market Outcomes, Educational Attainment, and Transitions to Adulthood James J. Kemple with Cynthia J. Willner June 2008

4 Funders of the Career Academies Evaluation Alcoa Foundation American Express Foundation* Bristol-Myers Squibb Foundation Center for Research on the Education of Students Placed At Risk (CRESPAR) Charles Stewart Mott Foundation* Citigroup Foundation* Ford Foundation Richard King Mellon Foundation Russell Sage Foundation The Commonwealth Fund The George Gund Foundation The Grable Foundation The James Irvine Foundation* The Pew Charitable Trusts The Rockefeller Foundation The Wallace Foundation U.S. Department of Education U.S. Department of Labor* Westinghouse Foundation William T. Grant Foundation *Denotes funders of this report. Dissemination of MDRC publications is supported by the following funders that help finance MDRC s public policy outreach and expanding efforts to communicate the results and implications of our work to policymakers, practitioners, and others: The Ambrose Monell Foundation, Bristol- Myers Squibb Foundation, The Kresge Foundation, and The Starr Foundation. MDRC s dissemination of its education-related work is supported by the Bill & Melinda Gates Foundation, Carnegie Corporation of New York, and Citi Foundation. In addition, earnings from the MDRC Endowment help sustain our dissemination efforts. Contributors to the MDRC Endowment include Alcoa Foundation, The Ambrose Monell Foundation, Anheuser-Busch Foundation, Bristol-Myers Squibb Foundation, Charles Stewart Mott Foundation, Ford Foundation, The George Gund Foundation, The Grable Foundation, The Lizabeth and Frank Newman Charitable Foundation, The New York Times Company Foundation, Jan Nicholson, Paul H. O Neill Charitable Foundation, John S. Reed, The Sandler Family Supporting Foundation, and The Stupski Family Fund, as well as other individual contributors. The findings and conclusions in this report do not necessarily represent the official positions or policies of the funders. For information about MDRC and copies of our publications, see our Web site: Copyright 2008 by MDRC. All rights reserved.

5 Overview Established more than 30 years ago, Career Academies have become a widely used high school reform initiative that aims to keep students engaged in school and prepare them for successful transitions to postsecondary education and employment. Typically serving between 150 and 200 students from grades 9 or 10 through grade 12, Career Academies are organized as small learning communities, combine academic and technical curricula around a career theme, and establish partnerships with local employers to provide work-based learning opportunities. There are estimated to be more than 2,500 Career Academies operating around the country. Since 1993, MDRC has been conducting a uniquely rigorous evaluation of the Career Academy approach that uses a random assignment research design in a diverse group of nine high schools across the United States. Located in medium- and large-sized school districts, the schools confront many of the educational challenges found in low-income urban settings. The participating Career Academies were able to implement and sustain the core features of the approach, and they served a cross-section of the student populations in their host schools. This report describes how Career Academies influenced students labor market prospects and postsecondary educational attainment in the eight years following their expected graduation. The results are based on the experiences of more than 1,400 young people, approximately 85 percent of whom are Hispanic or African-American. Key Findings The Career Academies produced sustained earnings gains that averaged 11 percent (or $2,088) more per year for Academy group members than for individuals in the non-academy group a $16,704 boost in total earnings over the eight years of follow-up (in 2006 dollars). These labor market impacts were concentrated among young men, a group that has experienced a severe decline in real earnings in recent years. Through a combination of increased wages, hours worked, and employment stability, real earnings for young men in the Academy group increased by $3,731 (17 percent) per year or nearly $30,000 over eight years. Overall, the Career Academies served as viable pathways to a range of postsecondary education opportunities, but they do not appear to have been more effective than options available to the non-academy group. More than 90 percent of both groups graduated from high school or received a General Educational Development (GED) certificate, and half completed a postsecondary credential. The Career Academies produced an increase in the percentage of young people living independently with children and a spouse or partner. Young men also experienced positive impacts on marriage and being custodial parents. The findings demonstrate the feasibility of improving labor market preparation and successful schoolto-work transitions without compromising academic goals and preparation for college. Investments in career-related experiences during high school can produce substantial and sustained improvements in the labor market prospects and transitions to adulthood of youth. In fact, Career Academies are one of the few youth-focused interventions that have been found to improve the labor market prospects of young men. At the same time, Career Academies have proven to be challenging to implement on a large scale with high levels of fidelity, and the evidence from this evaluation may not apply to programs that are partially implemented or that use only selected features of the Academy approach. Further research should be conducted to determine the effects of key Academy components. iii

6

7 Contents Overview List of Exhibits Preface Acknowledgments iii vii ix xi Introduction 1 The Career Academies Evaluation 3 Impacts on High School Experiences and Outcomes 7 Long-Term Impacts on Labor Market Outcomes 11 Impacts on Educational Attainment 25 Impacts on Family Formation and Other Social Adjustment Outcomes 35 Discussion of the Findings 37 References 45 Earlier MDRC Publications on Career Academies 47 Technical Resources to accompany this report are available at: v

8

9 List of Exhibits 1 Impacts on Average Monthly Earnings and Components of Earnings for the Full Sample 13 2 Month-by-Month Impacts on Total Monthly Earnings for the Full Sample 15 3 Impacts on Average Monthly Earnings and Components of Earnings for Young Men 18 4 Impacts on Average Monthly Earnings and Components of Earnings for Young Women 19 5 Month-by-Month Impacts on Total Monthly Earnings, by Gender 21 6 Month-by-Month Impacts on Total Monthly Earnings, by Risk Subgroup 26 7 High School Completion Rates Eight Years After Scheduled Graduation for the Evaluation Sample and the NELS Sample 28 8 Highest Postsecondary Credential Completed Eight Years After Scheduled High School Graduation for the Evaluation Sample and the NELS Sample 30 9 Impacts on Educational Attainment Eight Years After Scheduled High School Graduation, by Gender Impacts on Family Formation and Other Social Adjustment Outcomes Eight Years After Scheduled High School Graduation for the Full Sample Impacts on Family Formation Eight Years After Scheduled High School Graduation, by Gender 38 vii

10

11 Preface In urban high schools, too many students who manage to graduate are unprepared for postsecondary education or the world of work. And they often enter a labor market that offers them few opportunities for good jobs. These new findings from MDRC s long-term study of Career Academies a popular high school reform that combines academics with career development opportunities shows that the model produces sustained employment and earnings gains, particularly among young men. The report is the culmination of a 15-year random assignment study of Career Academies in nine urban high schools around the country that has followed students from when they entered high school until eight years after their scheduled graduation. More than 80 percent of students in the sample are black or Hispanic. The evaluation, which has been funded by the U.S. Departments of Education and Labor and by 18 private foundations and organizations, represents an admirable commitment to objective evidence on the part of the Career Academy movement. This study provides the most rigorous evidence to date that investing in career-oriented programs and experiences for high school students can have a long-term payoff in the labor market. Notably, the employment and earnings gains did not come at the expense of postsecondary enrollment and completion; Academy participants and students in the control group had similar levels of academic achievement. These findings suggest that pitting academic preparation against career development in high schools may be a false dichotomy. As one of the few high school initiatives with rigorous evidence of effectiveness (albeit concentrated on postsecondary labor market outcomes), the Career Academy model has attained prominent stature in the field. But the programs represented in this study were selected in part because they were judged to be good examples of the model. Of late, organizations that support the development of Career Academies have come under increasing pressure to rely on one or two of the model s individual components like small learning communities with the expectation that elements of the program can produce results similar to those found in this study. However, until further research is conducted on the separate effects of specific components, policymakers and practitioners hoping to achieve comparable impacts should look to implement the full model with fidelity. In sum, the employment and earnings effects of Career Academies are encouraging news, particularly for young men of color, who are often left behind in the labor market. Career Academies appear to offer these young men a boost comparable to the earnings premium of a year or two of postsecondary education that puts them on a different earnings trajectory. Gordon Berlin President ix

12

13 Acknowledgments This report reflects more than 15 years of research on Career Academies and is the product of a remarkable collaboration among staff at MDRC and the sites, funders, and advisers who have supported the evaluation. This undertaking would not have been possible without the vision and support of the funding organizations listed at the front of the report. Special gratitude is also due the staff at the participating Career Academies, high schools, school districts, and employer partners, as well as the young people who generously gave of their time to respond to the surveys that MDRC and its partners have administered over the past eight years. The survey for this report was administered by Survey Research Management (SRM), led by Linda Kuhn and Ashley Bronzon. The survey team at SRM achieved an extraordinary response rate and provided the study and the field with a rich source of information about the young people who agreed to be part of this study. The report benefited greatly from the input of key advisers to the evaluation. Ron Ferguson of the John F. Kennedy School of Government at Harvard University, Harry Holzer of Georgetown University, Richard Murnane of the Harvard Graduate School of Education, David Stern of the University of California at Berkeley, and Andrew Sum of Northeastern University reviewed an early draft of the findings. They provided invaluable advice regarding further analyses and offered insights into the results and their implications. MDRC s Education Studies Committee reviewed an early draft of the report and offered useful advice regarding the context and implications for the findings and guidance on further analysis to be conducted for future papers. The committee includes Richard J. Murnane, Kevin J. Dougherty, Ronald Ferguson, Charles M. Payne, Melissa Roderick, Cecilia Rouse, Susan Sandler, and Susan Sclafani. Formal preparation of this report was preceded by briefings and discussions with the project s funders and several policy and practitioner groups. These exchanges yielded numerous suggestions for additional analyses, provided sources of contextual material, and pointed to implications that the findings may have for policy and practice. Staff from several organizations concerned with Career Academies have provided useful guidance throughout the study and helpful comments on the findings including Charles Dayton, David Stern, and Susan Tidyman of the Career Academy Support Network; J. D. Hoye and several of her colleagues at the National Academy Foundation; and Susan Katzman of the National Career Academy Coalition. Throughout the Career Academies Evaluation, Robert Ivry, MDRC s Senior Vice President for Development and External Affairs, played a pivotal role in building partnerships with the sites, funders, and advisers that form the foundation for the study. This report benefited greatly from his insights and advice on how to sharpen the presentation of the findings and their policy implications. Other MDRC staff members played key roles in acquiring and analyzing xi

14 data for this report. In particular, Shirley James and the staff from MDRC s data entry room coordinated the information for the survey administration and data collection process with Survey Research Management. Gordon Berlin, Rob Ivry, Fred Doolittle, Corinne Herlihy, Janet Quint, and Cynthia Miller reviewed drafts and provided helpful technical and substantive guidance on the presentation of the findings. Thanks are due John Hutchins for his help in guiding the report s organization and production and to Robert Weber for his skillful editing. Finally, we are grateful to David Sobel, who prepared the report for publication. The Authors xii

15 Introduction For nearly 40 years, Career Academies have offered high schools particularly those in urban communities a systematic approach to addressing the challenges young people face as they confront the demands of high school and prepare for postsecondary education and the world of work. Typically serving between 150 and 200 students from grades 9 or 10 through grade 12, Career Academies are defined by three distinguishing features: (1) they are organized as small learning communities to create a more supportive, personalized learning environment; (2) they combine academic and career and technical curricula around a career theme to enrich teaching and learning; and (3) they establish partnerships with local employers to provide career awareness and work-based learning opportunities for students. There are estimated to be more than 2,500 Career Academies across the country, operating either as a single program or as multiple programs within a larger high school. This report presents findings on the long-term effects of Career Academies on outcomes associated with the transition from adolescence to adulthood particularly on labor market participation, educational attainment, and family formation over the eight years following scheduled graduation from high school. In summary, the Career Academies produced sustained employment and earnings gains, particularly among young men. While Career Academies had no impact (positive or negative) on educational attainment, half of the young people in both the Academy and non-academy groups earned a postsecondary credential. The Career Academies also showed positive effects on increasing family stability. Since 1993, MDRC has been conducting a uniquely rigorous evaluation of the Career Academy approach in a diverse group of nine high schools across the country. The evaluation is being funded by the U.S. Departments of Education and Labor and by 18 private foundations and organizations. At least three features of the current educational and labor market landscape make the long-term results presented in this report especially relevant to policymakers and practitioners. First, the labor market for high school-age youth has continued a precipitous decline since the 1990s. 1 While civilian employment rates steadily increased through 2007, young people have failed to capture any share of this overall gain. The decline accelerated when the national job market began to deteriorate. By 2008, only about a third of the population of young people ages 16 through 19 held jobs, compared with 45 percent in Youth employment has been an important factor associated with many long-term positive 1 See Sum, McLaughlin, and Khatiwada (2008). 1
 they combine academic and career and technical curricula around a career theme to enrich teaching and learning; and (3)")
16 outcomes, including staying in school, graduating, preventing teen pregnancy, and making successful transitions to postsecondary education and employment. 2 Findings from the Career Academies evaluation provide further evidence of the potential effect of positive workrelated experiences during high school on successful transitions to adulthood. The labor market prospects of young men of color, particularly African-Americans, have been especially troubling. First of all, employment rates among all men declined between 1970 and 2000, but the decline was much steeper for men with a high school diploma or less. At the same time, employment among less-educated women rose substantially. 3 Employment rates for African-American men ages 20 to 24 have been declining steadily since 1970, from around 77 percent in 1969 to only 56 percent in 2003, and the employment gap between young African-American and white men hovered around 19 percentage points throughout the past decade. 4 Even in the peak economic period of 1999, African-American and Hispanic males aged 16 to 24 were far more likely to be neither working nor enrolled in school than white males of the same age (22.8 percent and 12.8 percent versus 8.7 percent, respectively). 5 Because more than 80 percent of the young people in the sample for the Career Academies Evaluation are Hispanic (56 percent) and African-American (30 percent), the findings can shed light on effective strategies for improving their labor market prospects. A second important trend is the increasing attention paid in high schools to highstakes testing of academic performance and to preparing students for college. This has been accompanied by a lessening focus on other goals of high schools, including youth development and preparation for postsecondary employment. This shift in emphasis reflects a growing consensus that a high school diploma is no longer a viable terminal credential for long-term success in the labor market and that all students must leave high school with the skills and habits to succeed in some form of postsecondary education. For instance, completing two years of community college, compared to only graduating from high school, was associated with more than a 10 percent increase in annual earnings for young men in Unfortunately, it appears that workforce preparation and college readiness have often been positioned as either/or choices, suggesting that high schools cannot help students in both areas simultaneously. Evidence from the Career Academies evaluation suggests that these goals do not need to be mutually exclusive. 2 See Sum, Fogg, and Mangum (2000); and Gruber (2001). 3 Edelman, Holzer, and Offner (2006), Table Sum, Khatiwada, Ampaw, and Tobar (2004). 5 Edelman, Holzer, and Offner (2006), Table See Marcotte, Bailey, Borkoski, and Kienzl (2005). 2

17 Third, the Career Academy model has continued to proliferate across the country both as a comprehensive approach to improving high school opportunities for young people and as a framework for other approaches that incorporate some of the model s component parts. The Career Academy model stands at the crossroads of many recent initiatives aimed at improving low-performing high schools. In fact, it predated many popular reforms, including school-to-work initiatives of the early 1990s, the movement toward small schools and smaller learning communities of the 2000s, and the more recent efforts to combine academic rigor and real-world relevance. Finally, the business community has a reinvigorated interest in supporting high school improvement initiatives and, more specifically, in helping young people gain access to high-quality learning opportunities in the workplace. The new findings from the Career Academies Evaluation presented in this report, as well as reexamination of findings presented in earlier reports, can shed light on the efficacy of these types of reform efforts. The remainder of this report the seventh formal report from the study describes the Career Academy approach and highlights the key features of the evaluation that underlie its rigor and the relevance of its findings. 7 The newest findings from the study are based on a survey administered 11 to 12 years after the young people in the study sample entered their Career Academies and a full eight years after their scheduled graduation from high school. 8 The Career Academies Evaluation Several features of the Career Academies Evaluation make it distinctive. The high schools are located in medium- and large-sized school districts and reflect many of the stressful conditions found in urban settings. The participating Career Academies were able to implement and sustain the core features of the approach, and they served a cross-section of the student populations in their host high schools. The Career Academies Evaluation is one of the few studies of a school reform initiative that uses the design of a randomized, controlled field trial. Because more eligible and appropriate students applied for the Academy programs than could be served, applicants were randomly selected to enroll in the 7 For a detailed discussion of the history and conceptual framework underlying the Career Academy approach, see Stern, Dayton, and Raby (2003); Kemple (1997); Kemple, Poglinco, and Snipes (1999); and Kemple and Snipes (2000). For a detailed discussion of the research design, the sites, the students in the study sample, and other data sources used in the evaluation, see Kemple and Rock (1996); Kemple (1997); Kemple and Snipes (2000); and Kemple (2001). 8 For a more detailed discussion of the Career Academies Evaluation Eight-Year Post-High School Follow-Up Survey response rates and analysis issues related to data availability, see Unit 1 in the Technical Resources for this report (Kemple and Willner, 2008), available at 3

18 Academy group. The remaining applicants constitute the study s non-academy control group. Subsequent differences in outcomes between the two groups provide valid estimates of the Academies impacts. This type of research design is widely considered to be the most reliable way to measure the effectiveness of interventions such as Career Academies. The evaluation is also unusual among studies of school reforms for following both groups of students from the beginning of high school through eight years after scheduled graduation. Following is an overview of the key features of the study. The Research Design Using a random assignment research design is the best way to ensure that there are initially no systematic differences between the two groups that make up the study sample. Each of the students in the sample applied for a place in one of the participating Career Academies and was deemed to be appropriate for the programs. Because more applicants were appropriate than the programs could serve, a lottery was used to choose which students would be invited to enroll. Approximately 55 percent of the students in the applicant pool were randomly selected to enroll in a Career Academy, and they constitute the study s Academy group. The remaining students (about 45 percent of the applicant pool) continued or enrolled in the high schools regular education programs and constitute the study s non- Academy control group. The outcomes for the non-academy group are the best indicators of how students in the Academy group would have fared if they had not had access to the programs. Therefore, the impacts that is, the differences in outcomes between the Academy and the non-academy groups represent the changes that the Career Academies produced over and above what students were likely to achieve in non-academy environments. 9 The Sites Each of the nine high schools in this evaluation is located in or near a large urban school district with substantially higher percentages of African-American and Hispanic students than exist in school districts nationally, as well as higher dropout rates, higher unemployment rates, and higher percentages of low-income families. The schools were selected strategically on the basis of several criteria: 10 9 For a detailed description of how the random assignment procedures were implemented for the evaluation, see Kemple and Rock (1996). 10 For a discussion of the criteria and process used to select sites for this study, see Kemple and Rock (1996). The sites are located in the following school districts: Baltimore City School District; East Side Union School District (two sites in San Jose, California); Miami-Dade School District; Pittsburgh Public School District; Santa Ana (California) Unified School District; Socorro (Texas) Unified School District; (continued) 4

19 The schools had implemented and sustained the core features of the Career Academy approach for at least two years. There was a clear contrast along the core dimensions of the Academy model between the Career Academy and other programs within the high school. The Career Academy served a diverse population of students but made explicit efforts to include students who were perceived to be at risk of dropping out. The high school and its Career Academy were willing and able to accommodate random assignment and other key features of the evaluation design. As a group, the participating sites reflect many of the conditions under which Career Academies had been implemented across the country in the mid to late 1990s. They operated as single programs within larger comprehensive high schools, and while they were inclusive of a range of students in their host high schools, they were targeted to students who were seen as being at risk of being disengaged from or even dropping out of school. In addition, each of the participating Academies was able to reach a threshold level of implementation for the three core components of the model: small learning communities, careerthemed curricula, and partnerships with employers. Individually the sites also capture much of the variation in the Academy approach as it had been adapted to local needs and circumstances, including variation in the intensity of the three components. It is important to note, however, that the Career Academies participating in this evaluation may not be representative of Career Academies across the country today. Competing pressures on high schools and on Academies, as well as the increasing focus on academic performance and college preparation, have pushed many Career Academies or Academy-like programs to deemphasize supports for academic and career-related course combinations and to limit the availability of work-based learning and other career awareness and development opportunities both in and outside school. Students in the Study The student populations in the participating Career Academies tend to reflect the ethnic, gender, and socioeconomic characteristics of their host high schools, which are diverse. More than 50 percent of the sample are Hispanic, and another 30 percent are African- Pajaro Valley (Watsonville, California) Unified School District; and Washington, DC, Public School District. 5

20 American. Students came to the programs with varying school-related experiences and educational aspirations. For example, based on their high attendance rates and grades in middle school and their reports on a baseline survey of high engagement in school and high expectations for going to college, it appears that some students were doing well in school when they applied for the Academies. Key goals of Academies are to prepare such students for college and to provide them with career-related learning experiences and credentials that will make them more competitive in the labor market. Other Academy applicants, such as those with low middle school attendance rates and grades, appeared to be on a path toward dropping out or ending their education after high school. Academies aimed to reengage such students, providing them with more applied learning experiences and encouraging them to develop higher aspirations for education and employment. 11 Data Sources Since the study began in 1993, data for the Career Academies Evaluation were obtained from sample members high school transcripts and from surveys administered during high school and at three points during the first eight years following their scheduled graduation from high school. The primary data for the current report were obtained from a survey administered to sample members approximately 96 months after their scheduled graduation from high school (11 to 12 years after they entered the study). The Career Academies Evaluation s Eight-Year Post-High School Follow-Up Survey focused on the fifth through eighth years following scheduled graduation from high school and asked sample members: Whether and when they graduated from high school or received a General Educational Development (GED) certificate and whether and when they enrolled in postsecondary education programs and institutions. Students who were enrolled in postsecondary education programs were asked about the programs characteristics, whether they completed the program, and what degree or certificate, if any, they received. Information about their work experiences during the previous four years, including which month and year they started each job that they held during this period, which month and year they left each job, the number of hours they worked per week, the number of weeks they worked per month, and the hourly wage they earned. Information about the industries in which they worked for each job they held during the previous four years, and the type of work they performed. For the 11 For a more complete listing of background characteristics of the full study sample, see Unit 1 in the Technical Resources for this report (Kemple and Willner, 2008). 6

21 most recent jobs that respondents held, the survey also asked about the types of skills they used, how their employment might have been connected to high school experiences, and how their work experience might be preparing them for the future. Information about marital status, having children, living situations, and other experiences in their lives and their plans for the future. The newest findings in this report are based on data collected from 1,428 youth who completed the Eight-Year Post-High School Follow-up Survey. This represents 81 percent of the 1,764 young people in the full study sample: 82 percent of the Academy group and 80 percent of the non-academy group. Response analysis indicates that there were no systematic differences in background characteristics between Academy and non-academy group members who responded to the survey. The relatively high response rates in both the Academy and the non-academy group and the comparability of the Academy and non- Academy group members who responded afford a high degree of confidence that the survey data yield valid estimates of the Career Academies impacts. 12 Impacts on High School Experiences and Outcomes To provide context for interpreting the impacts that Career Academies had on postsecondary education and labor market outcomes, this section summarizes findings from prior reports about how Career Academies influenced students high school experiences. The first three reports from the Career Academies Evaluation describe the implementation of the core elements of the Career Academy approach and assess the extent to which these elements provided students, teachers, and employers with the types of supports and learning opportunities promised by the Career Academy model. 13 The fourth report examines the impacts that the participating Academies had on students performance and engagement through the end of their twelfth-grade year in high school. 14 The findings from these earlier reports provide an essential context for understanding the pattern of Career Academy effects on postsecondary educational attainment and labor market outcomes that are discussed in this report. In particular, they shed light on the 12 For a more detailed discussion of the Career Academies Evaluation Eight-Year Post-High School Follow-Up Survey response rates and analysis issues related to data availability, see Unit 1 in the Technical Resources for this report (Kemple and Willner, 2008). 13 See Kemple and Rock (1996); Kemple (1997); and Kemple, Poglinco, and Snipes (1999). 14 See Kemple and Snipes (2000). Also, Units 3 to 5 in the Technical Resources for this report (Kemple and Willner, 2008) include tables that summarize the impacts on student performance and engagement in high school for the Eight-Year Post-High School Follow-Up Survey sample. 7
22 facets of students high school experiences and outcomes that Career Academies affected or did not affect. Differences (and the lack of differences) in the experiences of students in the Academy group and the non-academy group are fundamental antecedents to the effects that Career Academies might have had as these young people moved beyond high school into postsecondary education programs and the world of work. Several findings reported previously indicate that the Career Academies in the evaluation changed students experiences during high school in ways that are strongly consistent with the short-term goals of the Academy approach. For example, compared with their non-academy counterparts: Students in the Academy group reported higher levels of interpersonal support from teachers and peers. Academy students were more likely to build a high school transcript that combined academic and career or technical courses. Academy students were substantially more likely to be exposed to a range of career awareness and development activities, both in and outside school, and to work in jobs that were connected to school (for instance, they got a job as part of a class or through a school connection). For students who entered the programs at high risk of dropping out, the Academies increased the likelihood of staying in school through the end of the twelfth-grade year, improved attendance, and increased the number of credits earned toward graduation. For students at medium or low risk of dropping out, the Academies increased career and technical course-taking and participation in career development activities without reducing academic course-taking. Previously reported findings also indicate several potential limitations of the Academies implementation and effectiveness: Nearly one-third of the students who initially enrolled in the Academies left the programs before the end of their twelfth-grade year. The curricula and instructional strategies used in the Academies (in both academic and career or technical courses) were generally similar to those offered in the rest of the high school and did not typically include integration of academic content and knowledge with career-related applications. 8
23 The Academies had no impact on scores from a standardized test administered as part of the evaluation s data collection effort. Some Academies that did not substantially increase interpersonal supports from teachers and peers led to reduced attendance rates and academic coursetaking for some students. Not surprisingly, the Academies appear to have been most effective at influencing those aspects of school functioning and student and teacher experiences that are closest to the core features of the approach. For example, the Academies school-within-a-school organization appears to have created communities of support for teachers and students. In this context, students were more highly engaged in school, which was reflected in high attendance rates, low dropout rates, and in the words of several students a sense of being in a family-like atmosphere. Teachers, too, saw the Academies as a learning community in which they collaborated with colleagues and were able to give students more personalized attention. The findings suggest that the school-within-a-school structure and the interpersonal supports that evolved from it may have been important preconditions for the implementation and effectiveness of other features of the Career Academy approach. In and of themselves, however, these interpersonal supports do not appear to have had a direct impact on student performance. The Career Academies in this evaluation had the strongest and most pervasive effects on the engagement of high-risk students during the high school years. For these students, the Academies increased attendance and credits earned in both academic and career or technical courses, and they kept a higher proportion of those students enrolled in school through the end of twelfth grade. For medium- and low-risk students, the Academies were able to increase exposure to career-related courses and career development experiences without reducing the likelihood of completing at least a basic academic core curriculum. Employer partnerships another key feature of the Career Academy approach offered employers structured, concrete opportunities to engage in the educational mission of high schools. These partnerships provided students with a broad array of career awareness and development experiences both in and outside school, including work-based learning internships. Academy students were much more likely than their non-academy counterparts to be exposed to such experiences as job-shadowing, career fairs, guest speakers from local businesses, and instruction in how to look for and apply for a job, prepare a résumé, and interview. Academy students were also provided with increased exposure to individual employers as well as to information about the types of career opportunities in a given field. The Academies in this evaluation appear to have had less influence on curricular content and teachers instructional practice than on the measures mentioned above. Acade- 9
24 my students were more likely to take career-related courses than their non-academy peers, but the academic and career-related courses that they took were generally typical of those offered in the regular school environment probably because Academy teachers were bound by the same requirements as their non-academy counterparts regarding the scope and sequence of the curriculum. Similarly, although the Academies were more likely to expose students to applied and work-related learning activities, they typically did not truly integrate academic and career-related curricula and instructional practice in ways consistent with practices that have been identified in other research. 15 Such integration requires offering more extensive professional development opportunities to teachers over and above the in-service workshops normally available through school and district resources than most of the Academies could provide. Other professional development opportunities, such as shared planning time for teachers, were focused on student-related concerns and on coordinating the career development and employer-related activities. Given the similarity between Academy and non-academy academic curricula and instructional practice, it is not surprising that the Academies did not affect students standardized test scores. Still, Academy students performed at least as well as their non- Academy counterparts on standardized tests, and they received the added benefits of participating in a combined academic and career-related curriculum and in a series of career development activities. Finally, only 55 percent of students who were selected to enroll in the Career Academies remained in those programs through their scheduled graduation. About 15 percent of the applicants who were randomly assigned to the Academy group never enrolled at all, and another 30 percent enrolled but subsequently left the programs before their scheduled graduation. Only a small percentage of those who left the Academies dropped out of high school altogether. It is unclear how much of the attrition from the Academies could have been influenced or avoided by the programs themselves. Over 90 percent of the students who were selected for the Academies but who never enrolled in one or who left the Academy before graduation remained enrolled in other high school programs or high schools. Approximately 54 percent said that they did not enroll or left the programs because they did not like the Academy or because they preferred other classes or programs that better suited their interests and needs. Student mobility usually due to family circumstances beyond the control of the programs accounted for another 25 percent of students who either never enrolled 15 For a review of research on approaches for integrating academic and vocational education, see Grubb (1995a, 1995b). 10
25 or left before graduation. The remaining students were asked to leave the Academies or dropped out of high school altogether. The high attrition rates may suggest, however, that there is not great demand for Academies, at least under circumstances where students can choose to leave and staff can ask them to leave. In any case, these are the circumstances under which Career Academies typically operated in the 1990s and many continue to operate today. As a result, Academies may be able to influence students behavior and performance for only a year or two before students move on to other opportunities. In an effort to provide the most rigorous and policy-relevant information about Academies potential to affect students behavior, this evaluation takes the reality of attrition squarely into account by including in the analysis all students who were randomly assigned to Academies, whether they enrolled or not. Long-Term Impacts on Labor Market Outcomes This section of the report begins with a summary of the impacts that the Career Academies had on labor market outcomes for the full study sample. The key labor market outcomes include average monthly earnings and the core sources of monthly earnings: months employed during the follow-up period, hours worked per week, and hourly wages. 16 It includes information about impacts throughout the eight years following each sample member s scheduled graduation from high school and focuses special attention on the characteristics of jobs held at the end of the follow-up period. 17 The section then discusses in 16 All information on job characteristics is self-reported. Monthly earnings were calculated by multiplying each sample member s reported hourly wage by the hours worked per week and by the number of weeks worked per month. For months in which sample members did not report being employed, zero values were used for monthly earnings and the components of earnings. For all jobs except the current or most recent job, hourly wages and weekly hours at the conclusion of the job were applied to the full duration of the job. Thus, if wages or hours increased or decreased during the job, these measures may overor underestimate true monthly earnings. Analyses conducted on the four-year post-high school data indicated that the pattern of impacts was not sensitive to various assumptions about changes in wages or hours. 17 Information about labor market outcomes during the first four years following scheduled high school graduation is derived from the Career Academies Evaluation Four-Year Post-High School Survey and the sample of students who completed that survey (N = 1,458). Information about labor market outcomes during the second four years following scheduled high school graduation is derived from the Career Academies Evaluation Eight-Year Post-High School Survey and the sample of students who completed that survey (N = 1,428). The estimates derived from these two samples are the most representative of findings for the full sample of students in the evaluation for the respective time periods. Averages are calculated across the two time periods, but, because of the different samples from which estimates were derived, tests of statistical significance were not performed for these averages. Results using a common overlapping sample from the two follow-up surveys (N = 1,275) yielded a similar pattern of results. See Unit 1 of the Technical Resources for this report (Kemple and Willner, 2008). 11
26 more detail the labor market impacts for the subgroups of young men and young women. It concludes with a brief review of the labor market impacts for subgroups defined by the background characteristics associated with the risk of dropping out of high school. All dollar values presented in this report are inflation-adjusted and are expressed as 2006 dollars. 18 The Career Academies produced positive and sustained impacts on average monthly earnings throughout the eight-year follow-up period. Exhibit 1 displays the impacts that Career Academies had on average monthly earnings and on each of the key components of earnings (months employed, hours worked per week, and hourly wages). 19 The bars on the left side of each figure reflect averages over the first four years following scheduled high school graduation. The bars on the right side of each figure reflect averages over the next four years. The bar graph on the left side of the exhibit shows that the Career Academies produced an increase in earnings of $132 per month during the first four years of the follow-up period and $216 per month in the final four years. Both of these results are statistically significant, meaning that it is unlikely that the differences arose by chance. 20 On average, this represents an increase of $174 per month over the full eight years following scheduled high school graduation and an 11 percent increase in monthly earnings over the non-academy group s average of $1,561 per month. Over the eight-year follow-up period, this reflects an additional $2,088 in earnings per year for the Academy group or a total of $16,704 (in 2006 dollars). 21 The three figures on the right side of Exhibit 1 indicate that the impact on monthly earnings during both phases of 18 Values are adjusted for inflation using the 2007 Consumer Price Index for All Urban Consumers, unadjusted for seasonal variation, from the U.S. Department of Labor, Bureau of Labor Statistics ( 19 Unit 3 of the Technical Resources for this report (Kemple and Willner, 2008) includes supplementary tables that provide more detailed labor market impact findings for the full study sample over the eight-year follow-up period. 20 In the exhibits, the number of asterisks next to a particular impact estimate indicates the confidence one should have that the margin of error around that estimate does not include zero. One asterisk indicates that there is a probability of less than 10 percent that the given result would be observed if the impact is truly zero; two asterisks indicates a probability of less than 5 percent; and three asterisks, a probability of less than 1 percent. The actual probability that random chance could have produced the given result in the event that the impact is truly zero is shown in the p-value column in the tables. 21 Results using the smaller, common overlapping sample from the two follow-up surveys (see footnote 17) yielded a similar pattern, although the size of the impacts is somewhat smaller, especially for the first four years. For the common sample, the Career Academies produced an increase of $104 per month during the first four years of follow-up and $212 per month during the last four years. Over the entire eight-year follow-up period, the Career Academies produced an impact of $158 per month, which amounts to an increase of $1,898 per year and an accumulated $15,185 over all eight years (in 2006 dollars). The earnings impacts for all phases of the followup period are statistically significant. Unit 1 of the Technical Resources for this report (Kemple and Willner, 2008) includes additional details about the robustness of the earnings impacts across samples. 12
27 13 Wages (2006 Dollars) Hours Monthly Earnings (2006 Dollars) Months Career Academies Evaluation Exhibit 1 Impacts on Average Monthly Earnings and Components of Earnings for the Full Sample Average Monthly Earnings Months Employed $2,800 $2,400 $2,000 Impact = $132*** Impact = $216*** $2,112 $1, Impact = 1.4** Impact = Academy Group Non-Academy Group $1,600 $1,358 $1, $1,200 $800 $400 $0 Years 1-4 Years 5-8 SOURCES: MDRC calculations from the Career Academies Evaluation Four-Year and Eight-Year Post-High School Follow-Up Surveys. NOTES: Earnings and wages are reported in 2006 dollars. Measures reflect averages over the first and second 48-month periods following scheduled high school graduation. Measures for the first 48 months are derived from the Four-Year Post-High School Follow-Up Survey sample (N = 1,458); measures for the second 48 months are derived from the Eight-Year Post-High School Follow-Up Survey sample (N = 1,428). Impact estimates are regression-adjusted to control for background characteristics of the sample and for the clustering of students within schools and random assignment years. Values shown for the Academy group are unadjusted mean values; values shown for the non-academy group are calculated by subtracting the impact estimate from the Academy group s unadjusted mean values. A two-tailed t-test was applied to differences between the Academy and non-academy groups. Statistical significance levels are indicated as: *** = 1 percent; ** = 5 percent; and * = 10 percent. Rounding may cause slight discrepancies in calculating sums and differences $18 $16 $14 $12 $10 $8 $6 $4 $2 $0 Years 1-4 Years 5-8 Average Hours Worked per Week Impact = 1.8** Impact = 1.7** Years 1-4 Years 5-8 $10.83 Average Hourly Wages Impact = $0.57*** $10.26 Impact = $0.70* $14.99 $14.30 Years 1-4 Years 5-8
28 the follow-up period was driven by a combination of increases in the number of months employed, hours worked per week, and hourly wages. Exhibit 2 shows that the Career Academies impacts on average monthly earnings persisted throughout the eight-year post-high school follow-up period. Monthly earnings for both the Academy and the non-academy group increased substantially in real terms over the eight years after scheduled graduation. In 2006 dollar values, monthly earnings for both groups increased by roughly $1,700 over the follow-up period. The solid line in the exhibit, however, shows that the study s Academy group earned more, on average, than those in the non-academy group (represented by the dashed line) during each month. In fact, impacts on monthly earnings were statistically significant in 87 of the 96 months shown in the exhibit, and they persisted through the eighth year of the follow-up period. As a further point of comparison, average earnings for members of the non-academy group in the eighth year following scheduled graduation from high school ($26,043) were somewhat higher than those for a nationally representative group of young people with similar background characteristics who attended urban high schools around the same time ($25,231). 22 Thus, even though the study s non-academy group had somewhat stronger earnings potential than similar students nationally, the Career Academies were able to give these young people a meaningful boost in the labor market. The survey that was administered to the study sample for this report also asked the sample members to provide more detailed information about the jobs that they held near or at the end of the eight-year post-high school follow-up period, when most of them were about 26 years old. 23 There are several potentially important differences between the jobs held by Academy and non-academy group members who were employed during the follow-up period. For example, even though nearly 90 percent of both of these groups were employed in the last three months of the follow-up period, Academy group members had been working at their current or most recent job for about three months longer than their 22 Unit 2 of the Technical Resources for this report (Kemple and Willner, 2008) presents comparisons between outcomes for the Career Academies Evaluation sample and similar students from the National Education Longitudinal Study of 1988 (NELS:88) through Dollar values from both samples are inflation-adjusted and are expressed in 2006 dollars. The values for the NELS sample are regressionadjusted and mean-centered to reflect outcomes for students who had the same distribution of background characteristics as students in the Career Academies Evaluation sample. 23 Unit 3 of the Technical Resources for this report (Kemple and Willner, 2008) provides a list of these job characteristics for both groups. The information on job characteristics that is discussed in this section of the report and presented in the Technical Resources is based only on the sample members who were employed during the follow-up period and focuses only on the characteristics of the last job they held. As a result, the data do not allow for experimental comparisons, and differences in job characteristics between Academy and non-academy groups do not represent valid indicators of Career Academy impacts (or lack of impacts). 14
29 Monthly Earnings (2006 Dollars) Career Academies Evaluation H:\K12\CA\Report 7\Publications\Round2_Edits\Exhibits\Ex.3-MALE Y1-8 Earnings bargraphs.xlsx, 6/18/08, CW Exhibit 2 Month-by-Month Impacts on Total Monthly Earnings for the Full Sample 3,200 2,800 2,400 2,000 1,600 1, Months after scheduled high school graduation date Impact Academy Group Non-Academy Group SOURCES: MDRC calculations from the Career Academies Evaluation Four-Year and Eight-Year Post-High School Follow-Up Surveys. NOTES: Earnings are reported in 2006 dollars. Measures reflect the 96-month period following scheduled high school graduation for each sample member (Month 0 is June of the scheduled graduation year). Measures for Months 1 to 48 are derived from the Four- Year Post-High School Follow-Up Survey sample (N = 1,458). Measures for Months 49 to 96 are derived from the Eight-Year Post-High School Follow-Up Survey sample (N = 1,428). The dotted line at Month 48 illustrates the cutpoint between the Four-Year and Eight-Year Post-High School Follow-Up Survey samples. Impact estimates are regression-adjusted to control for background characteristics of the sample and for the clustering of students within schools and random assignment years. Values shown for the Academy group are unadjusted mean values; values shown for the non-academy group are calculated by subtracting the impact estimate from the Academy group s unadjusted mean values. A two-tailed t-test was applied to differences between the Academy and non-academy groups. Differences in monthly earnings are significant at a level of 10 percent or less in 87 of the 96 months. 15
30 control group counterparts. Monthly earnings for the Academy group outpaced the earnings of the non-academy group at both the start and end of the job, and the Academy group experienced a 23 percent increase in real earnings over the time that they held their jobs (from $2,272 per month to $2,798 per month), compared with about 21 percent for the non- Academy group (from $2,106 to $2,547 per month). Just over 74 percent of workers in both groups held jobs that provided a health insurance plan, and just over 81 percent of both groups (81 percent of the Academy group and 82 percent of the non-academy group) reported working in a job that provided other benefits, such as sick and vacation days and a retirement plan. There were modest differences in the distribution of jobs across occupational sectors. Nineteen percent of the Academy group, compared with 16 percent of the non- Academy group, were employed in a management, business operations, or financial operations occupation (although this difference is not statistically significant), and 7 percent of the Academy group, compared with less than 4 percent of the non-academy group, were employed in a computer, engineering, or media technology occupation. There was a slight trend for Academy group members to have lower employment in other sectors, including education, social services, law, and science occupations (8 percent versus 11 percent) and sales, food, and personal services occupations (12 percent versus 14 percent). Overall, the largest proportion of the Academy group, 24 percent, worked in an office or administrative support occupation; 15 percent worked in a construction, production, maintenance, or transportation occupation; and 9 percent worked in a health care, medical support, or medical technology occupation. Similar percentages of the non-academy group worked in each of these sectors as well. In addition to monthly earnings, hourly wages, and occupational sector, two other characteristics differentiated the jobs held by the Academy group from those held by the non-academy group. First, sample members in the Academy group were more likely to be working in a job that was directly related to the subjects and themes that they studied during high school: 39 percent of the Academy group reported this to be the case, compared with 31 percent of the non-academy group. Second, 46 percent of the Academy group indicated that their current choice of occupational field was influenced by their high school experiences, compared with 36 percent of the non-academy group. Note, however, that the majority of those in the Academy group were not working in jobs related to the career theme of the Academy program for which they were selected. The impacts on labor market outcomes were concentrated among young men in the study sample. 16
31 Exhibit 3 displays the Career Academies impacts on average monthly earnings (and the key components of earnings) for young men in the study sample, and Exhibit 4 displays impacts for the young women. 24 Exhibit 3 shows that, for both phases of the follow-up period, the Academies produced statistically significant increases in monthly earnings, months employed, and hours worked per week for young men. The programs also produced increases in hourly wages, but only the estimate for the first four years of the follow-up period is statistically significant. During the first four years, the Career Academies produced an average increase of $260 in real monthly earnings for young men, which grew to an impact of $361 in real monthly earnings during the last four years of the follow-up period. Across the two phases of the follow-up period, therefore, the Career Academies produced an average increase of $311 in real monthly earnings for young men. This amounts to a 17 percent increase over and above the average earnings of $1,792 per month for young men in the non-academy group or an increase of $3,722 in annual earnings and a total of nearly $30,000 in additional real earnings (in 2006 dollars) for males in the Academy group over the eight-year post-high school follow-up period. 25 Exhibit 3 also shows that, for young men, the Academy programs produced sizable increases in the number of months employed, hours worked per week (including full-time employment), and hourly wages. Over all eight years, the young men in the Academy group were employed during nearly 80 months (83 percent of the 96-month follow-up period), compared with 74 months (77 percent of the follow-up period) for young men in the non- Academy group. Though not shown in the exhibit, young men in the Academy group were employed full time during 70 of the 80 months that they were working, compared with only 63 of 74 months for the non-academy group. Over the eight-year follow-up period, young men in the Academy group worked an average of about 36 hours per week, compared with 32 hours per week for young men in the non-academy group. 24 Unit 4 of the Technical Resources for this report (Kemple and Willner, 2008) includes supplementary tables that provide detailed impact findings for young men and young women in the study sample over the eight-year follow-up period. 25 These estimates are averaged across the four-year and eight-year follow-up samples of young men (N = 604 and 587, respectively). The pattern of impacts obtained using the common overlapping sample of young men from the two follow-up surveys (N = 513) is similar to that obtained using the separate survey samples, although the size of the impacts is somewhat smaller. For the common sample, the Career Academies produced an increase in young men s earnings of $196 per month during the first four years of follow-up and $302 per month during the last four years. Over the entire eight-year follow-up period, the Career Academies produced an impact of $249 per month for young men, which amounts to an increase of $2,989 per year and an accumulated $23,912 over all eight years (in 2006 dollars). The earnings impacts for all phases of the follow-up period are statistically significant for this sample. Unit 1 of the Technical Resources for this report (Kemple and Willner, 2008) includes additional details about the robustness of the earnings impacts across samples. 17
32 18 Wages (2006 Dollars) Hours Monthly Earnings (2006 Dollars) Months Career Academies Evaluation Exhibit 3 Impacts on Average Monthly Earnings and Components of Earnings for Young Men Average Monthly Earnings Months Employed $2,800 $2,400 Impact = $260*** Impact = $361** $2,558 $2, Impact = 2.9*** Impact = 2.8*** Academy Group Non-Academy Group $2,000 $1,600 $1,647 $1, Years 1-4 Years 5-8 $1,200 Average Hours Worked per Week $800 Impact = 4.0*** Impact = 4.1*** $400 $0 Years 1-4 Years 5-8 SOURCES: MDRC calculations from the Career Academies Evaluation Four-Year and Eight-Year Post-High School Follow-Up Surveys. NOTES: Earnings and wages are reported in 2006 dollars. Measures reflect averages over the first and second 48-month periods following scheduled high school graduation. Measures for the first 48 months are derived from the Four-Year Post-High School Follow-Up Survey sample of young men (N = 604); measures for the second 48 months are derived from the Eight-Year Post-High School Follow-Up Survey sample of young men (N = 587). Impact estimates are regression-adjusted to control for background characteristics of the sample and for the clustering of students within schools and random assignment years. Values shown for the Academy group are unadjusted mean values; values shown for the non-academy group are calculated by subtracting the impact estimate from the Academy group s unadjusted mean values. A two-tailed t-test was applied to differences between the Academy and non-academy groups. Statistical significance levels are indicated as: *** = 1 percent; ** = 5 percent; and * = 10 percent. Rounding may cause slight discrepancies in calculating sums and differences $18 $16 $14 $12 $10 $8 $6 $4 $2 $ Years 1-4 Years 5-8 Average Hourly Wages Impact = $0.59 Impact = $0.96*** $16.54 $15.95 $11.71 $10.75 Years 1-4 Years 5-8
33 19 Wages (2006 Dollars) Hours Monthly Earnings (2006 Dollars) Months Career Academies Evaluation Exhibit 4 Impacts on Average Monthly Earnings and Components of Earnings for Young Women Average Monthly Earnings Months Employed Impact = 0.3 Impact = -0.3 $2,800 $2,400 Impact = $ Academy Group Non-Academy Group $2,000 $1,600 $1,200 $800 $400 $0 Impact = $53 $1,153 $1,100 $1,795 Years 1-4 Years 5-8 $1,677 SOURCES: MDRC calculations from the Career Academies Evaluation Four-Year and Eight-Year Post-High School Follow-Up Surveys. NOTES: Earnings and wages are reported in 2006 dollars. Measures reflect averages over the first and second 48-month periods following scheduled high school graduation. Measures for the first 48 months are derived from the Four-Year Post-High School Follow-Up Survey sample of young women (N = 854); measures for the second 48 months are derived from the Eight-Year Post-High School Follow-Up Survey sample of young women (N = 841). Impact estimates are regression-adjusted to control for background characteristics of the sample and for the clustering of students within schools and random assignment years. Values shown for the Academy group are unadjusted mean values; values shown for the non-academy group are calculated by subtracting the impact estimate from the Academy group s unadjusted mean values. A two-tailed t-test was applied to differences between the Academy and non-academy groups. Statistical significance levels are indicated as: *** = 1 percent; ** = 5 percent; and * = 10 percent. Rounding may cause slight discrepancies in calculating sums and differences $18 $16 $14 $12 $10 $8 $6 $4 $2 $0 Years 1-4 Years 5-8 Average Hours Worked per Week Impact = 0.2 Impact = Years 1-4 Years 5-8 Average Hourly Wages Impact = $0.65 Impact = $0.33 $13.89 $13.24 $10.20 $9.87 Years 1-4 Years 5-8
34 Finally, the top graph in Exhibit 5 shows that the Career Academies impact on monthly earnings for young men persisted throughout the eight-year post-high school follow-up period. It shows that while real monthly earnings more than tripled for both groups, young men in the Academy group consistently earned more throughout the period. In fact, during the last year of the follow-up period, the young men in the evaluation sample earned substantially more than a nationally representative group of young men at a similar point in their lives, with similar characteristics, who also attended urban, public high schools. 26 Furthermore, the magnitude of the impact of Career Academies on annual earnings during the eighth year after high school for young men a 16 percent increase over the non-academy group s earnings is larger than the earnings premium that other researchers have calculated for two full-time-equivalent years of enrollment in a community college. These researchers estimate that completing two years of community college, relative to having a high school diploma but no postsecondary education, was associated with an 11 to 12 percent increase in annual earnings for young men in Similarly, an unadjusted analysis of 2006 census data reveals that young men ages 25 to 28 who had completed some college were earning about 16 percent more than their counterparts with only a high school diploma or GED. 28 While this does not mean that Career Academies can or should serve as a substitute for postsecondary education for young men, the comparison helps frame the magnitude of the labor market impacts for young men. The Career Academies impacts on labor market outcomes for young women varied somewhat over time but, on average, are not statistically significant. 26 Young men in the study s Academy group earned an average of $35,304 (2006 dollar values) during the eighth year following scheduled graduation from high school. This compares with $31,576 (2006 dollar values) during 1999 for young men with similar background characteristics from the National Education Longitudinal Study of 1988 (NELS:88/2000) who also attended urban, public high schools. This is based on MDRC calculations from the NELS:88 database. See Unit 2 of the Technical Resources for this report (Kemple and Willner, 2008) for a description of the analyses that form the basis of these findings. 27 Marcotte, Bailey, Borkoski, and Kienzl (2005) analyzed data from the NELS:88/2000 database to estimate the contribution of various levels of postsecondary education (controlling for work experience, urbanicity, ethnicity, high school dropout/ged status, and other demographics) on earnings in 1999, eight years after the sample was scheduled to graduate from high school. Due to data limitations, the analysis excluded sample members whose first enrollment in a postsecondary institution occurred more than two years after their scheduled graduation from high school. 28 These numbers are based on 2006 American Community Survey (ACS) public use files from the U.S. Census Bureau and include men who were not employed in (Calculations were performed by Andrew Sum, Northeastern University, Center for Labor Market Studies.) 20
35 Monthly Earnings (2006 Dollars) Monthly Earnings (2006 Dollars) Career Academies Evaluation H:\K12\CA\Report 7\Publications\Round1_Edits\Ex.5-GENDER monthly linegraphs.xls, 6/16/08, CW Exhibit 5 Month-by-Month Impacts on Total Monthly Earnings, by Gender Young Men 3,200 2,800 2,400 2,000 1,600 1, Months after scheduled high school graduation date Young Women 3,200 2,800 2,400 2,000 1,600 1, Months after scheduled high school graduation date Impact Academy Group Non-Academy Group (continued) SOURCES: MDRC calculations from the Career Academies Evaluation Four-Year and Eight-Year Post-High School Follow-Up Surveys. 21 NOTES: Earnings are reported in 2006 dollars. Measures reflect the 96-month period following scheduled high school graduation for each sample member (Month 0 is June of the scheduled graduation year). Measures for Months 1 to 48 are derived from the Four-
36 Exhibit 5 (continued) SOURCES: MDRC calculations from the Career Academies Evaluation Four-Year and Eight-Year Post-High School Follow-Up Surveys. NOTES: Earnings are reported in 2006 dollars. Measures reflect the 96-month period following scheduled high school graduation for each sample member (Month 0 is June of the scheduled graduation year). Measures for Months 1 to 48 are derived from the Four- Year Post-High School Follow-Up Survey sample (young men: N = 604; young women: N = 854). Measures for Months 49 to 96 are derived from the Eight-Year Post-High School Follow-Up Survey sample (young men: N = 587; young women: N = 841). The dotted line at Month 48 illustrates the cutpoint between the Four-Year and Eight-Year Post-High School Follow-Up Survey samples. Impact estimates are regression-adjusted to control for background characteristics of the sample and for the clustering of students within schools and random assignment years. Values shown for the Academy group are unadjusted mean values; values shown for the non-academy group are calculated by subtracting the impact estimate from the Academy group s unadjusted mean values. A two-tailed t-test was applied to differences between the Academy and non-academy groups. Differences in monthly earnings are significant at a level of 10 percent or less in 73 of the 96 months for young men and in 6 of the 96 months for young women. Exhibit 4 and the bottom graph in Exhibit 5 depict substantially different patterns of labor market outcomes and impacts for young women in the study sample, compared with those for the young men. First, Exhibit 4 shows that monthly earnings and each of the components of monthly earnings were lower for young women in the sample than for young men (see Exhibit 3). This was true in both the Academy and the non-academy group. For example, over the eight-year follow-up period, young men in the non-academy group earned an average of $403 more per month than young women in the non-academy group. This accumulated to nearly $39,000 (29 percent) more in earnings for young men than young women in the non-academy group. The gender difference in the Academy group was even larger: During the 96-month follow-up period, young men in the Academy group earned about $60,000 (43 percent) more than young women in the Academy group. The difference in average monthly earnings between young men and young women was due, in large part, to differences in employment patterns. Comparing Exhibits 3 and 4 shows that the young women in both groups worked during fewer months and that they worked fewer hours per week than did the young men; there are also gender differences in hourly wages. Finally, as shown in Exhibit 5, real monthly earnings for young men increased much more steeply than they did for young women over the follow-up period. Exhibit 4 shows, on average, that the Academies produced consistently positive but not statistically significant impacts on labor market outcomes for young women. Average monthly earnings and hourly wages were only slightly higher for young women in the Academy group than for young women in the non-academy group, and there was no difference in 22
37 months employed or hours worked per week. 29 It should be noted that differences in impacts between young men and young women are statistically significant during the first four years of the follow-up period but are not statistically significant during the last four years of the follow-up up period. In other words, although impacts on monthly earnings were larger in magnitude for the young men, the margin of error around the difference in impacts was even larger, at least in the last four years of the follow-up period. This indicates that the differences in impacts could be due to chance. Nonetheless, a consistent pattern of positive and statistically significant impacts for young men but not for young women indicates that the program s impact on labor market outcomes is concentrated among young men. It is not clear why the Career Academies had only a marginal impact on labor market outcomes for young women. The evaluation did not find evidence that the Career Academy experience was systematically different for young women than for young men. Nor does it appear that the Career Academies had systematically different impacts on the high school experiences of young women and young men. One hypothesis, however, is that the lack of post-high school labor market impacts for young women may be an artifact of their somewhat shorter and more intermittent employment spells associated with having children or attending postsecondary education programs. This will be explored in nonexperimental analyses to be presented in a future paper. Differences in impacts on labor market outcomes among three subgroups defined by students risk of dropping out narrowed over time. The most consistently positive impacts accrued to the high-risk subgroup. Because prior reports from this evaluation focused on the impacts that Career Academies had on educational outcomes, they examined three subgroups defined by background 29 These estimates are averaged across the four-year and eight-year follow-up samples of young women (N = 854 and 841, respectively). The pattern of impacts obtained using the common overlapping sample of young women from the two follow-up surveys (N = 762) is similar to that obtained using the separate survey samples, although the size of the earnings impact for the last four years is slightly larger and statistically significant at the 10 percent level. For the common sample, the Career Academies produced an increase in young women s earnings of $37 per month during the first four years of follow-up and $149 per month during the last four years. Over the entire eight-year follow-up period, the Career Academies produced an impact of $93 per month for young women, which amounts to an increase of $1,117 per year and an accumulated $8,935 over all eight years (in 2006 dollars). The earnings impacts for the last four years and averaged across all eight years are statistically significant at the 10 percent level for this sample. Unit 1 of the Technical Resources for this report (Kemple and Willner, 2008) includes additional details about the robustness of the earnings impacts across samples. 23
38 characteristics that are associated with dropping out of high school. 30 The student populations in Career Academies tend to reflect the ethnic, gender, and socioeconomic characteristics of their host high schools, which were diverse. However, little is known about the relative effectiveness of Academies for key subgroups. For example, some students who applied for Academies at the end of the eighth or ninth grade were already highly engaged in school. The Academies aspired to prepare these students for college and to provide them with career-related learning experiences and credentials that would make them more competitive in the labor market. At the other extreme, some Academy applicants were already on a path toward dropping out or having their education end with high school. Academies hoped to reengage such students, providing them with more applied learning experiences and encouraging them to develop higher aspirations for both education and employment. In order to learn more about the suitability of the Academy approach for meeting the needs of students in different subgroups, the study examined three risk subgroups, which are defined below. Each of the characteristics used to define these subgroups was measured at the time that students applied for a Career Academy that is, before they were randomly selected to be in the Academy or the non-academy group. 31 High-risk subgroup: Students in the study sample (approximately 25 percent of both the Academy and the non-academy group) who had the combination of characteristics, measured prior to random assignment, that are associated with the highest likelihood of dropping out Medium-risk subgroup: Students in the study sample (approximately 50 percent of both the Academy and the non-academy group) who had characteristics, measured prior to random assignment, indicating that they were not particularly likely to drop out but were not highly engaged in school Low-risk subgroup: Students in the study sample (approximately 25 percent of both the Academy and the non-academy group) who had the combination of characteristics, measured prior to random assignment, that are associated with the lowest likelihood of dropping out 30 Unit 5 of the Technical Resources for this report (Kemple and Willner, 2008) provides detailed impact findings for the risk subgroups in the study sample. 31 The definition of these subgroups is based on analyses using background characteristics to predict dropping out among students in the non-academy group. These analyses yielded an index that expresses dropout risk as the weighted average of selected background characteristics, including eighth-grade attendance rates and grades, falling behind on progress toward graduation, being retained in a prior grade, having transferred schools two or more times, and having a sibling who dropped out of high school. For a detailed discussion of the method used to define the risk subgroups, see Kemple and Snipes (2000). 24
39 Exhibit 6 shows the impacts that Career Academies had on average monthly earnings over the eight-year follow-up period for each of the risk subgroups. It indicates that the Career Academies produced impacts on monthly earnings for all three subgroups at various points in the follow-up period. Impacts on average monthly earnings (and on many of the components of earnings) are statistically significant for the high- and medium-risk subgroups during the first four years of the follow-up period. During the last four years, impacts on average monthly earnings are statistically significant for the high- and low-risk subgroups. For the high-risk subgroup, the Academies increased real earnings by an average of $237 per month over the course of the eight-year follow-up period, or 17 percent, compared with the non-academy group s average monthly earnings of $1,436. Impacts on monthly earnings for the medium- and low-risk subgroups averaged about 10 percent. Overall, however, differences in impacts on monthly earnings across the three risk subgroups are not statistically significant. Thus, differences in impacts across the subgroups may be due to chance. Impacts on Educational Attainment This section of the report focuses on sample members educational attainment through the end of the eight-year follow-up period. The key outcomes include high school completion status and postsecondary education enrollment and completion. High school completion statuses include receipt of a high school diploma and receipt of a General Educational Development certificate (GED). Postsecondary programs include bachelor s degree programs, associate s degree programs, and training certificate or licensing programs. To help place the educational attainment levels of the young people who are in the study sample in context, this section of the report offers a comparison with the educational attainment levels eight years after scheduled high school graduation for a representative sample of similar students from urban school districts across the country. The section then proceeds to a discussion of educational impacts for the subgroups of young men and young women. It concludes with a brief review of the impacts on educational attainment for subgroups defined by the background characteristics associated with the risk of dropping out of high school. Overall, the Career Academies had no impact (positive or negative) on high school completion rates, although the rates were higher than national averages. The left side of Exhibit 7 shows the high school completion status of students in the Academy and non-academy groups. Approximately 84 percent of the students in both 25
40 Monthly Earnings (2006 Dollars) Monthly Earnings (2006 Dollars) Monthly Earnings (2006 Dollars) Career Academies Evaluation H:\K12\CA\Report 7\Publications\Round2_Edits\Ex.6-RISK monthly earnings.xls, 6/18/08, CW Exhibit 6 Month-by-Month Impacts on Total Monthly Earnings, by Risk Subgroup 3,200 2,800 2,400 2,000 1,600 1, ,200 2,800 2,400 2,000 1,600 1, ,200 2,800 2,400 2,000 1,600 1, High Risk Months after scheduled high school graduation date Medium Risk Months after scheduled high school graduation date Low Risk Months after scheduled high school graduation date Impact Academy Group Non-Academy Group (continued) SOURCES: MDRC calculations from the Career Academies Evaluation Four-Year and Eight-Year Post-High School Follow-Up Surveys. 26
41 Exhibit 6 (continued) SOURCES: MDRC calculations from the Career Academies Evaluation Four-Year and Eight-Year Post-High School Follow-Up Surveys. NOTES: Earnings are reported in 2006 dollars. Measures reflect the 96-month period following scheduled high school graduation for each sample member (Month 0 is June of the scheduled graduation year). Measures for Months 1 to 48 are derived from the Four- Year Post-High School Follow-Up Survey sample (high risk: N = 360; medium risk: N = 722; low risk: N = 376). Measures for Months 49 to 96 are derived from the Eight-Year Post-High School Follow-Up Survey sample (high risk: N = 343; medium risk: N = 721; low risk: N = 364). The dotted line at Month 48 illustrates the cutpoint between the Four-Year and Eight-Year Post-High School Follow-Up Survey samples. Impact estimates are regression-adjusted to control for background characteristics of the sample and for the clustering of students within schools and random assignment years. Values shown for the Academy group are unadjusted mean values; values shown for the non-academy group are calculated by subtracting the impact estimate from the Academy group s unadjusted mean values. A two-tailed t-test was applied to differences between the Academy and non-academy groups. Differences in monthly earnings are significant at a level of 10 percent or less in 37 of the 96 months for the high-risk subgroup, in 39 of the 96 months for the medium-risk subgroup, and in 22 of the 96 months for the low-risk subgroup. groups had earned a high school diploma, and an additional 10 to 12 percent had received a GED. 32 To help place these outcome levels in a broader context, the right side of Exhibit 7 shows the high school completion status of a nationally representative group of students who had similar background characteristics and who came from school districts that are similar to those represented in the study sample. 33 The figure illustrates several important points about the performance of students in the study sample and about the conclusions one 32 Unit 3 of the Technical Resources for this report (Kemple and Willner, 2008) provides detailed findings on the Career Academies impacts on educational outcomes for the full study sample. Differences between estimates presented in this report and those presented in previous reports may be due to differences in sample composition and to attempts to reconcile conflicting reports about the specific timing of the credentials that sample members earned. 33 The percentages on the right side of Exhibit 7 are based on a sample of students from the National Education Longitudinal Study (NELS) of 1988 through 2000 (Curtin et al., 2002). NELS administered surveys in 1988, 1990, 1992, 1994, and 2000 to a nationally representative group of students who were eighth-graders in the spring of 1988 and who were scheduled to graduate from high school in Because virtually all the students in the non-academy group completed the ninth grade, the analyses presented here include only students from the NELS sample who were tenth-graders in 1990 (that is, who did not drop out before the tenth grade). Also, to maintain comparability with the schools in the Career Academies Evaluation, only NELS students from nonselective public comprehensive high schools in urban school districts were included in the comparisons presented here. The values are regression-adjusted and mean-centered to reflect outcomes for students who had the same distribution of background characteristics as students in the Career Academies Evaluation sample. For a more detailed description of the analyses that form the basis of these findings, see Unit 2 of the Technical Resources for this report (Kemple and Willner, 2008). 27
42 Percentage of Sample Members Career Academies Evaluation Exhibit 7 High School Completion Rates Eight Years After Scheduled Graduation for the Evaluation Sample and the NELS Sample 95.8 Evaluation Sample NELS Sample of Urban Public Schools Academy Group Non-Academy Group All Urban, Public, Nonselective High Schools Graduated on time Graduated late Earned a GED SOURCES: MDRC calculations from the Career Academies Evaluation One-Year, Four-Year, and Eight-Year Post-High School Follow-Up Surveys and the National Education Longitudinal Study (NELS), , publicuse data files. NOTES: All measures reflect completion status eight years after scheduled high school graduation. Students were considered on-time high school graduates if they received their diploma by the end of June in the year they were scheduled to graduate. Measures for the evaluation sample are derived from the full Eight-Year Post-High School Follow-Up Survey sample (N = 1,428). Measures for the NELS sample are derived from the sample of youth who attended urban, public, nonselective high schools and who responded to all four waves of NELS postbaseline follow-up surveys (N = 2,042). The NELS estimates incorporate weights that account for nonresponse and project to the population of students who were enrolled in tenth grade in In addition, the NELS estimates are adjusted to reflect a sample of students with the same distribution of background characteristics as the non-academy eight-year follow-up evaluation sample. No tests of statistical significance were performed on differences between the evaluation sample and the NELS sample. Impact estimates for the evaluation sample are regression-adjusted to control for background characteristics of the sample and for the clustering of students within schools and random assignment years. Values shown for the Academy group are unadjusted mean values; values shown for the non-academy group are calculated by subtracting the impact estimate from the Academy group s unadjusted mean values. A two-tailed t-test was applied to differences between the Academy and non-academy groups within each category. There are no statistically significant differences in rates of high school graduation (overall, on-time, or late) or GED receipt. Rounding may cause slight discrepancies in calculating sums and differences. 28
43 should or should not draw from these outcome levels. For example, students in both the Academy and the non-academy group were substantially more likely to graduate from high school on time than similar students from similar districts across the country. Most notably, approximately 75 percent of the Academy group graduated from high school on time, compared with only 65 percent of similar students from similar school districts nationally. Though not shown in the exhibit, this difference is even more dramatic when comparing students in the evaluation sample with students in the national sample who reported being enrolled in the general curriculum track of their high school the option typically taken by students in the study s non-academy group. 34 If the evaluation were only able to compare the performance of students in the Academy group with the performance of similar students from similar high schools across the country, one might be led to the conclusion that the Career Academies produced meaningful increases in high school graduation rates. In fact, however, the differences in high school completion rates are due to differences in other characteristics that are associated with the students initial motivation to apply for a Career Academy program. In short, Exhibit 7 illustrates that the Career Academies did not have an impact (positive or negative) on high school completion rates. At the same time, the completion rates (particularly on-time graduation rates) for students in both the Academy and the non- Academy group would be considered high relative to national averages for similar students in similar schools. This suggests that Career Academies may have been attracting somewhat better prepared or more highly motivated students, as seen by superior performance by both the Academy and the non-academy group, in relation to similar students in a nationally representative sample of similar urban public schools. Thus, the Career Academies served as a viable strategy to keep students on course toward high school completion, although they were not better at this than the alternatives available in the high schools and communities where they were located. Overall, the Career Academies had no impact (positive or negative) on postsecondary education enrollment and attainment rates. Exhibit 8 shows the percentage of Academy and non-academy group members who had completed a postsecondary education credential by the end of the eight-year post-high school follow-up period. By the end of the follow-up period, about 50 percent of the Academy group had earned a postsecondary credential. In all, 16 percent had completed a bachelor s degree or higher; 12 percent had completed a two-year associate s degree; and 22 per- 34 See Unit 2 of the Technical Resources for this report (Kemple and Willner, 2008). 29
44 Percentage of Sample Career Academies Evaluation H:\K12\CA\Report 7\Publications\Round2_Edits\Ex.8-FULL post-sec.xlsx, 6/18/08, CW Exhibit 8 Highest Postsecondary Credential Completed Eight Years After Scheduled High School Graduation for the Evaluation Sample and the NELS Sample Academy Group Evaluation Sample Non-Academy Group NELS Sample of Urban Public Schools All Urban, Public, Nonselective High Schools Certificate/license Associate s degree Bachelor s degree or higher 5.7 SOURCES: MDRC calculations from the Career Academies Evaluation Eight-Year Post-High School Follow-Up Survey and the National Education Longitudinal Study (NELS), , public-use data files. NOTES: All measures reflect completion status at the time of the interview. Interviews for the evaluation sample began in June of the eighth calendar year following scheduled high school graduation (Month 96, assuming a June graduation) and extended through December of that year. Interviews for the NELS sample began in January of the eighth calendar year following scheduled high school graduation (Month 91, assuming a June graduation) and extended through September of that year. Thus, the NELS sample estimates may exclude some programs that were completed between January and June of the eighth year following scheduled high school graduation, whereas the evaluation sample estimates include all programs completed by June of the eighth year. Some sample members who have completed a certificate or license have not earned a high school diploma or GED. Measures for the evaluation sample are derived from the full Eight-Year Post-High School Follow-Up Survey sample (N = 1,428). Measures for the NELS sample are derived from the sample of youth who attended urban, public, nonselective high schools and who responded to all four waves of NELS postbaseline follow-up surveys (N = 2,042). The NELS estimates incorporate weights that account for nonresponse and project to the population of students who were enrolled in tenth grade in In addition, the NELS estimates are adjusted to reflect a sample of students with the same distribution of background characteristics as the non-academy eight-year follow-up evaluation sample. No tests of statistical significance were performed on differences between the evaluation sample and the NELS sample. (continued) Impact estimates for the evaluation sample are regression-adjusted to control for background characteristics of the sample and for the clustering of students within schools 30 and random assignment years. Values shown for the Academy group are unadjusted mean values; values shown for the non-academy group are calculated by subtracting the impact estimate from the Academy group s unadjusted mean values. A two-tailed t-test was
45 Exhibit 8 (continued) Impact estimates for the evaluation sample are regression-adjusted to control for background characteristics of the sample and for the clustering of students within schools and random assignment years. Values shown for the Academy group are unadjusted mean values; values shown for the non-academy group are calculated by subtracting the impact estimate from the Academy group s unadjusted mean values. A two-tailed t-test was applied to differences between the Academy and non-academy groups within each category. There are no statistically significant differences in the highest postsecondary credential completed. Rounding may cause slight discrepancies in calculating sums and differences. cent had earned a skills training certificate or license. The non-academy group had similar educational outcomes, and none of the minor differences between the Academy group and the non-academy group is statistically significant. Though not shown in the exhibit, roughly 20 percent of sample members in both groups were still enrolled in a postsecondary program at the end of the follow-up period. The postsecondary completion rates for the study sample are quite high compared with national averages for similar students from similar urban school districts. Exhibit 8 indicates that 50 percent of the students in the Academy and non-academy groups had earned a postsecondary credential within eight years of scheduled high school graduation, compared with 28 percent of similar students nationally. Both the Academy group and the non-academy group outpaced similar students nationally in each of the three categories of postsecondary credentials. Note that this does not imply that the participating high school and their Career Academies are better at preparing students for postsecondary education than the average urban high school. Rather, the difference in attainment levels is due, in large part, to the Academies attracting students who are likely to do well regardless of whether they end up in an Academy program. Educational attainment levels and impacts were generally similar for young men and young women in the study sample. The Career Academies did not have systematic impacts on educational attainment for either young men or young women, although over 80 percent of both groups earned a high school diploma, and roughly 50 percent earned a postsecondary credential. Exhibit 9 shows the Career Academy impacts on high school completion status and on postsecondary education credentials earned as of the end of the eight-year post-high 31
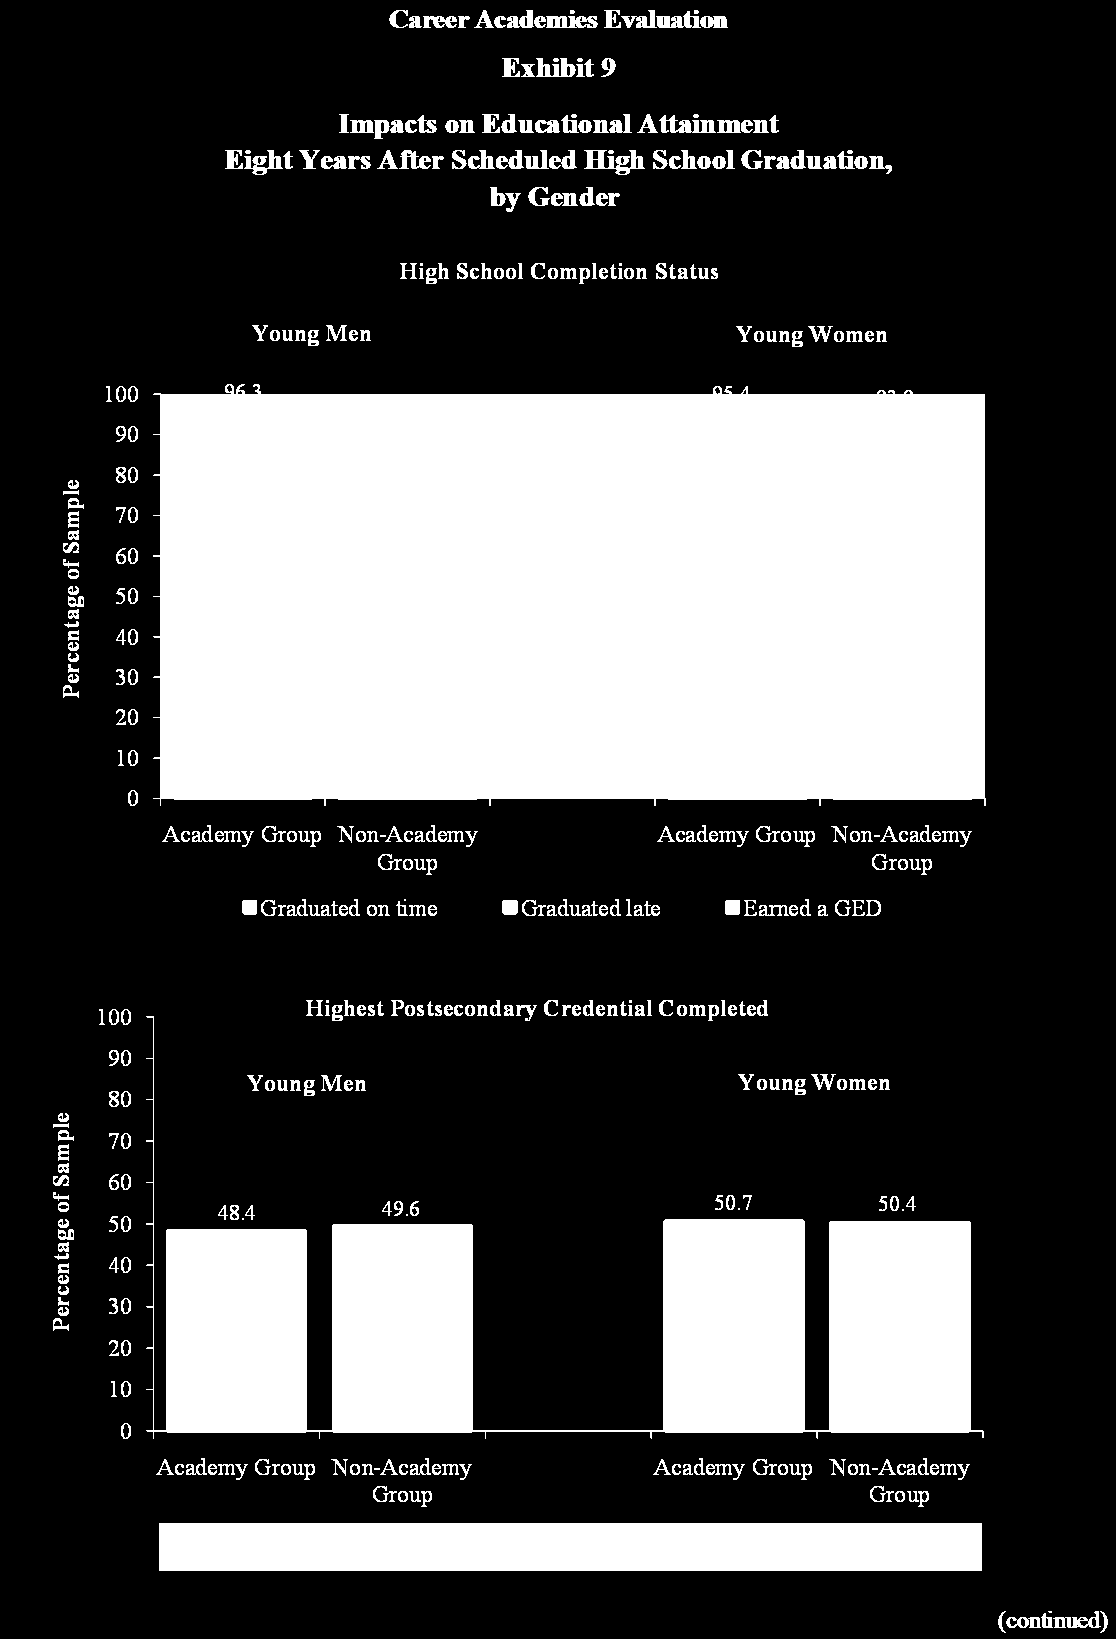
46 32
Since 2010, MDRC has released
 Headed to College The s of New York City s Small High Schools of Choice on Postsecondary Enrollment By Rebecca Unterman p o l i c y b r i e f O c t o b e r 2 0 1 4 Since 2010, MDRC has released three research
Meeting Five Critical Challenges of High School Reform
 Meeting Five Critical Challenges of High School Reform LESSONS FROM RESEARCH ON THREE REFORM MODELS Janet Quint May 2006 mdrc BUILDING KNOWLEDGE TO IMPROVE SOCIAL POLICY Meeting Five Critical Challenges
mdrc Evidence from the Talent Development High School Model James J. Kemple Corinne M. Herlihy Thomas J. Smith MAKING PROGRESS TOWARD GRADUATION
 MAKING PROGRESS TOWARD GRADUATION Evidence from the Talent Development High School Model James J. Kemple Corinne M. Herlihy Thomas J. Smith mdrc BUILDING KNOWLEDGE TO IMPROVE SOCIAL POLICY Making Progress
Meeting Five Critical Challenges of High School Reform
 Meeting Five Critical Challenges of High School Reform LESSONS FROM RESEARCH ON THREE REFORM MODELS Janet Quint May 2006 mdrc BUILDING KNOWLEDGE TO IMPROVE SOCIAL POLICY Meeting Five Critical Challenges
High School Career Academies: A 40-Year Proven Model for Improving College and Career Readiness
 High School Career Academies: A 40-Year Proven Model for Improving College and Career Readiness By Betsy Brand Executive Director, American Youth Policy Forum Commissioned by The National Career Academy
Learning Communities for Students in Developmental Reading
 Learning Communities for Students in Developmental Reading An Impact Study at Hillsborough Community College Michael J. Weiss Mary G. Visher Heather Wathington JUNE 2010 THE LEARNING COMMUNITIES DEMONSTRATION
Public Housing and Public Schools: How Do Students Living in NYC Public Housing Fare in School?
 Furman Center for real estate & urban policy New York University school of law wagner school of public service november 2008 Policy Brief Public Housing and Public Schools: How Do Students Living in NYC
CENTER FOR LABOR MARKET STUDIES
 The Complete Breakdown in the High Schoolto Work Transition of Young, Non College Enrolled High School Graduates in the U.S.; The Need for an Immediate National Policy Response Prepared by: Andrew Sum
The Condition of New York City High Schools: Examining Trends and Looking Toward the Future
 DATA BRIEF The Condition of New York City High Schools: Examining Trends and Looking Toward the Future James J. Kemple March 2013 1 Overview Until the turn of the 21 st century, high school graduation
The Early Employment and Further Education Experiences of High School Dropouts: A Comparative Study of the United States and Australia
 The Early Employment and Further Education Experiences of High School Dropouts: A Comparative Study of the United States and Australia Russell W. Rumberger University of California, Santa Barbara Stephen
Women, Wages and Work A report prepared by the UNC Charlotte Urban Institute for the Women s Summit April 11, 2011
 A report prepared by the UNC Charlotte Urban Institute for the Women s Summit April 11, 2011 A report prepared for the Women s Summit by the UNC Charlotte Urban Institute 1 Table of Contents Table of Contents...
MORE GUIDANCE, BETTER RESULTS?
 OPENING DOORS MORE GUIDANCE, BETTER RESULTS? Three-Year Effects of an Enhanced Student Services Program at Two Community Colleges Susan Scrivener Michael J. Weiss AUGUST 2009 mdrc BUILDING KNOWLEDGE TO
Workforce Training Results Report December 2008
 Report December 2008 Community and Technical Colleges (CTC) Job Preparatory Training Washington s 34 community and technical colleges offer job preparatory training that provides students with skills required
Courses to Employment: Sectoral Approaches to Community College-Nonprofit Partnerships
 Courses to Employment: Sectoral Approaches to Community College-Nonprofit Partnerships Initial Education and Employment Outcomes Findings for Students Enrolled In the Security Officer Training Academy
Measuring High School Graduation and Dropout Rates in the Boston Public Schools: The Findings of Alternative Estimating Methodologies
 Measuring High School Graduation and Dropout Rates in the Boston Public Schools: The Findings of Alternative Estimating Methodologies Prepared by: Andrew Sum Joseph McLaughlin Jacqui Motroni With Ishwar
Policy Brief College Access and Retention of Career and Technical Education Graduates
 Prepared by Paul E. Harrington and Neeta P. Fogg, Center for Labor Market Studies, Northeastern University, and Christine Shaw, Shawsheen Valley Regional Technical High School, in collaboration with the
Striving for Student Success
 Striving for Student Success The Effect of Project GRAD on High School Student Outcomes in Three Urban School Districts Jason C. Snipes Glee Ivory Holton Fred Doolittle Laura Sztejnberg July 2006 Striving
Charting a Path to Graduation
 Executive Summary Charting a Path to Graduation The Effect of Project GRAD on Elementary School Student Outcomes in Four Urban School Districts Jason C. Snipes Glee Ivory Holton Fred Doolittle July 2006
Getting Ready for Success: Bridging the Gap between High School and College in Tacoma, Washington
 Getting Ready for Success: Bridging the Gap between High School and College in Tacoma, Washington Prepared for the 2012 National Center for Postsecondary Research Conference Susan Sepanik MDRC June 2012
THE EDUCATIONAL PROGRESS OF BLACK STUDENTS
 NATIONAL CENTER FOR EDUCATION STATISTICS Findings from THE CONDITION OF EDUCATION 1994 NO. 2 THE EDUCATIONAL PROGRESS OF BLACK STUDENTS U.S. Department of Education Office of Educational Research and Improvement
Prepared Testimony by. Algernon Austin Director Program on Race, Ethnicity and the Economy Economic Policy Institute
 Prepared Testimony by Algernon Austin Director Program on Race, Ethnicity and the Economy Economic Policy Institute Before the U.S. House of Representatives Committee on Education and Labor Ensuring Economic
Taking Stock of the California Linked Learning District Initiative
 Taking Stock of the California Linked Learning District Initiative Fourth-Year Evaluation Report Executive Summary SRI International Taking Stock of the California Linked Learning District Initiative Fifth-Year
Having a college degree is increasingly
 More Graduates Two-Year Results from an Evaluation of Accelerated Study in Associate Programs (ASAP) for Developmental Education Students By Susan Scrivener and Michael J. Weiss P O L I C Y B R I E F D
Economic inequality and educational attainment across a generation
 Economic inequality and educational attainment across a generation Mary Campbell, Robert Haveman, Gary Sandefur, and Barbara Wolfe Mary Campbell is an assistant professor of sociology at the University
Research Report No. 06-2
 Research Report No. 06-2 Washington State Board for Community and Technical Colleges Building Pathways to Success for Low-Skill Adult Students: Lessons for Community College Policy and Practice from a
The Condition of College & Career Readiness l 2011
 The Condition of College & Career Readiness l 2011 ACT is an independent, not-for-profit organization that provides assessment, research, information, and program management services in the broad areas
ETS s Addressing Achievement Gaps Symposium. Black Male Teens: Moving to Success in the High School Years. A Statistical Profile
 ETS s Addressing Achievement Gaps Symposium Black Male Teens: Moving to Success in the High School Years A Statistical Profile ETS s Addressing Achievement Gaps Symposium Black Male Teens: Moving to Success
The MetLife Survey of
 The MetLife Survey of Preparing Students for College and Careers Part 2: Teaching Diverse Learners The MetLife Survey of the American Teacher: Preparing Students for College and Careers The MetLife Survey
Prepared by: Andrew Sum Walter McHugh Jacqui Motroni Sheila Palma. Center for Labor Market Studies Northeastern University Boston, Massachusetts
 High School Graduation Outcomes and College Enrollment Plans of Class of 2009 High School Students by Gender in The City of Boston and Selected Large Urban and Affluent School Districts Across the State
Strategies for Promoting Gatekeeper Course Success Among Students Needing Remediation: Research Report for the Virginia Community College System
 Strategies for Promoting Gatekeeper Course Success Among Students Needing Remediation: Research Report for the Virginia Community College System Josipa Roksa Davis Jenkins Shanna Smith Jaggars Matthew
WORKING DRAFT. Building On-Track Indicators for High School Graduation and College. Readiness: Evidence from New York City
 Running head: BUILDING ON-TRACK INDICATORS WORKING DRAFT Building On-Track Indicators for High School Graduation and College Readiness: Evidence from New York City James J. Kemple, Micha D. Segeritz, and
A Study of Career Patterns of the Presidents of Independent Colleges and Universities
 A Study of Career Patterns of the Presidents of Independent Colleges and Universities Harold V. Hartley III Eric E. Godin A Study of Career Patterns of the Presidents of Independent Colleges and Universities
It s Time to Save for Retirement. The Benefit of Saving Early and the Cost of Delay
 It s Time to Save for Retirement The Benefit of Saving Early and the Cost of Delay November 2014 About the Insured Retirement Institute: The Insured Retirement Institute (IRI) is the leading association
Going Nowhere Workers Wages since the Mid-1970s
 Going Nowhere Workers Wages since the Mid-1970s I n the late 1990s, many observers hoped that we had finally broken free of the slow income growth that had bogged down the American middle class for more
mdrc GUIDING DEVELOPMENTAL MATH STUDENTS TO CAMPUS SERVICES An Impact Evaluation of the Beacon Program at South Texas College
 GUIDING DEVELOPMENTAL MATH STUDENTS TO CAMPUS SERVICES An Impact Evaluation of the Beacon Program at South Texas College Mary G. Visher Kristin F. Butcher Oscar S. Cerna February 2010 mdrc BUILDING KNOWLEDGE
Health Coverage among 50- to 64-Year-Olds
 Health Coverage among 50- to 64-Year-Olds In 2005, more than 51 million Americans were age 50 64. This number is projected to rise to 58 million in 2010, when the first baby boomers turn 64. The aging
Youth Career Development
 GUIDE TO GIVING Youth Career Development HOW TO USE THIS GUIDE STEP 1 EDUCATION AND YOUTH DEVELOPMENT Understanding the Recommended Approach to Youth Career Development Are you interested in youth career
Learning Communities for Students in Developmental Math
 Learning Communities for Students in Developmental Math Impact Studies at Queensborough and Houston Community Colleges Evan Weissman Kristin F. Butcher Emily Schneider Jedediah Teres Herbert Collado David
Community Colleges. Measuring Internationalization. AMERICAN COUNCIL ON EDUCATION The Unifying Voice for Higher Education
 Measuring Internationalization at Community Colleges Funded by the Ford Foundation AMERICAN COUNCIL ON EDUCATION The Unifying Voice for Higher Education Center for Institutional and International Initiatives
Participation in Postsecondary Remedial Education
 1 Participation in Postsecondary Remedial Education Summary Participation in postsecondary remedial education in the first year of college is a key measure demonstrating students readiness to do college-level
Higher Performing High Schools
 COLLEGE READINESS A First Look at Higher Performing High Schools School Qualities that Educators Believe Contribute Most to College and Career Readiness 2012 by ACT, Inc. All rights reserved. A First Look
The value of apprenticeships: Beyond wages
 The value of apprenticeships: Beyond wages NIDA BROUGHTON June 2016 There is strong political commitment to the apprenticeships programme as a part of the strategy to achieve a high quality workforce that
Student Loan Market Trends Is College Worth It. Presenter: Kelly Savoie, Director Business Development April 2016
 Student Loan Market Trends Is College Worth It Presenter: Kelly Savoie, Director Business Development April 2016 Agenda This presentation is an overview of trends in the industry and the value of a college
Atlanta College and Career Academy Frequently Asked Questions DRAFT 1. General Questions
 Atlanta College and Career Academy Frequently Asked Questions DRAFT 1. General Questions 1.1. What is a College and Career Academy? Modern approach to technical and vocational education as well as a national
Comparing the Effects of Online and Face-to-Face Credit Recovery in Algebra I
 Getting Back on Track Comparing the Effects of Online and Face-to-Face Credit Recovery in Algebra I RESEARCH BRIEF 1 April 2016 AUTHORS OF THIS RESEARCH BRIEF are Jessica Heppen (American Institutes for
Career and Technical Education HETL Annotated Bibliography February 27, 2010
 Career and Technical Education HETL Annotated Bibliography February 27, 2010 Afterschool Alliance: Afterschool for All. (2009). Afterschool programs: Making a difference in America's communities by improving
Making Jobs Good. John Schmitt and Janelle Jones. April 2013
 Making Jobs Good John Schmitt and Janelle Jones April 2013 Center for Economic and Policy Research 1611 Connecticut Avenue, NW, Suite 400 Washington, D.C. 20009 202-293-5380 www.cepr.net CEPR Making Jobs
A New Measure of Educational Success in Texas. Tracking the Success of 8th Graders into and through College
 A New Measure of Educational Success in Texas Tracking the Success of 8th Graders into and through College National Center for Management Systems (NCHEMS) Contents Introduction 1 The Challenge 2 Purpose
College Enrollment Hits All-Time High, Fueled by Community College Surge
 Enrollment Hits All-Time High, Fueled by Community Surge FOR RELEASE: OCTOBER 29, 2009 Paul Taylor, Project Director Richard Fry, Senior Researcher Wendy Wang, Research Associate Daniel Dockterman, Research
The Collapse of the Labor Market for 16 to 24 Year Olds
 The Collapse of the Labor Market for 16 to 24 Year Olds By Neeta P. Fogg, Research Professor, Center for Labor Markets and Policy, Drexel University, and Paul E. Harrington, Director, Center for Labor
Encouraging Evidence on a Sector-Focused Advancement Strategy
 PREVIEW SUMMARY Encouraging Evidence on a Sector-Focused Advancement Strategy Two-Year Impacts from the WorkAdvance Demonstration Richard Hendra David H. Greenberg Gayle Hamilton Ari Oppenheim Alexandra
Unlocking Doors and Expanding Opportunity:
 K-12 Policy Unlocking Doors and Expanding Opportunity: Moving Beyond the Limiting Reality of College and Career Readiness in California High Schools July 2011 To meet California s demand for a more educated
Educational Attainment in the United States: 2015
 Educational Attainment in the United States: 215 Population Characteristics Current Population Reports By Camille L. Ryan and Kurt Bauman March 216 P2-578 This report provides a portrait of educational
Career and Technical Education: Research Roundup
 Career and Technical Education: Research Roundup BY EDUTOPIA STAFF Career academies have been around in one form or another for four decades, but these days they're in a groove. It's not often in education
Factors affecting bachelor s degree completion among Black males with prior attrition
 Factors affecting bachelor s degree completion among Black males with prior attrition ABSTRACT Rayna Matthews-Whetstone Richardson, Texas ISD Joyce A. Scott Texas A&M University-Commerce Black males lag
The MetLife Survey of
 The MetLife Survey of Challenges for School Leadership Challenges for School Leadership A Survey of Teachers and Principals Conducted for: MetLife, Inc. Survey Field Dates: Teachers: October 5 November
Test-Score Effects of School Vouchers in Dayton, Ohio, New York City, and Washington, D. C.: Evidence from Randomized Field Trials
 Test-Score Effects of School Vouchers in Dayton, Ohio, New York City, and Washington, D. C.: Evidence from Randomized Field Trials by William G. Howell Assistant Professor, Department of Political Science,
School Counseling in Michigan
 The College Board National Office for School Counselor Advocacy (NOSCA) School Counseling in Michigan A College Board 2011 National Survey of School Counselors State Brief A Brief for the College Board
The Condition of College & Career Readiness 2013. National
 The Condition of College & Career Readiness 2013 National 2013 by ACT, Inc. All rights reserved. The ACT college readiness assessment is a registered trademark of ACT, Inc., in the U.S.A. and other countries.
Minorities in the Tenth District: Are They Ready for the Jobs of the Future?
 7 Minorities in the Tenth District: Are They Ready for the Jobs of the Future? Chad R. Wilkerson, Assistant Vice President and Oklahoma City Branch Executive and Megan D. Williams, Associate Economist
Women and Men in the Recovery: Where the Jobs Are Women Recover Jobs Lost in Recession in Year Five
 IWPR #C426 November 2014 Women and Men in the Recovery: Where the Jobs Are Women Recover Jobs Lost in Recession in Year Five Heidi Hartmann, Ph.D., Elyse Shaw, and Rachel O Connor Overview While the number
education department unrwa school dropout: an agency wide study
 education department unrwa school dropout: an agency wide study september 2013 unrwa school dropout: an agency wide study September 2013 i Gillian Hampden-Thompson of the University of York, UK prepared
Florida Study of Career and Technical Education
 Florida Study of Career and Technical Education Final Report Louis Jacobson, Ph.D. Christine Mokher, Ph.D. 2014 IRM-2014-U-008790 Approved for Distribution Unlimited This document represents the best opinion
School Counseling in Texas
 The College Board National Office for School Counselor Advocacy (NOSCA) School Counseling in Texas A College Board 2011 National Survey of School Counselors State Brief A brief for the College Board Advocacy
How to Address College Enrollment Barriers and Achieve Accomplishment
 AGENCY/PHOTOGRAPHER Barriers to College Attainment Lessons from Chicago Jenny Nagaoka, Melissa Roderick, and Vanessa Coca, The Consortium on Chicago School Research at The University of Chicago January
School Counseling in California
 The College Board National Office for School Counselor Advocacy (NOSCA) School Counseling in California A College Board 2011 National Survey of School Counselors State Brief A Brief for the College Board
SalarieS of chemists fall
 ACS news SalarieS of chemists fall Unemployment reaches new heights in 2009 as recession hits profession hard The economic recession has taken its toll on chemists. Despite holding up fairly well in previous
The Outcomes For CTE Students in Wisconsin
 Promoting Rigorous Career and Technical Education Programs of Study Quantitative Outcomes Study: Baseline Data Collection Report Prepared under contract to Division of Academic and Technical Education
College and Career Readiness in New York State 1
 College and Career Readiness in New York State 1 New York's Regents Reform Agenda is grounded in the belief that all students should graduate from high school ready for success in postsecondary education
Nationwide, close to 40
 mdrc BUILDING KNOWLEDGE TO IMPROVE SOCIAL POLICY P O L I C Y B R I E F M A Y 2 0 1 3 Enhancing GED Instruction to Prepare Students for College and Careers EARLY SUCCESS IN LAGUARDIA COMMUNITY COLLEGE S
Overcoming the Tasks on the Path to College for America s Disadvantaged
 3 Using data from the National Educational Longitudinal Study of 1988, this chapter seeks to gain a better understanding of what factors assist economically and sociologically underprivileged Americans
Design Specifications. Asset Inventory
 DECEMBER 2015 Pathways System Framework Design Specifications and Asset Inventory FOR PATHWAY SYSTEM PARTNERSHIPS Every Indiana business will find the educated and skilled workforce necessary to compete
STRATEGIES FOR INCREASING NONTRADITIONAL ENROLLMENT
 STRATEGIES FOR INCREASING NONTRADITIONAL ENROLLMENT Recruitment Strategies Issue a personal invitation to a girl to attend a nontraditional class or activity in the class. Let her know you think she has
The Labor Market Problems of Massachusetts Workers in the Recovery from the Great Recession: The Great Socioeconomic Divergence
 The Labor Market Problems of Massachusetts Workers in the Recovery from the Great Recession: The Great Socioeconomic Divergence Prepared by: Andrew Sum Ishwar Khatiwada Walter McHugh Center for Labor Market
2014 Demographics PROFILE OF THE MILITARY COMMUNITY
 Demographics PROFILE OF THE MILITARY COMMUNITY ACKNOWLEDGEMENTS This report is published by the Office of the Deputy Assistant Secretary of Defense (Military Community and Family Policy), under contract
It has become a truism and a rare example
 mdrc Building Knowledge To Improve Social Policy Make Me a Match Helping Low-Income and First-Generation Students Make Good Choices By Jay Sherwin In Chicago, an intervention now under way the Match Program
Women s Participation in Education and the Workforce. Council of Economic Advisers
 Women s Participation in Education and the Workforce Council of Economic Advisers Updated October 14, 214 Executive Summary Over the past forty years, women have made substantial gains in the workforce
Council for Advancement of Adult Literacy 1221 Avenue of the Americas 44 th Floor, New York, NY 10020 P O L I C Y B R I E F
 Council for Advancement of Adult Literacy 1221 Avenue of the Americas 44 th Floor, New York, NY 10020 P O L I C Y B R I E F ROI FROM INVESTING IN WORKFORCE DEVELOPMENT Findings on the Effectiveness of
May 2006. Minnesota Undergraduate Demographics: Characteristics of Post- Secondary Students
 May 2006 Minnesota Undergraduate Demographics: Characteristics of Post- Secondary Students Authors Tricia Grimes Policy Analyst Tel: 651-642-0589 Tricia.Grimes@state.mn.us Shefali V. Mehta Graduate Intern
Resource Guide for High School Transitions:
 Resource Guide for High School Transitions: Annotated Bibliography Harvard Family Research Project June 2011 For questions or comments about this paper, email hfrp_pubs@gse.harvard.edu 2011 President and
Putting Youth to Work Series
 Putting Youth to Work Series Examples of Effective Practice in Distressed Communities By Sara Hastings July 2009 Baltimore, MD Best Practice Examples in: Convening Body Delivery Agent Workforce and Employer
Tulsa Public Schools Teacher Observation and Evaluation System: Its Research Base and Validation Studies
 Tulsa Public Schools Teacher Observation and Evaluation System: Its Research Base and Validation Studies Summary The Tulsa teacher evaluation model was developed with teachers, for teachers. It is based
National Academy Foundation Guide to Work-Based Learning: A Continuum of Activities and Experience
 National Academy Foundation Guide to Work-Based Learning: A Continuum of Activities and Experience The National Academy Foundation (NAF) is an acclaimed network of career-themed academies that prepare
AMERICA S YOUNG ADULTS AT 23: SCHOOL ENROLLMENT, TRAINING, AND EMPLOYMENT TRANSITIONS BETWEEN AGES 22 AND 23
 For release 10:00 a.m. (EST) Wednesday, February 9, 2011 USDL-11-0155 Technical information: (202) 691-7410 nls_info@bls.gov www.bls.gov/nls Media contact: (202) 691-5902 PressOffice@bls.gov AMERICA S
Persistence of Women and Minorities in STEM Field Majors: Is it the School That Matters?
 Cornell University ILR School DigitalCommons@ILR Working Papers ILR Collection 3-2010 Persistence of Women and Minorities in STEM Field Majors: Is it the School That Matters? Amanda L. Griffith Wake Forest
The Bronx Achievement Pact
 The Bronx Achievement Pact Every Student Counts Overview The Bronx Achievement Pact works to improve educational outcomes in the Bronx by closing the gaps in the high school-college pipeline. This comprehensive
College Students with Children are Common and Face Many Challenges in Completing Higher Education
 IWPR# C404 March 2013 College Students with Children are Common and Face Many Challenges in Completing Higher Education Summary Nearly 25 percent of college students in the U.S., or four million students,
The College Majors of Class of 2001 Boston Public High School Graduates Attending College at the Time of the Winter 2002 Follow-up Survey
 The College Majors of Class of 2001 Boston Public High School Graduates Attending College at the Time of the Winter 2002 Follow-up Survey Prepared by: Ishwar Khatiwada Andrew Sum Center for Labor Market
Liberal Arts Colleges
 Measuring Internationalization at Liberal Arts Colleges Funded by the Ford Foundation AMERICAN COUNCIL ON EDUCATION The Unifying Voice for Higher Education Center for Institutional and International Initiatives
CERTIFICATES OF VALUE
 CERTIFICATES OF VALUE Certificates are the fastest-growing postsecondary credential in the country, demonstrating that many institutions and prospective job candidates find them valuable. Between 1984
Addressing Education Deficits: LaGuardia Community College s Bridge to College and Careers Program
 Addressing Education Deficits: LaGuardia Community College s Bridge to College and Careers Program Vanessa Martin, MDRC Amy Dalsimer, LaGuardia Community College Overview Background and context The reform
Transforming the High School Experience
 Transforming the High School Experience How New York City s New Small Schools Are Boosting Student Achievement and Graduation Rates Howard S. Bloom Saskia Levy Thompson Rebecca Unterman June 2010 Transforming
Six-Year Effects of a Freshman Learning Community Program at Kingsborough Community College
 OPening Doors commencement day Six-Year Effects of a Freshman Learning Community Program at Kingsborough Community College Colleen Sommo Alexander K. Mayer Timothy Rudd Dan Cullinan July 2012 Commencement
YOUNG BLACK MEN DON T FIT COMMON STEREOTYPES. Experiences of Young Black Men. Optimistic Views of Young Black Men
 Survey Snapshot: Views and Experiences of Young Black Men Findings from the Washington Post/Kaiser Family Foundation/Harvard University African American Men Survey The Washington Post/Kaiser Family Foundation/Harvard
In 1994, the U.S. Congress passed the Schoolto-Work
 School-to-Work Programs School-to-work programs: information from two surveys Data from the 996 School Administrator's Survey show that three-fifths of U.S. high schools offer school-to-work programs,
construction career academy A construction career academy offers students the building blocks for a successful career path
 construction career academy A construction career academy offers students the building blocks for a successful career path Construction is a career choice The Associated General Contractors of America
WHAT WORKS IN INNOVATION AND EDUCATION IMPROVING TEACHING AND LEARNING FOR ADULTS WITH BASIC SKILL NEEDS THROUGH FORMATIVE ASSESSMENT STUDY OUTLINE
 WHAT WORKS IN INNOVATION AND EDUCATION IMPROVING TEACHING AND LEARNING FOR ADULTS WITH BASIC SKILL NEEDS THROUGH FORMATIVE ASSESSMENT STUDY OUTLINE The OECD s Centre for Educational Research and Innovation
As of 2010, an estimated 61 million students of primary school age 9% of the world total - are out of school vi.
 YOUTH AND EDUCATION HIGHLIGHTS 10.6% of the world s youth (15-24 years old) are non-literate i. Data from 2011 indicates that in developing countries, the percentage of non-literate youth is 12.1%, with
The Historic Opportunity to Get College Readiness Right: The Race to the Top Fund and Postsecondary Education
 The Historic Opportunity to Get College Readiness Right: The Race to the Top Fund and Postsecondary Education Passage of the American Recovery and Reinvestment Act (ARRA) and the creation of the Race to
The U.S. labor force the number of
 Employment outlook: 14 Labor force projections to 2014: retiring boomers The baby boomers exit from the prime-aged workforce and their movement into older age groups will lower the overall labor force