Offshore Supply Weekly
|
|
|
- Abel Thomas
- 7 years ago
- Views:
Transcription
1 Offshore Supply Weekly (week 45) Kjetil Haukås,

2 Newsflow DESSC fleet status report for October 2014 slightly negative in our view» DESSC reported average AHTS rates at USD 18,600 per day, down from USD 21,400 in Q3/14. The number was likely impacted negatively by the AHTS Sea Lynx (~15,000 bhp) mobilizing from the North Sea spot market to the South Stream project in the Black Sea working for SPM. DESSC has negotiated a frame agreement for the vessels for 2014 and As a consequence Sea Lynx did not take part in the very strong North Sea spot market in October.» Average PSV dayrates came in at USD 19,200 per day, flat from September, and 4% below the average rate in Q3/14. Improved contract coverage for DESSC as the company secures BB charters for Sea Swift and Sea Spear» DESSC announced new BB contracts for Sea Swift and Sea Spear (4,700 dwt/2014 built). Client is undisclosed. BB rate of USD 20,00 is clearly positive. Rate and client is the same as for Sea Swan and Sea Surfer that was fixed in September, however end-client differs with Sea Swift and Sea Spear working for Saipem offshore Australia.» Firm contract coverage improves from 45% in 2015 to 47% on our estimates. Including options, contract coverage rises from 61% to 64% in 2015E.» DESSC has so far not succeeded in securing a term charter for the India built Sea Triumph. The vessels is currently heading for the North Sea to take part in the spot market which is entering low season. Spot utilization for PSVs currently stands at just above 80%. Average effective PSV spot rates (after adjusting for utilization) stands at NOK 104,000 for Implied purchase price for Sea Triumph was ~USD 31m (avg. purchase price for all 10 PSVs USD 36.6m). We estimate EV/EBITDA of just above 10x based on average spot rates. In comparison, we believe current avg. TC rates for such a vessel to be around USD 22,500 (~NOK 170,000) for 1-2 year contracts. Bourbon Q3 revenues up by 5.7% y-o-y to EUR 495m» 3rd quarter revenues increased by 5.7% to EUR 495m, up from EUR 472m in Q3/13, as fleet growth and higher avg. dayrates were partially offset by lower utilization. Bourbon is the world s largest OSV company as measured by the number of vessels under management (including all vessel classes, not only AHTS and PSVs). The total number of vessels operated by Bourbon was 501 in Q3/14 (includes BB charters) up by 22 a year ago implying ~4% fleet growth.» Avg. dayrates increased in most segments and regions, largely caused by an increase in the fleet to newer, larger vessels but also improved rates on some contract renewals. Utilization development was mixed across regions, with Asia and West Africa being adversely affected by increased supply of vessels and reduced activity, respectively. Cost reduction programs by E&Ps had a negative impact on all segments according to the company. Tidewater fiscal Q2/15 numbers roughly in line with consensus» Tidewater reported fiscal Q2/15 sales of USD 398m and EBITDA of 125m marginally above consensus at USD 396m and 123m respectively. Adjusted net income was USD 61m 13% above consensus at USD 54m. Overall a neutral report. The share has been trading fairly flat this week.» Nothing interesting mentioned in the call. The company highlighted that only around 60% of its revenue is related to rig support activity while remaining 40% is related to production, construction etc., i.e. the TDW share should thus not be treated as a pure derivative of drilling according to management. Solid Q3 report from Oceanteam Shipping (OTS)» OTS reported 3Q14 revenues of USD 15.4m (up from USD 14.5m in 2Q14) and EBITDA (incl. net income JVs) of USD 8.1m (up from USD 7.0m in 2Q14). Net profit came in at USD 1.8m (up from USD 0.4m in 2Q14). The EBITDA margin increased to 44% from 39% Q/Q. EBITDA came in 17% above our USD 6.9m estimate. The revenues were split 50/50 between the Shipping segment and the Solutions segment (small increase Q/Q in both). Backlog in the Shipping segment increased to USD 231m from USD 224m Q/Q (Oceaneering exercised both 1yr options on 101 during the quarter), while backlog in the Solutions segment increased to USD 37m from USD 35m Q/Q. The company maintains its USD ~30m FY14 EBITDA guidance implies 4Q14 EBITDA roughly on par with a strong 3Q14.» SB1 credit research analysis: Quarter-end, NIBD stood at USD 141m (down from USD 148m Q/Q) 3Q14 annualized net leverage at 4.4x, down from 5.3x as of 2Q14. The 3Q14 EBITDA interest coverage came in at 2.1x, up from 1.8x as of 2Q14. The book equity ratio increased to 49% from 44% Q/Q due to positive vessel revaluation effects (contract extension and supportive market transactions). Positively, the cash position increased to USD 15.3m from USD 9.9m driven by improved operating performance, the selling of certain equipment and positive working capital changes. 2 Source: Sparebank 1 Markets, Companies, Press,++

3 USD USD USD USD Weekly spot market development Strong AHTS market during Q3 will result in strong earnings reports PSV seasonal spot rates AHTS seasonal spot rates Week number Week number PSV spot rates and utilization since jan 2013 AHTS spot rates and utilization since jan PSV rate PSV utl 100 % AHTS rate AHTS utl 100 % % 80 % 70 % % 80 % 70 % % % % 40 % 30 % % 40 % 30 % Week number, since % Week number 20 % 3 Source: SB1 Markets, IHS Petrodata, Hagland Offshore

4 Recent spot fixtures Vessel Name Vessel Type BHP DWT (ton) Manager Contract typeactivity Country Client Fixture Date Start Date End Date w/o Options Rate USD Rate Far Scorpion AHTS Farstad Spot Rig Move Norway Statoil NOK 310, Island Valiant AHTS Island OffshoreSpot Rig Move Norway Statoil Normand Prosper AHTS Solstad Shipping Spot Anchor Assist - ChainNorway ConocoPhillips NOK 300, Balder Viking AHTS Viking Supply Spot Ships Rig Move United Kingdom Talisman GBP 35, Loke Viking AHTS Viking Supply Spot Ships Rig Move United Kingdom Talisman GBP 35, Odin viking AHTS Viking Supply Spot Ships Rig Move United Kingdom Talisman GBP 25, UP Jasper PSV Ultrapetrol Spot Cargo Run United Kingdom Premier GBP 8, KL Brofjord PSV K Line OffshoreSpot Supply Norway Statoil NOK 125, Northern Commander AHTS Trico Marine Services Spot Standby Norway Statoil NOK 75, Blue Thunder PSV Atlantic Offshore Spot Supply Norway Statoil NOK 100, Maersk Assister AHTS Maersk Supply Spot Service Heading Control United Kingdom Team GBP 25, North Cruys PSV Gulf OffshoreSpot Supply Norway BP NOK 140, Freyja Viking PSV Viking Supply Spot Ships Supply United Kingdom Apache GBP 8, Rem Provider PSV Rem MaritimeSpot Supply United Kingdom Peterson GBP 11, Rem Stadt PSV Remoy Shipping Spot Supply Norway Statoil NOK 120, Source: SB1 Markets, IHS Petrodata

5 OSV peer group Sparebank 1 Markets - Offshore Supply peer group SB1M Market cap. Px TP Potential Share price performance EV/EBITDA consensus P/B P/NAV Company Ticker Rating [USDm] [Local] [Local] upside 3m 6m 12m 2014E 2015E 2016E 5Y avg. current SB1 est. Deep Sea Supply DESSC NO Buy 293 7,7 12,0 56 % -17 % -16 % -36 % 5,2x 3,9x 4,1x 4,9x 0,6x 0,6x Siem Offshore SIOFF NO Neutral 284 5,0 5,5 10 % -36 % -43 % -49 % 7,8x 6,2x 5,7x 6,6x 0,4x 0,3x Farstad Shipping FAR NO Neutral ,0 80,0 10 % -37 % -38 % -48 % 7,2x 6,4x 6,2x 6,7x 0,4x 0,3x DOF DOF NO Neutral ,1 25,0 31 % -29 % -30 % -33 % 7,4x 7,5x 7,2x 7,2x 0,4x 0,5x Solstad Offshore SOFF NO Neutral ,0 85,0 4 % -19 % -25 % -32 % 7,3x 6,9x 6,4x 7,1x 0,6x 0,4x Havila Shipping HAVI NO Sell ,0 22,0-4 % -27 % -33 % -34 % 7,4x 7,8x 7,7x 8,0x 0,3x 0,3x Nordic American Offshore NAO US Sell ,2 15,0-1 % -17 % -18 % -20 % 11,2x 8,1x 7,2x #N/A N/A #N/A N/A 1,0x Eidesvik Offshore EIOF NO ,1-17 % -18 % -20 % 7,3x 5,4x 5,7x #N/A N/A 0,4x N/A Tidewater TDW US ,6-22 % -24 % -37 % 7,5x 6,9x 6,3x 7,0x 0,7x N/A Gulfmark GLF US ,1-21 % -31 % -37 % 7,5x 7,3x 7,4x 6,5x 0,7x N/A Avgerage all -24 % -28 % -35 % 7,6x 6,7x 6,4x 6,8x 0,5x 0,5x Source: Sparebank 1 Markets; Bloomberg *Change of analyst. Recommendation and target under review. Sparebank 1 Markets - Offshore Supply peer group EV/EBITDA SB1M TEV/EBITDA* SB1M Dividend yield ROE NIBD/Capital Company 2014E 2015E 2016E 2014E 2015E 2016E 2014E 2015E 2016E 2014E 2015E 2016E 5Y avg. YE 2014 YE 2015 Deep Sea Supply 9,0x 6,1x 6,2x 6,2x 5,7x 5,7x 3 % 12 % 16 % 6 % 12 % 10 % 19 % 48 % 43 % Siem Offshore 8,1x 7,2x 7,9x 7,9x 7,1x 7,0x 2 % 4 % 6 % 8 % 9 % 1 % 2 % 53 % 44 % Farstad Shipping 6,8x 6,3x 6,0x 6,7x 6,1x 6,0x 4 % 4 % 4 % 6 % 6 % 6 % 14 % 48 % 48 % DOF 6,1x 6,5x 6,1x 5,7x 5,8x 5,7x 0 % 0 % 0 % 14 % 10 % 10 % 1 % 61 % 60 % Solstad Offshore 6,8x 5,8x 6,4x 6,6x 6,1x 6,1x 6 % 5 % 5 % 15 % 13 % 11 % 5 % 54 % 49 % Havila Shipping 7,1x 7,7x 7,3x 7,1x 7,7x 7,3x 0 % 2 % 2 % 8 % 5 % 5 % 5 % 65 % 63 % Nordic American Offshore 11,4x 14,3x 12,2x 17,2x 14,3x 12,2x 10 % 12 % 12 % 4 % 5 % 6 % N/A -16 % 25 % Average 7,9x 7,7x 7,5x 8,2x 7,5x 7,1x 4 % 6 % 6 % 9 % 9 % 7 % 8 % 45 % 48 % Source: Sparebank 1 Markets * Assumes all newbuilds operational with EV adj. for remaining capex Sparebank 1 Markets - Offshore Supply peer group Sales (local) vs. consensus (%) EBITDA (local) vs. consensus (%) Adj. EBITDA margin Company 2014E 2015E 2016E 2014E 2015E 2016E 2014E 2015E 2016E 2014E 2015E 2016E E 2015E Deep Sea Supply % -4 % -5 % % 2 % 0 % 45 % 52 % 58 % Siem Offshore % -9 % -6 % % -26 % -27 % 34 % 37 % 34 % Farstad Shipping % 2 % 0 % % 6 % -2 % 38 % 39 % 41 % DOF % 3 % -2 % % -1 % 0 % 32 % 31 % 34 % Solstad Offshore % 1 % -2 % % 9 % 0 % 43 % 47 % 51 % Havila Shipping % 0 % -2 % % -4 % -6 % 47 % 51 % 49 % Nordic American Offshore % -14 % -11 % % -21 % -16 % N/A 48 % 47 % Average 1 % -3 % -4 % 1 % -5 % -8 % 40 % 44 % 45 % Source: Sparebank 1 Markets; Bloomberg 5 Source: Sparebank 1 Markets

6 EBITDA EBITDA EBITDA EBITDA EBITDA EBITDA Consensus EBITDA estimates Consensus EBITDA est. down for 15-16E. Slightly up for 14E for SOFF, FAR and HAVI which have the highest exposure to the AHTS spot 2 700,00 FAR 2 100,00 SOFF 2 500, , , , , , , , , ,00 Jan-12 Apr-12 Jul-12 Oct-12 Jan-13 Apr-13 Jul-13 Oct-13 Jan-14 Apr-14 Jul-14 Oct DOF 4 100, , , , , , , , , ,00 Jan-12 Apr-12 Jul-12 Oct-12 Jan-13 Apr-13 Jul-13 Oct-13 Jan-14 Apr-14 Jul-14 Oct , , , ,00 Jan-12 Apr-12 Jul-12 Oct-12 Jan-13 Apr-13 Jul-13 Oct-13 Jan-14 Apr-14 Jul-14 Oct SIOFF 350,00 330,00 310,00 290,00 270,00 250,00 230,00 210,00 190,00 170,00 150,00 Jan-12 Apr-12 Jul-12 Oct-12 Jan-13 Apr-13 Jul-13 Oct-13 Jan-14 Apr-14 Jul-14 Oct DESSC 140,00 130,00 120,00 110,00 100,00 90,00 80,00 70,00 60,00 Jan-12 Apr-12 Jul-12 Oct-12 Jan-13 Apr-13 Jul-13 Oct-13 Jan-14 Apr-14 Jul-14 Oct HAVI 950,00 900,00 850,00 800,00 750,00 700,00 Jan-13 Apr-13 Jul-13 Oct-13 Jan-14 Apr-14 Jul-14 Oct Source: SB1 Markets, Bloomberg

7 Consensus EBITDA estimates OSV and drilling OSV consensus EBITDA revisions OSV and Drilling. 15E/16E OSV 2015 OSV 2016 Drilling 2016 Drilling Source: Sparebank 1 Markets; Bloomberg

8 Short interest OSV and drilling (US companies only) 350 Short positions (absolute) base year OSV and rig 16% Short positions % of free float. - OSV and rig % % 10% 8% 6% 4% 50 2% 0 des. 10 mar. 11 jun. 11 sep. 11 des. 11 mar. 12 jun. 12 sep. 12 des. 12 mar. 13 jun. 13 sep. 13 des. 13 mar. 14 jun. 14 sep. 14 0% des. 10 mar. 11 jun. 11 sep. 11 des. 11 mar. 12 jun. 12 sep. 12 des. 12 mar. 13 jun. 13 sep. 13 des. 13 mar. 14 jun. 14 sep. 14 Rig index Source: Bloomberg; Sparebank 1 Markets OSV index Rig Source: Bloomberg; Sparebank 1 Markets OSV 8 Source: Sparebank 1 Markets, Bloomberg

9 Oil service sector performance Oil Service Sector Performance since Jan Oil Service Sector Performance since Jan SUPPLY Index.USSUPPLY Index.SUBSEA Index.SEISMIC Index.DRILLING Index OSEBX Index.SUPPLY Index.USSUPPLY Index.SUBSEA Index.SEISMIC Index.DRILLING Index OSEBX Index 9 Source: SB1 Markets, Bloomberg

10 Share price performance Norwegian OSVs Share price performance since jan Norwegian peers Share price performance since jan Norwegian peers OSEBX Index SOFF FAR DOF DESSC SIOFF HAVI EIOF OSEBX Index SOFF FAR DOF DESSC SIOFF HAVI EIOF 10 Source: SB1 Markets, Bloomberg

11 Historic pricing of Norwegian OSV peers 11,5x EV/EBITDA (12m forward) 2,0x Price Boook 10,5x 1,8x 9,5x 8,5x 1,6x 1,4x 1,2x 7,5x 1,0x 6,5x 0,8x 5,5x 4,5x 0,6x 0,4x 0,2x 3,5x DESSC SIOFF FAR DOF SOFF HAVI EIOF DESSC SIOFF FAR DOF SOFF HAVI EIOF Industry avg. EV/EBITDA 1Y forward Industry avg. Price Book 9,5x 9,0x 8,5x 8,0x 7,5x 7,0x 6,5x 6,0x 5,5x 5,0x 4,5x ,2x 1,1x 1,0x 0,9x 0,8x 0,7x 0,6x 0,5x 0,4x Source: SB1 Markets, Bloomberg

12 Discount to NAV Discount to NAV Discount to NAV Discount to NAV Discounts to reported NAVs 80% 70% SOFF - Discount to last reported NAV 80% 70% HAVI - Discount to last reported NAV 60% 60% 50% 50% 40% 40% 30% 30% 20% 20% 10% 10% 0% 0% 80% 70% DOF - Discount to last reported NAV 80% 70% FAR - Discount to last reported NAV 60% 60% 50% 50% 40% 30% 20% 10% 0% 40% 30% 20% 10% 0% 12 Source: SB1 Markets, Company reports, Bloomberg

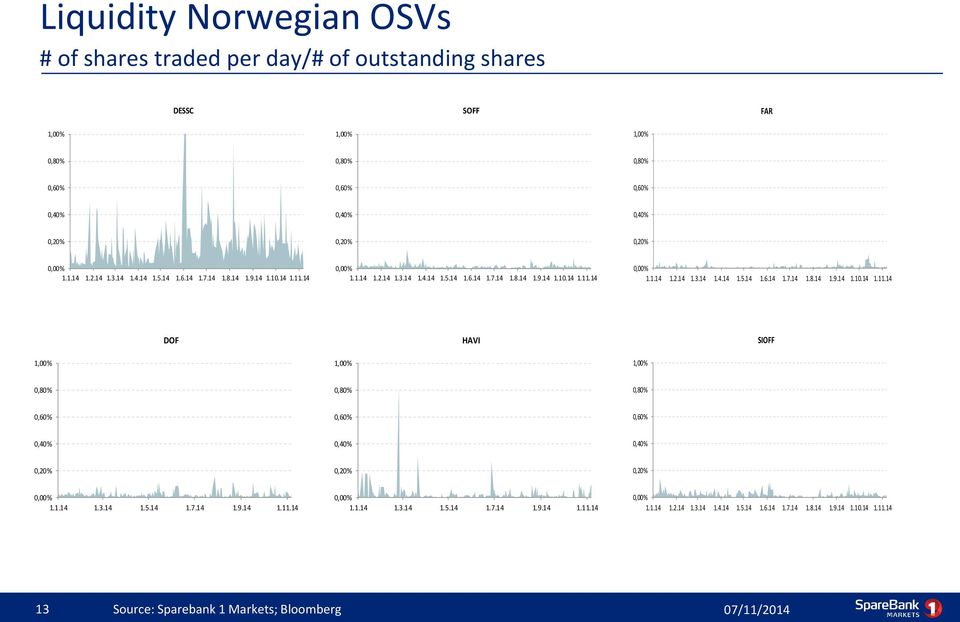
13 Liquidity Norwegian OSVs # of shares traded per day/# of outstanding shares DESSC SOFF FAR 1,00% 1,00% 1,00% 0,80% 0,80% 0,80% 0,60% 0,60% 0,60% 0,40% 0,40% 0,40% 0,20% 0,20% 0,20% 0,00% ,00% ,00% ,00% DOF 1,00% HAVI 1,00% SIOFF 0,80% 0,80% 0,80% 0,60% 0,60% 0,60% 0,40% 0,40% 0,40% 0,20% 0,20% 0,20% 0,00% ,00% ,00% Source: Sparebank 1 Markets; Bloomberg
14 Liquidity US OSVs # of shares traded per day/# of outstanding shares TDW GLF 5,00% 5,00% 4,00% 4,00% 3,00% 3,00% 2,00% 2,00% 1,00% 1,00% 0,00% ,00% ,00% HOS 5,00% NAO 4,00% 4,00% 3,00% 3,00% 2,00% 2,00% 1,00% 1,00% 0,00% ,00% Source: Sparebank 1 Markets; Bloomberg

15 Bond Indications Supply & Subsea Services Issuer ISIN Ticker Size Crncy Priority Security Maturity TTM Coupon Bid Px Bid YTW Bid Z/DM Ask Px Ask YTW Ask Z/DM Mid Z/DM Atlantic Offshore AS NO ATOFF NOK Senior unsecured m N % % Atlantic Offshore AS NO ATOFF NOK Share pledge Vessel owning comp's m N % % Atlantic Offshore AS NO ATOFF NOK Senior unsecured m N % % Boa OCV AS NO NOK 1st lien 2x OCV m N % % Boa Offshore AS NO BOAO NOK Senior unsecured m N % % Boa Offshore AS NO BOAO NOK Senior unsecured m N % % Boa SBL AS NO BOAS NOK 1st lien 2x EM vessels m N % % DOF ASA NO DOF NOK Senior unsecured m N % % DOF ASA NO DOF NOK Senior unsecured m N % % DOF ASA NO DOF NOK Senior unsecured m N % % DOF ASA NO DOF NOK Senior unsecured m N % % DOF Subsea ASA NO DOFSUB NOK Senior unsecured m N % % DOF Subsea ASA NO DOFSUB NOK Senior unsecured m N % % DOF Subsea ASA NO DOFSUB NOK Senior unsecured m N % % E Forland AS NO EFOR NOK 1st lien 1x Subsea m N % % Eidesvik Offshore ASA NO EIOF NOK Senior unsecured m N % % Farstad Shipping AS NO FAR NOK Senior unsecured m N % % Farstad Shipping AS NO FAR NOK Senior unsecured m N % % Golden Energy Offshore Services AS NO NOK 1st lien 2x PSV m N % % Havila Holding AS NO NOK Share pledge Various shares % % Havila Shipping ASA NO HAVI NOK Senior unsecured m N % % Havila Shipping ASA NO HAVI NOK 1st lien PSV Clipper m N % % Havila Shipping ASA NO HAVI NOK 1st lien OCV Subsea % % % Havila Shipping ASA NO HAVI NOK 1st lien OCV Subsea m N % % Island Offshore Shipholding L.P. NO IOSH NOK Senior unsecured m N % % Oceanteam Shipping ASA NO OTS02 93 USD Senior unsecured m L % % Olympic Ship AS NO OLSH NOK Senior unsecured m N % % Olympic Ship AS NO OLSH NOK Senior unsecured m N % % Olympic Ship AS NO NOK Senior unsecured m N % % Rem Offshore ASA NO REM NOK Senior unsecured m N % % Rem Offshore ASA NO REM NOK Senior unsecured m N % % Rem Offshore ASA NO NOK Senior unsecured m N % % Sea Trucks Group Ltd NO USD 1st lien Various vessels % % % Siem Offshore Inc NO SIOFF NOK Senior unsecured m N % % Siem Offshore Inc NO SIOFF NOK Senior unsecured m N % % Solstad Offshore ASA NO SOFF NOK Senior unsecured m N % % Viking Supply Ships AS NO VSS NOK Senior unsecured m N % % Volstad Maritime AS NO VOSUB NOK 1st lien 1x DSV & 2x Seismic m N % % Volstad Shipping AS NO VOLS NOK 2nd lien 2x PSV & 1x Subsea m N % %

16 Spread (bps) Spread/Maturity Supply & Subsea Services Supply & Subsea Services Spread/Maturity Diagram Oceanteam Atlantic +750 Golden Energy +725 (2x PSV) Viking +825 Boa Offshore +675 Havila Holding +660 (various E Forland +675 (Fugro Saltire) shares) VOLSHI +600 (2x PSV & 1x VOLMAR +650 (1x DSV, 2x DOF +700 DOF +725 REM +575 Subsea) Seismic) DOF +475 REM +525 Boa SBL +550 (2x EM vessels) Island Offshore +525 SIOFF +475 Havila 8.6% (OCV Subsea) SIOFF +440 Havila +850 (2016) Boa OCV +475 (2x OCV) Havila +450 (OCV Subsea) Olympic +600 DOFSUB +500 Olympic +500 Eidesvik +450 SOFF +440 Havila +375 (PSV Clipper) Farstad +340 Farstad +420 DOFSUB DOFSUB +550 DOF Olympic +525 Atlantic (vessel owning REM comp's) Boa Offshore +675 Atlantic Time to Maturity Unsecured 1 st lien 2 nd lien/share pledge Source: SpareBank 1 Markets Price Indications 16
 SIOFF +440 Havila +850 (2016) Boa OCV +475 (2x OCV) Havila +450 (OCV Subsea) Olympic +600 DOFSUB +500 Olympic +500 Eidesvik +450 SOFF +440 Havila +375 (PSV Clipper) Farstad +340")
17 Disclaimer IMPORTANT DISCLOSURES AND CERTIFICATIONS This document provides additional disclosures and disclaimers relevant to research reports and other investment recommendations ( Recommendations ) issued by SpareBank 1 Markets AS ( SpareBank 1 Markets ), cf. the Norwegian Securities Trading Act section 3-10 with further regulations. Standards and supervisory authorities SpareBank 1 Markets complies with the standards for recommendations issued by the Norwegian Securities Dealers Association ( and the Norwegian Society of Financial Analysts. The lead analyst (see front page) is employed by SpareBank 1 Markets, which is legally responsible for this report and is under the supervision of The Financial Supervisory Authority of Norway (Finanstilsynet). Previous Recommendations For an overview of SpareBank 1 Markets research reports and other investment recommendations regarding the financial instruments of the issuer the past 12 months, including data on changes in such research reports and other investment recommendations, please see SpareBank 1 Markets website, (log-in required) Planned updates Unless explicitly stated otherwise in this report, SpareBank 1 Markets expects, but not undertake, to issue updates to this report following the publication of new figures or forecasts by the issuer covered, or upon the occurrence of other events which could potentially have a material effect on it. Information sources Important sources of information: the issuer, including its quarterly and annual reports, Oslo Stock Exchange, Statistics Norway (Statistisk Sentralbyrå). Sources are cited when referred to in the Recommendation. We use only sources we find reliable and accurate, unless otherwise stated. The Recommendations has not been presented to the issuer/ the issuers of the financial instrument presented before dissemination. SpareBank 1 Markets interests and disclosure of assignments and mandates Financial instruments held by the analyst(s) and/or close associate in the issuer/ issuers herein: 0 Other material interest (if any): None SpareBank 1 Markets does not alone or together with related companies or persons, hold a portion of the shares exceeding 5 % of the total share capital in any companies where a recommendation has been produced or distributed by SpareBank 1 Markets, or holds other interest likely to affect the objectivity of a recommendation, except when disclosed, cf. below. SpareBank 1 Markets may hold financial instruments in companies where a recommendation has been produced or distributed by SpareBank 1 Markets in connection with rendering investment services, including market making. For important disclosures, such as an overview of all financial instruments in which SpareBank 1 Markets or related companies are market makers or liquidity providers, all financial instruments where SpareBank 1 Markets or related companies have been lead managers or co-lead managers over the previous 12 months, and all issuers of financial instruments to whom SpareBank 1 Markets or related companies have rendered investment banking services over the previous 12 months, please refer to SpareBank 1 Markets equity research website: (login required) Please note that agreements and services subject to confidentiality are excluded. 17
 and the Norwegian Society of Financial Analysts.")
18 Disclaimer SpareBank 1 Markets Research Department Our recommendations are based on a six-month horizon, and on absolute performance. We apply a three-stage recommendation structure where Buy indicates an expected annualized return of greater than +15%; Neutral, from 0% to +10%; Sell, less than 0%. Current recommendations of the Research Department: (refers to Recommendations published prior to this report and required disclosed in accordance with the Securities Trading Regulations section 3-11 (4) Standard research disclaimer All employees of SpareBank 1 Markets are subject to duty of confidentiality towards clients and with respect to inside information. SpareBank 1 Markets operates a system of Chinese Walls and other organizational procedures in order to control the flow of information within the firm and minimize conflicts of interest within SpareBank1 Markets and between clients. The Research Department is part of this system. The Research Analysts of SpareBank 1 Markets receive salary and are members of the bonus pool. However no part of the analysts salaries or compensations relates to the performance of their recommendations, directly to investment banking services or other services provided by SpareBank 1 Markets or related companies to issuers. Analyst Certification The views expressed in this research accurately reflect(s) the personal views of the analyst(s) principally responsible for this report about the subject securities or issuers, and no part of the compensation of such analyst(s) was, is, or will be directly or indirectly related to the inclusion of specific recommendations or views in this research. No part of the compensation of the research analyst(s) responsible for the preparation of this report was, is, or will be, directly or indirectly, related to the specific recommendations or views expressed by the research analyst(s) in this report. Risks Generally, investments in financial instruments involve risks. For specific risks related to our various recommendations, please see the latest relevant reports. The target prices on companies in the SpareBank 1 Markets Research universe reflect the subjective view of the analyst about the absolute price that financial instruments should trade at, within our six-month recommendation horizon. The target price is based on an absolute valuation approach, which is detailed in our research reports. The target price can differ from the absolute valuation, in accordance with the analyst's subjective view on the trading or cyclical patterns for a particular financial instrument, or a possible discount/premium to reflect factors such as market capitalization, ownership structure and/or changes in the same, and company-specific issues. This report or summary has been prepared by SpareBank 1 Markets from information obtained from public sources not all of which are controlled by SpareBank 1 Markets. Such information is believed to be reliable and although it has not been independently verified, SpareBank 1 Markets has taken all reasonable care to ensure that the information is true and not misleading. Notwithstanding such reasonable efforts, SpareBank 1 Markets makes no guarantee, representation or warranty as to its accuracy or completeness. SpareBank 1 Markets assumes no obligation to update the information contained in this report or summary to the extent that it is subsequently determined to be false or inaccurate. This document contains certain forward-looking statements relating to the business, financial performance and results of the issuer and/or the industry in which it operates. Forward-looking statements concern future circumstances and results and other statements that are not historical facts, sometimes identified by the words believes, expects, predicts, intends, projects, plans, estimates, aims, foresees, anticipates, targets, and similar expressions. The forward-looking statements contained in this document, including assumptions, opinions and views of the issuer or cited from third party sources are solely opinions and forecasts which are subject to risks, uncertainties and other factors that may cause actual events to differ materially from any anticipated development. 18
 Standard research disclaimer All employees of SpareBank 1 Markets are subject to duty of confidentiality towards clients and with respect to inside information.")
19 Disclaimer No Solicitation This report or summary is provided for informational purposes only and under no circumstances is it to be used or considered as an offer to sell, or a solicitation of any offer to buy any securities. This report or summary is prepared for general circulation and general information only. It does not have regard to the specific investment objectives, financial situation or the particular needs of any person who may receive this report or summary. Investors should seek financial advice regarding the appropriateness of investing in any securities or investment strategies discussed or recommended in this report or summary and should understand that statements regarding future prospects may not be realized. Performance in the past is not a guide to future performance. SpareBank 1 Markets accepts no liability whatsoever for any direct or consequential loss arising from the use of this publication or its contents. These materials may not be reproduced, distributed or published by any recipient for any purpose. Please cite source when quoting. Notice to U.S. Investors If this report is being furnished directly to U.S. recipients by a non-u.s. SpareBank 1 Markets entity in reliance on section (a)(2) of Rule 15a-6 under the U.S. Securities Exchange Act of 1934, as amended (each a direct U.S. recipient ), each such direct U.S. recipient of this report represents and agrees, by virtue of its acceptance thereof, that it is major U.S. institutional investor (as such term is defined in section (b)(4) of Rule 15a-6) and that it understands the risks involved in executing transactions in such securities. Any direct U.S. recipient of this report that wishes to discuss or receive additional information regarding any security or issuer mentioned herein, or engage in any transaction to purchase or sell or solicit or offer the purchase or sale of such securities, should contact a registered representative of SpareBank 1 Capital Markets Inc. ( SpareBank 1 Capital Markets ), a registered U.S. broker-dealer and member of FINRA and SIPC. In certain cases, unless prohibited by the provisions of Regulation S under the U.S. Securities Act of 1933, as amended, this report may be provided by SpareBank 1 Capital Markets to a U.S. recipient (a SpareBank 1 Capital Markets U.S. recipient ), in which case each such SpareBank 1 Capital Markets U.S. recipient of this report represents and agrees, by virtue of its acceptance thereof, that it is major U.S. institutional investor (as such term is defined in section (b)(4) of Rule 15a-6), or that it is a U.S. institutional investor (as such term is defined in section (b)(7) of Rule 15a-6), and that it understands the risks involved in executing transactions in such securities. In such cases, SpareBank 1 Capital Markets accepts responsibility for the content of this report; however, although it has accepted responsibility for the content of this report in such cases, SpareBank 1 Capital Markets did not contribute to the preparation of this report, and the specific authors of the report are not employed by, and are not associated persons of, SpareBank 1 Capital Markets. The SpareBank 1 Markets entity that prepared the report, and the authors of this report, may not be subject to all of the registration, qualification, disclosure, independence and other U.S. regulatory requirements that apply to SpareBank 1 Capital Markets and its employees and associated persons. Any SpareBank 1 Capital Markets U.S. recipient of this report that wishes to discuss or receive additional information regarding any security or issuer mentioned herein, or to engage in any transaction to purchase or sell or solicit or offer the purchase or sale of such securities, should contact a registered representative of SpareBank 1 Capital Markets. 19

20 Disclaimer Any transaction in the securities discussed in this report by U.S. persons (other than a registered U.S. broker-dealer or bank acting in a broker-dealer capacity) must be effected with or through SpareBank 1 Capital Markets. The securities referred to in this report may not be registered under the U.S. Securities Act of 1933, as amended, and the issuer of such securities may not be subject to U.S. reporting and/or other requirements. Available information regarding the issuers of such securities may be limited, and such issuers may not be subject to the same auditing and reporting standards as U.S. issuers. Such information is provided for informational purposes only and does not constitute a solicitation to buy or an offer to sell any securities under the Securities Act of 1933, as amended, or under any other U.S. federal or state securities laws, rules or regulations. The investment opportunities discussed in this report may be unsuitable for certain investors depending on their specific investment objectives, risk tolerance and financial position. In jurisdictions where SpareBank 1 Capital Markets is not registered or licensed to trade in securities, commodities or other financial products, transactions may be executed only in accordance with applicable law and legislation, which may vary from jurisdiction to jurisdiction and which may require that a transaction be made in accordance with applicable exemptions from registration or licensing requirements. The information in this publication is based on carefully selected sources believed to be reliable, but SpareBank 1 Capital Markets does not make any representation with respect to its completeness or accuracy. All opinions expressed herein reflect the author s judgment at the original time of publication, without regard to the date on which you may receive such information, and are subject to change without notice. The information contained herein may include forward-looking statements as described above within the meaning of U.S. federal securities laws that are subject to risks and uncertainties. Factors that could cause a company s actual results and financial condition to differ from expectations include, without limitation: political uncertainty, changes in general economic conditions that adversely affect the level of demand for the company s products or services, changes in foreign exchange markets, changes in international and domestic financial markets and in the competitive environment, and other factors relating to the foregoing. All forward-looking statements contained in this report are qualified in their entirety by this cautionary statement. 20

Petter Narvestad (+47) 23 11 30 40 pn@fondsfinans.no
 23 11 30 40 pn@fondsfinans.no") Supply market report Siem Offshore 3Q12 Preview Recommendation Buy - Target NOK 12.5 23.10.2012 Petter Narvestad (+47) 23 11 30 40 pn@fondsfinans.no This report was prepared by an analyst employed by Fondsfinans
Supply market report Siem Offshore 3Q12 Preview Recommendation Buy - Target NOK 12.5 23.10.2012 Petter Narvestad (+47) 23 11 30 40 pn@fondsfinans.no This report was prepared by an analyst employed by Fondsfinans
Time to reap synergies
 Time to reap synergies Fondsfinans Research Sparebank 1 Østfold-Akershus - 4Q14 Update Recommendation: BUY Target NOK 180 16 February 2015 Prepared by Analyst: Geir Kristiansen, Fondsfinans AS, tel: 23
European Freight Forwarding Index
 European Freight Forwarding Index Volume development in January 14 Erik Bergöö erbe@danskebank.dk +45 45 12 36 Philip Levin phle@danskebank.dk +45 26 19 26 17 Important disclosures and certifications are
Registration no. 33 36 97 94
 Registration no. 33 36 97 94 Viking Supply Ships A/S Financial Report Contents Page Summary of events 3 Operational highlights 3 Financial highlights 3 Financing and capital structure 4 Subsequent events
When the going get tough...
 When the going get tough... Fondsfinans Research Sparebank 1 SR Bank 2Q15 Update Recommendation: BUY Target NOK 62 13 August 2015 Prepared by Analyst: Geir Kristiansen, Fondsfinans AS, tel: 23 11 30 11,
And we are BUYING a Stairway to Heaven
 And we are BUYING a Stairway to Heaven BRIDGE 4Q12 UPDATE Recommendation: BUY Target: NOK 18 (16) 01.03.2013 Analyst: Morten E Lindbæck, tel: +4723113068 This report was prepared by an analyst employed
BUY Target: 215p. Strategic impact: cross-selling. Financial impact: good value
 UK Daily Letter 1 K3 Business Technology Group KBT : AIM : 144p BUY Target: 215p Bob Liao, CFA 44.20.7050.6654 bliao@canaccordgenuity.com COMPANY STATISTICS: 52-week Range: 0.82-1.50 Avg. Daily Vol. (000s):
European Freight Forwarding Index
 European Freight Forwarding Index 14 January 13 Erik Bergöö erbe@danskebank.dk +45 45 12 36 Søren Toft stof@danskebank.dk +45 45 12 53 Important disclosures and certifications are contained from page 12
The Norwegian High Yield Bond Market. Marine Finance Forum New York, Nov 9, 2010
 The Norwegian High Yield Bond Market Marine Finance Forum New York, Nov 9, 2010 Highlights The international high yield bond markets are active with record issuance volumes and decreasing yields The traditional
Presentation to Dockwise. 24 April 2012
 Presentation to Dockwise 24 April 2012 Disclaimer This presentation has been prepared by Fairstar Heavy Transport NV ( FHT or the company ). This presentation is for information purposes only. This presentation
Background information. Changes in the shareholder structure and balance sheet. Contract with Google prolonged for two years
 A cc or # $T ypcap$ 1628 1 0 4 2 Page 1/5 Equity flash Newsflow Telecommunication HOLD (HOLD) Target EUR 4.00 (EUR 4.00) Price (last closing price) : EUR 2.84 Upside : 40 % Est. change 2015e 2016e EPS
In line performance. Results update 4Q2015. Banks UAE 28 January 2016 DUBAI ISLAMIC BANK
 28 Jan 15 28 Apr 15 28 Jul 15 28 Oct 15 DUBAI ISLAMIC BANK In line performance Results update 4Q2015 Banks UAE 28 January 2016 Dubai Islamic Bank s (DIB) reported net profit of AED865mn, in-line with our
Petrel Energy Ltd. This report is intended for CCMInternalDistribution@clarksons.com. Unauthorized redistribution of this report is prohibited.
 Exploration and Production Equity Research July 30, 2013 Crikey! Aussie Microcap Exploring Unconventional Resources on 3 Continents The smallest of our coverage companies, with exploration assets in Uruguay,
Introduction to the Nordic Non-Investment Grade Corporate Bond Market
 Introduction to the Nordic Non-Investment Grade Corporate Bond Market Paul Gregory Head of Corporate Origination, Debt Capital Markets, Danske Bank 21 October 213 Credit Market Backdrop Still Attractive
The Merchant Securities FTSE 100. Hindsight II Note PRIVATE CLIENT ADVISORY
 The Merchant Securities FTSE 100 Hindsight II Note Our first FTSE-100 Hindsight Note is now fully subscribed; however, as a result of exceptional investor demand we are launching the FTSE- 100 Hindsight
/ FIRST QUARTER 2012 PRESENTATION. Bergen, May 15 2012 / GC RIEBER SHIPPING S BUSINESS IDEA. Industrial company with business within offshore shipping
 / FIRST QUARTER 212 PRESENTATION Bergen, May 15 212 / 1 / GC RIEBER SHIPPING S BUSINESS IDEA Industrial company with business within offshore shipping Owns and operates multi-purpose built vessels Focus
Research Commodities El Niño returns grains and soft commodities at risk
 Investment Research General Market Conditions 20 May 2015 Research Commodities El Niño returns grains and soft commodities at risk Meteorologists now agree that El Niño has arrived and project that it
4Q 11. Deep Sea Supply Plc Presentation 29 Feb 2012
 4Q 11 Deep Sea Supply Plc Presentation 29 Feb 2012 HIGHLIGHTS 4Q 11 Improved financials Reduced cost due to inhouse technical & crew management 7 new long term charter contracts and more to come Growth
Gjensidige Insurance Group Q4 2008 and preliminary 2008
 Gjensidige Insurance Group Q4 2008 and preliminary 2008 Disclaimer The information contained herein has been prepared by and is the sole responsibility of Gjensidige Forsikring BA ( the Company ). Such
Gujarat State Petronet Ltd. INR 135
 Jan-15 Mar-15 May-15 Jul-15 Sep-15 Nov-15 Jan-16 India Equity Institutional Research Oil & Gas RESULT UPDATE Gujarat State Petronet Ltd. INR 135 Growth in volumes to propel earnings Accumulate Gujarat
Registration no. 33 36 97 94
 Registration no. 33 36 97 94 Viking Supply Ships A/S Financial Report FINANCIAL REPORT Contents Page Summary of events 3 Operational highlights 3 Financial highlights 4 Financing and capital structure
Fearnley Securities. 28 th Annual Marine Money Week. New Issuance through the Norwegian Bond Market. June 2015
 Fearnley Securities New Issuance through the Norwegian Bond Market 28 th Annual Marine Money Week June 215 IMPORTANT / DISCLAIMER: This presentation is prepared by Fearnley Securities, an Astrup Fearnley
BDI BioEnergy Intern. 20.0 Neutral. Activity level in Q3 might not support FY estimates
 8/11/1 8/1/11 8/3/11 8/5/11 8/7/11 8/9/11 8/11/11 8/1/12 8/3/12 8/5/12 8/7/12 8/9/12 MATELAN Research Preview Note Price as of 9/11/12: 8.69 12 November 212 Company / Sector Fair Value Recommendation BDI
Registration no. 33 36 97 94. Viking Supply Ships Financial Report Q3 2012
 Registration no. 33 36 97 94 Viking Supply Ships Financial Report FINANCIAL REPORT FOR SUMMARY OF EVENTS FOR THE PERIOD JANUARY SEPTEMBER Total revenue for amounted to 279 MNOK, with an EBITDA of 109 MNOK.
NORDEN RESULTS. 1 st quarter of 2013. Hellerup, Denmark 15 May 2013. Our business is global tramp shipping. NORDEN 1st quarter of 2013 results 1
 NORDEN RESULTS 1 st quarter of 2013 Hellerup, Denmark 15 May 2013 NORDEN 1st quarter of 2013 results 1 AGENDA Group highlights Financial highlights Market update Full year financial guidance Q & A NORDEN
Preview 4Q11 1 February 2012 Share Price: NOK 67.85 (31.01.2012) Results Date 9 February 2012 Target: NOK 73 (75) Solid operations, rich valuation.
 Results Date 9 February 2012 Target: NOK 73 (75) Solid operations, rich valuation.") Neutral Preview 11 1 February 2012 Share Price: NOK 67.85 (31.01.2012) Results Date 9 February 2012 Target: NOK 73 (75) Share data Sector Financials Bloomberg GJF NO Risk rating Low Outstanding shares
Neutral Preview 11 1 February 2012 Share Price: NOK 67.85 (31.01.2012) Results Date 9 February 2012 Target: NOK 73 (75) Share data Sector Financials Bloomberg GJF NO Risk rating Low Outstanding shares
Sandnes Sparebank (SADG)
") (SADG) BUY Initial Coverage Share Price: NOK 77.0 25 September 2013 Target Price: NOK 106.0 Share data Sector Banks Bloomberg SADG NO Equity Risk rating Low Outstanding shares (million) 7.1 Market cap
(SADG) BUY Initial Coverage Share Price: NOK 77.0 25 September 2013 Target Price: NOK 106.0 Share data Sector Banks Bloomberg SADG NO Equity Risk rating Low Outstanding shares (million) 7.1 Market cap
RAJESH EXPORTS LIMITED GLOBAL PRESENCE IN GOLD AND GOLD PRODUCTS. Earnings Presentation Q2 FY16
 RAJESH EXPORTS LIMITED GLOBAL PRESENCE IN GOLD AND GOLD PRODUCTS Earnings Presentation Q2 FY16 Company Overview COMPANY OVERVIEW Rajesh Exports Ltd. (REL) was incorporated in 1989. Currently REL is a leader
Conference Call Q1-2015/2016
 Conference Call Q1-2015/2016 DIRK KALIEBE August 12, 2015 Highlights Q1-2015/2016 Strategic reorientation is taking effect Good order situation, improved backlog Strong revenue growth due to solid order
Graphite Electrodes. Imposition of antidumping duty augurs well. Sector Update. ICICI Securities Ltd Retail Equity Research.
 Sector Update Rating matrix Target price Company Old New CMP Potential Upside HEG 225 275 238 19% Graphite India 85 15 91 18% Target period 12-15 months Price performance (%) Return % 1M 3M 6M 12M HEG
Proposal to Build the First Truly Global Beer Company October 7, 2015
 Proposal to Build the First Truly Global Beer Company October 7, 2015 Disclaimer NOT FOR RELEASE, PUBLICATION OR DISTRIBUTION IN WHOLE OR IN PART IN, INTO OR FROM ANY JURISDICTION WHERE TO DO SO WOULD
Quarterly Income Statement
 1 ST QUARTER 2016 Disclaimer This Presentation has been produced by Komplett Bank ASA (the Company or Komplett Bank ), solely for use at the presentation to investors and is strictly confidential and may
Wilh. Wilhelmsen ASA. > Third Quarter 2014. Jan Eyvin Wang President and CEO. 11 November 2014, Lysaker
 Wilh. Wilhelmsen ASA > Third Quarter 214 Jan Eyvin Wang President and CEO 11 November 214, Lysaker Disclaimer This presentation contains forward-looking expectations which are subject to risk and uncertainties
Oceaneering Reports First Quarter 2016 Results
 PRESS RELEASE Oceaneering Reports First Quarter 2016 Results April 25, 2016 Houston, Texas Oceaneering International, Inc. ( Oceaneering or the Company ) (NYSE:OII) today reported net income of $25.1 million,
Joint Offshore Business Development: What are the Implications?
 K LINE OFFSHORE AS PRESENTATION K LINE OFFSHORE AS PRESENTATION Joint Offshore Business Development: What are the Implications? Maritime Offshore Technology Seminar Tokyo, 2 nd November 2012 Tomoyuki Okawa
In aluminium we trust!
 In aluminium we trust! Recommendation: BUY Target NOK 55 (48) 12.02.2015 Prepared by Analyst: Daniel Johansson, Fondsfinans AS, tel: 23 11 30 61, e-mail: dj@fondsfinans.no This report was prepared by an
US Labour Market Monitor July report set to attract much attention as both employment and growth have slowed in 2016
 Investment Research General Market Conditions 02 August 2016 US Labour Market Monitor July report set to attract much attention as both employment and growth have slowed in 2016 Jobs report preview We
Company Update Share Price: NOK 54 14 August 2014 Target Price: NOK 70 (68) Building the capital base
 Building the capital base") SpareBank 1 SMN BUY Company Update Share Price: NOK 54 14 August 2014 Target Price: NOK 70 (68) Building the capital base Share data 14.08.2014 Sector Banks Bloomberg MING NO Risk rating Low Outst. shares
SpareBank 1 SMN BUY Company Update Share Price: NOK 54 14 August 2014 Target Price: NOK 70 (68) Building the capital base Share data 14.08.2014 Sector Banks Bloomberg MING NO Risk rating Low Outst. shares
8th January 2016. SEB Nordic Seminar 2016
 8th January 2016 SEB Nordic Seminar 2016 Disclaimer All statements in this presentation other than statements of historical fact are forward-looking statements, which are subject to a number of risks,
Renminbi Depreciation and the Hong Kong Economy
 Thomas Shik Acting Chief Economist thomasshik@hangseng.com Renminbi Depreciation and the Hong Kong Economy If the recent weakness of the renminbi persists, it is likely to have a positive direct impact
Palangana expansion fully permitted; Burke Hollow receives disposal well permit. Associate: Michael Wichterle, MBA,
 Equity Research Price (C$) Volume (M) May 27, 2015 Research Update URANIUM ENERGY CORP. Palangana expansion fully permitted; Burke Hollow receives disposal well permit EVENT Uranium Energy Corp. announced
SUMMARY. Risk Level *
 March 09, 2015 AGL Resources Inc. Current Recommendation Prior Recommendation Neutral Date of Last Change 03/09/2015 Current Price (03/06/15) $47.11 Target Price $43.00 UNDERPERFORM SUMMARY (GAS-NYSE)
Seadrill Partners LLC. Wells Fargo Pipeline, MLP and Energy Symposium December 2012
 Seadrill Partners LLC Wells Fargo Pipeline, MLP and Energy Symposium December 2012 Forward Looking Statement This presentation contains forward-looking statements (as defined in Section 21E of the Securities
Trxade Group, Inc. (TCQB: TRXD): Record Revenues in Q3
: Record Revenues in Q3") Siddharth Rajeev, B.Tech, MBA, CFA Analyst November 5, 2015 Trxade Group, Inc. (TCQB: TRXD): Record Revenues in Q3 Sector/Industry: E-commerce Market Data (as of November 5, 2015) Current Price $1.15 Fair
Siddharth Rajeev, B.Tech, MBA, CFA Analyst November 5, 2015 Trxade Group, Inc. (TCQB: TRXD): Record Revenues in Q3 Sector/Industry: E-commerce Market Data (as of November 5, 2015) Current Price $1.15 Fair
INVESTMENT CASE FULLY INTACT
 Leifheit AG Q2 results due out on 12/08/2015 07/08/2015 INVESTMENT CASE FULLY INTACT Buy 60.00 EUR Close (06/08/2015) 47.68 EUR Bloomberg: LEI WKN: 646450 Sector Share price performance Consumer 52 week
Charter owners view on container lines grouping into alliances
 Charter owners view on container lines grouping into alliances Results Results of of the the 8th 8th Maritime Maritime Trend Trend Barometer Barometer Hamburg, Hamburg, February February 2014 2014 2 Contents
Coal India Ltd. Subdued e-auction realization impacted profitability BUY. Nov. 17, 2015
 17-Nov-14 17-Dec-14 17-Jan-15 17-Feb-15 17-Mar-15 17-Apr-15 17-May-15 17-Jun-15 17-Jul-15 17-Aug-15 17-Sep-15 17-Oct-15 Coal India Ltd. Subdued e-auction realization impacted profitability Coal India Ltd.
GAIL (India) Ltd. INR 346
 Ltd. INR 346") Feb-15 Apr-15 Jun-15 Aug-15 Oct-15 Dec-15 Feb-16 India Equity Institutional Research Oil & Gas RESULT UPDATE GAIL (India) Ltd. INR 346 Good performance; Near term outlook looks stable BUY GAIL reported
Feb-15 Apr-15 Jun-15 Aug-15 Oct-15 Dec-15 Feb-16 India Equity Institutional Research Oil & Gas RESULT UPDATE GAIL (India) Ltd. INR 346 Good performance; Near term outlook looks stable BUY GAIL reported
Cinda International. Hold (Initiation) Target price: HK$1.55. Facing intense competition from Chinese brokers in HK; initiate at Hold
 Target price: HK$1.55. Facing intense competition from Chinese brokers in HK; initiate at Hold") Equity Research Financials Cinda (111 HK) Hold (Initiation) Target price: HK$1.55 Facing intense competition from Chinese brokers in HK; initiate at Hold China Cinda s international business platform Cinda
Equity Research Financials Cinda (111 HK) Hold (Initiation) Target price: HK$1.55 Facing intense competition from Chinese brokers in HK; initiate at Hold China Cinda s international business platform Cinda
NOBINA AB INVESTOR PRESENTATION, Q3, SEPTEMBER NOVEMBER 2015
 NOBINA AB INVESTOR PRESENTATION,, SEPTEMBER NOVEMBER 2015 LARGEST PUBLIC TRANSPORT COMPANY IN THE NORDIC REGION Nobina s economies of scale, market expertrise and outstanding bus fleet, combined with long-term
Quant Picks United Breweries
 October 6, 2015 Quant Picks United Breweries Research Analyst Amit Gupta amit.gup@icicisecurities.com Raj Deepak Singh rajdeepak.singh@icicisecurities.com Azeem Ahmad azeem.ahmad@icicisecurities.com i
2015 FIRST QUARTER RESULTS. 13 May 2015
 2015 FIRST QUARTER RESULTS 13 May 2015 Safe Harbor Statement This Presentation contains certain forward-looking statements. Forward-looking statements concern future circumstances and results and other
Heimstaden Q1 16: Stable quarter with continued transactions
 Investment Research 29 April 2016 Heimstaden 16: Stable quarter with continued transactions Heimstaden showed a stable operating performance in despite continued intense transaction activity. Leverage
Guggenheim Investments. European High-Yield and Bank Loan Market Overview
 Guggenheim Investments European High-Yield and Bank Loan Market Overview August 2015 European High-Yield & Bank Loan Market Overview Please see disclosures and legal notice at end of document. 2 August
Heimstaden Q3 15: steady performance with moderate leverage
 Investment Research 13 November 2015 Heimstaden Q3 15: steady performance with moderate leverage Heimstaden delivered a stable performance in Q3, with continued good growth thanks to earlier made acquisitions
G5 Entertainment. G5 Entertainment. Quarter Update Q3 15. Amended strategy and boosted profitability
 Quarter Update Q3 15 Last updated on the 18/11/2015 Share Price Market Capitalisation Target Price 41.00 SEK 360.8m SEK 49.05 SEK Amended strategy and boosted profitability reported their third quarter
Q1 2016 analyst and investor presentation. Tuesday 26 January 2016
 Q1 2016 analyst and investor presentation Tuesday 26 January 2016 Q1 performance Overview 1. Resilient commercial performance Robust demand environment drives strong start to the quarter Impact of Sharm
Sundaram Finance. Target price (INR) 452 Momentum in loans sustains, upgrade to Hold
 452 Momentum in loans sustains, upgrade to Hold") HOLD Target price (INR) 452 Momentum in loans sustains, upgrade to Hold India Equity Research Financials January 30, 2013 Rating The higher than expected growth in the NII was driven by an improvement
HOLD Target price (INR) 452 Momentum in loans sustains, upgrade to Hold India Equity Research Financials January 30, 2013 Rating The higher than expected growth in the NII was driven by an improvement
Why ECB QE is Negative for Commodities. Investment Research & Advisory. Deltec International Group
 Atul Lele alele@deltecinv.com +1 242 302 4135 David Munoz dmunoz@deltecinv.com +1 242 302 4106 David Frazer dfrazer@deltecinv.com +1 242 302 4156 Why ECB QE is Negative for Commodities Recent ECB Quantitative
SUPREME INDUSTRIES LTD Plastic Products HOLD RETAIL EQUITY RESEARCH
 Q2FY16 RESULT UPDATE GEOJIT BNP PARIBAS Research RETAIL EQUITY RESEARCH SUPREME INDUSTRIES LTD Plastic Products BSE CODE:509930 NSE CODE: SUPREMEIND Bloomberg CODE: SIL IN SENSEX: 24,470 HOLD CMP Rs725
GlaxoSmithKline Consumer Healthcare
 Strong pricing power, Attractive valuations "BUY" February 09, 2016 Amnish Aggarwal amnishaggarwal@plindia.com +91 22 66322233 Gaurav Jogani gauravjogani@plindia.com +91 22 66322238 Rating BUY Price Rs5,837
Third quarter results 2012
 Q3 Third quarter results 2012 Fornebu, Øyvind Eriksen and Leif Borge 2012 Aker Solutions Slide 1 Agenda Q3 2012 Introduction Øyvind Eriksen Executive chairman Financials Leif Borge President & CFO Q&A
- 2/5 - September 16, 2014. This page is intentionally left blank
 September 16, 2014 Information Analysis Evaluation Result Fair Value Analysts David Szabadvari, CIIA Dr. Roger Becker, CEFA +49 69 71 91 838-48, -46 david.szabadvari@bankm.de, roger.becker@bankm.de N.A.
2015 Half-Year Results
 2015 Half-Year Results 26 August 2015 Copyright Copyright 2015 2015 APR Energy. APR Energy. All Rights All Rights Reserved. Reserved. APR Energy, APR Energy, its logo, its logo, and Powering and Powering
/ FOURTH QUARTER 2011 PRESENTATION. Bergen, February 24, 2012 / GC RIEBER SHIPPING S BUSINESS IDEA
 / FOURTH QUARTER 211 PRESENTATION Bergen, February 24, 212 / 1 / GC RIEBER SHIPPING S BUSINESS IDEA Industrial company with business within offshore/shipping Owns and operates multi-purpose built vessels
2018-04 SEK ING Sprinter Sverige ING Bank NV (NL) 20 Units Outperformance Bonus Certificates linked to OMX due 2018-04
 20 Units Outperformance Bonus Certificates linked to OMX due 2018-04") 2018-04 SEK ING Sprinter Sverige ING Bank NV (NL) 20 Units Outperformance Bonus Certificates linked to OMX due 2018-04 Product Description This 5YR SEK Outperformance Bonus Certificate is linked to the
2018-04 SEK ING Sprinter Sverige ING Bank NV (NL) 20 Units Outperformance Bonus Certificates linked to OMX due 2018-04 Product Description This 5YR SEK Outperformance Bonus Certificate is linked to the
Conference Call Q3-2015/2016 GEROLD LINZBACH, CEO I DIRK KALIEBE, CFO. February 10, 2016 ON THE RIGHT TRACK
 Conference Call Q3-2015/2016 GEROLD LINZBACH, CEO I DIRK KALIEBE, CFO February 10, 2016 ON THE RIGHT TRACK On the right track Heidelberg is on track - the improvement in results due to the strategic realignment
Tetragon Financial Group Limited ( TFG )
") Tetragon Financial Group Limited ( TFG ) 12 August 2014 THE INFORMATION CONTAINED HEREIN DOES NOT CONSTITUTE AN OFFER TO SELL OR A SOLICITATION OF AN OFFER TO PURCHASE ANY SECURITY OF TFG. THIS INFORMATION
Tetragon Financial Group Limited ( TFG ) 12 August 2014 THE INFORMATION CONTAINED HEREIN DOES NOT CONSTITUTE AN OFFER TO SELL OR A SOLICITATION OF AN OFFER TO PURCHASE ANY SECURITY OF TFG. THIS INFORMATION
Commodities. Precious metals as an asset class. April 2011. What qualifies as an asset class? What makes commodities an asset class?
 Commodities Precious metals as an asset class April 2011 What qualifies as an asset class? Broadly speaking, an asset class is simply a grouping of assets that possess similar characteristics. Defining
Corporate and Corporate Bond Rating MITEC Automotive AG Germany, Automotive suppliers
 MITEC Automotive AG Germany, Automotive suppliers www.scoperatings.com Corporate profile Founded in 1990, MITEC Automotive AG ( MITEC ) is a German auto supplier specialising in automobile propulsion technology,
Bright Smart (1428 HK)
") Equity Research Financials Bright Smart (1428 ) Hold (initiation) Target price: $1.70 Local broker with high ROE; initiate at Hold Local broker with expansion ambition Bright Smart is a securities, commodities
Equity Research Financials Bright Smart (1428 ) Hold (initiation) Target price: $1.70 Local broker with high ROE; initiate at Hold Local broker with expansion ambition Bright Smart is a securities, commodities
Songa Offshore Refinancing. 15 March 2016
 Songa Offshore Refinancing 15 March 2016 Disclaimer IMPORTANT INFORMATION AND DISCLAIMER This presentation (the Presentation ) has been prepared by Songa Offshore SE ("Songa Offshore or the Company ),
Britannia Industries
 Rally in Input costs near term drag, Maintain BUY June 20, 2016 Amnish Aggarwal amnishaggarwal@plindia.com +91 22 66322233 Gaurav Jogani gauravjogani@plindia.com +91 22 66322238 Rating BUY Price Rs2,641
euromicron AG Corrections to financial statements Hold 14.00 EUR
 euromicron AG Corrections to financial statements 24/03/2015 Hold 14.00 EUR Close (23/03/2015) Bloomberg: EUCA Sector Share price performance 14.15 EUR WKN: A1K030 Technology 52 week high 14.18 52 week
Telio & NextGenTel. NextGenTel Holding ASA. Q1 2015 Presentation. Eirik Lunde, CEO. Felix Konferansesenter Oslo 7 May 2015
 Telio & NextGenTel NextGenTel Holding ASA Q1 215 Presentation Eirik Lunde, CEO Felix Konferansesenter Oslo 7 May 215 This is NextGenTel Group Background Telio Pioneer in the Norwegian VoIP market rapid
DNO ASA Corporate Presentation and Update
 DNO ASA Corporate Presentation and Update Haakon Sandborg, CFO Swedbank Nordic Energy Summit 19 March 2015 Oslo, Norway DNO at a glance Norwegian oil and gas operator focused on the Middle East and North
Tough Quarters Ahead, Downgrade to Reduce
 : Tsingtao Brewery (00168 HK) Sunny Kwok 郭 日 升 公 司 报 告 : 青 岛 啤 酒 (00168 HK) +852 2509 2642 sunny.kwok@gtjas.com.hk Tough Quarters Ahead, Downgrade to Reduce 未 来 数 季 情 况 更 严 峻, 下 调 至 减 持 GTJA Research 国
DATRON AG. Investor day supports our positive view. Buy (Buy) 12.50 EUR (12.50 EUR ) BANKHAUS LAMPE // 1 17/09/2015
 12.50 EUR (12.50 EUR ) BANKHAUS LAMPE // 1 17/09/2015") BANKHAUS LAMPE // 1 DATRON AG Investor day supports our positive view 17/09/2015 Buy (Buy) 12.50 EUR (12.50 EUR ) Close 15/09/2015 9.75 EUR Bloomberg: DAR GY WKN: A0V9LA Sector Engineering Share price
BANKHAUS LAMPE // 1 DATRON AG Investor day supports our positive view 17/09/2015 Buy (Buy) 12.50 EUR (12.50 EUR ) Close 15/09/2015 9.75 EUR Bloomberg: DAR GY WKN: A0V9LA Sector Engineering Share price
NewWave GBP Currency ETN
 Price Corporate and Investment Banking NewWave GBP Currency ETN Valuation Date 31 December 2015 NewWave Exchange Traded Notes (ETNs) constitute unconditional, unsecured and unsubordinated obligations of
QE, Credit Markets and Bubbles
 Spring 2014 QE, Credit Markets and Bubbles David Zervos Chief Market Strategist dzervos@jefferies.com +1 212 323 7586 US Monetary Base 4.5 4 3.5 QE3 3 Trillion USD 2.5 2 QE2 1.5 QE1 1 0.5 Operation Twist
Pareto Securities 21 st Oil & Offshore Conference Oslo, September 10-11, 2014
 Pareto Securities 21 st Oil & Offshore Conference Oslo, September 10-11, 2014 Cautionary Statement This presentation contains forward looking information Forward looking information is based on management
Maruti Suzuki. Source: Company Data; PL Research
 Q3 results subdued, Outlook remains good; BUY January 28, 2016 Rohan Korde rohankorde@plindia.com +91 22 66322235 Rating BUY Price Rs4,103 Target Price Rs4,844 Implied Upside 18.1% Sensex 24,470 Nifty
Issuing corporate bonds in Oslo an efficient, flexible and mature market for raising debt capital
 Issuing corporate bonds in Oslo an efficient, flexible and mature market for raising debt capital THE NORWEGIAN BOND MARKET AN EFFICIENT SOURCE OF DEBT CAPITAL Bente A. Landsnes President and CEO of Oslo
Research Analysts. April 8, 2016. West Coast Paper Mills WESCOA Buy in the range of 75-78 96.00 68.00
 Stocks on the move Scrip IDi I-Direct tcode Action Target Stoploss West Coast Paper Mills WESCOA Buy in the range of 75-78 96.00 68.00 Time Frame: 3 Months Research Analysts Dharmesh Shah dharmesh.shah@icicisecurities.com
Increasing estimates and PT on expectation of solid earnings momentum. Growth momentum and turnaround of insurance business
 A cc or # $T ypcap$ 1628 1 0 4 2 Equity flash Trading Update Financial Services Hypoport AG BUY (BUY) Target 21.00 EUR (17.00 EUR) Price (last closing price) : 18.49 EUR Upside : 14% Est. change 2015e
db Currency Harvest Deutsche Bank Global Currency Harvest Index Deutsche Bank Balanced Currency Harvest Index Deutsche Bank G10 Currency Harvest Index
 GLOBAL MARKETS CURRENCIES & COMMODITIES db Currency Harvest Deutsche Bank Global Currency Harvest Index Deutsche Bank Balanced Currency Harvest Index Deutsche Bank G10 Currency Harvest Index Introducing
2014 Annual General Meeting. 23 October 2014
 2014 Annual General Meeting 23 October 2014 Disclaimer This presentation has been prepared by SKILLED Group Limited (ASX:SKE). The information contained in this presentation is of a general nature only,
2 N D Q U A R T E R 2 0 1 6. O s l o, 1 8 J u l y 2 0 1 6
 2 N D Q U A R T E R 2 1 6 O s l o, 1 8 J u l y 2 1 6 Agenda Per A Sørlie, President & CEO Highlights Business areas Outlook Per Bjarne Lyngstad, CFO Financial performance 2 Highlights 2 nd quarter 216
CEWE Stiftung & Co. KGaA
 CEWE Stiftung & Co. KGaA Solid development - on track to reaching targets 12/05/2015 Hold 60.00 EUR Close (11/05/2015) 57.81 EUR Bloomberg: CWC WKN: 540390 Sector Share price performance Consumer 52 week
Company Overview. Financial Performance
 Jan/15 Feb/15 Mar/15 Apr/15 May/15 Jun/15 Jul/15 Aug/15 Sep/15 Oct/15 Nov/15 Dec/15 SPS Finquest Ltd CMP: 84.60 January 13, 2015 Stock Details BSE code 538402 BSE ID SPS Face value ( ) 10 No of shares
OCEAN YIELD AS Pareto Offshore Conference. 13 September 2012
 OCEAN YIELD AS Pareto Offshore Conference 13 September 2012 Ocean Yield AS A new shipping company established in Q1 2012 Portfolio of oil-service assets with long-term charters Balance sheet Q2 2012: $
Satisfactory Top-Line; Disappointing Bottom-Line
 : Tsingtao Brewery (00168 HK) 公 司 报 告 : 青 岛 啤 酒 (00168 HK) Satisfactory Top-Line; Disappointing Bottom-Line 销 售 增 长 理 想 但 盈 利 能 力 令 人 失 望 Sunny Kwok 郭 日 升 +852 2509 2642 sunny.kwok@gtjas.com.hk GTJA Research
Siem Offshore Inc. Supplementing information contained in the Prospectus dated 17 August 2015 concerning the Rights Issue in Siem Offshore Inc.
 Siem Offshore Inc. Supplementing information contained in the Prospectus dated 17 August 2015 concerning the Rights Issue in Siem Offshore Inc. This document (the Supplemental Prospectus ) is a supplement
SAF-HOLLAND Annual Financial Statements 2012. Detlef Borghardt, CEO Wilfried Trepels, CFO. March 14, 2013
 SAF-HOLLAND Annual Financial Statements 212 Detlef Borghardt, CEO Wilfried Trepels, CFO March 14, 213 Executive Summary business volume successfully expanded in 212 1 Group sales increased yoy by 3.4%
Trends and Technology A Capital Markets Perspective
 EQUITY I RESEARCH Trends and Technology A Capital Markets Perspective RBC Capital Markets, LLC Jonathan Atkin (Analyst) (415) 633-8589 jonathan.atkin@rbccm.com January 2013 All values in U.S. dollars unless
Mphasis. FY17 could be a year of revenue growth. Source: Company Data; PL Research
 FY17 could be a year of revenue growth February 08, 2016 Govind Agarwal govindagarwal@plindia.com +91 22 66322300 Rating Accumulate Price Rs440 Target Price Rs510 Implied Upside 15.9% Sensex 24,617 Nifty
HSBC India Global Markets overview PUBLIC
 HSBC India Global Markets overview Part 1. Hedging FX and Rate Exposures FX and Rates Market Overview FX Spot and Forwards Very Liquid spot market estimated daily volume of USD 5 billion Over 15 active
Nordic Energy Summit 2014. CFO Arne Johan Dale 20.03.14
 Nordic Energy Summit 2014 CFO Arne Johan Dale 20.03.14 Highlights 2013 Signed contracts 2.9 billion Contract coverage for 2014 cover expenses Contract backlog 3.5 billion Bank financing with maturity in
Commodities not finding much traction despite USD weakness
 Commodities not finding much traction despite USD weakness Commodities continued to show weakness into the second week of 2013 despite rising stock markets and a falling US dollar. Investors are generally
Gladiator Stocks: Phillips Carbon Black (PHICAR) Time Frame: Six months
 Time Frame: Six months") Gladiator Stocks: Phillips Carbon Black (PHICAR) Time Frame: Six months CMP: 160.00 00 Buying Range: 155.00-160.00 160 Target: 196.00 Stop loss: 137.00 Upside: 25% Stock Data 52 Week High / Low 162.95/80
Gladiator Stocks: Phillips Carbon Black (PHICAR) Time Frame: Six months CMP: 160.00 00 Buying Range: 155.00-160.00 160 Target: 196.00 Stop loss: 137.00 Upside: 25% Stock Data 52 Week High / Low 162.95/80