User s Manual for Resinosa
|
|
|
- Joy Payne
- 7 years ago
- Views:
Transcription
1 User s Manual for Resinosa An Interactive Density Management Diagram for Red Pine in the Lake States Prepared by Timothy J. Mack and Thomas E. Burk Staff Paper Series Number 158 Department of Forest Resources College of Natural Resources and Minnesota Agricultural Experiment Station University of Minnesota St. Paul, Minnesota Research supported by Minnesota Agricultural Experiment Station project and the Hugo J. and Helen K. Pawek Graduate Fellowship. Authors are Graduate Research Assitant and Professor, Department of Forest Resources, University of Minnesota, St. Paul, MN 55108

2 Table of Contents Table of Contents... 2 Overview... 3 Requirements... 3 Downloading Resinosa... 3 Getting Started with Resinosa... 3 Specifying the Management Assumptions... 6 The Establishment Panel... 7 The Economics and Utilization Menu... 8 The Button Controls... 9 Modeling Price Appreciation Defining Stand Management Regimes Thin Within Stand Density Ranges Defining Custom Thinning Regimes Outputs DMD with Trajectory Graphs Model Details Economics References Appendix: Application of a density management diagram for Lake States red pine management

3 Overview Resinosa is an interactive Density Management Diagram (DMD) designed to assist foresters with the evaluation of red pine management alternatives. Unlike traditional DMDs, Resinosa is a model based DMD incorporated within a Microsoft Excel workbook. The chief advantage to this approach is that it frees the forester from the tedium and inaccuracies of the pencil and paper approach necessary with the traditional DMD. Management scenarios can be tested quickly and easily using a set of menus designed with Excel s Visual Basic for Applications tools. Data input is aided by menus, allowing those unfamiliar with Excel to quickly take advantage of Resinosa s capabilities. This manual was written under the assumption that readers already possess basic knowledge of general forestry and economic analysis. Requirements Resinosa works with any version of Microsoft Excel 2000 or later. Users are strongly discouraged from attempting to run Resinosa with earlier versions of Excel. Downloading Resinosa If you haven t done so already, you can download Resinosa from Because Resinosa is not a stand-alone executable program like many conventional growth and yield models, it does not require installation or registration with your operating system. When downloading, simply save Resinosa to the directory where you will use it. Getting Started with Resinosa Once downloaded and saved, Resinosa can be opened like any ordinary Excel workbook. It is a highly automated workbook built around the Visual Basic for Applications language. Because of this, when Resinosa is first opened you may be prompted to enable macros. Should this prompt appear on your screen you should choose Enable Macros; Resinosa will not work otherwise. Resinosa will also not work when Excel s macro security is set too high. If this is the case, choose Tools / Macro / Security from Excel s menu bar and set the security level to Medium or Low. Resinosa works best when Excel s application window is maximized. Setting your screen resolution to 1024 x 768 or higher is recommended for best display of the interactive menu system. It is also recommended that Resinosa be run without any other Excel workbooks open. Failure to do may result in Visual Basic run-time errors. 3

4 Figure 1. Resinosa s opening screen. Resinosa is a workbook composed of five worksheets: DMD with Trajectory, Graphs, Model Details, Economics, and Price Appreciation (Figure 1). A brief description of each follows: DMD with Trajectory: This is the first thing you will see after opening Resinosa (Figure 1). It is Resinosa s main output screen. This is the interactive DMD. Graphs: Resinosa offers additional graphs besides the DMD. These graphs are stored in the Graphs worksheet. Model Details: This worksheet contains the workings of the growth and yield model. All growth and yield data produced by Resinosa originate from here. Economics: This worksheet contains a detailed discounted cash flow analysis for the current management scenario. Price Appreciation: This worksheet is used to model price appreciation trends for economic analyses. 4

5 Figure 2. Accessing Resinosa s Forestry menu. Resinosa is controlled through a set of menu windows. The menu system is accessed from a special pull down menu called Forestry, located at the top of Excel s application window. Forestry will not appear if your macro security level is set too high. Refer to the Getting Started with Resinosa section for instruction to fix this. Forestry appears between Excel s standard Chart and Window menus (Figure 2). Forestry contains three items: Management Assumptions, Grow Bounded, and Grow Custom. Selecting Management Assumptions brings up a window that allows you to enter starting stand conditions and any economic assumptions you might wish to model. Grow Bounded allows you to set up a thinning schedule for your stand and project it using the DMD approach to thinning. Refer to the appendix for an example of this approach. Grow Custom allows you to interactively define a management regime for your stand. One advantage to the workbook approach is that Resinosa can be renamed or copied to as many places on your computer as you wish. This is especially useful when comparing multiple management scenarios that you may wish to refer to again in the future. 5

6 Specifying the Management Assumptions Before you can run a simulation in Resinosa you must first provide some basic starting assumptions. The minimum requirements for a growth and yield simulation include site index, establishment age, trees per acre, and quadratic mean DBH. If you wish to perform an economic analysis, you must also enter information pertaining to the timing of silvicultural prescriptions, costs, revenues, and any price appreciation trends you wish to model. Most of this is handled within the Management Assumptions Window, which can be displayed by choosing Management Assumptions from the Forestry menu. The Management Assumptions window contains two tabbed panels for entering starting stand conditions and economic assumptions; the panels are entitled Establishment and Economics and Utilization (Figure 3). The panels appear stacked upon each other within the Management Assumptions window. To activate one or the other simply click on its tab near the top of the window. You enter the starting conditions for a stand, as well as any silvicultural assumptions associated with its establishment in the Establishment panel. Note that all input and output values from Resinosa are on a per acre basis. The second panel is entitled Economics and Utilization (Figure 4). This is where additional economic assumptions are specified for economic analyses. This panel is also where you enter merchantability limits for up to two product types. Figure 3. The Establishment panel within the Management Assumptions window. 6

7 The Establishment Panel Planting Assumptions: This is the first section appearing in the Establishment panel. Data entered in this section are required solely for economic analyses. This is where you specify planting costs and the number of trees per acre to be planted. The value you provide for Trees Planted per Acre is not used by the growth model. The stems per acre value used in the growth model is provided under the section of the panel entitled Starting Assumptions. Any cost assumption entered here or elsewhere in Resinosa should always be entered in current dollars. Timing and Costs: This section allows you to specify the timing and costs for up to seven different silvicultural activities. For each activity you must specify the name of the activity, the age when it occurs, and its per acre cost. The names of any activities specified here also appear elsewhere in Resinosa. Resinosa assumes all activities, costs, and returns occur at the end of the year in which they are scheduled. For example, the stand defined in Figure 3 is to be raked in the beginning of year one, then trenched and planted at the end of year one, and released at the end of year two. Starting Assumptions: The four items provided here represent the minimum required amount of information needed to run Resinosa. Here you must provide Resinosa with the starting age and condition of the stand to be projected. Site index is required for the modeling of height growth. It is also used to calculate quadratic mean DBH when you specify the Default DBH option. All site indices are base age 50 years. The starting age specified here is used by the growth model to project the stand. Like many growth models, Resinsoa is not calibrated to model young stands. The model works best when provided with starting conditions for stands 20 years or older. Resinosa automatically matches starting age from the growth model with that of any economic analyses you start at younger ages. This ensures that all yields from the model are matched correctly within the cash flow worksheet. As with age, the number of stems per acre specified here is used by the growth model as a starting condition. This number represents the number of surviving trees per acre present at the starting age. It should generally be less than the number provided under the Planting Assumptions section. You must also provide the model with a starting quadratic mean DBH. If you are unsure of the proper DBH to use, press the Default DBH button and Resinosa will calculate diameter for you. Mean diameter is calculated as described by Benzie (1977). Basal area is calculated automatically as a guide and updated each time the stems per acre or diameter text boxes are changed. 7

8 The Economics and Utilization Menu Other Costs: This section of the Economics and Utilization panel allows you to specify additional management costs. Overhead per acre represents the sum of any yearly costs associated with management. Property tax per acre allows you to include the effects of any yearly property taxes the stand may incur. Both items are assumed to occur for every year in the planning horizon. If applicable, severance taxes are modeled on a percentage basis. For example, entering 10 percent in the severance tax textbox causes a 10 percent tax to be assessed on all harvest revenues. Percentage Rates: Here is where you enter assumptions regarding the discount and inflation rates used for the economic analysis. If you choose to model inflation be sure to also provide a nominal discount rate. Resinosa will not automatically add inflation to your discount rate. Land Value: Resinosa uses land value in the calculation of the soil expectation value (SEV). The land is assumed to be sold upon completion of the rotation. Figure 4. The Economics and Utilization panel within the Management Assumptions window. 8

9 Timing: The default starting age for an economic analysis is age zero. To use a different age, simply enter it under the Timing section. Resinosa will automatically reconcile yields from the growth model with the times used within the planning horizon. Note that the economic starting age may not exceed the model starting age. Stumpage Revenues: Resinosa allows for the merchandizing of two products. Cords and thousand board feet (MBF) are the default products. To use a different set, simply enter a new set of names and prices under Stumpage Revenues and change the corresponding utilization limits under the Utilization section. Changing the product names here also changes them throughout the rest of Resinosa. Utilization: This section allows you to define the merchantability limits for the two products Resinosa is capable of tracking. Specify diameter outside bark for the DBH limits and diameter inside bark for the top limits. Resinosa reports all volumes on a tree-length basis. No attempt is made to handle the effects of bucking on realized yield. Also, all yields are reported as gross volumes. No attempt is made to consider cull. The conversion factors define the number of cubic feet of solid wood per unit of product. The factors can be changed to match any product you might define. The default conversion factor for merchantable cubic foot volume to cords is 79 cubic feet per cord. Default MBF volume is calculated in the same manner, with a conversion factor of cubic feet per MBF 1. The Button Controls Save: The Save button at the bottom of the Management Assumption window saves any changes you have made to the Establishment or Economics and Utilization panels. Pressing Save will save any changes made to both panels, regardless of the menu currently active. Close: The Close button closes the Management Assumptions window. Close does not save any changes made to the window since the last save. Reset Defaults: The Reset Defaults button resets all of the information found in the Management Assumptions window to Resinosa s default settings. Any changes made to the settings in the window are automatically saved each time you press Save. If you save Resinosa to disk before closing the workbook the last changes will be in effect the next time you open that copy of Resinosa board per cubic feet per MBF is derived from Table 4-3 Number of rough cords per thousand board feet, Lake States of Avery and Burkhart (1983). A simple average of 2.23 cords per MBF was calculated from the conversion factors listed in the table and multiplied by 79 cubic feet of solid wood per cord, resulting in cubic feet per MBF. 9

10 Modeling Price Appreciation The Price Appreciation worksheet can be used for economic analyses when you wish to model real price appreciation or depreciation for any of the costs or revenues you have provided. Nearly all of Resinosa s data entry is handled through the menu system. This worksheet is the sole exception. Price appreciation can be modeled for overhead, property tax, all of the silvicultural activities, product revenues, and the price of land. When entering prices for any cost or revenue, always enter current dollars. Resinosa will automatically adjust prices to reflect inflation and any real appreciation or depreciation you specify in this worksheet. Figure 5 shows a sample portion of the Price Appreciation worksheet for twenty years of revenue data. Three revenues appear in the sample. They are cords, board feet, and the price of land. Under each of the revenue headings appears a column for the real rate of appreciation, the nominal rate, the real price of the revenue, and the nominal price. The real rate, in blue text, is the column you can change to include the effects of real appreciation. Adjusting this rate causes price to appreciate or depreciate above or below the specified inflation rate. The Nominal Rate column reports the inflation rate specified in the Economics and Utilization panel from the Management Assumptions window. The Real Dollars column reports the yearly price of a cost or revenue, including the real price appreciation assumption minus the effects of inflation. The Nominal Dollars column shows the predicted price of a cost or revenue including the effects of real appreciation and inflation. Price trends can be modeled for 100 years. All prices are reported for the end of year, including the effects of compounding for that year. You can use the price appreciation graph found on the Graphs worksheet to graphically analyze any real or nominal trend for any of the costs or 7revenues modeled on the Price Appreciation worksheet. Figure 5. A sample portion from a Price Appreciation worksheet. 10

11 Defining Stand Management Regimes Resinosa provides two methods for projecting management regimes. The first involves the traditional DMD approach to thinning. For this approach, upper and lower relative density lines are defined as boundaries on the DMD. Stands are then managed to stay within the boundaries until final harvest. This method is advantageous when attempting to maximize yield for a particular product. Refer to the appendix for a more detailed description of this approach. Choose Grow Bounded from the Forestry menu to apply this method. When you do so, the Thin Within Stand Density Ranges window will appear on your screen (Figure 6). This window allows you to set the management boundaries for thinning, select a final harvest method, and choose the type of thinnings you wish to implement. Thin Within Stand Density Ranges Relative Density Ranges for Thinning: This section of the window allows you to define the management boundaries Resinosa will use for scheduling thinnings. The upper and lower management lines define a region on the DMD parallel to the maximum density line, within which the stand is maintained through thinnings until final harvest. The density lines are defined as relative densities, specified as percentages. For example, in Figure 6 the upper management line is set at a relative density of 50 percent. This means that at no time will the stand be allowed to exceed 50 percent of the maximum, as defined by the maximum density line on the DMD. The lower limit for this example prevents the stand from falling below 38% of maximum density following any thinning. Figure 6. An example of the Thin Within Stand Density Ranges window. 11
.")
12 Final Harvest: This section to specify the final harvest. Check No Final Harvest and the stand will be managed through the end of the planning horizon without harvest. Specified Age allows you to set the rotation age to a fixed year. Checking Predefined DBH will manage the stand until its mean tree size first exceeds the specified DBH. Finally, if you check At Maximum NPV, Resinosa will choose the rotation age, within the allowable planning horizon, which maximizes net present value. Thinning Preference: You can specify the type of thinning Resinosa is to perform under the Thinning Preference section. The number you enter in the Percent Diameter Change textbox determines how stand mean tree diameter will be affected by a thinning. A positive change simulates a thinning from below, while a negative changes simulate thinning from above. The percent change you enter applies for all thinnings over the course of the rotation. You do not have the option of varying thinning type between thinnings. The exception is the first thinning, which can be a row thinning. Be cautious when specifying diameter changes of more than five percent, as the implied post-thin diameter distribution may be unrealistic. Run Simulation: This button runs a simulation using all of the assumptions pertaining to the stand, its establishment, and management regime you have defined. The resulting stand trajectory is displayed on the DMD with Trajectory worksheet and Resinosa s remaining graphs and reports are updated to reflect the new management scenario. Close: The Close button closes the window without running a simulation or saving any of the changes you have made to the window. Reset Defaults: The Reset Defaults button resets the default values for the window. Any changes made to the settings in the window are automatically saved each time you run a simulation. If you save Resinosa before closing the workbook,changes will be in effect the next time you open Resinosa Defining Custom Thinning Regimes The second method for developing thinning regimes in Resinsoa is interactive, allowing you to define your own management scenario. Choose Grow Custom from the Forestry menu to apply this method. When you do so, the Custom Management window will appear on your screen along with a DMD for an unmanaged stand (Figure 7). A dark green dot appears on the trajectory indicating the initial size-density condition of the stand. To create a custom management regime you move this dot along the stand s trajectory, specifying when and how management should occur. This is done with the help of the Custom Management panel appearing to the right of the DMD. A description of the panel s workings follows. Stand Age: Use the Stand Age controls to move backwards and forwards along the stand s trajectory. This can be done by adjusting the scrollbar control to the left of the age textbox, or by directly updating the age textbox with an age. The location of the dark green dot on the DMD is updated to reflect the size-density condition corresponding to the current age in the age text box. 12

13 Figure 7. Simulating management using the Custom Management window. Management Options: You can specify a thinning or final harvest at any point in the stand s trajectory. When thinning, you have the option of thinning to a residual basal area or number of stems per acre. Simply select the method you prefer by clicking its radio button. Doing so activates the controls for adjusting residual basal area or stems per acre. These controls are adjusted in the same way as the Stand Age controls. The stand trajectory is automatically updated in the DMD to reflect any changes in condition due to thinning. If you wish to simulate the effects of thinning from below, row thinning, or thinning from above you may do so by changing the post-thin mean diameter in the textbox above the Close button. The trajectory in the DMD is adjusted to reflect any changes to this box as well. If you decide against thinning, simply check the Do Nothing option and the stand trajectory will be restored to its original condition before thinning. Choose Final Harvest whenever the stand is ready for final harvest. Like the thinning options, a final harvest can be reversed by selecting Do Nothing. Harvest Information: The harvest information box displays harvest information for the current position on the stand s trajectory in terms of total cubic foot volume and the two user defined products. This box is helpful for determining the amount and type of product that is being removed during a harvest operation. 13

14 Close: The Close button closes the Custom Management window. You cannot make any adjustment to the current stand trajectory after the window is closed. Graph Options: The Graph Options button opens the Graph Options window (Figure 8), which allows you to turn on the upper and lower management lines, or a series of basal area lines on the DMD. Additionally, you can specify the location of the upper and lower DMD management lines the same way as you would using the Thin Within Stand Density Ranges window for the traditional DMD approach to thinning. Click the Close button to return to the Custom Management window after you are done adjusting the line settings. Figure 8. The Graph Options window. Outputs Resinosa is capable of reporting simulation results in several different ways. The first is in the form of a stand trajectory plotted on the DMD in the DMD with Trajectory worksheet. Additional graphs of various stand characteristics and price trends are produced in the Graphs worksheet. The Model Details worksheet provides a detailed yearly description of stand condition for the entire simulation period. Finally, the Economics page includes a detailed discounted cash flow analysis for the economic life of the simulation. A description of each follows. DMD with Trajectory The focal point of Resinosa s output capabilities is its interactive DMD (Figure 9). A stand trajectory for each management regime produced by Resinosa is plotted on the DMD in the DMD with Trajectory sheet. A Stand Detail window appears to the left of the DMD. It provides detailed point-in-time descriptions of stand conditions, including mean tree size, stand density, and yields. To see the condition of a stand at any point on the trajectory, position the mouse point on the trajectory line and stand detail for that point in time appears in the Stand Detail window. Crown ratio is calculated using the equations developed by Holdaway and others (1979). Current annual increment is calculated from yearly differences reported in the Model Detail worksheet. 14

15 Figure 9. Resinosa s interactive DMD. Graphs The Graphs worksheet contains graphs of various stand attributes plotted over time. The attributes include DBH, density, basal area, height, yield, and increment. Graphs also contains a graph for the price trends modeled in the economic analysis. The stand yield, stand increment, and price appreciation graphs are interactive. They contain pull-down menus that allow you to select the nature of the item plotted. Figure 10 demonstrates this for the stand yield graph. Here you have the choice of plotting total cubic foot volume or one of the two user-defined products in terms of standing volume or cumulative yield. The increment graph allows you to plot total stand volume or one of the two user-defined products. The price appreciation graph contains two pull-down menus, allowing the comparison of any two price trends in either real or nominal dollars. All information used for the graphs on the Graphs worksheet is derived from the Model Details sheet. You can also create your own custom graphs using Excel s chart capabilities and the information from the Model Details sheet. 15

16 Figure 10. Using Resinosa s interactive graphs. Model Details The Model Details worksheet contains a detailed yearly summary of stand conditions for each year in the simulation. The sheet s print area is set to the boxed area on the sheet. By default, this is the printed portion of the sheet. Additional model information appears to the right of the boxed area, some of which is used elsewhere in Resinosa. This page contains the implementation of the growth model. Unlike traditional models, which rely solely on lines of computer code, much of Resinosa s growth model is implemented in spreadsheet form through the use of formulas. For this reason, users are advised not to modify or protect any formulas or cells in this worksheet. Doing so could easily result in Resinosa s failure to function properly. A sample Model Details report appears on the next page. 16

17 17

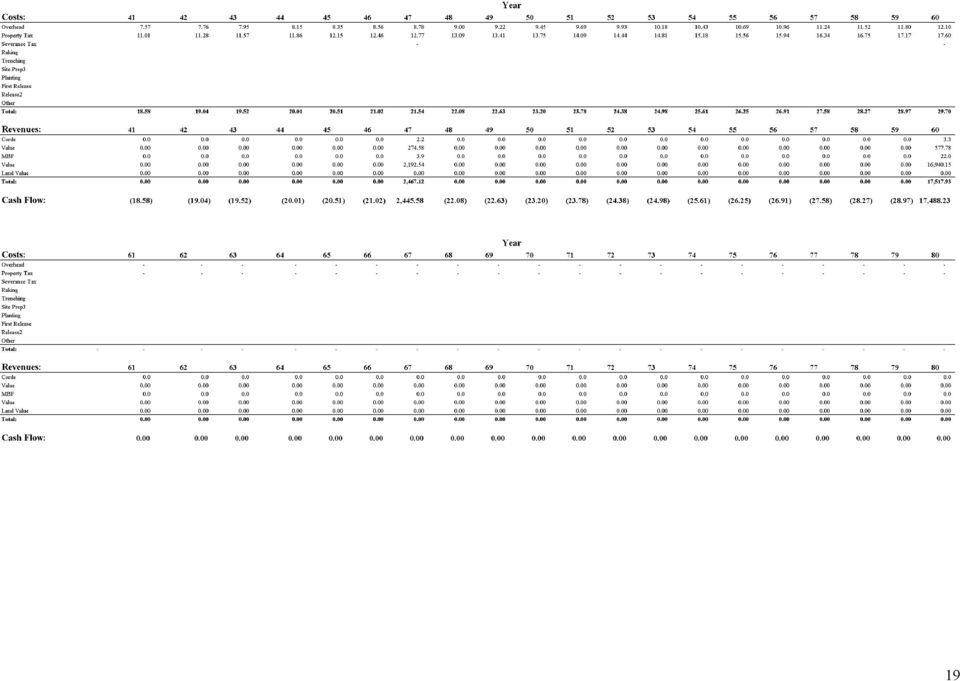
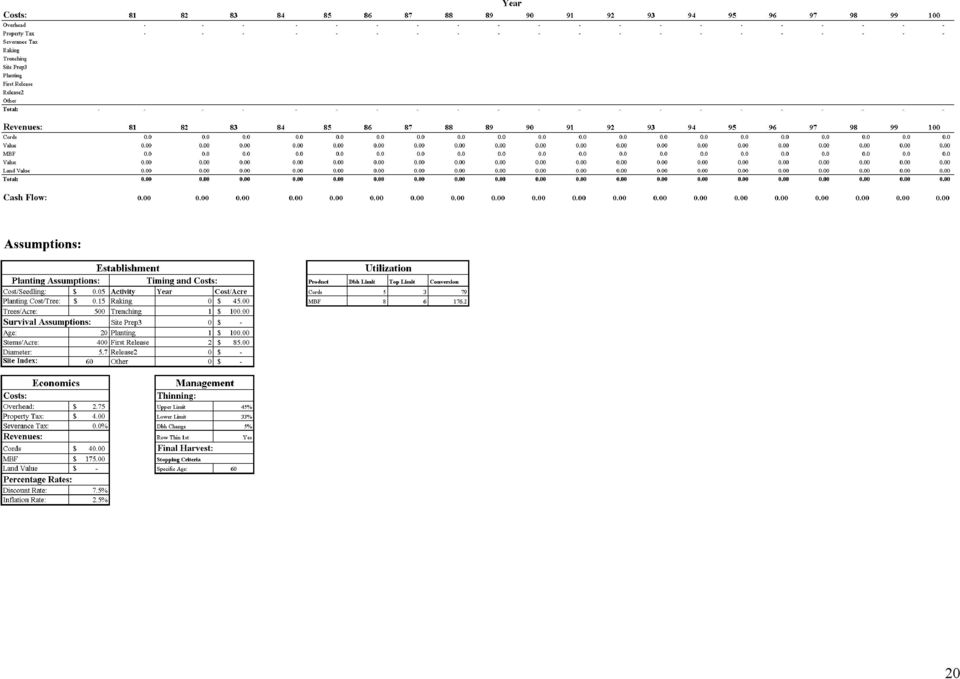
18 Economics The Economics sheet contains a detailed discounted cash flow analysis for the current stand trajectory. All of the modeled costs and revenues are itemized for the length of the economic planning horizon. Net present value (NPV) and internal rate of return (IRR) for the current rotation are reported at the top of the sheet. Neither NPV nor IRR contain the effects of selling the land at the end of the rotation. Two forms of SEV are also reported. The first adds the discounted value of selling the land at rotation age to the NPV, while the second ignores the sale of land, assuming a perpetual series of the returns resulting from the current management regime. Note that SEV is only applicable for stands grown from bare soil. A detailed summary of the assumptions used with the current stand trajectory also appears at the bottom of the sheet. The Economics sheet is formatted to fit three printed pages. A sample report follows. 18

19 19
20 20
21 References Avery, T.E., Burkhart, H.E Forest Measurements. Third Edition. McGraw-Hill Book Company. Benzie, J.W Manager s handbook for red pine in the North-Central States. General Technical Report NC-33. USDA North Central Forest Experiment Station. Holdaway, M.R, R.A. Leary, and J.L Thompson Estimating mean stand crown ratio from stand variables. In A generalized forest growth projection system applied to the Lake States region. pp General Technical Report NC-49. USDA North Central Forest Experiment Station. Long, J. N A practical approach to density management. Forestry Chronicle. 61: Lundgren, A. L The effect of initial number of trees per acre and thinning densities on timber yields from red pine plantations in the Lake States. North Central Forest Experiment Station. Research Paper NC-193. Reineke, R.L Perfecting a stand-density index for even-aged forests. Journal of Agricultural Research. 46: Smith, D. J., and M. E. Woods Red Pine and White Pine Density Management Diagrams for Ontario. Ontario Ministry of Natural Resources Southcentral Sciences Section. Technical Report No. 48. Smith, N.J., and D.G. Brand Compatible growth models and stand density diagrams. In: A.R. Ek, S.R Shifley and T.E. Burk (Editors). Forest Growth Modeling and Prediction. USDA Forest Service General Technical Report No. NC-120. pp
22 Appendix: Application of a density management diagram for Lake States red pine management. The Density Management Diagram Foresters manage stands to meet a variety of management objectives. Often times these objectives involve the production of one or more types of merchantable yield such as pulpwood, poles, or sawlogs. In cases where timber production is the objective, management often focuses on maximizing volume production for the product or products being considered. This usually involves encouraging growth on some collection of desirable trees, while capturing mortality from the less vigorous trees. Density control is the primary means by which this is accomplished. Density Management Diagrams (DMDs) are popular tools for developing management prescriptions for even-aged stands. Their popularity stems from their ability to easily incorporate the ecological principle of self-thinning, or competition induced mortality, which provides a stimulus for thinning. Reineke (1933) was one of the first to introduce the concept of selfthinning. He showed that stands of a given average diameter do not exceed a corresponding maximum density. When graphed in log/log scale (Figure 11), this relationship can be approximated by a straight line, which forms the upper boundary for maximum density. Stands within a region parallel to and just below the maximum density line are said be self-thinning. That is, they are experiencing competition induced mortality. The focus of management, or density control, is to Maximum Density Line Quadratic Mean DBH 10 Quadratic Mean DBH 10 Canopy Closure Management Region Stand Trajectory Stems/Acre Stems/Acre Figure 11. The diameter-density relation ship for red pine stand from across the Lake States. Figure 12. The development of a 60 year old managed red pine stand. 22
23 prevent stands from reaching the zone where self-thinning can occur. Typically, with a DMD the strategy is to maintain stands below the region of self-thinning, within a management region parallel to the maximum density line, but above the point of canopy closure (Figure 12). Management objectives dictate the placement of management regions, which in turn determine how stands grow and develop. When deriving management regions, foresters must consider the trade-off between overall stand growth and individual tree growth. Both types of growth are density dependent, but with opposite trends. Stands maintained at higher relative densities, closer to maximum density, exhibit higher overall stand growth (Figure 13), while stands maintained at low relative densities exhibit higher individual tree growth (Figure 14), at the expense of overall stand growth. With the DMD approach, stands managed for maximum fiber production, or pulpwood, are carried higher on the chart, whereas stands managed for sawlogs are carried lower on the chart in order to maximize individual tree growth. Stand Growth (% of potential) Tree Growth (% of potential) Relative Density (%) Relative Density (%) Figure 13. The relationship between overall stand growth and stand relative density. Adapted from Long (1985). Problems with Traditional DMDs Figure 14. The relationship between individual tree growth and stand relative density. Adapted from Long (1985). While DMDs are effective tools, the traditional approach to their application has several drawbacks. First, the traditional DMD approach fails to account for mortality, which occurs at all stages of stand development. Traditional applications assume no competition-based mortality. While this assumption is practical if stands are constantly managed at lower densities, it becomes unrealistic for stands carried at higher densities. Second, a traditional DMD directly tracks the relationship between average tree size and density, independent of age. This means that age must be indirectly derived from average size and density. This is typically done through a system of equations that predict age, given mean tree size, stand density, and site index. These, typically static system of equations, typically result in inconsistent age prediction. 23
24 Third, management decisions require predictions of merchantable product volume. Like age, volume must be predicted indirectly with the traditional DMD approach. Finally, most DMDs are designed to account for single product yields. Typically they will provide an estimate of pulpwood or sawlog yield, but not both. This is a drawback since many species, such as red pine in the Lake States, are merchandized for multiple products. Furthermore, product merchantability standards are usually fixed, preventing the user from defining merchantability standards of particular interest to them. An Alternative Approach to DMD Implementation While the DMD presented here is not the first attempt for red pine (cf. Smith and Brand, 1989; Smith and Woods, 1997), it is the first red pine DMD to circumvent the problems described above. Resinosa is a spreadsheet based DMD for Lake States red pine which allows the forester to interactively compare various management options. Resinosa s strength is that it is a modelbased approach. Mortality, age, product volumes, and merchantability standards are handled directly by a system of equation that make up the growth and yield model. Potential inconsistencies between management scenarios are avoided. Minimum required inputs for a simulation include trees per acre, average stand DBH, and site index. User defined merchantability specifications for up to two products are allowed. The user also specifies the upper and lower management lines for the management region, as well as the point at which final harvest occurs. Another option bypasses the use of management regions completely, allowing users to run fully customized management scenarios. Red Pine Management Examples Simulations were conducted examining various pulpwood and sawlog management regimes to demonstrate Resinosa s capabilities. Three alternatives were simulated for 60 year pulpwood rotations. The first involved a constant basal area approach, where the stand was maintained between set upper and lower basal areas of 160 and 120 square feet, respectively. The second followed a method described by Lundgren (1981) in which the stand is thinned back to 120 square feet every ten years until final harvest. The third utilized the traditional DMD approach in which the stand was maintained within a management region, bounded by relative densities of 47% and 60%. Overall pulpwood yield results were similar (Table 1), with the DMD approach producing slightly less cordwood volume but larger trees. A second comparison was made between two 60 year sawlog regimes. Here, both stands were managed using a DMD approach in which the management region was bounded by relative densities of 40% and 52%. The first stand assumed an establishment density of 800 trees per acre, while the second assumed 400 trees per acre. Both scenarios produce cordwood volumes similar to the pulpwood scenarios (Table 2), but with much larger diameters. The stand established with 400 trees per acre produced trees nearly one inch larger in size at 60 years. In 24
25 terms of sawlog production, it outperformed the higher density stand by 50 board feet per year, for a total difference of 3000 board feet over the rotation. Table 1. Results from the comparison of various thinning regimes for a 60 year pulpwood objective. Table 2. Results from the comparison of various thinning regimes for a 60 year sawlog objective. Stand Comparison BA Lundgren 120 BA DMD Approach Stand Comparison 800 Trees 400 Trees DBH (inches) DBH (inches) Trees/Acre Trees/Acre Stem Wood 60 Year MAI (cuft) Stem Wood Age 60 MAI (cuft) Pulpwood 60 Year MAI (Cords) Pulpwood Age 60 MAI (Cords) Sawtimber 60 Year MAI (BF) Sawtimber Age 60 MAI (BF)
Financial maturity is when the rate of value
 Cutting at Financial Maturity: Maximizing the economic return of your woodland Woodland owners harvest trees for financial and personal reasons. Deciding when is the optimal time to harvest is difficult
Lesson 9: Introduction to the Landscape Management System (LMS)
") Lesson 9: Introduction to the Landscape Management System (LMS) Review and Introduction In earlier lessons, you learned how to establish and take measurements in sample inventory plots. In Lesson 8, you
Lesson 9: Introduction to the Landscape Management System (LMS) Review and Introduction In earlier lessons, you learned how to establish and take measurements in sample inventory plots. In Lesson 8, you
An Appraisal Tool for Valuing Forest Lands
 An Appraisal Tool for Valuing Forest Lands By Thomas J. Straka and Steven H. Bullard Abstract Forest and natural resources valuation can present challenging analysis and appraisal problems. Calculations
Are My. Pine Trees. Ready To Thin?
 Are My Pine Trees Ready To Thin? ARE MY PINE TREES READY TO THIN? One question private forest landowners ask most frequently is, Are my pine trees ready to thin? There is no definite answer to this question,
Assume you have 40 acres of forestland that was
 A l a b a m a A & M a n d A u b u r n U n i v e r s i t i e s ANR-1371 Basal Area: A Measure Made for Management Assume you have 40 acres of forestland that was recently assessed by a natural resource
Lesson 10: Basic Inventory Calculations
 Lesson 10: Basic Inventory Calculations Review and Introduction In the preceding lessons, you learned how to establish and take measurements in sample plots. You can use a program like LMS to calculate
What Do You See? FOR 274: Forest Measurements and Inventory. Logs and Scaling: Definitions. Tree and Wood Volume Log Volumes Cords Weight Scaling
 What Do You See? FOR 274: Forest Measurements and Inventory Tree and Wood Volume Log Volumes Cords Weight Scaling Logs and Scaling: Definitions Logs: cut trees lengths of 8ft or more The process of measuring
LAB #12 Introduction to Forest Inventory Software
 SUBJECT: LAB #12 Introduction to Forest Inventory Software Forest Inventory software programs simplify field data entry and data management, as well as allow users to efficiently derive summary volume
Land Expectation Value Calculation in Timberland Valuation
 Thomas J. Straka, PhD, ondsteven H. Bullard, PhD Land Expectation Value Calculation in Timberland Valuation Appraisers often use discounted cash flow (DCF) techniques to value timber and timberland. Land
Abstract. Introduction
 Forest Management Options Evaluation for Oldfield Afforestation with Loblolly Pine Stands in the U.S. South Using WINYIELD v. 1.11 and GaPPS v. 4.20 Software Systems 1 The Entomology and Forest Resources
Assignment objectives:
 Assignment objectives: Regression Pivot table Exercise #1- Simple Linear Regression Often the relationship between two variables, Y and X, can be adequately represented by a simple linear equation of the
Scientific Graphing in Excel 2010
 Scientific Graphing in Excel 2010 When you start Excel, you will see the screen below. Various parts of the display are labelled in red, with arrows, to define the terms used in the remainder of this overview.
Stand Density Management Diagram
 H O W T O U S E A Stand Density Management Diagram Yield predictions for a spacing prescription Ministry of Forests Forest Practices Branch Canadian Cataloguing in Publication Data Main entry under title:
FEDERAL INCOME TAXES FOR TIMBER GROWERS
 NC STATE UNIVERSITY COLLEGE OF AGRICULTURE & LIFE SCIENCES FEDERAL INCOME TAXES FOR TIMBER GROWERS Contents 2 Introduction Definition of timber Gain or loss from sale of timber Gross sales receipts Minus:
This publication provides information for tree growers,
 Cooperative Extension Service Resource Management Dec. 2000 RM-9 Financial Analysis for Tree Farming in Hawaii J. B. Friday, Carol Cabal, and John Yanagida Department of Natural Resources and Environmental
An Economic Analysis of Investing in Planted Pine Timberland By: Rick Cooper GA Registered Forester # 1964
 Title: Timber Marketing and Management Southern Heritage Land Co Description: Our registered foresters can provide timber marketing and management services to help you make the most of your investment.
SAS Analyst for Windows Tutorial
 Updated: August 2012 Table of Contents Section 1: Introduction... 3 1.1 About this Document... 3 1.2 Introduction to Version 8 of SAS... 3 Section 2: An Overview of SAS V.8 for Windows... 3 2.1 Navigating
ECDL. European Computer Driving Licence. Spreadsheet Software BCS ITQ Level 2. Syllabus Version 5.0
 European Computer Driving Licence Spreadsheet Software BCS ITQ Level 2 Using Microsoft Excel 2010 Syllabus Version 5.0 This training, which has been approved by BCS, The Chartered Institute for IT, includes
GROWTH POTENTIAL OF LOBLOLLY PINE PLANTATIONS IN THE GEORGIA PIEDMONT: A SPACING STUDY EXAMPLE
 GROWTH POTENTIAL OF LOBLOLLY PINE PLANTATIONS IN THE GEORGIA PIEDMONT: A SPACING STUDY EXAMPLE Plantation Management Research Cooperative Daniel B. Warnell School of Forest Resources University of Georgia
Valuation of Bare Forestland and Premerchantable Timber Stands in Forestry Appraisal
 Valuation of Bare Forestland and Premerchantable Timber Stands in Forestry Appraisal By Thomas J. Straka Abstract Rural appraisers often use Discounted Cash Flow (DCF) analysis to value timber and timberland.
Totara Stands Respond to Thinning
 1 Tree Grower article, June 2013 Totara Stands Respond to Thinning Paul Quinlan, Northland Totara Working Group David Bergin, Scion Latest results from a Northland Totara Working Group project show that
Create a Poster Using Publisher
 Contents 1. Introduction 1. Starting Publisher 2. Create a Poster Template 5. Aligning your images and text 7. Apply a background 12. Add text to your poster 14. Add pictures to your poster 17. Add graphs
How to Use the Cash Flow Template
 How to Use the Cash Flow Template When you fill in your cash flow you are trying to predict the timing of cash in and out of your bank account to show the affect and timing for each transaction when it
EXCEL FINANCIAL USES
 EXCEL FINANCIAL USES Table of Contents Page LESSON 1: FINANCIAL DOCUMENTS...1 Worksheet Design...1 Selecting a Template...2 Adding Data to a Template...3 Modifying Templates...3 Saving a New Workbook as
How To Analyze A Power Plant
 17.8 PROFITABILITY ANALYSIS SPREADSHEET This section shows how to use purchase and installation cost estimates from Aspen IPE, and other sources, together with an economics spreadsheet by Holger Nickisch
Pivot Tables & Pivot Charts
 Pivot Tables & Pivot Charts Pivot tables... 2 Creating pivot table using the wizard...2 The pivot table toolbar...5 Analysing data in a pivot table...5 Pivot Charts... 6 Creating a pivot chart using the
Units of Measure and Conversion Factors for Forest Products
 Units of Measure and Conversion Factors for Forest Products Bulletin #7103 Knowledge of the common units of wood measurement is important to people who are involved in marketing forest products. These
Breakeven Analysis. Takes the user to the data input worksheet of the tool.
 Breakeven Analysis This program allows the user to calculate breakeven price and yield levels and prepare projected net farm income and cash flow statements. The Breakeven Analysis program assists farm
Adobe Acrobat 6.0 Professional
 Adobe Acrobat 6.0 Professional Manual Adobe Acrobat 6.0 Professional Manual Purpose The will teach you to create, edit, save, and print PDF files. You will also learn some of Adobe s collaborative functions,
Figure 1: Security Warning Enable Macros Excel 2003
 Cisco Wireless Solution ROI Calculator This guide offers an overview on the ROI calculator created to measure the business value of implementing Cisco Wireless solutions. Overview Cisco commissioned Forrester
, ~ The ResourcesAgency. Dave McNamara
 ,a! California State of California Department of Forestry, ~ The ResourcesAgency - ~A' ~;::~Af;// ~/ ~~/1Y~~,\~'(.~~~~~ ~,~ F1rl WES7:RY ~~~~_.~~- note 1416 Ninth Street Sacramento, CA 95814 Phone 916-445-5571
LOAD CHASER (1_0) Production Analysis for Logging Businesses
 Production Analysis for Logging Businesses") LOAD CHASER (1_0) Production Analysis for Logging Businesses Wood Supply Systems Group Dr. Laurie Grace Dr. Bill Stuart Overview The Load Chaser program was developed as a research tool by the Wood Supply
LOAD CHASER (1_0) Production Analysis for Logging Businesses Wood Supply Systems Group Dr. Laurie Grace Dr. Bill Stuart Overview The Load Chaser program was developed as a research tool by the Wood Supply
1.1 Introduction. Chapter 1: Feasibility Studies: An Overview
 Chapter 1: Introduction 1.1 Introduction Every long term decision the firm makes is a capital budgeting decision whenever it changes the company s cash flows. Consider launching a new product. This involves
Net Present Value and Capital Budgeting. What to Discount
 Net Present Value and Capital Budgeting (Text reference: Chapter 7) Topics what to discount the CCA system total project cash flow vs. tax shield approach detailed CCA calculations and examples project
Comparison of Logging Residue from Lump Sum and Log Scale Timber Sales James O. Howard and Donald J. DeMars
 United States Department of Agriculture Forest Service Pacific Northwest Forest and Range Experiment Station Research Paper PNW-337 May 1985 Comparison of Logging Residue from Lump Sum and Log Scale Timber
Excel 2007 Basic knowledge
 Ribbon menu The Ribbon menu system with tabs for various Excel commands. This Ribbon system replaces the traditional menus used with Excel 2003. Above the Ribbon in the upper-left corner is the Microsoft
 Guide to Selling Your Timber ONCE YOU READ THIS GUIDE, YOU WILL KNOW: What to do if someone offers to buy your timber. How to get help in selling your timber. When trees are ready to sell. Why a contract
WHAT S NEW IN OBIEE 11.1.1.7
 Enterprise Data Management OBI Author Training, March 2015 WHAT S NEW IN OBIEE 11.1.1.7 NEW PRESENTATION FEATURES VIEWS 1) Recommended Visualizations Feature When you create a new view, OBIEE looks at
Setting your session preferences
 What is Aspen? 7 Basic Steps 1 Setting your session preferences 2 Building the simulation 3 Entering the simulation environment 4 Using the workbook 5 Installing Unit Operations 6 Run Your Simulation 7
Tutorial Customer Lifetime Value
 MARKETING ENGINEERING FOR EXCEL TUTORIAL VERSION 150211 Tutorial Customer Lifetime Value Marketing Engineering for Excel is a Microsoft Excel add-in. The software runs from within Microsoft Excel and only
Working with Excel in Origin
 Working with Excel in Origin Limitations When Working with Excel in Origin To plot your workbook data in Origin, you must have Excel version 7 (Microsoft Office 95) or later installed on your computer
Australian Pine Log Price Index
 Australian Pine Log Price Index Updated to June 28 : ADVISORY This page has been intentionally left blank. Advisory This report contains 39 pages HVP8 Jan - Jun (Public Version) 26 KPMG, an Australian
Fixed Assets setup Fixed Assets posting group Depreciation books Depreciation tables Fixed Assets journals
 MODULE 1: FIXED ASSETS SETUP Module Overview Microsoft Dynamics NAV 2013 provides a fully integrated fixed asset management functionality which helps a company manage its assets effectively and efficiently.
Crop-Share and Cash Rent Lease Comparisons Version 1.6. Introduction
 Crop-Share and Cash Rent Lease Comparisons Version 1.6 Alan Miller and Craig L. Dobbins Spreadsheet can be found at http://www.agecon.purdue.edu/extension/pubs/farmland_values.asp Introduction This spreadsheet
Designing a Graphical User Interface
 Designing a Graphical User Interface 1 Designing a Graphical User Interface James Hunter Michigan State University ECE 480 Design Team 6 5 April 2013 Summary The purpose of this application note is to
IAS FAIR VALUE AND FOREST EVALUATION ON FARM FORESTRY
 IAS FAIR VALUE AND FOREST EVALUATION ON FARM FORESTRY Markku Penttinen, Arto Latukka, Harri Meriläinen, Olli Salminen, and Esa Uotila ABSTRACT Forest evaluation causes the greatest problems in farm accounting
Lab 11: Budgeting with Excel
 Lab 11: Budgeting with Excel This lab exercise will have you track credit card bills over a period of three months. You will determine those months in which a budget was met for various categories. You
The Center for Teaching, Learning, & Technology
 The Center for Teaching, Learning, & Technology Instructional Technology Workshops Microsoft Excel 2010 Formulas and Charts Albert Robinson / Delwar Sayeed Faculty and Staff Development Programs Colston
Gantt Chart/Diagram Excel Template User Guide
 Gantt Chart/Diagram Excel Template User Guide Excel-based simple Gantt Chart Template This Excel-based template allows a Gantt chart to be easily and quickly developed. As the project progresses, the chart
Selling Timber Methods www.arkansastimber.info Teddy Reynolds, BSF, RF, SR
 Selling Timber Methods www.arkansastimber.info Teddy Reynolds, BSF, RF, SR Timber sales are traditionally performed in the following two manners: 1) Lump Sum. 2) Pay-As-Cut. A comparison summary of the
Farmland Lease Analysis: Program Overview. Navigating the Farmland Lease Analysis program
 Farmland Lease Analysis: Program Overview The farmland lease analysis program is used to aid tenants and landlords in determining the returns and risks from different farmland leases. The program offers
Excel 2007: Basics Learning Guide
 Excel 2007: Basics Learning Guide Exploring Excel At first glance, the new Excel 2007 interface may seem a bit unsettling, with fat bands called Ribbons replacing cascading text menus and task bars. This
Analyzing Excel Data Using Pivot Tables
 NDUS Training and Documentation Analyzing Excel Data Using Pivot Tables Pivot Tables are interactive worksheet tables you can use to quickly and easily summarize, organize, analyze, and compare large amounts
Reflection and Refraction
 Equipment Reflection and Refraction Acrylic block set, plane-concave-convex universal mirror, cork board, cork board stand, pins, flashlight, protractor, ruler, mirror worksheet, rectangular block worksheet,
Instructions and Guide for Bond Yield and Total Return
 Instructions and Guide for Bond Yield and Total Return FINC413 Lab c 2014 Paul Laux and Huiming Zhang 1 Introduction 1.1 Overview In lab, you will use Bloomberg to explore topics of bond total return,
Welcome to the topic on creating key performance indicators in SAP Business One, release 9.1 version for SAP HANA.
 Welcome to the topic on creating key performance indicators in SAP Business One, release 9.1 version for SAP HANA. 1 In this topic, you will learn how to: Use Key Performance Indicators (also known as
Tutorial: Using Excel for Linear Optimization Problems
 Tutorial: Using Excel for Linear Optimization Problems Part 1: Organize Your Information There are three categories of information needed for solving an optimization problem in Excel: an Objective Function,
Microsoft Excel 2010 Tutorial
 1 Microsoft Excel 2010 Tutorial Excel is a spreadsheet program in the Microsoft Office system. You can use Excel to create and format workbooks (a collection of spreadsheets) in order to analyze data and
Land Purchase Analysis
 Land Purchase Analysis With this program, the user can evaluate the economic return on a farmland purchase and calculate a maximum bid price The maximum bid price is the purchase price that allows the
warpct.com Working with MS Excel 2003 Workbook courseware by WARP! Computer Training
 warpct.com courseware by WARP! Computer Training Working with MS Excel 2003 Workbook Welcome! Thank you for evaluating a portion of this workbook. If you have any questions or comments regarding our training
Specialized Discounted Cash Flow Analysis Formulas for Valuation of Benefits and Costs of Urban Trees and Forests
 Specialized Discounted Cash Flow Analysis Formulas for Valuation of Benefits and Costs of Urban Trees and Forests John E. Hatcher Jr.*, Kristin S. Peterson*, John L. Greene**, Thomas J. Straka* *Department
Tax Savings on Timber Sales
 Tax Savings on Timber Sales Understanding tax laws and tax incentives designed to encourage improvement and expansion of woodlands will benefit both you and the general public. Growing trees as a crop
Introduction to Microsoft Excel 2007/2010
 to Microsoft Excel 2007/2010 Abstract: Microsoft Excel is one of the most powerful and widely used spreadsheet applications available today. Excel's functionality and popularity have made it an essential
Using Excel for Business Analysis: A Guide to Financial Modelling Fundamentals
 Excel 2003 Instructions Using Excel for Business Analysis: A Guide to Financial Modelling Fundamentals contains extensive instructions for using Excel 2010 and Excel for Mac 2011. There are a few instances
Valuing Timber Resource Stocks in the Canadian Natural Resource Stock Accounts
 Valuing Timber Resource Stocks in the Canadian Natural Resource Stock Accounts London Group, November 2013 Environment Accounts and Statistics Division Statistics Canada October 18 th, 2013 Quick facts
Easy Calculations in Excel
 Easy Calculations in Excel (2007 and newer) Any time you have a list of numbers that require some sort of calculation like percent change from one year to the next, percent of total, average or just a
In this example, Mrs. Smith is looking to create graphs that represent the ethnic diversity of the 24 students in her 4 th grade class.
 Creating a Pie Graph Step-by-step directions In this example, Mrs. Smith is looking to create graphs that represent the ethnic diversity of the 24 students in her 4 th grade class. 1. Enter Data A. Open
Microsoft Excel 2013 Tutorial
 Microsoft Excel 2013 Tutorial TABLE OF CONTENTS 1. Getting Started Pg. 3 2. Creating A New Document Pg. 3 3. Saving Your Document Pg. 4 4. Toolbars Pg. 4 5. Formatting Pg. 6 Working With Cells Pg. 6 Changing
Using simulation to calculate the NPV of a project
 Using simulation to calculate the NPV of a project Marius Holtan Onward Inc. 5/31/2002 Monte Carlo simulation is fast becoming the technology of choice for evaluating and analyzing assets, be it pure financial
Excel -- Creating Charts
 Excel -- Creating Charts The saying goes, A picture is worth a thousand words, and so true. Professional looking charts give visual enhancement to your statistics, fiscal reports or presentation. Excel
Microsoft Excel 2013 Step-by-Step Exercises: PivotTables and PivotCharts: Exercise 1
 Microsoft Excel 2013 Step-by-Step Exercises: PivotTables and PivotCharts: Exercise 1 In this exercise you will learn how to: Create a new PivotTable Add fields to a PivotTable Format and rename PivotTable
EV CHARGING FINANCIAL ANALYSIS TOOL USER GUIDE
 EV CHARGING FINANCIAL ANALYSIS TOOL USER GUIDE A free tool designed to evaluate the financial viability of EV charging infrastructure investments involving multiple private and public sector partners Published
Window Glass Design 5 According to ASTM E 1300
 A User s Guide to: Window Glass Design 5 According to ASTM E 1300 A product of: 1 Table of Contents Table of Contents List of Figures Chapter 1: Window Glass Design 5 1.1 Introduction 1.2 Features ii iv
INTRODUCTION TO EXCEL
 INTRODUCTION TO EXCEL 1 INTRODUCTION Anyone who has used a computer for more than just playing games will be aware of spreadsheets A spreadsheet is a versatile computer program (package) that enables you
Using the Advanced Tier Data Collection Tool. A Troubleshooting Guide
 Using the Advanced Tier Data Collection Tool A Troubleshooting Guide Table of Contents Mouse Click the heading to jump to the page Enable Content/ Macros... 4 Add a new student... 6 Data Entry Screen...
II. TOMATO CANNING A. START COMFAR
 II. TOMATO CANNING This exercise is intended to introduce a new user to the basic concepts and procedures of COMFAR III Expert. Only financial analysis is performed. Data are kept to a minimum to concentrate
Kiln Drying Planning Tool. User Guide
 Kiln Drying Planning Tool User Guide Prepared by FORAC Research Consortium Université Laval Québec (QC), Canada www.forac.ulaval.ca August 2008 Copyright FORAC, 2008 Table of content TABLE OF CONTENT...
THE CASE FOR CUBIC LOG SCALE
 Page 1 1. INTRODUCTION THE CASE FOR CUBIC LOG SCALE The history of scaling rules or log scales in the US goes back to the earliest lumbermen of North America. Many proprietary systems were used in the
AVERT Main Module Quick Start Guide
 AVERT Main Module Quick Start Guide AVoided Emissions and generation Tool (AVERT) is a free tool with a simple user interface designed to meet the needs of state air quality planners and other interested
How To Analyze Data In Excel 2003 With A Powerpoint 3.5
 Microsoft Excel 2003 Data Analysis Larry F. Vint, Ph.D lvint@niu.edu 815-753-8053 Technical Advisory Group Customer Support Services Northern Illinois University 120 Swen Parson Hall DeKalb, IL 60115 Copyright
Microsoft Excel 2007. Introduction to Microsoft Excel 2007
 Microsoft Excel 2007 Introduction to Microsoft Excel 2007 Excel is an electronic spreadsheet to organize your data into rows and columns. One can use it to perform basic to advanced level mathematical
Linear Programming. Solving LP Models Using MS Excel, 18
 SUPPLEMENT TO CHAPTER SIX Linear Programming SUPPLEMENT OUTLINE Introduction, 2 Linear Programming Models, 2 Model Formulation, 4 Graphical Linear Programming, 5 Outline of Graphical Procedure, 5 Plotting
Figure 1. An embedded chart on a worksheet.
 8. Excel Charts and Analysis ToolPak Charts, also known as graphs, have been an integral part of spreadsheets since the early days of Lotus 1-2-3. Charting features have improved significantly over the
Optimization: Optimal Pricing with Elasticity
 Optimization: Optimal Pricing with Elasticity Short Examples Series using Risk Simulator For more information please visit: www.realoptionsvaluation.com or contact us at: admin@realoptionsvaluation.com
Microsoft Office Project Standard 2007 Project Professional 2007. April 2006. February 2006
 Microsoft Office Project Standard 2007 Project Professional 2007 April 2006 February 2006 February 2006 Table of Contents Overview of Microsoft Office Project Standard 2007 and Office Project Professional
5. Tutorial. Starting FlashCut CNC
 FlashCut CNC Section 5 Tutorial 259 5. Tutorial Starting FlashCut CNC To start FlashCut CNC, click on the Start button, select Programs, select FlashCut CNC 4, then select the FlashCut CNC 4 icon. A dialog
USER S MANUAL. ArboWebForest
 USER S MANUAL ArboWebForest i USER'S MANUAL TABLE OF CONTENTS Page # 1.0 GENERAL INFORMATION... 1-1 1.1 System Overview... 1-1 1.2 Organization of the Manual... 1-1 2.0 SYSTEM SUMMARY... 2-1 2.1 System
tutor2u tutor2u Interactive Business Simulations Finance: Cash Flow Management
 Interactive Business Simulations Finance: Cash Flow Management Note: this interactive simulator is designed to be viewed using an up-to-date internet browser. Users must also have Macromedia Flash Player
Application Note - How to Design a SolarEdge System Using PVsyst
 March 2015 Application Note - How to Design a SolarEdge System Using PVsyst As of version 5.20, PVsyst - the PV system design software - supports the design of SolarEdge systems. This application note
There are two sheets, Diesel and Electric, identified by tabs at the bottom of the sheet.
 Willard Says Absolutely fascinating information about practical hydraulic dredging. How To Use the Dredge Production Cost Spreadsheet This program guide describes the various dredge operating cost parameters
How to Configure and Use MRP
 SAP Business One How-To Guide PUBLIC How to Configure and Use MRP Applicable Release: SAP Business One 8.8 All Countries English October 2009 Table of Contents Purpose... 3 The MRP Process in SAP Business
MS Excel. Handout: Level 2. elearning Department. Copyright 2016 CMS e-learning Department. All Rights Reserved. Page 1 of 11
 MS Excel Handout: Level 2 elearning Department 2016 Page 1 of 11 Contents Excel Environment:... 3 To create a new blank workbook:...3 To insert text:...4 Cell addresses:...4 To save the workbook:... 5
Rochester Institute of Technology. Oracle Training: Performing Inquiries and Requesting Reports in the Oracle Applications
 Rochester Institute of Technology Oracle Training: Performing Inquiries and Requesting Reports in the Oracle Applications Table of Contents Introduction Lesson 1: Lesson 2: Lesson 3: Lesson 4: Lesson 5:
Lesson 8: LMS Inventory Wizard
 Review and Introduction Lesson 8: LMS Inventory Wizard In earlier lessons, you learned how to establish and take measurements in sample plots. You also downloaded and installed a computer program called
Integrated Accounting System for Mac OS X
 Integrated Accounting System for Mac OS X Program version: 6.3 110401 2011 HansaWorld Ireland Limited, Dublin, Ireland Preface Standard Accounts is a powerful accounting system for Mac OS X. Text in square
Data Analysis. Using Excel. Jeffrey L. Rummel. BBA Seminar. Data in Excel. Excel Calculations of Descriptive Statistics. Single Variable Graphs
 Using Excel Jeffrey L. Rummel Emory University Goizueta Business School BBA Seminar Jeffrey L. Rummel BBA Seminar 1 / 54 Excel Calculations of Descriptive Statistics Single Variable Graphs Relationships
Creating Charts in Microsoft Excel A supplement to Chapter 5 of Quantitative Approaches in Business Studies
 Creating Charts in Microsoft Excel A supplement to Chapter 5 of Quantitative Approaches in Business Studies Components of a Chart 1 Chart types 2 Data tables 4 The Chart Wizard 5 Column Charts 7 Line charts
University of Southern California Marshall Information Services
 University of Southern California Marshall Information Services Determine Breakeven Price Using Excel - Using Goal Seek, Data Tables, Vlookup & Charts This guide covers how to determine breakeven price
WEBFOCUS QUICK DATA FOR EXCEL
 WEBFOCUS QUICK DATA FOR EXCEL BRIAN CARTER INFORMATION BUILDERS SUMMIT 2008 USERS CONFERENCE JUNE 2008 Presentation Abstract: Even with the growing popularity and evolvement of Business Intelligence products
Form 155. Form 162. Form 194. Form 239
 Below is a list of topics that we receive calls about each year with the solutions to them detailed. New features and funds have also been added. Note: Some of the topics have more than one question so