Attracting Residents to Transit-Oriented Neighborhoods in the San Francisco Bay Area
|
|
|
- Cuthbert Hall
- 8 years ago
- Views:
Transcription
1 Choosing Where We Live: Attracting Residents to Transit-Oriented Neighborhoods in the San Francisco Bay Area A Briefing Book for City Planners and Managers METROPOLITAN TRANSPORTATION COMMISSION

2 Additional technical and policy information is available on the accompanying compact disc and on MTC s website.

3 Choosing Where We Live: Attracting Residents to Transit-Oriented Neighborhoods in the San Francisco Bay Area A Briefing Book for City Planners and Managers May 2010 Metropolitan Transportation Commission Joseph P. Bort MetroCenter 101 Eighth Street Oakland, CA PHONE TDD/TTY info@mtc.ca.gov

4
5 1 Table of Contents Introduction: Sustainable Communities and Transit-Oriented Development 2 The People: Attributes and Market Segments 5 The Strategies: Attracting Residents to TOD Neighborhoods 17 Conclusion 43

6 2 2 2 Introduction: Sustainable Communities and Transit-Oriented Development Regional Support for Transit-Oriented Development (TOD) Four Bay Area regional agencies the Association of Bay Area Governments (ABAG), Bay Area Air Quality Management District (BAAQMD), San Francisco Bay Conservation and Development Commission (BCDC) and the Metropolitan Transportation Commission (MTC) are pursuing coordinated development of land and transportation to create com - plete neighborhoods that offer a range of housing choices and allow residents increased opportunities for walking, bicycling and transit use. Incentives and technical support for development within priority development areas (PDAs) are provided through the FOCUS program. This briefing book summarizes the results of a year-long study that examined what attracts home-seekers to transit-oriented development (TOD) in the San Francisco Bay Area, and how to improve TODs to better attract these groups. The Bay Area has the opportunity in our town centers, downtowns, transit villages and urban neighborhoods to provide a compact, connected and walkable mix of land uses: housing, work, civic, retail and services coupled with rich transportation options. Our goal is to help elected officials, public agency professionals, community stakeholders and developers understand how to develop high-quality TODs so that they successfully attract new residents. Additional technical and policy information from this effort is available in the referenced reports on the MTC website and on the accompanying compact disc located at the inside cover. For more information, visit initiatives/ prioritydevelopment areas. html
 are provided through the FOCUS program.")
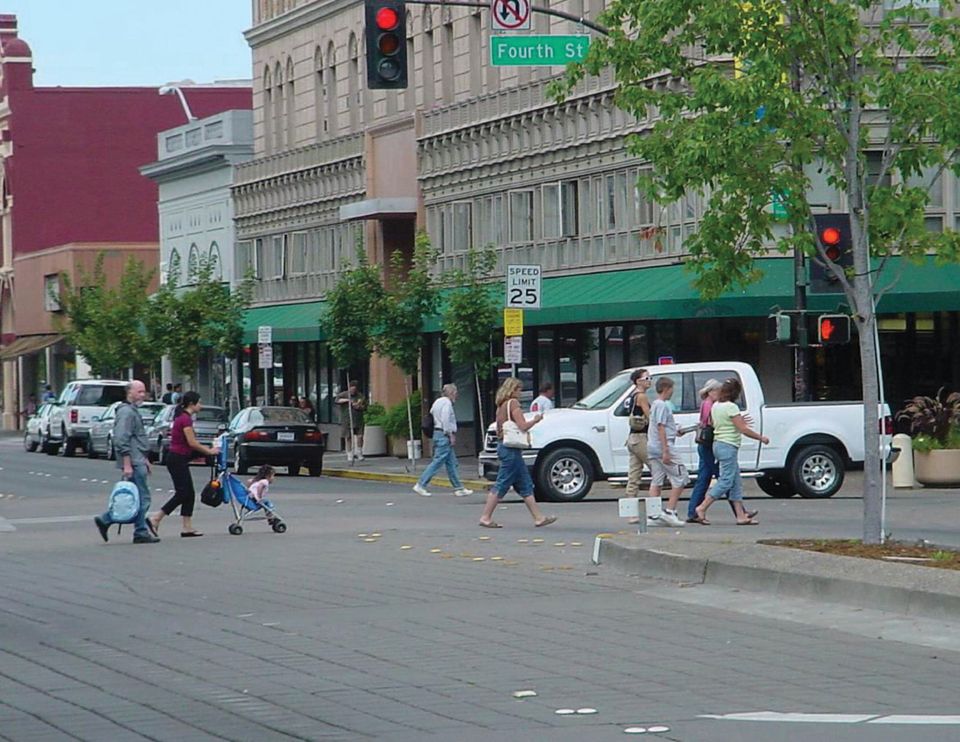
7 3 3 Transit-oriented development combining compact development of different land uses with non-auto transportation options can play a vital role in addressing the future growth of our region. Residents of such areas drive fewer miles and make more trips by transit, walking and bicycling. Reduced automobile ownership and usage brings a variety of benefits, including improved air quality, lower greenhouse gas emissions, greater levels of physical activity, reduced personal transportation costs and increased social interaction among community members. Local Bay Area jurisdictions are increasingly looking to support higher density mixed-use development to address community visions for vibrant town centers, regional and state housing targets and greenhouse gas thresholds consistent with California Senate Bill 375 (Steinberg). Signed into law in 2008, SB 375 aims to reduce greenhouse gas emissions through changes in land-use and transportation planning. It establishes a process to implement the state s global warming legislation (AB 32) for the transportation sector, and requires the development of a sustainable community strategy. TODs can help reduce suburban and exurban sprawl and traffic, preserve natural resources, lead to reinvestment in existing infrastructure, and reduce the amount of land dedicated to parking. Travel Patterns of TOD Residents Fewer miles driven The average daily mileage driven by Bay Area residents living within a half-mile of a transit station is about half that of those living farther from transit. More walking and bicycling Bay Area residents living within a half-mile of rail stations or ferry terminals walk or bike for 16 percent of their work trips and 25 percent of their non-work trips, compared to 4 and 12 percent walk/bike rates for people living farther from transit. Source: Analysis of Bay Area Travel Survey, smart_growth/stars/index.htm

8

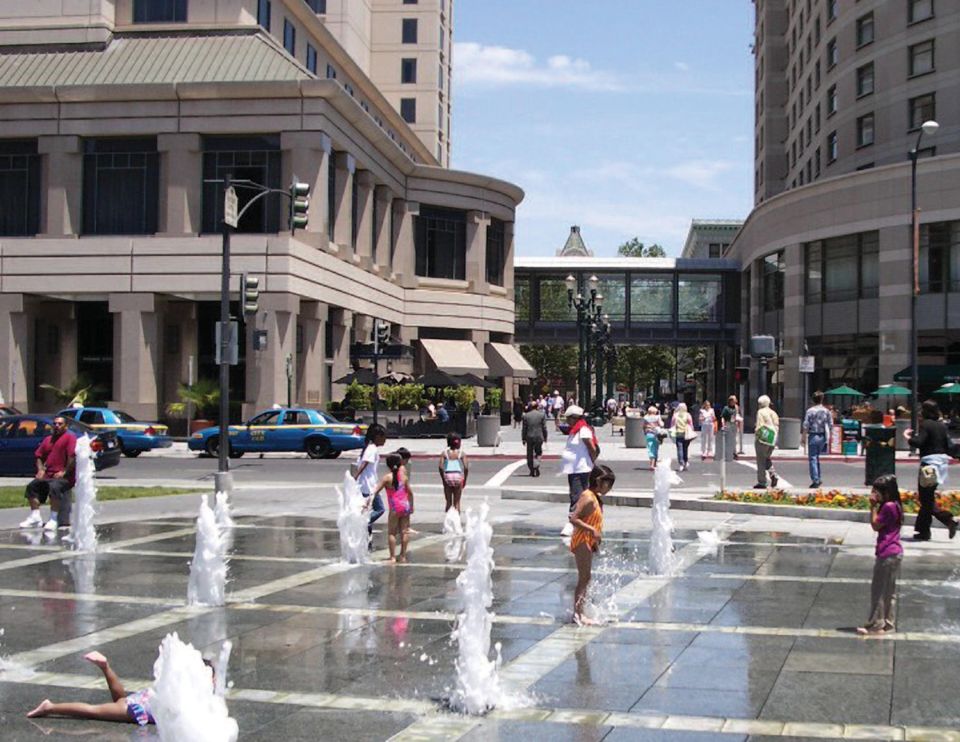
9 The People: Attributes and Market Segments 5 5 This study offers tools for making TODs places where more people want to live. It supports the development of successful TODs by providing a market analysis of what different groups of Bay Area residents want from their home and neighborhood. This analysis is based on a survey of over 900 new and recent movers in the Bay Area, and focuses primarily on attributes that can be influenced by the public sector (such as zoning for mixed use, the presence of parks, transit quality and school quality) and not on attributes controlled by developers, such as the layout and design of interior space. The study results can help increase the success of transitoriented developments. Creating vibrant TODs that are attractive to many people produces multiple benefits that support strong communities: Attracting enough residents avoids excessive vacancy rates. Attracting residents with a high interest in transit strengthens the transit system. Attracting sufficient numbers of market-rate renters/purchasers improves the financial viability of developments. Attracting residents who shop locally benefits local businesses. Self-Selection and the Influence of Place Do people choose to walk, bike or take transit because they prefer those modes, or do people choose those modes because they are more available in certain locations? The answer is both. Some people choose to live where it s easier to travel by walking, biking and transit termed self-selection. But on average, everyone travels more by these modes in locations that provide these options, regardless of their attitudes. People who self-select areas with good walking, biking and transit modes use these modes the most. Source: Transit Cooperative Research Program (TCRP) Report 123
 and not on attributes controlled by developers, such as the layout and design of interior space.")
10 6 6 What Do Bay Area Home-Seekers Want? Survey respondents scored 35 attitudinal statements from 0 to 10 in terms of importance in influencing their choice of housing. The highest-rated issues are listed in the table at right. Some attributes, such as having access to commuter rail, living in a neighborhood with a mix of housing types, and being able to easily travel to regional centers/ San Francisco, were not very important on average to all movers but were important to certain market segments. We also asked the respondents to name the one consideration that most influenced their choice of home. The top consideration is proximity to key activities work, family, friends and school followed by price. Most Bay Area movers appear to trade off the other desired attributes of their neighborhood after constraining their search by the overriding considerations of price and proximity. Top 10 Attributes of Desirable Neighborhoods 1. Safe to walk around at night 2. Safe and convenient to walk and bike for errands 3. Clean neighborhood 4. Short commute to work 5. Neighborhood where there are places to spend time 6. Need only one or fewer parking spots 7. Plenty of indoor space 8. Parks nearby 9. Outdoor recreation opportunities nearby 10. Quiet street

11 7 7 Market Segments Looking for Housing in the Bay Area Using structural equations modeling to link the attitudes with demographics, the study defines eight market segments of movers.* Transit-Preferring includes both families with children and student households who rate minimizing travel and access to high-quality transit as most important. They are renters with very low auto ownership rates and relatively low incomes. Urban DINKs (Double Income No Kids) value minimizing travel and access to high-quality transit and regional centers. They are child-free, have average income, and most have only one car in the household. Young Brainiacs are very well educated and younger on average. About a quarter have children, and most have only one car in the household. They place a high value on minimizing travel, and on access to high-quality transit and regional centers. Ambitious Urbanites value all the attributes. They place the highest value on school quality, followed closely by travel minimization, transit accessibility and driving orientation. Most have children and two cars. Mellow Couples value driving, a quiet and clean neighborhood and being able to walk to do errands. They do not value travel minimization, transit accessibility or access to regional centers. They have higher incomes and are older on average, with few resident children. Kids, Cars and Schools most value good-quality schools, a quiet and clean neighborhood, and convenient driving. Most are comprised of two working adults, two children and two vehicles. Auto-Oriented, Price-Conscious place low values on all the surveyed attributes. Some noted that price was a dominant factor in choosing their home. They are predominantly renters, earn a lower income and have a low auto ownership rate. High-Income Suburbanites are predominantly married couples with high incomes, high auto ownership rates and children. They value convenient driving, and place very little value on transit accessibility, travel minimization or access to regional centers. * Each of the market segments was given a name although the names do not always precisely reflect the characteristics of all members of the segment.

12 8 8 Grouping the Market Segments We then grouped the market segments into three categories based on how easily they could be attracted to living in a TOD. Each market segment is described on the following pages, with key attitudes and distinguishing characteristics. Easiest to Attract. Three segments Transit- Preferring, Urban DINKs and Young Brainiacs totaling 38 percent of respondents, were judged to be the most easily attracted to TODs based on their strong interest in transit and their low interest in driving relative to the rest of the groups. (33% of respondents) High-Income Suburbanites (11%) Auto-Oriented, Price-Conscious (6%) Kids, Cars and Schools (16%) Mellow Couples (10%) Ambitious Urbanites (19%) (38% of respondents) Urban DINKs (13%) Young Brainiacs (18%) Transit-Preferring (7%) (29% of respondents) Possible to Attract. Two segments Ambitious Urbanites and Mellow Couples representing 29 percent of respondents, are possible to attract based on having certain interests that match TOD characteristics but are challenging due to other interests.

13 9 9 Auto Ownership Almost two-thirds of those identified as being more likely to be interested in TOD have one or fewer cars in the household meaning their homes can have one or fewer parking spaces, saving space and money for other needs and interests. Hardest to Attract. Three segments Kids, Cars and Schools; Auto-Oriented, Price-Conscious; and High-Income Suburbanites representing 33 percent of respondents, were judged to be harder to attract because of attitudes such as a low desire to use transit and a strong interest in driving. These market segments are described in more detail on the following pages, organized by the ease of attracting them to TOD neighborhoods as described above. Transportation is the secondlargest expense for Bay Area households, second only to housing. It absorbs 27 percent of household income. Most of the cost is related to auto ownership and use. By living in TODs, households can decrease transportation costs through reduced auto usage and ownership. Reducing auto owner ship by one car per household translates to an average savings of $5,000 per year in ownership costs alone even before fuel and repairs are factored in. Source: Analysis conducted for MTC by the Center for Neighborhood Technology

14 10 Easiest to Attract to a TOD Transit-Preferring Segment The number of required parking spaces is one of the strongest determinants of the number of housing units that can be accommodated and how much they will cost. The San Mateo County Transit-Oriented Development Opportunity Study concluded that excessive parking requirements are one of the biggest deterrents to infill. Greater flexibility in how cities regulate parking would go a long way in making infill housing more feasible. Source: Filling in the Gaps How Cities in San Mateo County Can Promote Infill Housing The Transit-Preferring segment represents seven percent of survey respondents and is one of the three easiest to attract market segments for TODs. The Transit-Preferring segment regards access to reliable transit as a primary interest in choosing a residence, and may be the easiest segment to attract to TODs. Actions that are most effective for recruiting more Transit- Preferring members include improving or maintaining high-quality transit service, and more effective marketing of TOD opportunities. The Transit-Preferring segment appears to be among the most price-sensitive segments. About half of those in the Transit-Preferring group mentioned cost concerns as a significant factor in their choice of where to live. This segment has an extremely low auto ownership rate; almost half of these households do not have a car and another quarter have only one car. TODs with low parking rates can be marketed for them, along with policies that provide lower price options, such as unbundling the cost of parking from housing, discounted transit passes and carshare. They place an average value on living in or accessing regional centers/ San Francisco and a low value on the quietness and cleanliness of the neighborhood. Vehicles in the Household 49% 24% 27% 0% None One Two Three + Household Income 41% 42% 17% 1% <$25K $25-$50K $50-$75 >$75 The Transit-Preferring Segment Cares: Transit Accessibility Travel Minimization/ Mixed Land Use Regional Centers/ San Francisco Access School Quality LESS MORE Quiet and Clean Neighborhood Driving Orientation LESS AVERAGE MORE Other Demographics IMPORTANCE Children: 54 percent have children in the household Disproportionately large number of students (22 percent compared to 5 percent overall) Large household size (57 percent have household size of greater than three) The whole segment rents (99 percent) Note: Figures may not add up to 100 percent due to rounding.

15 Easiest to Attract to a TOD UrbanTransit DINKsPreferring Segment Segment The Urban DINKs segment represents 13 percent of survey respondents and is one of the three easiest to attract market segments for TODs. Urban DINKs (Double Income No Kids) value many of the characteristics of transit-oriented environments. They place a particularly high value on transit accessibility, travel minimization and regional centers/san Francisco access, and appear to place a particularly high Vehicles in the Household 55% 18% 23% 4% None One Two Three + Household Income 46% 21% 22% 11% <$25K $25-$50K $50-$75K >$75K premium on neighborhood walkability. They rated the convenience and personal safety of walking and bicycling as being of very high importance in their choice of residential location. This segment has low auto ownership, with 73 percent having one or fewer cars in the household. TODs marketed for them can have low parking rates, and policies to unbundle the cost of parking from housing, discounted transit passes and carsharing are likely to be attractive to this segment. They are interested in good access to regional centers/san Francisco. Forty percent live in San Francisco, the highest of any of the study s market segments. Other Demographics Child-free: Only 2 percent have children in the household Many reside in San Francisco (40 percent compared to 15 percent overall) Not all members of this segment are households with double incomes Note: Figures may not add up to 100 percent due to rounding. The Urban DINKs Segment Cares: Travel Minimization/ Mixed Land Use School Quality Transit Accessibility Regional Centers/ San Francisco Access Quiet and Clean Neighborhood Driving Orientation LESS MORE LESS AVERAGE MORE IMPORTANCE The quality of local schools is of little importance to this group, since 98 percent have no children living in the household (compared to the regional average of 70 percent). They are less interested than other segments in the convenience of driving and the quietness and cleanliness of the neighborhood. The majority of survey respondents place a very high value on the convenience of walking. A Walk Audit is a diagnostic tool used to assess the walking environment of a street, school environment or neighborhood. The audit is usually conducted by a pedestrian design expert, who leads residents, traffic engineers and others on a walk and points out deficiencies such as missing sidewalks or curb ramps, obstacles and dangerous street crossings. Participants often use a Walkability Checklist to help them identify deficiencies. For more information see

16 12 Easiest to Attract to a TOD Young Brainiacs Segment More than just a pleasant amenity, the walkability of cities translates directly into increases in home values. Homes located in more walkable neighbor - hoods those with a mix of common daily shopping and social destinations within a short distance command a price premium over otherwise similar homes in less walkable areas. Houses with aboveaverage levels of walkability command a premium of about $4,000 to $34,000 over houses with just average levels of walkability in the typical metropolitan areas studied. Cortright, J. (2009). Walking the Walk How Walkability Raises Home Values in U.S. Cities. See org/ work/walkingthewalk TheYoung Brainiacs segment represents 18 percent of survey respondents and is one of the three easiest to attract market segments for TODs. Young Brainiacs scored the importance of safe and convenient options for walking and bicycling higher on average than other issues influencing their choice of housing location. They also rated the quality and reliability of transit highly, and value living in or near regional centers/san Francisco. Young Brainiacs are similar to the Urban DINKs, but place more value on school quality, having a quiet and clean neighborhood and being able to drive around conveniently. This suggests that in addition to reliable transit and safe and convenient walking and biking, levels of neighborhood cleanliness/ quietness and school quality should be considered when improving TODs for Young Brainiacs. Their high education level suggests that they may be interested in adult educational amenities, such as university extension and enrichment programs. Young Brainiacs low auto ownership rates 59 percent of households own one or fewer cars make them good candidates for TODs with low parking rates and/or where parking costs are unbundled from housing. Discounted transit passes and carshare programs would be attractive to this group. The Young Brainiacs are highly educated and somewhat younger than the average about 80 percent are between ages 18 and 44. Vehicles in the Household 55% 26% 15% 4% None One Two Three + 28% <$25K Household Income 18% 11% 42% $25-$50K $50-$75K >$75K The Young Brainiacs Segment Cares: LESS Transit Accessibility Travel Minimization/ Mixed Land Use Regional Centers/ San Francisco Access School Quality Quiet and Clean Neighborhood Driving Orientation MORE LESS AVERAGE MORE IMPORTANCE Other Demographics Children: 25 percent have children in the household Highest education of all market segments (91 percent have a college or graduate degree compared to 70 percent overall) Note: Figures may not add up to 100 percent due to rounding.

17 Possible to Attract to a TOD 13 Ambitious Urbanites Segment 13 The Ambitious Urbanites segment represents 19 percent of survey respondents, the largest segment. They are one of two segments considered to be possible to attract to TODs not the ideal target market but possible to attract given the right kind of TOD. Ambitious Urbanites rated all of the attitudinal dimensions highly, suggesting either that they are demanding and difficult to attract, or that their responses to the attitudinal statements were not well differentiated. Overall, they value school quality the most, followed closely by travel minimization, transit accessibility and driving orientation. They wish to live in neigh borhoods where they have the opportunity to choose between walking, biking, transit and driving for any given trip. Ambitious Urbanites also rated quietness, cleanliness, and safety of walking and bicycling highly. They are less interested in having access to regional centers, or living in a neighborhood with mixed land uses. This group has moderate auto own- The Ambitous Urbanites Segment Cares: LESS Transit Accessibility Travel Minimization/ Mixed Land Use Regional Centers/ San Francisco Access School Quality Quiet and Clean Neighborhood Driving Orientation MORE LESS AVERAGE MORE IMPORTANCE According to J. Levine s Zoned Out analysis, the discussion about transportation and landuse planning in the United States has been distorted by the myth that urban sprawl is the result of a free market. Levine proposes that policy reforms that remove regulatory obstacles would support compactdevelopment alternatives, increasing market forces and improving consumer choice. For more information see Levine, J. (2005). Zoned Out: Regulation, Markets, and Choices in Transportation and Metropolitan Land-Use. RFF Press. Vehicles in the Household 51% 27% 18% 5% None One Two Three + Household Income 28% 31% 23% 17% <$25K $25-$50K $50-$75K >$75K Other Demographics Children: 69 percent have children in the household Predominantly long-term Bay Area residents: 62 percent have lived in the Bay Area for more than 10 years, the longest of the market segments Note: Figures may not add up to 100 percent due to rounding. ership 32 percent have one or fewer cars in the household, but most have two cars. Policies that unbundle the cost of parking from housing, discounted transit passes and carshare all offer choices and may help to reduce this group s high car ownership rates, which are a challenge in considering how to accom modate them effectively into TODs.

18 14 14 Possible to Attract to a TOD Mellow Couples Segment AARP, previously known as the American Association of Retired Persons, is getting increasingly involved in supporting multi - modal transportation options for the growing population of older Americans. For example, AARP Hawaii is part of a coalition pressing for safer, multimodal transportation options known as One Voice for Livable Islands, working to require state and county transportation departments to adopt a Complete Streets policy promoting greater safety and access for all modes of transportation, including walking and bicycling. For more information see advocacy/ articles/ older_ residents_ want_ safer_people_ friendly_ tansportation_ options.html TheMellow Couplessegment represents 10 percent of survey respondents, and is one of two segments considered to be possible to attract for TODs. The Mellow Couples segment highly values quiet, safety and cleanliness in neighborhoods, and ease of driving. Members place little value on transit accessibility, travel minimization, access to regional centers and school quality. However, they appear to value some TOD attributes, such as being able to safely walk or bike to do errands. They may be interested in substituting automobile trips with walking or biking. This group may be a good fit for the peripheral areas of a TOD (e.g., a half-mile from a station), where it is convenient both to walk and bike for errands and to drive. Mellow Couples higher incomes, higher rates of retirement, and interest in walking could provide financial support for local higher-end restaurants and shops. The downside is that even if this group moved to a TOD, they may not make use of available transit service since they seem to prefer driving. This group has moderate auto ownership 36 percent have one or fewer cars in the household, but most have two cars. Policies that unbundle the cost of parking from housing and carshare programs may reduce car ownership somewhat, but generally the strong auto-oriented preferences of this group may be challenging in a TOD environment. Vehicles in the Household 54% 31% 5% 11% None One Two Three + Household Income 63% 7% 13% 16% <$25K $25-$50K $50-$75K >$75K Transit Accessibility Travel Minimization/ Mixed Land Use Regional Centers/ San Francisco Access The Mellow Couples Segment Cares: School Quality LESS Quiet and Clean Neighborhood Driving Orientation MORE LESS AVERAGE MORE IMPORTANCE Other Demographics Only 9 percent have children in the household 83 percent have a college degree or greater Older on average over half older than 45 Large share not working (may be retired) Live in smaller households (85 percent live in households of two or fewer members) Note: Figures may not add up to 100 percent due to rounding.

19 Hardest to Attract to a TOD High-Income Suburbanites Auto-Oriented, Price-Conscious Kids, Cars and Schools The remaining three market segments Kids, Cars and Schools; Auto- Oriented, Price-Conscious; and High-Income Suburbanites repre sent 33 percent of respondents and are the hardest segments to attract to a TOD. Three segments are less amenable to TODs. Kids, Cars and Schools members value good-quality schools and a quiet and clean neighborhood with a garage or convenient street parking. They are somewhat interested in having access to transit and regional centers/san Francisco, and being able to walk to do errands. Predominantly married couples with children, they Hardest to Attract Segments have higher incomes and high auto ownership. It is possible they could be attracted to the outer edge of a clean and quiet TOD next to an excellent school. The Auto-Oriented, Price- Conscious segment rated many of the characteristics in the survey as being of low importance. Items rated as being of more-than-average importance included access to a car even if transit is available, dedicated parking and access to a freeway. These preferences indicate they would not be a good target market for TOD. Vehicles in the Household 68% 2% 19% 10% None One Two Three + Other Demographics Note: Figures may not add up to 100 percent due to rounding. It is possible that their low incomes and price consciousness may make some of them amenable to TOD. High-Income Suburbanites place a very low value on transit access. They are predominantly married couples with children, high incomes and high auto ownership. They are the hardest market segment to attract to TOD due to their lack of interest in transit and high interest in convenient driving. 13% Household Income 21% 17% 49% <$25K $25-$50K $50-$75K >$75K PHOTO: 2010 BARRIE ROKEACH (rokeachphoto.com)

20
21 The Strategies: Attracting Residents to TOD Neighborhoods The results of the study can be applied in three steps to make TODs more attractive to more potential residents. 1 Evaluate 2 Identify TOD Neighborhood Characteristics Evaluate the TOD s strengths and weaknesses, including the quality of transit service, walkability, accessibility to regional centers, safety, neighborhood cleanliness and school quality. Segments of People to Attract Compare the TOD characteristics with the interests of each market segment to identify which segments are most likely to be attracted to the TOD. 3Apply Strategies to Attract Target Market Segments Consider how to improve the attractiveness of the TOD for existing and potential market segments. The following sections list some of the strategies that can be used to attract each market segment. Some key strategies for consideration are to zone for mixed land use, improve schools, provide pedestrian amenities, strengthen transit services, clean up the neighborhood and install more lighting.
22 18 18 Step One Evaluate TOD Neighborhood Characteristics?How does a neighborhood match up with the six attitudinal dimensions of: Transit accessibility School quality Travel minimization/ mixed land uses Regional centers/san Francisco access Quietness and cleanliness of neighborhood Driving orientation The ability of a neighborhood to attract specific market segments will depend on its characteristics with regard to these six attitudinal dimensions. Examples of metrics that can be used to evaluate TODs are shown on the next page. These metrics are only suggestions; local jurisdictions are encouraged to develop and use up-to-date metrics that best address local conditions.
23 19 19 Condition Transit Accessibility Travel Minimization/Mixed Land Use (includes walkability) Regional Centers/San Francisco Access* School Quality Neighborhood Quietness and Cleanliness (includes safety) Driving Orientation Community Evaluation Example Metrics Possible Metrics Transit level of service measures for frequency and hours Percent of residents currently commuting by transit Degree of land use mixing and access to local destinations Walkability score and walk audits Intersection density Commute travel time, transit service frequency and driving time to regional centers/san Francisco Weekend and nighttime transit access, service frequency and driving time to regional centers/san Francisco School test scores and dropout rates Percentage of fully credentialed teachers in a school Dollars invested per student Length of waiting lists for placement in school Quality of neighborhood assessment Mature trees/acres of greenspace/ landscaped space Number of complaints for noise Crime statistics Percent of residences with a garage Number of parking spaces available per unit Average time to find parking for residents Drive-time to a freeway * The focus groups conducted for this study indicated some people place a particular importance on being near San Francisco. However, for some individuals, access to other regional Bay Area job and entertainment centers (e.g., Oakland and San Jose) may be equally or more important.
Attachment B Policy Audit Template
 Attachment B Policy Audit Template 5 6 7 8 9 0 Provide A Variety of Transportation Choices Provide A Variety of Transportation Choices Provide A Variety of Transportation Choices Encourage transit-oriented
VISION, DESIGN PRINCIPLES & OVERALL PLANNING STRATEGY
 3 VISION, DESIGN PRINCIPLES & OVERALL PLANNING STRATEGY The overall planning strategy for the Bank Street CDP is to ensure that future development is undertaken in a coordinated and planned approach, supported
Chapter 9: Transportation
 Chapter 9: Transportation What is this chapter about? The goals and policies in this chapter convey the City s intent to: Create a coordinated, efficient, and more affordable multimodal transportation
REFORMING PARKING POLICIES TO SUPPORT SMART GROWTH
 REFORMING PARKING POLICIES TO SUPPORT SMART GROWTH Toolbox/Handbook: Parking Best Practices & Strategies For Supporting Transit Oriented Development In the San Francisco Bay Area ii REFORMING PARKING POLICIES
Appendix J Santa Monica Travel Demand Forecasting Model Trip Generation Rates
 Appendix J Santa Monica Travel Demand Forecasting Model Trip Generation Rates SANTA MONICA TRAVEL DEMAND FORECASTING MODEL TRIP GENERATION RATES SUBMITTED BY: 201 Santa Monica Blvd., Suite 500 Santa Monica,
 Walkable Communities Florida Department of Transportation State Safety Office Pedestrian and Bicycle Program April 1995 www.dot.state.fl.us/safety Twelve Steps for an Effective Program Page 1 Twelve Steps
Smart Growth Illustrated: Developer s Guidebook. City of Bentonville Community Development Department October 2006
 Smart Growth Illustrated: Developer s Guidebook City of Bentonville Community Development Department October 2006 1 Table of Contents What is Smart Growth...3 Six Goals of Smart Growth 5 Ten Tools of Smart
MILWAUKEE. Plan. comprehensive DEPARTMENT OF CITY DEVELOPMENT MARCH, 2010 EXECUTIVE SUMMARY
 MILWAUKEE Plan DEPARTMENT OF CITY DEVELOPMENT MARCH, 2010 comprehensive CITYWIDE POLICY PLAN EXECUTIVE SUMMARY INTRODUCTION AND OVERVIEW I. OVERVIEW OF COMPREHENSIVE SMART GROWTH PLAN SERIES The series
Downtown Tampa Transportation Vision
 Downtown Tampa Transportation Vision Executive Summary August 1, 2006 Hillsborough County Metropolitan Planning Organization County Center, 18 th Floor Tampa, Florida 33602 813-272-5940 www.hillsboroughmpo.org
Mid-Coast Corridor Transit Project San Diego, California New Starts Engineering (Rating Assigned November 2015)
") Mid-Coast Corridor Transit Project San Diego, California New Starts Engineering (Rating Assigned November 2015) Summary Description Proposed Project: Light Rail Transit 10.9 Miles, 9 Stations Total Capital
Mid-Coast Corridor Transit Project San Diego, California New Starts Engineering (Rating Assigned November 2015) Summary Description Proposed Project: Light Rail Transit 10.9 Miles, 9 Stations Total Capital
A Tides Center Project
 June 29, 2015 A Tides Center Project Delivered via email to Matt.fell@mcagov.org Matt Fell, Transportation Manager Merced County Association of Governments 369 West 18 th Street Merced, CA 95340 RE: Comments
TCRP Report 153: Guidelines for Providing Access to Public Transportation Stations. Part 2: Station Typology and Mode of Access Planning Tool
 TCRP Report 153: Guidelines for Providing Access to Public Transportation Stations Part 2: Station Typology and Mode of Access Planning Tool Jamie Parks, AICP Kittelson & Associates, Inc. Acknowledgements
Advancing Equitable Transit Oriented Development The Great Communities Collaborative and the Bay Area TOAH Fund
 Image credit: http://www.flickr.com/photos/dougtone/7364034688 CASE STUDY: SAN FRANCISCO BAY AREA, CA Photo caption and credit Advancing Equitable Transit Oriented Development The Great Communities Collaborative
High Mileage Moms - The Report
 High Mileage Moms - The Report Mothers are spending more time behind the wheel than ever before, and this is leaving less time for the rest of their lives, for everything from playing with children to
Performance Measures for a Sustainable Transportation Network Pasadena s Approach Frederick C. Dock, Ellen Greenberg, Mark Yamarone
 Performance Measures for a Sustainable Transportation Network Pasadena s Approach Frederick C. Dock, Ellen Greenberg, Mark Yamarone Abstract. As California cities move into the second decade of the 21st
01/31/13 ACHIEVING THE VISION FOR RESTON. Reston Master Plan Special Study Task Force
 ACHIEVING THE VISION FOR RESTON Reston Master Plan Special Study Task Force The Reston Master Plan Special Study Task Force was appointed by Hunter Mill District Supervisor Catherine Hudgins to review
Examples of Transportation Plan Goals, Objectives and Performance Measures
 Examples of Transportation Plan Goals, Objectives and Performance Measures The next step in the Long Range Transportation Plan (LRTP) process is to develop goals, objectives, and performance measures.
Citizen Advisory Group Meeting #1 December 8, 2011 6:00 p.m.
 Citizen Advisory Group Meeting #1 December 8, 2011 6:00 p.m. Meeting Agenda 1. Background Information 2. Policy Framework 3. Plan Development Process 4. Public Input Results 5. Vision Statement 6. Group
Mid-Coast Corridor Transit Project San Diego, California New Starts Project Development (Rating Assigned November 2014)
") Mid-Coast Corridor Transit Project San Diego, California New Starts Project Development (Rating Assigned November 2014) Summary Description Proposed Project: Light Rail Transit 10.9 Miles, 9 Stations Total
Mid-Coast Corridor Transit Project San Diego, California New Starts Project Development (Rating Assigned November 2014) Summary Description Proposed Project: Light Rail Transit 10.9 Miles, 9 Stations Total
STOP CONSOLIDATION TRANSIT STRATEGIES
 TRANSIT STRATEGIES STOP CONSOLIDATION Transit stops are the places where people access transit service, and greatly impact many elements of passengers transit experiences. They are typically thought of
Rapid City Downtown Area Master Plan. Draft Plan Concepts April 2016
 Rapid City Downtown Area Master Plan Draft Plan Concepts April 2016 CALL TO ACTION! A Thriving Downtown = Regional Economic Prosperity Rapid City is competing nationally for a limited supply of young skilled
Goals & Objectives. Chapter 9. Transportation
 Goals & Objectives Chapter 9 Transportation Transportation MISSION STATEMENT: TO PROVIDE A TRANSPORTATION NETWORK CAPABLE OF MOVING PEOPLE AND GOODS EFFICIENTLY AND SAFELY. T he transportation system
District of Columbia Zoning Requirements for Parking Study
 District of Columbia Zoning Requirements for Parking Study Project Review Project Overview Kickoff May 2007 Review of Existing Conditions: Zoning, Reports, Data Review of Best Practices Review of On-Street
7.0 GOALS, OBJECTIVES & POLICIES
 7.0 GOALS, OBJECTIVES & POLICIES The following Goals, Objectives and Policies specific to Housing are organized into broad categories including: 7.1: Housing Availability 7.2: Protection of Existing Neighborhoods
IN THE CITY COUNCIL OF THE CITY OF LIVERMORE, CALIFORNIA A RESOLUTION TO APPROVE A COMPLETE STREETS POLICY
 IN THE CITY COUNCIL OF THE CITY OF LIVERMORE, CALIFORNIA A RESOLUTION TO APPROVE A COMPLETE STREETS POLICY The term " Complete Streets" describes a comprehensive, integrated transportation network with
Economic Development Element
 The Strawberry Ladies by Tara Stood Economic Development Element Economic development enhances San Clemente s quality of life by providing local goods and services and expanding employment and business
College of Southern Maryland. Hughesville Transportation Study
 College of Southern Maryland Project Overview Existing Conditions Transit Service Land Use CSM Student Demographics Recommendations Methodology Transit Recommendations Transportation Demand Management
Chapter 4 Communicating Livability Themes: A Strategic Approach
 Chapter 4 Communicating Livability Themes: A Strategic Approach Los Angeles, California Commuter Express Photo Credit: Southern California Association of Governments City of Lauderdale Lakes Welcome Sign
Comprehensive Plan Policies that support Infill and Mixed Use
 Comprehensive Plan Policies that support Infill and Mixed Use Introduction A comprehensive plan provides a broad vision for the future growth of a community. It is often formulated using community visioning
East Somerville. What is important to me Survey Results
 What is important to me Survey Results The What is important to me survey was used at the Somerville by Design: Crowdsourcing meeting on May 28, 213. About 35 people filled out the survey at that meeting,
EPA Technical Assistance for Sustainable Communities Building Blocks
 EPA Technical Assistance for Sustainable Communities Technical Assistance Tool: Complete Streets Deerfield Beach, Florida February 16, 2012 To: CC: Amanda Martinez, City of Deerfield Beach Roger Millar,
San Francisco Complete Streets Strategy
 San Francisco Complete Streets Strategy Timothy Papandreou Deputy Director Sustainable Streets 2013 Sacramento 2 million San Francisco Bay Area 8 million Central Valley 4 million Los Angeles 19 million
Los Angeles Union Station, CA Sustainable Neighborhood Assessment. April 22-23, 2014
 Los Angeles Union Station, CA Sustainable Neighborhood Assessment April 22-23, 2014 Sustainable Neighborhood Assessment Through the Sustainable Neighborhood Assessment Tool developed by Global future development
Draft Non Transportation Performance Measures Including Related Qualitative Assessment of Example Sections
 Draft Non Transportation Performance Measures Including Related Qualitative Assessment of Example Sections Phil Erickson Community Design + Architecture Mike Johnson HDR Engineering CTF Charrette Approach
City of Palo Alto Housing Questionnaire
 City of Palo Alto Housing Questionnaire Section A: Questionnaire Introduction The City of Palo Alto is updating its Housing Element and wants to hear from you! The City is in the process of updating the
HOW WILL PROGRESS BE MONITORED? POLICY AREA. 1. Implement the 2040 Growth Concept and local adopted land use and transportation plans
 PERFORMANCE MONITORING APPROACH OAR 660-044-0040(3)(e) directs Metro to identify performance measures and targets to monitor and guide implementation of the Climate Smart Strategy. The purpose of performance
TRANSPORTATION SERVICE STANDARDS ELEMENT GOALS, OBJECTIVES & POLICIES
 TRANSPORTATION SERVICE STANDARDS ELEMENT GOALS, OBJECTIVES & POLICIES Background One of the most critical public services provided by a community is the community s transportation system. An effective
Department of State Development, Infrastructure and Planning. State Planning Policy state interest guideline. State transport infrastructure
 Department of State Development, Infrastructure and Planning State Planning Policy state interest guideline State transport infrastructure July 2014 Great state. Great opportunity. Preface Using this state
Implementation Strategy
 Implementation Strategy 6 The following implementation strategy defines strategic points of intervention for complete streets programming, including visioning, goal-setting, local agency plans, coordination
Atlanta Regional Commission s Lifelong Communities Initiative: Creating Communities for All Ages and Abilities
 Atlanta Regional Commission s Lifelong Communities Initiative: Creating Communities for All Ages and Abilities Laura Keyes, MS, AICP and Cathie Berger, LMSW The Atlanta region is experiencing a monumental
30 Years of Smart Growth
 30 Years of Smart Growth Arlington County s Experience with Transit Oriented Development in the Rosslyn-Ballston Metro Corridor A Presentation by the Arlington County Department of Community Planning,
Transportation Breakout Session. Curvie Hawkins Mark Rauscher Mike Sims Paul Moore
 Transportation Breakout Session Curvie Hawkins Mark Rauscher Mike Sims Paul Moore Curvie Hawkins Director of Planning Fort Worth Transportation Authority Fort Worth Transportation Authority The T Presented
VANDERBILT COMPARISON
 Village of Vanderbilt Comparison One County, One Vision Master Plan (2000) 1 15 Improve recreation in Otsego County by assessing the availability and need to improve bike paths, county recreation facilities,
Multifamily Housing: Sustainable Development in Efficient, Walkable Communities
 Multifamily Housing: Sustainable Development in Efficient, Walkable Communities by the Greater Charlotte Apartment Association Multifamily rental housing is a critical piece of the housing market in the
Eagle Commuter Rail Denver, Colorado Final Design (Based upon information received by FTA in November 2010)
") Eagle Commuter Rail Denver, Colorado Final Design (Based upon information received by FTA in November 2010) Summary Description Proposed Project: Electrified Commuter Rail 30.2 Miles, 13 Stations Total
Eagle Commuter Rail Denver, Colorado Final Design (Based upon information received by FTA in November 2010) Summary Description Proposed Project: Electrified Commuter Rail 30.2 Miles, 13 Stations Total
LIVING A TRANSIT LIFESTYLE
 LIVING A TRANSIT LIFESTYLE TOD Resident Survey Results Transit-Oriented Development Resident Survey Results Report December 2014 www.rtachicago.org 1 WHAT IS THE RTA? FACTS AND FIGURES: The RTA public
Improving Suburbs for All Ages: Scorecard and Toolkit
 Improving Suburbs for All Ages: Scorecard and Toolkit Scott Ranville President, HLP International Making Cities Livable June, 2013 The Approach: HLP City Scorecard Identify cities that are best designed
Lincoln Downtown Master Plan Update
 Lincoln Downtown Master Plan Update Table of Contents Executive Summary........................................... 1 Complete Streets Framework.................................... 3 Promenade Creating
Transportation Best Practices for Serving Low Income Residents National Resource Network 311 for Cities
 Transportation Best Practices for Serving Low Income Residents National Resource Network 311 for Cities In August 2015, a city submitted a request for assistance to the National Resource Network s 311
School-related traffic congestion is a problem in
 SCHOOL TRANSPORTATION Automated Vehicle Location for School Buses Can the Benefits Influence Choice of Mode for School Trips? TORI D. RHOULAC The author is Assistant Professor, Department of Civil Engineering,
SAN FRANCISCO BICYCLE COALITION
 SanFranciscoBicycleCoalitionNovember2010CandidateQuestionnaire Emailyourresponsetomarc@sfbike.orgnolaterthanFridayAugust16,2010 SAN FRANCISCO BICYCLE COALITION November 2010 Supervisor Candidate Questionnaire
San Diego s Voice for Affordable Housing
 July 15, 2015 SANDAG Board of Directors, Chair Jack Dale Transportation Committee, Chair Todd Gloria Regional Planning Committee, Chair Lesa Heebner 401 B Street, Suite 800 RE: Draft San Diego Forward:
SMALL BUSINESS COMMISSION AND OFFICE OF SMALL BUSINESS
 CITY AND COUNTY OF SAN FRANCISCO SMALL BUSINESS COMMISSION AND OFFICE OF SMALL BUSINESS 1 Dr. C a r lto n B. G o o d let t P lace, S u ite 1 10 Te l: 415-554-6134 Fa x : 41 5-558-7844 w w w. s fgov.o r
A g i n g I n P l a c e
 The BIG Picture Citizen Academy 4 A g i n g I n P l a c e 18 February 2015 T O D A Y Welcome Mayor Tommy Battle The Big Picture Dennis Madsen, AICP - Planning Aging In Place Whit Blanton, FAICP Renaissance
Light Rail Transit in Phoenix
 4. Presentation and Discussion: Phoenix Light Rail Implementation Wulf Grote Planning and Development Director, Phoenix Valley Metro Light Rail Transit in Phoenix Broadway Citizen s Task Force February
Overview of the Travel Demand Forecasting Methodology
 Overview of the Travel Demand Forecasting Methodology Prepared by the Central Transportation Planning Staff (CTPS) Authors: Scott A. Peterson, Manager Ian Harrington, Chief Planner March 29, 2008 1 OVERVIEW
Restoration. a brief look at
 Copyright 2009 Canin Associates, Inc. All rights reserved. No part of this publication may be reproduced or transmitted by any means without written permission from Canin Associates, Inc. a brief look
healthy planning guide
 healthy planning guide This guide is intended to help public health and planning departments collaborate on strategies to promote healthier communities. Each page links health risks to aspects of the built
RESOLUTION NO. WHEREAS, the 2016-2017 City Budget Forecast estimates that housing
 RESOLUTION NO. WHEREAS, the 2016-2017 City Budget Forecast estimates that housing (21.6 percent) and transportation (14.9 percent) are the two largest expense categories for the typical Austin family;
What we build today will create Denver s tomorrow. Signature development projects will strengthen our economy, create jobs and improve neighborhoods.
 Mayor Hancock s Vision for Building a World-Class City What we build today will create Denver s tomorrow. Signature development projects will strengthen our economy, create jobs and improve neighborhoods.
Transit Supportive Planning Toolkit
 Puget Sound Regional Council Growing Transit Communities Partnership Transit Supportive Planning Toolkit Guidance and Resources for Plan and Policy Development December 2013 a Table of Contents Introduction...
Summary Community Workshop #2 Fruitvale San Antonio Senior Center. Wednesday, April 22, 2009 7:00-9:00 p.m.
 Summary Community Workshop #2 Wednesday, April 22, 2009 7:00-9:00 p.m. Workshop Format and Process The City of Oakland is preparing a Specific Plan that will help define and determine a common vision for
Implementing Instructions - Sustainable Locations for Federal Facilities
 Implementing Instructions - Sustainable Locations for Federal Facilities Page 1 Background On October 5, 2009, President Obama signed Executive Order (E.O.) 13514, Federal Leadership in Environmental,
Comprehensive Mobility Project Development Process Capital Metro ¼-Cent Fund Analysis
 Comprehensive Mobility Project Development Process Capital Metro ¼-Cent Fund Analysis Transportation & Mobility projects that meet the following criteria: enhances regional mobility; supports public transit;
CHAPTER 9 DEFICIENCY PLANS
 CHAPTER 9 DEFICIENCY PLANS Key Topics: Legislative Requirements Legislative Intent and Application to San Francisco Deficiency Planning Process Special Issues Work Program Items - Key Milestones 1. Legislative
6. Social & Community Facilities
 6.1. Objectives The built environment, with appropriate housing, public spaces and community facilities provides a basic platform to ensure residents have the best opportunity to build their own community.
THE IMPLICATIONS OF ALTERNATIVE GROWTH PATTERNS ON INFRASTRUCTURE COSTS
 City of Calgary THE IMPLICATIONS OF ALTERNATIVE GROWTH PATTERNS ON INFRASTRUCTURE COSTS REPORT APRIL 2, 2009 IBI GROUP REPORT City of Calgary EXECUTIVE SUMMARY Purpose of Report Calgary has seen record
Opal Service District Plan
 8 The Opal Service District includes a variety of planned land uses including commercial, mixed-use, flex office, industrial, and hospitality. This Plan seeks to simplify the land use categories to allow
This report card was produced by: 995 Market St, Suite 1450 San Francisco, CA 94702 www.walksf.org
 This report card was produced by: 995 Market St, Suite 1450 San Francisco, C 94702 www.walksf.org Special thanks to interns Christina Blackston and Haley Meisenholder for their contributions to this report
Re: Draft Environmental Impact Statement & Growth and Equity Analysis for the Seattle Comprehensive Plan Update
 June 18, 2015 City of Seattle Department of Planning and Development Attn: Gordon Clowers 700 5th Avenue, Suite 2000 PO Box 34019 Seattle, WA 98124 Re: Draft Environmental Impact Statement & Growth and
Feasibility of Car-Sharing Service in Hangzhou, China
 Feasibility of Car-Sharing Service in Hangzhou, China 1 Project Members 2 Project Goals 3 In depth feasibility study of launching a car sharing service in Hangzhou Provide possible ways of implementing
Commuter Choice Certificate Program
 Commuter Choice Certificate Program Current course offerings (subject to change) Core 1 Commuter Choice Toolbox Required Courses Rideshare Options Audience: This 2 credit required course is targeted to
Health Atlas and the Community Health and Equity Index:
 Health Atlas and the Community Health and Equity Index: An Examination of Health Conditions in the City of Los Angeles Presented by Eric Yurkovich, Raimi + Associates March 13, 2014 Purpose Spatial analysis
Transportation Master Plan DRAFT POLICIES FOR DISCUSSION ONLY
 City of Regina Transportation Master Plan DRAFT POLICIES FOR DISCUSSION ONLY Prepared for City of Regina by IBI Group April 2014 C. Transportation Directions C.1 Offer a range of sustainable transportation
Chapter 13: Implementation Plan
 Chapter 13: 13.1. INTRODUCTION The purpose of the implementation chapter of the Comprehensive Plan is to set forth the actions that the City will take to ensure that the plans, programs and policies set
University of Missouri-St. Louis North Station
 University of Missouri-St. Louis North Station This station profile describes existing conditions around the UMSL North MetroLink Station. This is one of a set of profiles for each of the MetroLink System
5 Performance Measures
 5 Performance Measures This page left blank intentionally. 5 2 Moving Forward Monterey Bay 2035 Introduction The investments identified in the 2035 MTP/SCS are expected to result in significant benefits
ROAD INJURIES &FATALITIES
 VOLUME TWO THE HEALTH IMPACTS OF URBAN SPRAWL ROAD INJURIES &FATALITIES AN INFORMATION SERIES FROM ONTARIO COLLEGE OF FAMILY PHYSICIANS www.ocfp.on.ca 1. Injury and death on our roads Many people move
Market Analysis Retail Housing Office [CITY OF BERLIN MARKET ANALYSIS] City of Berlin, Wisconsin
![Market Analysis Retail Housing Office [CITY OF BERLIN MARKET ANALYSIS] City of Berlin, Wisconsin](/thumbs/34/17190064.jpg "Market Analysis Retail Housing Office [CITY OF BERLIN MARKET ANALYSIS] City of Berlin, Wisconsin") 2013 Market Analysis Retail Housing Office [CITY OF BERLIN MARKET ANALYSIS] City of Berlin, Wisconsin Executive Summary Berlin is a community of roughly 5,500 residents, located along the Fox River in
2013 Market Analysis Retail Housing Office [CITY OF BERLIN MARKET ANALYSIS] City of Berlin, Wisconsin Executive Summary Berlin is a community of roughly 5,500 residents, located along the Fox River in
2010 Salida Community Priorities Survey Summary Results
 SURVEY BACKGROUND The 2010 Salida Community Priorities Survey was distributed in September in an effort to obtain feedback about the level of support for various priorities identified in the draft Comprehensive
A Bicycle Accident Study Using GIS Mapping and Analysis
 A Bicycle Accident Study Using GIS Mapping and Analysis Petra Staats, Graduate Assistant, Transportation Policy Institute, Rutgers University, New Brunswick, NJ, USA pstaats@eden.rutgers.edu Summary Surveys
Managing the Transit Network A Primer on Key Concepts
 Managing the Transit Network A Primer on Key Concepts translink.ca Introduction As the integrated, multi-modal transportation authority for Metro Vancouver, TransLink plans and delivers the transit network
chapter 3 Community Outreach
 3 Community Outreach The framework of this Plan is the input and support of the community and stakeholder agencies. Staff from SamTrans and City of San Mateo partnered to involve residents, community-based
San Francisco Transportation Initiatives and Workforce Support
 San Francisco Transportation Initiatives and Workforce Support Tilly Chang, SFCTA September 16, 2015 SAN FRANCISCO COUNTY TRANSPORTATION AUTHORITY Presentation Agenda I. SFCTA Overview II. Planning Studies
APPENDIX B: THE PORTLAND METROPOLITAN REGION S CASE FOR ACTIVE TRANSPORTATION
 APPENDIX B: THE PORTLAND METROPOLITAN REGION S CASE FOR ACTIVE TRANSPORTATION Prepared by Alta Planning & Design May 2009 Call for Active transportation demonstration projects Metro invites partners to
OVERVIEW PROJECT SUMMARY
 OVERVIEW Cesar Chavez showcases how to successfully redesign a primary arterial route into a neighborhood destination, improving modal share, water sensitive design, biodiversity and safety whilst maintaining
California Climate Challenge Methodology April 25, 2013
 California Climate Challenge Methodology April 25, 2013 Feebates Semi Truck Fuel Efficiency Pay- As- You- Drive Insurance Gas Tax Parking Prices Give a rebate to owners of more efficient vehicles while
Tier 1 Strategies. WV Route 14 Corridor Management Plan
 1.1 1.2 1.3 1.4 Signal timing optimization system improvements. Improve geometry traffic control at high crash intersections. Construct intersection capacity improvement projects. Widen longer sections
Alternatives to the Circ Project Prioritization Methodology Prepared for Circ Task Force July 28, 2011
 Alternatives to the Circ Project Prioritization Methodology Prepared for Circ Task Force July 28, 2011 CCRPC staff has developed a draft methodology described below and detailed in the attached pages for
Measuring the Street:
 Measuring the Street: New Metrics for 21st Century Streets 1 Measuring the Street: New Metrics for 21st Century Streets New York City s streets are constantly called on to the meet new and varied needs
ORANGE COUNTY TRANSPORTATION AUTHORITY. Final Long-Range Transportation Plan - Destination 2035. Attachment A
 ORANGE COUNTY TRANSPORTATION AUTHORITY Final Long-Range Transportation Plan - Destination 2035 Attachment A DESTINATION 2035 DESTINATION 2035 EXECUTIVE SUMMARY ATTACHMENT A Moving Toward a Greener Tomorrow
SUSTAINABLE HOUSTON: DEMOGRAPHIC TRENDS, IMPACTS, AND FUTURE PLANS
 SUSTAINABLE HOUSTON: DEMOGRAPHIC TRENDS, IMPACTS, AND FUTURE PLANS Dr. Philip Berke Professor, UNC Chapel Hill Department of City & Regional Planning Deputy Director, UNC Institute for the Environment
Bicycle Safety Webinar December 1 st 2010
 Bicycle Safety Webinar December 1 st 2010 Kay Teschke Kay Teschke is Professor in the Schools of Population and Public Health and of Environmental Health at the University of British Columbia. She is principal
IF THEN SURVEY RESULTS
 IF THEN SURVEY RESULTS BUILDING TOWARDS A REGIONAL VISION Survey Summary April 2013 BACKGROUND In the spring of 2011, the Piedmont Triad undertook an ambitious, 3-year planning effort designed to strengthen
Task 1 Project Management and Project Organization Work Plan
 City of Palmdale Active Transportation Program Plan Scope of Work At their January 22, 2015 meeting, the California Transportation Commission (CTC) allocated funding for the above-referenced project as
TRAVEL BEHAVIOR ISSUES RELATED TO NEO-TRADITIONAL DEVELOPMENTS A REVIEW OF THE RESEARCH
 TRAVEL BEHAVIOR ISSUES RELATED TO NEO-TRADITIONAL DEVELOPMENTS A REVIEW OF THE RESEARCH SUSAN HANDY University of Texas School of Architecture Goldsmith Hall Austin, TX 78712-1160 At first glance, it may
WEST YORKSHIRE BUS STRATEGY
 WEST YORKSHIRE BUS STRATEGY Phase 1 Consultation on Vision and Principles Introduction and Purpose There is a statutory requirement for the West Yorkshire Combined Authority (WYCA) to produce a Local Transport
Transportation Alternatives
 1 Transportation Alternatives Transportation alternatives involve a variety of components: Location Alternatives - when and where service is provided - general location as well as level of service on the
BASSETT CREEK VALLEY MASTER PLAN OPEN HOUSE
 BASSETT CREEK VALLEY MASTER PLAN OPEN HOUSE February 23, 2006 PROJECT INTRODUCTION Project Area 230 acres $50 million estimated market value (approximately) 50 acres parkland 100 residences (estimated)
Topic 2 11/28/2012 Blocks & Street Network
 TOPIC 2 Blocks & Street Network Implementation Note: 1. Some recommendations are summarized in the tables herein. For complete recommendation language, please see the. 2. Recommendations referenced in