Budgets and nstitutional Analysis. Enrollment Data. Summer 2000
|
|
|
- Adam Fisher
- 7 years ago
- Views:
Transcription
1 I Budgets and nstitutional Analysis Enrollment Data Summer 2000

2 Table of Contents Summer 2000 University Enrollment... 1 Five-Year Enrollment History Residency... 3 Minority/Other Students... 4 Application Type... 5 Enrollment Data Summary Charts Residency... 7 Gender... 8 Ethnicity... 9 College Application Type Full-Time/Part-Time Enrollment Class Age at Registration Enrollment Data Breakdowns Primary Major & Class Application Type, Class, College & Residency Ethnicity, College & Class Department, Gender & Ethnicity Full/Part-Time Status by College & Gender Nonresidents by State International Students by Country... 34

3 University Enrollment Summer 2000 Undergraduate 5,233 Graduate 737 PVM 130 University Total 6,100 Enrollment Data June, 2000

4 Five-Year Enrollment History

5 Residency Headcount Resident Nonresident Total % Change/ Number Percent Number Percent Headcount Previous Year Year Summer , , ,243 Summer , , , Summer , , , Summer , , , Summer , , , FTE Resident Nonresident Total % Change/ FTE Percent FTE Percent FTE Previous Year Year Summer , ,411 Summer , , Summer , , Summer , , Summer , , Enrollment Data June,

6 Minority/Other Students Minority Other Students Number Percent Number Percent Year Summer , Summer , Summer , Summer , Summer , Enrollment Data June,

7 Application Type Undergraduate Freshmen Transfers Readmits Continuing Non-Degree Total Year Summer , ,379 Summer , ,265 Summer , ,533 Summer , ,473 Summer , ,233 Graduate and Professional New Continuing Non-Degree Prof Vet Med Total Year Summer Summer Summer Summer Summer Enrollment Data June,

8 Enrollment Data Summary Charts

9 Residency Percent of Percent of Number Category University Undergraduate Resident 4, Nonresident Total 5, Graduate Resident Nonresident Total Prof Vet Med Resident Nonresident Total University Resident 4, Nonresident 1, University Total 6, Enrollment Data June,

10 Gender Resident Nonresident Total % of % of % of No. Category No. Category No. Category Undergraduate Men 1, , Women 2, , Total 4, , Graduate Men Women Total Prof Vet Med Men Women Total University Men 2, , Women 2, , University Total 4, , , Enrollment Data June,

11 Ethnicity Resident Nonresident Total % of % of % of No. Category No. Category No. Category Undergraduate Native American Black Asian American Hispanic White 3, , International Other Total 4, , Graduate Native American Black Asian American Hispanic White International Other Total Prof Vet Med Native American Asian American Hispanic White Other Total University Native American Black Asian American Hispanic White 4, , International Other University Total 4, , , Enrollment Data June,

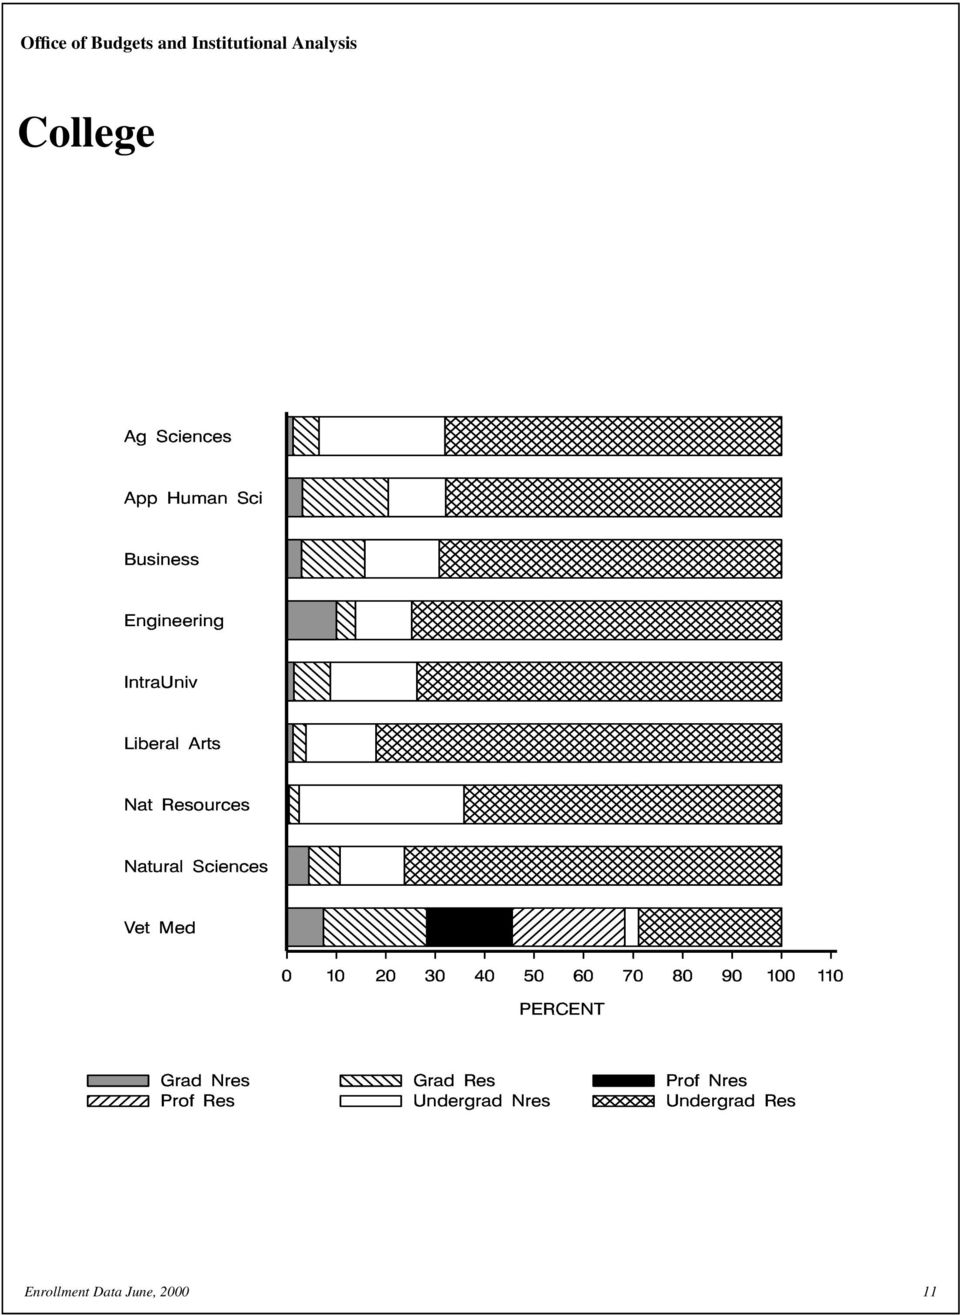
12 College Resident Nonresident Total % of % of % of No. Category No. Category No. Category Undergraduate Agricultural Sciences Applied Human Sciences , Business Engineering Intra-University Liberal Arts , Natural Resources Natural Sciences Veterinary Medicine and Bio Total 4, , Graduate Agricultural Sciences Applied Human Sciences Business Engineering Intra-University Liberal Arts Natural Resources Natural Sciences Veterinary Medicine and Bio Total Prof Vet Med Veterinary Medicine and Bio Total University Agricultural Sciences Applied Human Sciences 1, , Business Engineering Intra-University Liberal Arts , Natural Resources Natural Sciences Veterinary Medicine and Bio University Total 4, , , Enrollment Data June,

13 College Enrollment Data June,
14 Application Type Percent of Resident Nonresident Total University Undergraduate New Freshmen Transfer Students Readmitted Students Continuing Students 3, , Non-Degree Students Total 4, , Graduate and Professional New, Readmitted Students Continuing Students Non-Degree Students Prof. Veterinary Medicine Total University Total 4,928 1,172 6, Enrollment Data June,

15 Full-Time/Part-Time Enrollment Percent of Resident Nonresident Total University Full-Time Undergraduate , Graduate Prof. Veterinary Medicine Total 1, , Part-Time Undergraduate 3, , Graduate Total 3, , University Total 4,928 1,172 6, Full-time students = undergraduates enrolled for 12 or more credits Fall, Spring ( 9 - Summer ) graduates enrolled for 9 or more credits all professional veterinary students Enrollment Data June,
 graduates enrolled for 9 or more credits")
16 Class Percent of Resident Nonresident Total University Undergraduate Freshmen Sophomore Junior 1, , Senior 2, , Total 4, , Graduate and Professional Graduate-I (excl PVM) Graduate-II (excl PVM) Graduate-II (PVM) Total University Total 4,928 1,172 6, Enrollment Data June,
 134 46 180 3.0 Graduate-II (PVM) 74 56 130 2.1 Total 630 237 867 14.")
17 Age at Registration Undergraduate Graduate Prof Vet Med Total Univ Age 17 or under , , or over Not Reported Total 5, ,100 Mean Age Undergraduates Graduates Prof Vet Med Enrollment Data June,

18 Enrollment Data Breakdowns

19 Primary Major & Class Undergraduate Graduate Freshmen Sophomore Junior Senior Subtotal I II Subtotal Total Agricultural Sciences Agricultural Business Agricultural Economics Agricultural Education Agricultural Sciences Agricultural Sciences - Surge Agricultural and Resource Econ Animal Science Animal Sciences Bioagricultural Sciences Entomology Equine Science Horticulture Landscape Architecture Landscape Horticulture Plant Pathology & Weed Science Pre-Landscape Architecture Soil and Crop Sciences Total College Applied Human Sciences Apparel and Merchandising Applied Human Science Open Opt Construction Management Consumer Sciences Consumer and Family Studies Counseling Endorsement Design & Merchandising Ed/Human Resrc Studies-Sterlng Ed/Human Resrce Studies - TEAM Educ. & Human Resource Studies Educ/HRS - Grand Junction Food Science and Nutrition Health and Exercise Science Human Develop & Family Studies Industrial Technology Mngmnt Interior Design Mfg Technology & Constr Mgmnt Nutrition and Food Science Occupational Therapy Pre-Mfg Tech and Constr Mngmnt Pre-OT Curriculum Restaurant & Resort Management Social Work Teacher Educ - Art Teacher Educ - Biology Teacher Educ - Biology/Nat Res Teacher Educ - Business Educ Teacher Educ - Chemistry Teacher Educ - English Teacher Educ - French Teacher Educ - Physical Educ Teacher Educ - Social Studies Teacher Educ - Spanish Teacher Education-Conditional Technology Educ and Training Enrollment Data June,

20 Primary Major & Class Applied Human Sciences (continued) Undergraduate Graduate Freshmen Sophomore Junior Senior Subtotal I II Subtotal Total Type D Certification Total College ,342 Business Accounting Business Administration Business Open Option Finance-Real Estate Information Systems MBA - Accelerated (11-month) MBA - Evening (2-year) Management Marketing Total College Engineering Atmospheric Science Bioresource & Agri Engr Chemical Engineering Civil Engineering Electrical Engineering Engineering Open Option Engineering Science Environmental Engineering Mechanical Engineering Total College Intra-University Cell and Molecular Biology Ecology Intra-University ACCESS Intra-University Specials Open Option Open Option Seeking Business Pre-Business Pre-Restaurant and Resort Mgmt Pre-Technical Journalism University Open Option Total College Liberal Arts Anthropology Art Creative Writing Dance Economics English Foreign Languages&Literatures French German History Liberal Arts Liberal Arts Open Option Music Music Education Enrollment Data June,

21 Primary Major & Class Undergraduate Graduate Freshmen Sophomore Junior Senior Subtotal I II Subtotal Total Liberal Arts (continued) Music Therapy Performance (Music) Philosophy Political Science Pre-Music Sociology Spanish Speech Communication Technical Communication Technical Journalism Theatre Total College , ,169 Natural Resources Earth Resources Fishery Biology Fishery and Wildlife Biology Forest Sciences Forestry Geology Nat Res Open Option Natural Resources Management Ntrl Resourc Recrtn & Tourism Range and Forest Management Rangeland Ecology Rangeland Ecosystem Science Recreation Resources Watershed Science Wildlife Biology Total College Natural Sciences Biochemistry Biological Science Botany Chemistry Computer Science Computer Science - Denver Life Sciences Open Option Mathematics Natural Sciences Open Option Physical Science Physics Psychology Statistics Zoology Total College Veterinary Medicine and Biomedical Sciences Anatomy Clinical Sciences Doctor of Veterinary Medicine Environmental Health Microbiology Pathology Physiology Enrollment Data June,
22 Primary Major & Class Undergraduate Graduate Freshmen Sophomore Junior Senior Subtotal I II Subtotal Total Veterinary Medicine and Biomedical Sciences (continued) PreProfessional Vet Medicine Radiological Health Sciences Vet Med/BioMed Sci Open Option Total College University Total ,420 2,851 5, ,100 Enrollment Data June,
23 Application Type, Class, College & Residency Freshman Sophomore Junior Senior Grad. I Grad. II Total R NR R NR R NR R NR R NR R NR R NR Total Agricultural Sciences New Freshmen Transfers Readmits Continuing Undergraduates New Graduates Continuing Graduates Total College Applied Human Sciences New Freshmen Transfers Readmits Continuing Undergraduates Non-Degree Undergraduates New Graduates Continuing Graduates Non-Degree Graduates Total College , ,342 Business New Freshmen Transfers Readmits Continuing Undergraduates New Graduates Continuing Graduates Total College Engineering New Freshmen Transfers Readmits Continuing Undergraduates New Graduates Continuing Graduates Total College Intra-University New Freshmen Transfers Readmits Continuing Undergraduates Non-Degree Undergraduates Continuing Graduates Non-Degree Graduates Total College Liberal Arts New Freshmen Transfers Readmits Continuing Undergraduates ,091 Non-Degree Undergraduates New Graduates Continuing Graduates Total College ,169 Enrollment Data June,
24 Application Type, Class, College & Residency Freshman Sophomore Junior Senior Grad. I Grad. II Total R NR R NR R NR R NR R NR R NR R NR Total Natural Resources New Freshmen Transfers Readmits Continuing Undergraduates New Graduates Continuing Graduates Total College Natural Sciences New Freshmen Transfers Readmits Continuing Undergraduates Non-Degree Undergraduates New Graduates Continuing Graduates Total College Veterinary Medicine and Biomedical Sciences Transfers Readmits Continuing Undergraduates New Graduates Continuing Graduates Prof. Veterinary Medicine Total College Total University New Freshmen Transfers Readmits Continuing Undergraduates , , , ,587 Non-Degree Undergraduates Subtotal , , , ,233 New Graduates Continuing Graduates Non-Degree Graduates Prof. Veterinary Medicine Subtotal Total University , , ,928 1,172 6,100 Enrollment Data June,
25 Ethnicity, College & Class Native Asian Minority Inter- American Black American Hispanic Subtotal White National Other Total Agricultural Sciences Freshmen Sophomore Junior Senior Subtotal Graduate I Graduate II Subtotal Total College Applied Human Sciences Freshmen Sophomore Junior Senior Subtotal ,067 Graduate I Graduate II Subtotal Total College , ,342 Business Freshmen Sophomore Junior Senior Subtotal Graduate I Subtotal Total College Engineering Freshmen Sophomore Junior Senior Subtotal Graduate I Graduate II Subtotal Total College Intra-University Freshmen Sophomore Junior Senior Subtotal Graduate I Graduate II Subtotal Total College Enrollment Data June,
26 Ethnicity, College & Class Native Asian Minority Inter- American Black American Hispanic Subtotal White National Other Total Liberal Arts Freshmen Sophomore Junior Senior Subtotal ,124 Graduate I Graduate II Subtotal Total College ,169 Natural Resources Freshmen Sophomore Junior Senior Subtotal Graduate I Graduate II Subtotal Total College Natural Sciences Freshmen Sophomore Junior Senior Subtotal Graduate I Graduate II Subtotal Total College Veterinary Medicine and Biomedical Sciences Freshmen Sophomore Junior Senior Subtotal Graduate I Graduate II Vet Med Subtotal Total College Total University Freshmen Sophomore Junior , ,420 Senior , ,851 Subtotal , , 233 Graduate I Graduate II Vet Med Subtotal Total University , ,100 Enrollment Data June,
27 Department, Gender & Ethnicity Native Asian Inter- American Black American Hispanic White National Other Total Agricultural Sciences Agricultural & Resource Economics Undergraduate Men Undergraduate Women Graduate Women Total Department Agricultural Sciences Intra-College Undergraduate Men Undergraduate Women Graduate Men Graduate Women Total Department Animal Sciences Undergraduate Men Undergraduate Women Graduate Men Graduate Women Total Department Bioagricultural Scs & Pest Mngmnt Undergraduate Men Undergraduate Women Graduate Men Graduate Women Total Department Horticulture & Landscape Archtctr Undergraduate Men Undergraduate Women Graduate Men Graduate Women Total Department Soil and Crop Sciences Undergraduate Men Undergraduate Women Graduate Men Graduate Women Total Department Total College Applied Human Sciences Applied Human Sciences Intra-Colleg Undergraduate Men Undergraduate Women Total Department Design and Merchandising Undergraduate Men Undergraduate Women Graduate Women Total Department Food Science & Human Nutrition Undergraduate Men Undergraduate Women Graduate Men Graduate Women Total Department Enrollment Data June,
28 Department, Gender & Ethnicity Native Asian Inter- American Black American Hispanic White National Other Total Applied Human Sciences Health and Exercise Science Undergraduate Men Undergraduate Women Graduate Men Graduate Women Total Department Human Development & Family Studies Undergraduate Men Undergraduate Women Graduate Men Graduate Women Total Department Mfg Tech and Const Mgmt Undergraduate Men Undergraduate Women Graduate Men Graduate Women Total Department Occupational Therapy Undergraduate Men Undergraduate Women Graduate Men Graduate Women Total Department School of Education Undergraduate Men Undergraduate Women Graduate Men Graduate Women Total Department Social Work Undergraduate Men Undergraduate Women Graduate Women Total Department Total College , ,342 Business Business Intra-College Undergraduate Men Undergraduate Women Graduate Men Graduate Women Total Department Total College Engineering Atmospheric Science Graduate Men Graduate Women Total Department Enrollment Data June,
29 Department, Gender & Ethnicity Native Asian Inter- American Black American Hispanic White National Other Total Engineering Chemical & Bioresource Engineering Undergraduate Men Undergraduate Women Total Department Civil Engineering Undergraduate Men Undergraduate Women Graduate Men Graduate Women Total Department Electrical and Computer Engineering Undergraduate Men Undergraduate Women Graduate Men Graduate Women Total Department Engineering Intra-College Undergraduate Men Undergraduate Women Total Department Mechanical Engineering Undergraduate Men Undergraduate Women Graduate Men Graduate Women Total Department Total College Intra-University Academic Provost Undergraduate Men Undergraduate Women Graduate Men Graduate Women Total Department HELP/Success Center Undergraduate Men Undergraduate Women Total Department Other Intra-Programs Undergraduate Men Undergraduate Women Graduate Men Graduate Women Total Department Total College Liberal Arts Anthropology Undergraduate Men Undergraduate Women Graduate Men Graduate Women Total Department Enrollment Data June,
30 Department, Gender & Ethnicity Native Asian Inter- American Black American Hispanic White National Other Total Liberal Arts Art Undergraduate Men Undergraduate Women Graduate Women Total Department Economics Undergraduate Men Undergraduate Women Graduate Men Total Department English Undergraduate Men Undergraduate Women Graduate Men Graduate Women Total Department Foreign Languages & Literatures Undergraduate Men Undergraduate Women Graduate Men Total Department History Undergraduate Men Undergraduate Women Graduate Men Graduate Women Total Department Journalism & Technical Commnction Undergraduate Men Undergraduate Women Graduate Men Graduate Women Total Department Liberal Arts Intra-College Undergraduate Men Undergraduate Women Total Department Music, Theatre, & Dance Undergraduate Men Undergraduate Women Graduate Men Graduate Women Total Department Philosophy Undergraduate Men Undergraduate Women Total Department Political Science Undergraduate Men Undergraduate Women Graduate Men Graduate Women Total Department Enrollment Data June,
31 Department, Gender & Ethnicity Native Asian Inter- American Black American Hispanic White National Other Total Liberal Arts Sociology Undergraduate Men Undergraduate Women Graduate Women Total Department Speech Communication Undergraduate Men Undergraduate Women Total Department Total College ,169 Natural Resources Earth Resources Undergraduate Men Undergraduate Women Graduate Men Graduate Women Total Department Fishery & Wildlife Biology Undergraduate Men Undergraduate Women Graduate Men Total Department Forest Sciences Undergraduate Men Undergraduate Women Graduate Men Graduate Women Total Department Natural Res Intra-College Undergraduate Men Total Department Natural Resource Recreation & Tour Undergraduate Men Undergraduate Women Graduate Women Total Department Rangeland Ecosystem Science Undergraduate Men Undergraduate Women Graduate Men Graduate Women Total Department Total College Natural Sciences Biochemistry & Molecular Bio Undergraduate Men Undergraduate Women Total Department Enrollment Data June,
32 Department, Gender & Ethnicity Native Asian Inter- American Black American Hispanic White National Other Total Natural Sciences Biology Undergraduate Men Undergraduate Women Graduate Men Graduate Women Total Department Chemistry Undergraduate Men Undergraduate Women Graduate Men Graduate Women Total Department Computer Science Undergraduate Men Undergraduate Women Graduate Men Graduate Women Total Department Mathematics Undergraduate Men Undergraduate Women Graduate Men Graduate Women Total Department Natural Sciences Intra-College Undergraduate Men Undergraduate Women Total Department Physics Undergraduate Men Undergraduate Women Graduate Men Graduate Women Total Department Psychology Undergraduate Men Undergraduate Women Graduate Men Graduate Women Total Department Statistics Undergraduate Men Total Department Total College Veterinary Medicine and Biomedical Sciences Anatomy & Neurobiology Graduate Men Graduate Women Total Department Clinical Sciences Graduate Men Graduate Women Total Department Enrollment Data June,
33 Department, Gender & Ethnicity Native Asian Inter- American Black American Hispanic White National Other Total Veterinary Medicine and Biomedical Sciences Environmental Health Undergraduate Men Undergraduate Women Graduate Men Graduate Women Total Department Microbiology Undergraduate Men Undergraduate Women Graduate Men Graduate Women Total Department Pathology Graduate Men Graduate Women Total Department Physiology Graduate Men Graduate Women Total Department Radiological Health Sciences Graduate Men Graduate Women Total Department Vet Med & Biomed Sci Intra-College Undergraduate Men Undergraduate Women Prof Vet Med Men Prof Vet Med Women Total Department Total College Total University Undergraduate Men , ,430 Undergraduate Women , ,803 Graduate Men Graduate Women Prof Vet Med Men Prof Vet Med Women Total University , ,100 Enrollment Data June,
34 Office of Budgets and Institutional Research Full/Part-Time Status by College & Gender Full-Time Part-Time Total Men Women Total Men Women Total Men Women Total Undergraduate Agricultural Sciences Applied Human Sciences ,067 Business Engineering Intra-University Liberal Arts ,124 Natural Resources Natural Sciences Veterinary Medicine and Biom Total Undergraduates ,040 1,982 2,211 4,193 2,430 2,803 5,233 Graduate Agricultural Sciences Applied Human Sciences Business Engineering Intra-University Liberal Arts Natural Resources Natural Sciences Veterinary Medicine and Biom Total Graduates Professional Veterinary Medicine Veterinary Medicine and Biom Total Graduates Total University Agricultural Sciences Applied Human Sciences , ,342 Business Engineering Intra-University Liberal Arts ,169 Natural Resources Natural Sciences Veterinary Medicine and Biom Total University ,250 2,269 2,581 4,850 2,770 3,330 6,100 Full-time students = undergraduates enrolled for 12 or more credits Fall, Spring ( 9 - Summer ), graduates enrolled for 9 or more credits, all professional veterinary students Enrollment Data June,
35 Nonresidents by State State Undergraduate Graduate Prof Vet Med University Alabama Alaska American Samoa Arizona Arkansas California Colorado Connecticut District of Columbia Florida Georgia Hawaii Idaho Illinois Indiana Iowa Kansas Kentucky Louisiana Maine Maryland Massachusetts Michigan Minnesota Missouri Montana Nebraska Nevada New Hampshire New Jersey New Mexico New York North Carolina North Dakota Northern Mariana Islands Ohio Oklahoma Oregon Pennsylvania Puerto Rico Rhode Island South Carolina South Dakota Tennessee Texas Unknown State Utah Vermont Virginia Washington Wisconsin Wyoming Total ,024 Enrollment Data June,
36 International Students by Country Country Undergraduate Graduate Prof Vet Med University Bangladesh Belize Botswana Brazil Canada China, Peoples Republic of Costa Rica Ecuador Egypt Finland France Germany India Ivory Coast Japan Jordan Kenya Korea-South Kuwait Malawi Malaysia Mexico Norway Peru Russia Saudi Arabia South Africa Sri Lanka Sweden Switzerland Syria Taiwan, Republic of China Thailand Turkey Ukraine United Arab Emirates United Kingdom Vietnam Zimbabwe Unknown Total Enrollment Data June,
Budgets and nstitutional Analysis. Enrollment Data. Fall 1999
 I Budgets and nstitutional Analysis Enrollment Data Fall 1999 Table of Contents Fall Semester 1999 University Enrollment Five-Year Enrollment History Residency... 3 Minority/Other Students... 4 Application
Budgets and nstitutional Analysis. Enrollment Data. Summer 2003
 I Budgets and nstitutional Analysis Enrollment Data Summer 2003 Table of Contents Summer 2003 University Enrollment... 1 Five-Year Enrollment History Residency... 3 Minority/Other Students... 4 Application
Three-Year Moving Averages by States % Home Internet Access
 Three-Year Moving Averages by States % Home Internet Access Alabama Alaska Arizona Arkansas California Colorado Connecticut Delaware Florida Georgia Hawaii Idaho Illinois Indiana Iowa Kansas Kentucky Louisiana
Public School Teacher Experience Distribution. Public School Teacher Experience Distribution
 Public School Teacher Experience Distribution Lower Quartile Median Upper Quartile Mode Alabama Percent of Teachers FY Public School Teacher Experience Distribution Lower Quartile Median Upper Quartile
Licensure Resources by State
 Licensure Resources by State Alabama Alabama State Board of Social Work Examiners http://socialwork.alabama.gov/ Alaska Alaska Board of Social Work Examiners http://commerce.state.ak.us/dnn/cbpl/professionallicensing/socialworkexaminers.as
2008 WITTENBERG UNIVERSITY FACT BOOK
 2008 WITTENBERG UNIVERSITY FACT BOOK 11/13/2008 Updated 02.17.09 2008 WITTENBERG UNIVERSITY FACT BOOK APPLICANT INFORMATION 2008 2007 2006 2005 Male Female Male Female Male Female Male Female Number of
NON-RESIDENT INDEPENDENT, PUBLIC, AND COMPANY ADJUSTER LICENSING CHECKLIST
 NON-RESIDENT INDEPENDENT, PUBLIC, AND COMPANY ADJUSTER LICENSING CHECKLIST ** Utilize this list to determine whether or not a non-resident applicant may waive the Oklahoma examination or become licensed
Chex Systems, Inc. does not currently charge a fee to place, lift or remove a freeze; however, we reserve the right to apply the following fees:
 Chex Systems, Inc. does not currently charge a fee to place, lift or remove a freeze; however, we reserve the right to apply the following fees: Security Freeze Table AA, AP and AE Military addresses*
Impacts of Sequestration on the States
 Impacts of Sequestration on the States Alabama Alabama will lose about $230,000 in Justice Assistance Grants that support law STOP Violence Against Women Program: Alabama could lose up to $102,000 in funds
Englishinusa.com Positions in MSN under different search terms.
 Englishinusa.com Positions in MSN under different search terms. Search Term Position 1 Accent Reduction Programs in USA 1 2 American English for Business Students 1 3 American English for Graduate Students
State Pest Control/Pesticide Application Laws & Regulations. As Compiled by NPMA, as of December 2011
 State Pest Control/Pesticide Application Laws & As Compiled by NPMA, as of December 2011 Alabama http://alabamaadministrativecode.state.al.us/docs/agr/mcword10agr9.pdf Alabama Pest Control Alaska http://dec.alaska.gov/commish/regulations/pdfs/18%20aac%2090.pdf
Workers Compensation State Guidelines & Availability
 ALABAMA Alabama State Specific Release Form Control\Release Forms_pdf\Alabama 1-2 Weeks ALASKA ARIZONA Arizona State Specific Release Form Control\Release Forms_pdf\Arizona 7-8 Weeks by mail By Mail ARKANSAS
MAINE (Augusta) Maryland (Annapolis) MICHIGAN (Lansing) MINNESOTA (St. Paul) MISSISSIPPI (Jackson) MISSOURI (Jefferson City) MONTANA (Helena)
 Maryland (Annapolis) MICHIGAN (Lansing) MINNESOTA (St. Paul) MISSISSIPPI (Jackson) MISSOURI (Jefferson City) MONTANA (Helena)") HAWAII () IDAHO () Illinois () MAINE () Maryland () MASSACHUSETTS () NEBRASKA () NEVADA (Carson ) NEW HAMPSHIRE () OHIO () OKLAHOMA ( ) OREGON () TEXAS () UTAH ( ) VERMONT () ALABAMA () COLORADO () INDIANA
HAWAII () IDAHO () Illinois () MAINE () Maryland () MASSACHUSETTS () NEBRASKA () NEVADA (Carson ) NEW HAMPSHIRE () OHIO () OKLAHOMA ( ) OREGON () TEXAS () UTAH ( ) VERMONT () ALABAMA () COLORADO () INDIANA
VANDERBILT UNIVERSITY ENROLLMENT BY SCHOOL* FALL SEMESTER 2000
 VANDERBILT UNIVERSITY ENROLLMENT BY SCHOOL* LAST YEAR COLLEGE OF ARTS & SCIENCE 1,526 1,914 3,440 3,339 Exchange/Overseas Programs 30 45 75 85 Transients from Germany 0 5 5 2 BLAIR SCHOOL OF MUSIC 70 105
Real Progress in Food Code Adoption
 Real Progress in Food Code Adoption The Association of Food and Drug Officials (AFDO), under contract to the Food and Drug Administration, is gathering data on the progress of FDA Food Code adoptions by
Fall Enrollment Report AY0809
 Fall Enrollment Report AY89 Gallaudet University Office of Institutional Research September, 28 - - Chart Student Body Profiles Table of Contents 1 Freshman applications, admissions, and enrollments 3
Data show key role for community colleges in 4-year
 Page 1 of 7 (https://www.insidehighered.com) Data show key role for community colleges in 4-year degree production Submitted by Doug Lederman on September 10, 2012-3:00am The notion that community colleges
Types of Student Credit Hours
 CENSUS DAY ENROLLMENT STATISTICS SPRING 2011 (201101) This publication represents enrollments as of January 27, 2011 Source: 201101 enrollment extract (201101cens.xls) XAVIER UNIVERSITY OFFICE OF STRATEGIC
Rollins College. Fact Book 2005-2006 Contents. Degrees Awarded 2 Undergraduate Degrees Awarded by Major 3
 Rollins College Fact Book 2005-2006 Contents Mission Statement 1 Degrees Awarded 2 Undergraduate Degrees Awarded by Major 3 Enrollment Program Level and Campus 4-5 Gender 6 Racial/Ethnic Group 7-10 International
Census Data on Uninsured Women and Children September 2009
 March of Dimes Foundation Office of Government Affairs 1146 19 th Street, NW, 6 th Floor Washington, DC 20036 Telephone (202) 659-1800 Fax (202) 296-2964 marchofdimes.com nacersano.org Census Data on Uninsured
2014-2015 Program Director Survey: Traditional Program
 Semester Quarter Number 1 2 3 4 5 6 7 8 9 10 11 12 13 14 15 29 2014-2015 Program Director Survey: Traditional Program What type of calendar system is your program on? Sequences Sequential Terms Two 8-week
Number of Students graduated
 Graduation Summary 2006-2007 Office of Institutional Research No. 19, October 2007 http://oregonstate.edu/admin/aa/ir/graduationsum.html This annual Graduation Summary provides statistical information
American C.E. Requirements
 American C.E. Requirements Alaska Board of Nursing Two of the following: 30 contact hours 30 hours of professional nursing activities 320 hours of nursing employment Arizona State Board of Nursing Arkansas
State Tax Information
 State Tax Information The information contained in this document is not intended or written as specific legal or tax advice and may not be relied on for purposes of avoiding any state tax penalties. Neither
State-Specific Annuity Suitability Requirements
 Alabama Alaska Arizona Arkansas California Colorado Connecticut Delaware District of Columbia Effective 10/16/11: Producers holding a life line of authority on or before 10/16/11 who sell or wish to sell
High Risk Health Pools and Plans by State
 High Risk Health Pools and Plans by State State Program Contact Alabama Alabama Health 1-866-833-3375 Insurance Plan 1-334-263-8311 http://www.alseib.org/healthinsurance/ahip/ Alaska Alaska Comprehensive
Impact of the House Full-Year Continuing Resolution for FY 2011 (H.R. 1)
") U.S. DEPARTMENT OF EDUCATION DISCRETIONARY PROGRAMS Impact of the House Full-Year Continuing Resolution for (H.R. 1) Students Impacted* Job Losses Elementary & Secondary Education Programs Grants to Local
U.S. DEPARTMENT OF EDUCATION DISCRETIONARY PROGRAMS Impact of the House Full-Year Continuing Resolution for (H.R. 1) Students Impacted* Job Losses Elementary & Secondary Education Programs Grants to Local
National Center for Education Statistics
 National Center for Education Statistics IPEDS Data Center University of Florida UnitID 134130 OPEID 00153500 Address, Gainesville, FL, 32611 Web Address www.ufl.edu/ Institution: University of Florida
Institution: University of Connecticut (129020) Part C Selection
 Part C Selection") Fall Enrollment 2013-14 Overview Fall Enrollment Overview The Fall Enrollment component collects student enrollment counts by level of student, enrollment status, gender and race/ethnicity. In addition,
Fall Enrollment 2013-14 Overview Fall Enrollment Overview The Fall Enrollment component collects student enrollment counts by level of student, enrollment status, gender and race/ethnicity. In addition,
Rollins College. Fact Book 2004-2005 Contents. Mission Statement 1 Organizational Chart 2 Degrees Awarded 3 Undergraduate Degrees Awarded by Major 4
 Rollins College Fact Book 2004-2005 Contents Mission Statement 1 Organizational Chart 2 Degrees Awarded 3 Undergraduate Degrees Awarded by Major 4 Enrollment Program Level and Campus 5-6 Gender 7 Racial/Ethnic
Net-Temps Job Distribution Network
 Net-Temps Job Distribution Network The Net-Temps Job Distribution Network is a group of 25,000 employment-related websites with a local, regional, national, industry and niche focus. Net-Temps customers'
A/B MAC Jurisdiction 1 Original Medicare Claims Processor
 A/B MAC Jurisdiction 1 Jurisdiction 1 - American Samoa, California, Guam, Hawaii, Nevada and Northern Mariana Islands Total Number of Fee-For-Service Beneficiaries: 3,141,183 (as of Total Number of Beneficiaries
NOTICE OF PROTECTION PROVIDED BY [STATE] LIFE AND HEALTH INSURANCE GUARANTY ASSOCIATION
![NOTICE OF PROTECTION PROVIDED BY [STATE] LIFE AND HEALTH INSURANCE GUARANTY ASSOCIATION](/thumbs/25/5402451.jpg "NOTICE OF PROTECTION PROVIDED BY [STATE] LIFE AND HEALTH INSURANCE GUARANTY ASSOCIATION") NOTICE OF PROTECTION PROVIDED BY This notice provides a brief summary of the [STATE] Life and Health Insurance Guaranty Association (the Association) and the protection it provides for policyholders. This
NOTICE OF PROTECTION PROVIDED BY This notice provides a brief summary of the [STATE] Life and Health Insurance Guaranty Association (the Association) and the protection it provides for policyholders. This
BUSINESS DEVELOPMENT OUTCOMES
 BUSINESS DEVELOPMENT OUTCOMES Small Business Ownership Description Total number of employer firms and self-employment in the state per 100 people in the labor force, 2003. Explanation Business ownership
2. Did you transfer to FIU from another college/institution? 3. If you are a transfer student, please select one
 Spring 0 Destination Survey. Degree Received My Report Last Modified: 0//0 Fall 0 % Spring 0,9 9% Summer 0 % Total, 00%. Did you transfer to FIU from another college/institution? Yes, % No,0 % Total, 00%.
NAIC ANNUITY TRAINING Regulations By State
 Select a state below to display the current regulation and requirements, or continue to scroll down. Light grey text signifies states that have not adopted an annuity training program. Alabama Illinois
2013-2014 Professional Furthering Education Report Bachelor/Master/Doctoral Degrees. Page 1/10
 Page 1/10 College/Grad School Bachelor COLLEGE OF AGRICULTURE Colorado State University Grad School Animal Science Agricultural Agronomy Animal Science Food Science Grain Science Plant Pathology Public
VANDERBILT UNIVERSITY ENROLLMENT BY SCHOOL* FALL SEMESTER 2008 MEN WOMEN TOTAL LAST YEAR
 VANDERBILT UNIVERSITY ENROLLMENT BY SCHOOL* LAST YEAR COLLEGE OF ARTS & SCIENCE 1,840 1,977 3,817 3,713 Exchange/Overseas Programs 58 101 159 121 Transient Students 3 7 10 9 BLAIR SCHOOL OF MUSIC 96 107
Real Progress in Food Code Adoption
 Real Progress in Food Code Adoption August 27, 2013 The Association of Food and Drug Officials (AFDO), under contract to the Food and Drug Administration, is gathering data on the progress of FDA Food
CENSUS DAY ENROLLMENT STATISTICS. Summer 2014 (201405)
") CENSUS DAY ENROLLMENT STATISTICS (201405) This publication represents enrollments as of August 14, 2014 Source: 201405 Enrollment Extract XAVIER UNIVERSITY OFFICE OF INSTITUTIONAL RESEARCH Students % Credit
CENSUS DAY ENROLLMENT STATISTICS (201405) This publication represents enrollments as of August 14, 2014 Source: 201405 Enrollment Extract XAVIER UNIVERSITY OFFICE OF INSTITUTIONAL RESEARCH Students % Credit
National Center for Education Statistics
 National Center for Education Statistics IPEDS Data Center University of Florida UnitID 134130 OPEID 00153500 Address, Gainesville, FL, 32611 Web Address www.ufl.edu/ Fall Enrollment 2013 Part C Selection
STATE-SPECIFIC ANNUITY SUITABILITY REQUIREMENTS
 Alabama Alaska Arizona Arkansas California This jurisdiction has pending annuity training legislation/regulation Annuity Training Requirement Currently Effective Initial 8-Hour Annuity Training Requirement:
Findings from the 2014 CGS International Graduate Admissions Survey Phase III: Final Offers of Admission and Enrollment
 Findings from the 2014 CGS International Graduate Admissions Survey Phase III: Final and Enrollment Jeff Allum Director, Research and Policy Analysis Council of Graduate Schools November 2014 Overview
State Tax Information
 State Tax Information The information contained in this document is not intended or written as specific legal or tax advice and may not be relied on for purposes of avoiding any state tax penalties. Neither
Georgia College & State University Department of Chemistry, Physics and Astronomy Example of a thriving Physics Program Ken McGill
 Georgia College & State University Department of Chemistry, Physics and Astronomy Example of a thriving Physics Program Ken McGill Georgia College & State University is Georgia's designated public liberal
14-Sep-15 State and Local Tax Deduction by State, Tax Year 2013
 14-Sep-15 State and Local Tax Deduction by State, Tax Year 2013 (millions) deduction in state dollars) claimed (dollars) taxes paid [1] state AGI United States 44.2 100.0 30.2 507.7 100.0 11,483 100.0
IRS Request for Assistance re New EIN and True Owner. Question by: Sarah Steinbeck on behalf of Leslie Reynolds. Date: 5 August 2010
 Topic: IRS Request for Assistance re New EIN and True Owner Question by: Sarah Steinbeck on behalf of Leslie Reynolds Jurisdiction: Colorado/NASS Date: 5 August 2010 Jurisdiction Question(s) Have you spoken
The Obama Administration and Community Health Centers
 The Obama Administration and Community Health Centers Community health centers are a critical source of health care for millions of Americans particularly those in underserved communities. Thanks primarily
CENSUS DAY ENROLLMENT STATISTICS. Summer 2015 (201505)
") CENSUS DAY ENROLLMENT STATISTICS (201505) This publication represents enrollments as of August 14, 2015 Source: 201505 Enrollment Extract XAVIER UNIVERSITY OFFICE OF INSTITUTIONAL RESEARCH Students % Credit
CENSUS DAY ENROLLMENT STATISTICS (201505) This publication represents enrollments as of August 14, 2015 Source: 201505 Enrollment Extract XAVIER UNIVERSITY OFFICE OF INSTITUTIONAL RESEARCH Students % Credit
Recruitment and Retention Resources By State List
 Recruitment and Retention Resources By State List Alabama $5,000 rural physician tax credit o http://codes.lp.findlaw.com/alcode/40/18/4a/40-18-132 o http://adph.org/ruralhealth/index.asp?id=882 Area Health
Highlights and Trends: ASHA Counts for Year End 2009
 Highlights and Trends: ASHA Counts for Year End 2009 Constituents -- How many are there? How have the numbers changed? v ASHA currently represents 140,039 speech-language pathologists, audiologists, and
Acceptable Certificates from States other than New York
 Alabama 2 2 Professional Educator Certificate 5 Years Teacher Yes Professional Educator Certificate 5 Years Support Services Yes Alaska 2 Regular Certificate, Type A 5 Years, renewable Teacher Yes At least
TOTAL AWARD AMOUNT $119,067,687 1. State and Territory Base Awards for Policy and Environmental Change $44,602,383
 American Recovery and Reinvestment Act Prevention and Wellness Initiative Final s for State and Territory Component Friday February 5, 2010 TOTAL AWARD AMOUNT $119,067,687 1. State and Territory Base Awards
Schedule B DS1 & DS3 Service
 Schedule B DS1 & DS3 Service SCHEDULE B Private Line Data Services DS1 & DS3 Service... 2 DS-1 Local Access Channel... 2 DS-1 Local Access Channel, New Jersey... 2 DS-1 Local Access Channel, Out-of-State...
DIV. OF UNCLASSIFIED STUDIES 16 14 30 23
 VANDERBILT UNIVERSITY ENROLLMENT BY SCHOOL* LAST YEAR COLLEGE OF ARTS & SCIENCE 1,651 1,817 3,468 3,518 Exchange/Overseas Programs 26 78 104 103 Transient Students 4 4 8 3 BLAIR SCHOOL OF MUSIC 87 101
(In effect as of January 1, 2004*) TABLE 5a. MEDICAL BENEFITS PROVIDED BY WORKERS' COMPENSATION STATUTES FECA LHWCA
 TABLE 5a. MEDICAL BENEFITS PROVIDED BY WORKERS' COMPENSATION STATUTES FECA LHWCA") (In effect as of January 1, 2004*) TABLE 5a. MEDICAL BENEFITS PROVIDED BY WORKERS' COMPENSATION STATUTES Full Medical Benefits** Alabama Indiana Nebraska South Carolina Alaska Iowa Nevada South Dakota
(In effect as of January 1, 2004*) TABLE 5a. MEDICAL BENEFITS PROVIDED BY WORKERS' COMPENSATION STATUTES Full Medical Benefits** Alabama Indiana Nebraska South Carolina Alaska Iowa Nevada South Dakota
Forestry Reading Room
 University of Arkansas School of Law Division of Agriculture www.nationalaglawcenter.com Forestry Reading Room Compilation of State Forestry Organizations Rusty W. Rumley Staff Attorney and Nastasya Knyazhishcheva
********************
 THE SURETY & FIDELITY ASSOCIATION OF AMERICA 1101 Connecticut Avenue, N.W., Suite 800 Washington, D. C. 20036 Phone: (202) 463-0600 Fax: (202) 463-0606 Web page: www.surety.org APPLICATION Application
State Specific Annuity Suitability Requirements updated 10/10/11
 Alabama Alaska Ai Arizona Arkansas California This jurisdiction has pending annuity training legislation/regulation Initial 8 Hour Annuity Training Requirement: Prior to selling annuities in California,
Question for the filing office of Texas, Re: the Texas LLC act. Professor Daniel S. Kleinberger. William Mitchell College of Law, Minnesota
 Topic: Question by: : Question for the filing office of Texas, Re: the Texas LLC act Professor Daniel S. Kleinberger William Mitchell College of Law, Minnesota Date: March 18, 2012 Manitoba Corporations
Attachment A. Program approval is aligned to NCATE and is outcomes/performance based
 Attachment A The following table provides information on student teaching requirements across several states. There are several models for these requirements; minimum number of weeks, number of required
Exploring the Impact of the RAC Program on Hospitals Nationwide
 Exploring the Impact of the RAC Program on Hospitals Nationwide Overview of AHA RACTrac Survey Results, 4 th Quarter 2010 For complete report go to: http://www.aha.org/aha/issues/rac/ractrac.html Agenda
What to Know About State CPA Reciprocity Rules. John Gillett, PhD, CPA Chair, Department of Accounting Bradley University, Peoria, IL
 What to Know About State CPA Reciprocity Rules Paul Swanson, MBA, CPA Instructor of Accounting John Gillett, PhD, CPA Chair, Department of Accounting Kevin Berry, PhD, Assistant Professor of Accounting
Nurse Aide Training Requirements, 2011
 Nurse Aide Training Requirements, 2011 Background Federal legislation (Omnibus Budget Reconciliation Act of 1987) and associated regulations (42 CFR 483.152) require that Medicare- and Medicaid-certified
In-state Tuition & Fees at Flagship Universities by State 2014-15 Rank School State In-state Tuition & Fees Penn State University Park Pennsylvania 1
 In-state Tuition & Fees at Flagship Universities by State 2014-15 Rank School State In-state Tuition & Fees Penn State University Park Pennsylvania 1 $18,464 New New Hampshire 2 Hampshire $16,552 3 Vermont
Overview of School Choice Policies
 Overview of School Choice Policies Tonette Salazar, Director of State Relations Micah Wixom, Policy Analyst CSG West Education Committee July 29, 2015 Who we are The essential, indispensable member of
STATE DATA CENTER. District of Columbia MONTHLY BRIEF
 District of Columbia STATE DATA CENTER MONTHLY BRIEF N o v e m b e r 2 0 1 2 District Residents Health Insurance Coverage 2000-2010 By Minwuyelet Azimeraw Joy Phillips, Ph.D. This report is based on data
IMMIGRANTS IN WASHINGTON STATE
 IMMIGRANTS IN WASHINGTON STATE MARK ELLIS PROFESSOR OF GEOGRAPHY AND CENTER FOR STUDIES IN DEMOGRAPHY AND ECOLOGY UNIVERSITY OF WASHINGTON QUESTIONS: ELLISM@U.WASHINGTON.EDU TABLES AND CHARTS AVAILABLE
Population, by Race and Ethnicity: 2000 and 2010
 Table 1 Population, by Race and Ethnicity: 2000 and 2010 Universe: 2000 and 2010 resident population 2010 population 2000 population Percent, 2010 Percent, 2000 Hispanic 50,729,570 35,204,480 16.4 12.5
Methodology for 2013 Application Trends Survey
 Methodology for 2013 Application Trends Survey F rom early June to mid-july 2013, the Graduate Management Admission Council (GMAC ) conducted the Application Trends Survey, its annual survey of business
2014 INCOME EARNED BY STATE INFORMATION
 BY STATE INFORMATION This information is being provided to assist in your 2014 tax preparations. The information is also mailed to applicable Columbia fund non-corporate shareholders with their year-end
Degrees Offered with Enrollment and Degrees Awarded - 2012-13 All plans, programs, and degrees 2012-13
 Offered with and - 2012-13 All plans, programs, and degrees 2012-13 2012-13 AAS Agribusiness Management Associate of Applied Science 20 166 64 AAS Field Crops Technology Associate of Applied Science 9
Broadband Availability in America. With Rural Americans Looking for High-Speed Services, Adequate Broadband Speeds Remain Out of Reach for Many
 Broadband Availability in America With Rural Americans Looking for High-Speed Services, Adequate Broadband Speeds Remain Out of Reach for Many Federal Communications Commission January 30, 2015 High-speed
CLASS OF 2014 FIRST DESTINATION REPORT UNION COLLEGE SCHENECTADY, NEW YORK
 CLASS OF 2014 FIRST DESTINATION REPORT UNION COLLEGE SCHENECTADY, NEW YORK Methodology For the purposes of this survey, we define the Class of 2014 as those students who completed an undergraduate degree
Population, by Race and Ethnicity: 2000 and 2011
 Table 1 Population, by Race and Ethnicity: 2000 and 2011 Universe: 2000 and 2011 resident population 2011 population 2000 population Percent, 2011 Percent, 2000 Hispanic 51,927,158 35,204,480 16.7 12.5
GOVERNMENT-FINANCED EMPLOYMENT AND THE REAL PRIVATE SECTOR IN THE 50 STATES
 GOVERNMENT-FINANCED EMPLOYMENT AND THE REAL PRIVATE SECTOR IN THE 50 STATES BY KEITH HALL AND ROBERT GREENE November 25, 2013 www.mercatus.org 0.7 2.4 4.2 FEDERAL CONTRACT FUNDED PRIVATE-SECTOR JOBS AS
FOREIGN LANGUAGE ENROLLMENTS IN K-12 PUBLIC SCHOOLS: Are Students Prepared for a Global Society?
 FOREIGN LANGUAGE ENROLLMENTS IN K-12 PUBLIC SCHOOLS: Are Students Prepared for a Global Society? Executive Summary Since 1968, the American Council on the Teaching of Foreign Languages (ACTFL) has conducted
MainStay Funds Income Tax Information Notice
 The information contained in this brochure is being furnished to shareholders of the MainStay Funds for informational purposes only. Please consult your own tax advisor, who will be most familiar with
Model Regulation Service July 2005 LIFE INSURANCE MULTIPLE POLICY MODEL REGULATION
 Table of Contents Section 1. Section 2. Section 3. Section 4. Section 5. Section 6. Section 1. Model Regulation Service July 2005 Purpose Authority Exemptions Duties of Insurers Severability Effective
State by State Summary of Nurses Allowed to Perform Conservative Sharp Debridement
 State by State Summary of Nurses Allowed to Perform Conservative Sharp Debridement THE FOLLOWING ARE ONLY GENERAL SUMMARIES OF THE PRACTICE ACTS EACH STATE HAS REGARDING CONSERVATIVE SHARP DEBRIDEMENT
recovery: Projections of Jobs and Education Requirements Through 2020 June 2013
 recovery: Projections of Jobs and Requirements Through June 2013 Projections of Jobs and Requirements Through This report projects education requirements linked to forecasted job growth by state and the
SECTION 109 HOST STATE LOAN-TO-DEPOSIT RATIOS. or branches outside of its home state primarily for the purpose of deposit production.
 SECTION 109 HOST STATE LOAN-TO-DEPOSIT RATIOS The Board of Governors of the Federal Reserve System, the Federal Deposit Insurance Corporation, and the Office of the Comptroller of the Currency (the agencies)
UNDERGRADUATE HEADCOUNT ENROLLMENT FALL SEMESTER 2001 GRADUATE HEADCOUNT ENROLLMENT FALL SEMESTER 2001 TOTAL HEADCOUNT ENROLLMENT FALL SEMESTER 2001
 UNDERGRADUATE HEADCOUNT ENROLLMENT FALL SEMESTER 2001 Freshmen Other Freshmen Sophomores Juniors Seniors Unclassified First- Time Transfer Total Full-time 615 193 611 584 906 126 114 3149 Part-time 0 24
State Agency Name Link to and/or Information about Complaint Process
 Alabama Alabama Alabama Commission on Higher - Office of Institutional Effectiveness and Planning Alabama Department of Postsecondary - Office of Private School Licensing Division Complaints for out of
College Completion in Connecticut: The Impact on the Workforce and the Economy
 College Completion in : The Impact on the Workforce and the Economy February 2012 Investing in Individuals and Society through College Completion 30 25 20 15 10 5 0 Higher Levels of Education and Skills
Model Regulation Service January 2006 DISCLOSURE FOR SMALL FACE AMOUNT LIFE INSURANCE POLICIES MODEL ACT
 Table of Contents Section 1. Section 2. Section 3. Section 4. Section 5. Section 6. Section 1. Model Regulation Service January 2006 Purpose Definition Exemptions Disclosure Requirements Insurer Duties
Please contact test@test.com if you have any questions regarding this survey.
 1. Which of the following best describes your position within the company? - CEO/owner - Partner/senior executive - Professional (consultant, legal, medical, architect) - Finance/accounting/purchasing
$7.5 appropriation $6.5 2011 2012 2013 2014 2015 2016. Preschool Development Grants
 School Readiness: High-Quality Early Learning Head Start $10.5 $9.5 $10.1 +$1.5 +17.7% $8.5 $7.5 +$2.1 +27.0% $6.5 for fiscal year 2010 Included in the budget is $1.078 billion to ensure that every Head
Nurse Aide Training Requirements, October 2014
 Nurse Aide Training Requirements, October 2014 Background Federal legislation (Omnibus Budget Reconciliation Act of 1987) and associated regulations (42 CFR 483.152) require that Medicare- and Medicaid-certified
STATISTICAL BRIEF #273
 STATISTICAL BRIEF #273 December 29 Employer-Sponsored Health Insurance for Employees of State and Local Governments, by Census Division, 28 Beth Levin Crimmel, M.S. Introduction Employees of state and
ADDENDUM TO THE HEALTH INSURANCE MARKETPLACE SUMMARY ENROLLMENT REPORT FOR THE INITIAL ANNUAL OPEN ENROLLMENT PERIOD
 ASPE Issue BRIEF ADDENDUM TO THE HEALTH INSURANCE MARKETPLACE SUMMARY ENROLLMENT REPORT FOR THE INITIAL ANNUAL OPEN ENROLLMENT PERIOD For the period: October 1, 2013 March 31, 2014 (Including Additional
Current State Regulations
 Current State Regulations Alabama: Enacted in 1996, the state of Alabama requires all licensed massage therapists to * A minimum of 650 classroom hours at an accredited school approved by the state of
We do require the name and mailing address of each person forming the LLC.
 Topic: LLC Managers/Members Question by: Jeff Harvey : Idaho Date: March 7, 2012 Manitoba Corporations Canada Alabama Alaska Arizona Arkansas California Colorado Arizona requires that member-managed LLCs
Healthcare. State Report. Anthony P. Carnevale Nicole Smith Artem Gulish Bennett H. Beach. June 2012
 Healthcare State Report June 2012 Anthony P. Carnevale Nicole Smith Artem Gulish Bennett H. Beach B Table of Contents Healthcare: State Level Analysis... 3 Alabama... 12 Alaska... 14 Arizona... 16 Arkansas...
Full Medical Benefits**
 (In effect as of January 1, 2006*) TABLE 5a. MEDICAL BENEFITS PROVIDED BY WORKERS' COMPENSATION STATUTES Full Medical Benefits** Alabama Indiana Nebraska South Carolina Alaska Iowa Nevada South Dakota
In 2013, 75.9 million workers age 16 and older in the. Characteristics of Minimum Wage Workers, 2013. Highlights CONTENTS
 U.S. BUREAU OF LABOR STATISTICS M A R C H 2 0 1 4 R E P O R T 1 0 4 8 Characteristics of Minimum Wage Workers, 2013 below the figure of 13.4 percent in 1979, when data were first collected on a regular
SECTION 109 HOST STATE LOAN-TO-DEPOSIT RATIOS. The Board of Governors of the Federal Reserve System (Board), the Federal Deposit
, the Federal Deposit") SECTION 109 HOST STATE LOAN-TO-DEPOSIT RATIOS The Board of Governors of the Federal Reserve System (Board), the Federal Deposit Insurance Corporation (FDIC), and the Office of the Comptroller of the Currency
SECTION 109 HOST STATE LOAN-TO-DEPOSIT RATIOS The Board of Governors of the Federal Reserve System (Board), the Federal Deposit Insurance Corporation (FDIC), and the Office of the Comptroller of the Currency
Low-Profit Limited Liability Company (L3C) Date: July 29, 2013. [Low-Profit Limited Liability Company (L3C)] [July 29, 2013]
![Low-Profit Limited Liability Company (L3C) Date: July 29, 2013. [Low-Profit Limited Liability Company (L3C)] [July 29, 2013]](/thumbs/27/11522934.jpg "Low-Profit Limited Liability Company (L3C) Date: July 29, 2013. [Low-Profit Limited Liability Company (L3C)] [July 29, 2013]") Topic: Question by: : Low-Profit Limited Liability Company (L3C) Kevin Rayburn, Esq., MBA Tennessee Date: July 29, 2013 Manitoba Corporations Canada Alabama Alaska Arizona Arkansas California Colorado
Topic: Question by: : Low-Profit Limited Liability Company (L3C) Kevin Rayburn, Esq., MBA Tennessee Date: July 29, 2013 Manitoba Corporations Canada Alabama Alaska Arizona Arkansas California Colorado
NAIC Annuity Suitability Requirements by State
 NAIC Annuity Suitability Requirements by Specific Alabama Alaska 10/16/2011 TBD Arizona Arkansas If you obtained a life insurance license prior to 10/16/11, you must complete the NAIC course by 4/16/12.