DISCUSSION PAPER. Do Market Shares or Technology Explain Rising New Vehicle Fuel Economy? S h e f a l i Kh a n n a a n d J o s h u a L i n n
|
|
|
- Norman Harmon
- 7 years ago
- Views:
Transcription
1 DISCUSSION PAPER September 2013 RFF DP Do Market Shares or Technology Explain Rising New Vehicle Fuel Economy? S h e f a l i Kh a n n a a n d J o s h u a L i n n 1616 P St. NW Washington, DC

2 Do Market Shares or Technology Explain Rising New Vehicle Fuel Economy? Shefali Khanna and Joshua Linn Abstract By decreasing gasoline consumption, greater fuel economy could significantly reduce environmental and energy security concerns. In this paper, we show that since the year 2000, technology and market shares have contributed roughly equally to rising new vehicle fuel economy in the United States. We discuss the implications of these patterns for the safety and welfare effects of fuel economy standards. Key Words: corporate average fuel economy standards, passenger vehicles, fuel savings, vehicle safety, greenhouse gas emissions rate standards JEL Classification Numbers: Q4, L Resources for the Future. All rights reserved. No portion of this paper may be reproduced without permission of the authors. Discussion papers are research materials circulated by their authors for purposes of information and discussion. They have not necessarily undergone formal peer review.

3 Contents 1. Introduction Possible Explanations for Rising Fuel Economy Data Methodology Technology versus Market Shares Comparing Actual Fuel Economy Changes with NHTSA Predictions Conclusions References... 16

4 Do Market Shares or Technology Explain Rising New Vehicle Fuel Economy? Shefali Khanna and Joshua Linn 1. Introduction In the United States, public concerns about climate change and energy security have varied over time, but lately average new vehicle fuel economy has been improving steadily. Between 2000 and 2012, sales-weighted fuel economy increased more than 4 miles per gallon (mpg), or about 19 percent. Current fuel economy standards require about a 50 percent additional increase by The increases represent a dramatic change from the preceding two decades, over which fuel economy steadily decreased, largely because of the rising market share of light trucks at the expense of cars. This paper considers whether market shares or technology explain the recent fuel economy increases. Did the increase in fuel economy since 2000 result from consumer decisions, such as purchasing smaller sports utility vehicles (SUVs) rather than larger ones, or from manufacturers use of technology to improve fuel economy? Market shares can explain the increase in aggregate fuel economy if the market shares of high fuel economy vehicles increased at the expense of the market shares of low fuel economy vehicles, with technology being held constant. Alternatively, manufacturers can alter the technology in two ways. For one, they can change a particular power train to increase fuel economy, such as replacing a five-speed with a six-speed transmission. They also can change which versions of particular models they offer in the market. For example, if a manufacturer sells a four-cylinder and six-cylinder version of a particular model, it could stop selling the six-cylinder version. Either would represent a change in the set of technologies offered to consumers. Distinguishing between the effects of technology and market shares is important for two reasons. First, if market shares explain the rising fuel economy, because vehicle weight and fuel Authors addresses: khanna@rff.org and linn@rff.org. We thank Wenfei Du and Thomas Klier for sharing the vehicle data with us and we thank Virginia McConnell for helpful comments on a previous draft. 1 The standards jointly regulate fuel economy and greenhouse gas emissions, but we refer to them as fuel economy standards for convenience. 1

5 economy are negatively correlated, the average weight of new vehicles could decrease. This would create a disparity between the weight of new vehicles sold in the early 2000s many of which were very large SUVs, such as the Ford Excursion and that of new vehicles sold in more recent years. Because weight disparity is an important determinant of the severity of multivehicle accidents, such a disparity could cause multivehicle accidents to be more harmful to drivers and passengers (National Research Council 2002; NHTSA 2003b). A decline in weight in recent years would support the arguments made by some opponents of higher fuel economy standards. 2 Second, distinguishing between market shares and technology can provide insights into the effects of fuel economy standards on consumer welfare. When estimating the costs and benefits of proposed fuel economy and greenhouse gas emissions rate standards, the responsible administrative agencies the National Highway Transportation and Safety Administration (NHTSA) and the Environmental Protection Agency (EPA) assume that the standards do not affect market shares. The agencies argue that it is therefore appropriate to compare the costs and benefits of increasing fuel economy for each vehicle without allowing for the possibility that consumers substitute among vehicles. Because fuel economy standards for light trucks have been tightening since 2005, examining the importance of changing market shares during that period provides some insight into whether tightening standards affect market shares and whether the EPA and NHTSA should include such welfare effects in their analysis. We show that technology and market shares each account for half of the 4 mpg increase in fuel economy between 2000 and The importance of market shares is consistent with the leveling off of vehicle weight in recent years (EPA 2013). Fuel economy has increased much more for cars (5 mpg) than for light trucks (3 mpg). Within the car and light truck categories, there is considerable heterogeneity in the rates and sources of the fuel economy improvements, with SUVs, vans, and medium-size cars having seen the greatest increases. Among light trucks, technology explains a much larger share of the overall increase than market shares, whereas for cars, technology and market shares have roughly equal importance. The timing of the fuel economy standards is roughly consistent with the rising importance of technology. As part of the retrospective analysis of the U.S. new vehicles market, we consider whether the light truck fuel economy changes are consistent with NHTSA s predictions for the 2 We thank Antonio Bento, Kenneth Gillingham, Kevin Roth, and Yiwei Wang for suggesting the importance of fuel economy standards and changes in vehicle weight. 2

6 light truck fuel economy standards that were implemented from 2005 to Prior to implementation, NHTSA predicted changes in fuel economy caused by the standards, given expected gasoline prices and other factors that could affect technology or market shares. Therefore, one might expect the NHTSA predictions to differ from what actually occurred; if there were large differences, it would be necessary to determine the underlying causes. We find that NHTSA predictions of manufacturer-level fuel economy increases are positively correlated with observed increases, but there are notable discrepancies. Returning to the questions motivating the analysis of technology and market shares, the results suggest that new vehicles sold in the last few years are no lighter than vehicles sold 5 or 10 years ago. This mitigates concerns about safety and increasing fuel economy standards. The relative importance of technology for light trucks starting in 2005 and for cars starting in 2009 is consistent with the EPA and NHTSA assumptions about market shares, although we do not test these assumptions formally. 2. Possible Explanations for Rising Fuel Economy Our aim is to understand the underlying sources of recent new vehicle fuel economy increases, but to provide some context for the following analysis we first briefly discuss three possible explanations for the increases: gasoline prices, rising new vehicle fuel economy standards, and the recession. The real gasoline price in 2012 was $2.30 per gallon higher than it was 10 years earlier. Recent research, such as Klier and Linn (2010) and Busse et al. (2013), suggests that average new vehicle fuel economy increases 1 mile per gallon when the price of gasoline rises by $1 per gallon. Higher gasoline prices may therefore explain a large share of the recent increase in average new vehicle fuel economy. Rising fuel economy standards also may have played a role. Following a pattern roughly similar to that of gasoline prices, fuel economy standards were constant from the mid-1980s until 2005 and then began increasing. Between 2005 and 2012, the standards for light trucks increased from 20.7 to 25.4 mpg. The standards for cars began increasing in The recession in the late 2000s is the final possible explanation for improving fuel economy. The recession have could contributed to rising fuel economy if the falling income and wealth caused consumers to purchase new vehicles with higher fuel economy more than they would have otherwise, either out of a desire to reduce fuel costs or because fuel-efficient vehicles tend to be less expensive than larger vehicles. 3

7 To be clear, the purpose of our paper is not to understand which explanation is correct. Rather, we want to understand how fuel economy has been changing, leaving for future research the question of why it has been changing. 3. Data The primary data include vehicle sales and fuel economy by model and model year from WardsAuto. A model year begins in September of the previous calendar year and ends in August of the current calendar year. The data were assembled using the same methodology as described in Klier and Linn (2010) and extended through the 2012 model year. We also obtained estimates of achievable fuel economy for model years and from NHTSA s Final Regulatory Impact Analyses (RIAs) of the light truck Corporate Average Fuel Economy (CAFE) standards. Before implementing the standards, the agency assessed manufacturers possible responses to higher CAFE standards. The assessment rests on the Volpe Analysis, a computer algorithm that takes cost and performance assumptions as inputs. The agency assumed that no changes in weight, performance, or product mix would be necessary to meet the proposed standards. It used market-level sales projections for and from the forecasts published by the Energy Information Administration (EIA) in its 2002 and 2005 Annual Energy Outlook. NHTSA assumed that each manufacturer s share of the light truck market would equal its share at the start of the period. To assess each manufacturer s responses to the standards, the Volpe Model considers the applicability of each technology to every model, engine, and transmission in a manufacturer s product line. Technologies are added based on cost effectiveness and the process terminates once each manufacturer meets the CAFE standards, when all available technologies have been exhausted, or when the costs of applying additional technology exceed the level of penalties charged for noncompliance. 3 We have obtained the model s predicted fuel economy by manufacturer and year, which is the sales-weighted harmonic average of the estimated fuel economy of each model sold by the manufacturer. For confidentiality reasons, NHTSA did not provide model-level predictions. 3 Cost effectiveness is defined as the cost per percentage point fuel economy improvement; the calculation of costs is slightly different between the NHTSA analysis of the and the standards. The model also includes some constraints on the order in which technologies can be added. 4

8 4. Methodology We take a straightforward approach to decompose overall changes in fuel economy into two components: technology and market shares. For a set of vehicles, J, the sales-weighted average fuel economy at time t of all vehicle models, j, in the set is wm jt jt, where wjt is the share of sales of model j in total sales of models in set J and m jt is the fuel economy of model j. In the following analysis the set J could include all vehicles in the market or it could include vehicles belonging to a particular market segment such as SUVs. The change in the sales-weighted fuel economy between two years, s and s ', is the sum of three terms: m w m w m w m s, s' js j; s, s' j; s, s' js j; s, s' j; s, s' j J j J j J where the first term on the right-hand side is the inner product of the market share in period s and the fuel economy change between the two periods (i.e., the sum of the product of initial fuel economy and the fuel economy change); the second term is the inner product of the change in the market share and the initial fuel economy; and the third term is the inner product of the change in market share and the change in fuel economy. The third term is the correlation between the change in market share and the change in fuel economy. For nearly all cases the vehicles and time periods we consider, the third term turns out to be close to zero. This gives rise to a simple interpretation of the first two terms. The first term represents the change in fuel economy accounted for by within-model fuel economy changes that is, the contribution of technology, holding fixed market shares at their initial levels. The second term is the contribution of changes in market shares to the overall change in fuel economy, holding fixed technology at its initial level. The larger the first term is compared with the second, the more technology explains the overall changes in fuel economy. j J 5. Technology versus Market Shares Figure 1 plots the change in average fuel economy since 2000 and the first two terms in equation (1). The sample includes all vehicles in the U.S. market. To compute the two terms in equation (1) and the average fuel economy change, we include vehicles sold in consecutive years. For example, to compute the first (i.e., technology) term for 2004, we use vehicles sold in 2003 and 2004, multiplying the 2003 market share by the change in fuel economy between 2003 and To compute the second (i.e., market share) term for 2004, we use the same vehicles and multiply the 2003 fuel economy by the change in market share between 2003 and

9 The figure plots the running sum of these calculations across years. To interpret the figure, suppose the total fuel economy change is positive over a particular time period. If the market share term is constant during this period and the technology term is rising, we conclude that technology explains the rising fuel economy. The figure shows that average fuel economy decreased slightly in the early 2000s, and that technology explains most of this decrease. Starting around 2005, technology and average fuel economy began increasing slowly. The rate of increase for both technology and average fuel economy accelerated around Market shares exhibit a somewhat different temporal pattern. Market shares explain increases in average fuel economy from about 2006 to 2009 but generally not in other years. Overall, market shares explain about half of the average fuel economy increase from 2000 to 2012, but the figure shows that the contributions of technology and market shares vary over time. Figure 1. Contribution of Within-Model Sales and Fuel Economy Changes to Total Fuel Economy Change, All Passenger Vehicles Notes: The figure plots the total change in fuel economy and the first two terms in equation (1) for the years 2000 to Within-model fuel economy change refers to the first term in equation (1), and the within-model sales change refers to the second term in the equation. The sample includes all vehicles in the U.S. market. For each year, the total change and the terms in equation (1) are computed using models with positive sales in the previous and current model years. 6

10 Figure 2 separates the market into two vehicle types: cars and light trucks. Average fuel economy for cars increased by about 5 mpg from 2000 to 2012, with most of the increase occurring after Market shares explain most of the initial increase, with technology s importance increasing at the end of the period. Klier and Linn (2010) show that gasoline prices explain much of the changing market shares prior to The standards for cars, which began increasing in 2011, were adopted in The timing of the changes in Figure 2 suggests that the standards could explain the importance of technology after 2008; although the fuel economy standards were not implemented until 2011, because of design lags the automakers may have begun designing vehicles to meet the standards ahead of time. Gas prices or the recession could also explain the importance of technology, and we leave for future research the question of which factors explain the contributions of technology from Figure 2. Fuel Economy Decomposition by Cars/Light Trucks 7

11 Note: The figure is constructed similarly to Figure 1, except that Panel A includes only cars and Panel B includes only light trucks. The patterns for light trucks are somewhat different than those for cars. Technology increased light truck fuel economy beginning in 2005, rather than around 2008 as for cars (although the difference is not very large). The earlier technology effect is consistent with the fact that the fuel economy standards for light trucks began increasing in 2005, whereas the standards for cars began increasing much later, in Light truck market shares and technology contributed about equally to the overall fuel economy increase. Figure 3 distinguishes seven market segments, as defined by Wards. The first three categories include cars, across which we observe some notable differences. Although technology raised fuel economy around the same time for all three car categories, the effect of technology was much greater for small and medium cars than for large and luxury cars. Market shares have had a much larger effect on fuel economy for medium cars than for the other categories. 8

12 Figure 3. Fuel Economy Decomposition by Market Segment 9

13 10
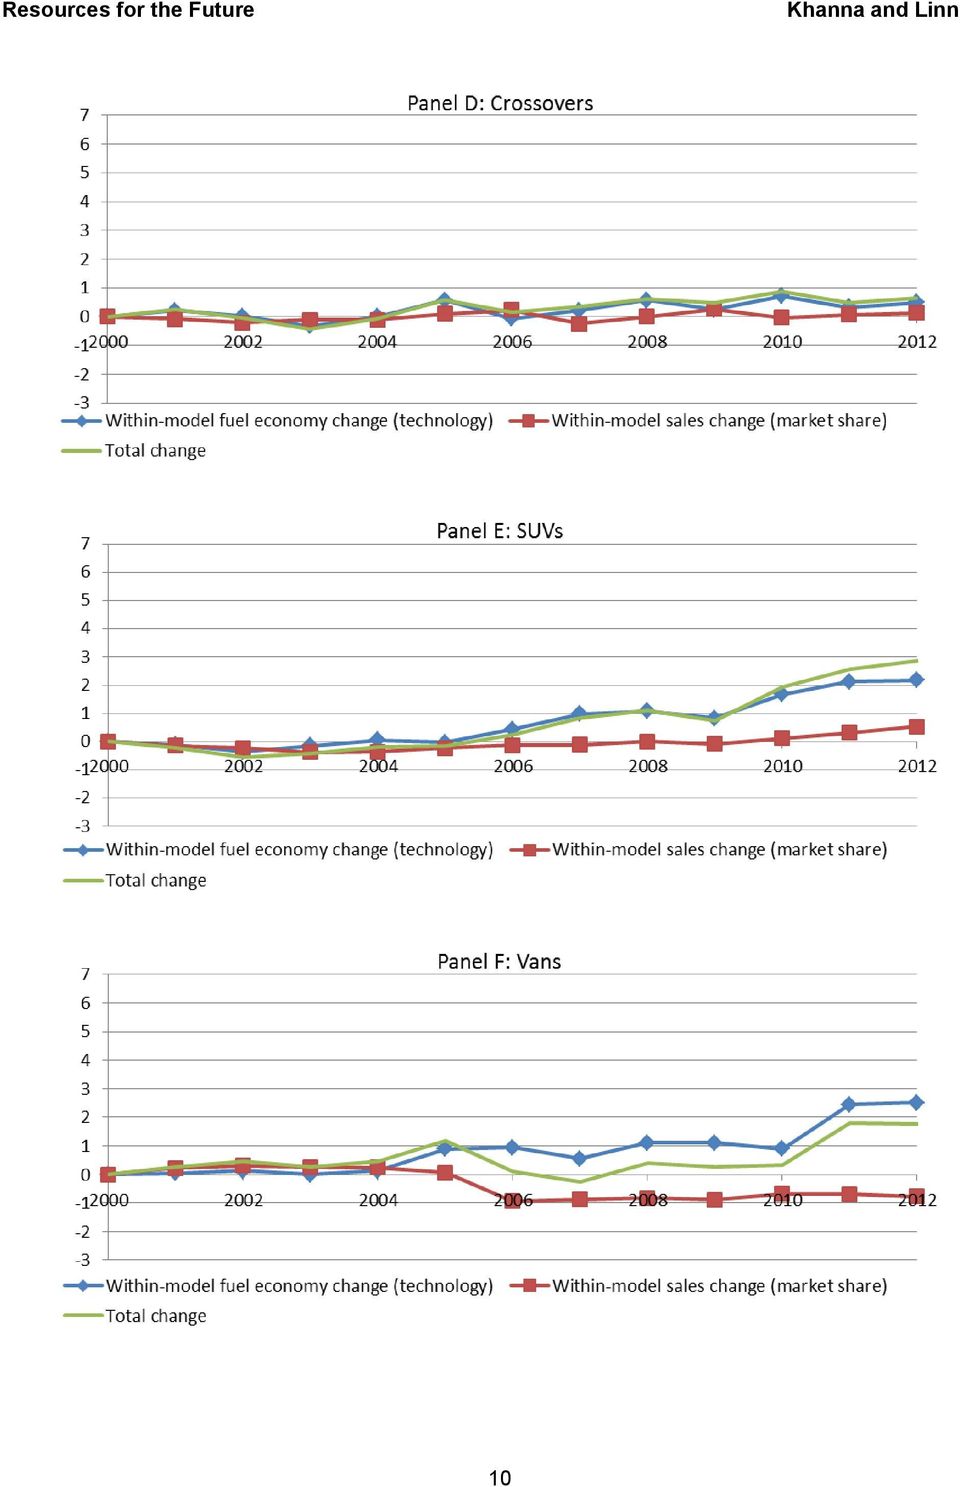
14 Note: The figure is constructed similarly to Figure 1, except that each panel includes models belonging to the indicated market segment. There is also substantial variation across the light truck segments. Fuel economy increased much more for SUVs and vans than for crossovers and pickup trucks. For the SUVs and vans, technology explains a much larger share of the overall increase than market shares. The relative importance of technology is consistent with the aggregate light truck results in Figure 2. Figures 1 3 suggest that market shares explain a significant fraction of the overall fuel economy increase. Because vehicles with high fuel economy tend to have lower weight, the changing market shares suggest that average weight may have decreased. Given that accident severity for multivehicle crashes depends partly on weight disparity, changes in new vehicle weight could have safety implications. Figure 4 plots the change in average log weight (salesweighted) from 2000 to 2012 for all vehicles, for cars, and for light trucks in the U.S. market. Weight of light trucks increased steadily from 2000 until about 2005, after which it leveled off. Weight of cars increased from 2000 until about 2008 and then leveled off. The fact that the inflection point for cars occurred more recently than for light trucks suggests that fuel economy standards partially explain the decrease in the growth rate of vehicle weight. Importantly from the perspective of passenger safety, the growth rate of weight has slowed down considerably, but new vehicles are not lighter on average than older vehicles. This lessens concern about the safety implications of recent market share changes. 11

15 Figure 4. Change in Log Vehicle Weight, Notes: The figure plots the change in log weight since 2000 for all vehicles, cars, and light trucks. The sample includes all vehicles in the U.S. market. To summarize, we observe substantial differences across segments and vehicle types in the amount by which fuel economy increased and in the relative contribution of market shares and technology to the overall increases. For cars and light trucks, technology and market shares had similar effects on fuel economy over the entire period, but technology has been more important than market shares in recent years. There is some indication that technology became more important earlier for light trucks than for cars. This difference is consistent with the hypothesis that the increasing light truck fuel economy standards caused technology to raise overall fuel economy starting in Finally, despite the changes in market shares, vehicle weight has leveled off since the late 2000s. 6. Comparing Actual Fuel Economy Changes with NHTSA Predictions Having shown that technology explains about half of the total change, we turn to the NHTSA predictions of fuel economy increases under the light truck standards between 2005 and 12

16 2011. Section 5 reports substantial differences across light truck market segments in the level of the fuel economy increase as well as the contribution of technology and market shares to this increase. Here we compare the observed outcomes with the NHTSA predictions. Large differences between observed and predicted outcomes would not necessarily mean that the NHTSA predictions are faulty, but such differences would motivate a further examination of their causes. In its cost benefit analysis, NHTSA predicts the fuel economy change of each model in the market at the beginning of the period being analyzed. For example, the analysis of the standards includes models sold in Based on reported manufacturer production plans and the computational model described in Section 3, NHTSA predicts the fuel economy change for each model. We compare predicted and actual fuel economy changes by manufacturer. Figure 5 shows a series of scatter plots of actual and predicted fuel economy change by manufacturer for (Panel A), (Panel B), and (Panel C). For consistency with the NHTSA predictions, we calculated the harmonic average fuel economy for each manufacturer using actual sales. Each point in the figure plots the predicted against the actual change for a particular manufacturer. The solid line in each plot is the 45-degree line. If a manufacturer s point is above the line, the predicted fuel economy change for that manufacturer is higher than the actual change. The figure shows that actual and predicted fuel economy changes are closer for the period than for the period. The correlation between actual and predicted changes is close to zero in the first period and close to 0.3 in the second period (excluding the outlier). Thus the correlation is greater when fuel economy was increasing more quickly. As mentioned earlier, the sales forecasts that NHTSA used to predict fuel economy were taken from EIA s 2002 and 2004 Annual Energy Outlook. Likely because of the recession, actual sales turned out to be much different from the forecasts. The recession may therefore explain the discrepancies between actual and predicted fuel economy, but gas prices and modeling assumptions may also play a role; research is needed to disentangle these possibilities. 13

17 Figure 5. Predicted and Actual Changes in New Light Truck Fuel Economy 14

18 7. Conclusions Recent increases in average new vehicle fuel economy can be explained by two overarching factors: changes in the mix and application of vehicle technologies and changes in market shares. Our results suggest that the two factors contributed almost equally to the overall increase in fuel economy over the last decade. However, there have been some differences between cars and light trucks, and larger differences within the car and light truck categories. Market shares had a substantially larger effect on the fuel economy of cars than on that of light trucks between 2005 and Roughly consistent with the adoption of the timing of the tighter fuel economy standards, technology s contribution increased for light trucks around 2005 and for cars around Mitigating concerns about the safety consequences of rising fuel economy standards, average weight has leveled off but has not decreased. Turning to the NHTSA analysis of the light truck standards, actual and predicted changes in sales-weighted light truck fuel economy from 2005 to 2011 are positively correlated, although the correlation is not very high. The importance of technology for light trucks from 2005 to 2008 and for cars from 2009 to 2012 suggests that fuel economy standards have affected technology. The importance of technology also provides some support for the EPA and NHTSA assumption that fuel economy standards do not affect market shares. Quantitative research is needed into the causes of the changes in technology and the welfare consequences of these changes. 15

19 8. References Busse, M., C. Knittel, and F. Zettlemeyer Are Consumers Myopic? Evidence from New and Used Car Purchases. American Economic Review 103(1): EIA (Energy Information Administration, U.S. Department of Energy) Annual Energy Outlook Washington, DC: Government Printing Office Annual Energy Outlook Washington, DC: Government Printing Office. EPA (U.S. Environmental Protection Agency, Office of Transportation and Air Quality) Light-Duty Automotive Technology, Carbon Dioxide Emissions, and Fuel Economy Trends: 1975 through Washington, DC: Government Printing Office. Klier, T., and J. Linn The Price of Gasoline and the Demand for Fuel Efficiency: Evidence from Monthly New Vehicle Sales Data. American Economic Journal: Economic Policy 2(3): National Research Council Effectiveness and Impact of Corporate Average Fuel Economy (CAFE) Standards. Washington, DC: National Academies Press. NHTSA (National Highway Traffic Safety Administration, U.S. Department of Transportation). 2003a. Corporate Average Fuel Economy Standards for MY Light Trucks: Final Economic Assessment. Washington, DC: Government Printing Office b. Vehicle Weight, Fatality Risk and Crash Compatibility of Model Year Passenger Cars and Light Trucks. Washington, DC: Government Printing Office Corporate Average Fuel Economy and CAFE Reform for MY Light Trucks: Final Regulatory Impact Analysis. Washington, DC: Government Printing Office. 16

Federal Reserve Bank of Chicago
 Federal Reserve Bank of Chicago The Effect of Vehicle Fuel Economy Standards on Technology Adoption Thomas Klier and Joshua Linn September 2014 WP 2014-22 The Effect of Vehicle Fuel Economy Standards on
Technological Change, Vehicle Characteristics, and the Opportunity Costs of Fuel Economy Standards
 Technological Change, Vehicle Characteristics, and the Opportunity Costs of Fuel Economy Standards Thomas Klier (Federal Reserve Bank of Chicago) Joshua Linn (Resources for the Future) 1 December 2013
DISCUSSION PAPER. Fuel Prices, New Vehicle Fuel Economy, and Implications for Attribute-Based Standards
 DISCUSSION PAPER February 2016 RFF DP 16-04 Fuel Prices, New Vehicle Fuel Economy, and Implications for Attribute-Based Standards B e n jamin L e a r d, J o s h u a L i n n, a n d Virg i n i a M c C o
How ELECTRIC CARS. Can Increase GREENHOUSE GAS EMISSIONS
 How ELECTRIC CARS Can Increase GREENHOUSE GAS EMISSIONS Under existing fuel economy and electricity policies, subsidies for plug-in vehicles may have the opposite effect on vehicle emissions than intended,
DISCUSSION PAPER. The New CAFE Standards: Are They Enough on Their Own? V i r g i n i a M c C o n n e l l. Ma y 2013 RFF DP 13-14
 DISCUSSION PAPER Ma y 2013 RFF DP 13-14 The New CAFE Standards: Are They Enough on Their Own? V i r g i n i a M c C o n n e l l 1616 P St. NW Washington, DC 20036 202-328-5000 www.rff.org The New CAFE
Why Some Fuel-Efficient Vehicles Are Not Sold Domestically
 Why Some Fuel-Efficient Vehicles Are Not Sold Domestically Bill Canis Specialist in Industrial Organization and Business August 17, 2012 CRS Report for Congress Prepared for Members and Committees of Congress
DISCUSSION PAPER. Fuel Prices and New Vehicle Fuel Economy in Europe. T h o m a s Klie r a n d J o s h u a L i n n. September 2011 RFF DP 11-37
 DISCUSSION PAPER September 2011 RFF DP 11-37 Fuel Prices and New Vehicle Fuel Economy in Europe T h o m a s Klie r a n d J o s h u a L i n n 1616 P St. NW Washington, DC 20036 202-328-5000 www.rff.org
Light-Duty Automotive Technology, Carbon Dioxide Emissions, and Fuel Economy Trends: 1975 Through 2015. Executive Summary
 Light-Duty Automotive Technology, Carbon Dioxide Emissions, and Fuel Economy Trends: 1975 Through 2015 Executive Summary EPA-420-S-15-001 December 2015 Executive Summary IntroductIon This report is the
Questions and Answers
 Fuel Economy Testing and Labeling 1. Why should I trust EPA s fuel economy values? The MPG estimates on the EPA/DOT Fuel Economy and Environment Label (or window sticker) are based on standardized laboratory
VEHICLE SURVIVABILITY AND TRAVEL MILEAGE SCHEDULES
 DOT HS 809 952 January 2006 Technical Report VEHICLE SURVIVABILITY AND TRAVEL MILEAGE SCHEDULES Published By: NHTSA s National Center for Statistics and Analysis This document is available to the public
Light-Duty Automotive Technology and Fuel Economy Trends: 1975 Through 2008
 Light-Duty Automotive Technology and Fuel Economy Trends: 1975 Through 2008 Light-Duty Automotive Technology and Fuel Economy Trends: 1975 Through 2008 Compliance and Innovative Strategies Division and
Using Vehicle Taxes to Reduce Carbon Dioxide Emissions Rates of New Passanger Vehicles: Evidence from France, Germany, and Sweden
 Using Vehicle Taxes to Reduce Carbon Dioxide Emissions Rates of New Passanger Vehicles: Evidence from France, Germany, and Sweden Thomas Klier and Joshua Linn August 2012 CEEPR WP 2012-011 A Joint Center
THE PRICE OF GASOLINE AND THE DEMAND FOR FUEL EFFICIENCY: EVIDENCE FROM MONTHLY NEW VEHICLES SALES DATA *
 THE PRICE OF GASOLINE AND THE DEMAND FOR FUEL EFFICIENCY: EVIDENCE FROM MONTHLY NEW VEHICLES SALES DATA * Thomas Klier Federal Reserve Bank of Chicago tklier@frbchi.org Joshua Linn Department of Economics
Federal Reserve Bank of Chicago
 Federal Reserve Bank of Chicago Corporate Average Fuel Economy Standards and the Market for New Vehicles Thomas Klier and Joshua Linn WP 2011-01 Corporate Average Fuel Economy Standards and the Market
Emission Facts. The amount of pollution that a vehicle emits and the rate at which
 Average Annual Emissions and Fuel for Gasoline-Fueled Passenger Cars and Light Trucks The amount of pollution that a vehicle emits and the rate at which it consumes fuel are dependent on many factors.
IN THE EARLY 1970S, the American Petroleum Institute had a slogan: A nation
 Moving Forward With Fuel Economy Standards BY LEE SCHIPPER IN THE EARLY 1970S, the American Petroleum Institute had a slogan: A nation that runs on oil can t afford to run short. Yet at the beginning of
Analysis of Technology Adoption Rates in New Vehicles 2014-01-0781
 Analysis of Technology Adoption Rates in New Vehicles 2014-01-0781 Aaron Hula, Jeffrey Alson, Amy Bunker, and Kevin Bolon US Environmental Protection Agency Published 04/01/2014 CITATION: Hula, A., Alson,
DISCUSSION PAPER. Fuel Costs, Economic Activity, and the Rebound Effect for Heavy-Duty Trucks
 DISCUSSION PAPER September 2015; revised February 2016 RFF DP 15-43-REV Fuel Costs, Economic Activity, and the Rebound Effect for Heavy-Duty Trucks B e n jamin L e a r d, J o s h u a L i n n, Vi r g i
The Effect of Market Size on Fuel-Saving Technology Adoption in Passenger Vehicles
 The Effect of Market Size on Fuel-Saving Technology Adoption in Passenger Vehicles Thomas Klier Joshua Linn Yichen Christy Zhou Federal Reserve Bank of Chicago Resources for the Future University of Maryland
NHTSA and EPA Set Standards to Improve Fuel Economy and Reduce Greenhouse Gases for Passenger Cars and Light Trucks for Model Years 2017 and Beyond
 NHTSA and EPA Set Standards to Improve Fuel Economy and Reduce Greenhouse Gases for Passenger Cars and Light Trucks for Model Years 2017 and Beyond The National Highway Traffic Safety Administration (NHTSA)
New Fuel Economy and Environment Labels for a New Generation of Vehicles
 New Fuel Economy and Environment Labels for a New Generation of Vehicles Why New Label Designs? The U.S. Department of Transportation joined with EPA today in unveiling new fuel economy and environment
Light-Duty Automotive Technology, Carbon Dioxide Emissions, and Fuel Economy Trends: 1975 Through 2013. Report
 LightDuty Automotive Technology, Carbon Dioxide Emissions, and Fuel Economy Trends: 1975 Through 2013 Report EPA420R13011 December 2013 NOTICE: This technical report does not necessarily represent final
Passenger Vehicle Occupant Fatality Rates by Type and Size of Vehicle
 DOT HS 809 979 January 2006 Passenger Vehicle Occupant Fatality Rates by Type and Size of Vehicle By Rajesh Subramanian * Summary The National Highway Traffic Safety Administration (NHTSA) has routinely
GAO VEHICLE FUEL ECONOMY
 GAO United States Government Accountability Office Report to the Chairman, Committee on Commerce, Science, and Transportation, U.S. Senate August 2007 VEHICLE FUEL ECONOMY Reforming Fuel Economy Standards
Fleet Characterization Data for MOBILE6:
 United States Environmental Protection Agency Air and Radiation EPA420-R-01-047 September 2001 M6.FLT.007 Fleet Characterization Data for MOBILE6: Development and Use of Age Distributions, Average Annual
ECONOMIC INDICATORS AS PREDICTORS OF
 UMTRI-2009-27 JULY 2009 ECONOMIC INDICATORS AS PREDICTORS OF THE NUMBER AND FUEL ECONOMY OF PURCHASED NEW VEHICLES MICHAEL SIVAK BRANDON SCHOETTLE ECONOMIC INDICATORS AS PREDICTORS OF THE NUMBER AND FUEL
Overview of the Heavy-Duty National Program. Need to Reduce Fuel Consumption and Greenhouse Gases from Vehicles
 Submitted by United States of America Informal document WP.29-155-11 (155 th WP.29, 15-18 November 2011, agenda item 14) United States of America Environmental Protection Agency and National Highway Traffic
DISCUSSION PAPER. Evaluating Cash-for-Clunkers. Program Effects on Auto Sales and the Environment
 DISCUSSION PAPER August 2010; revised October 2011 RFF DP 10-39-REV Evaluating Cash-for-Clunkers Program Effects on Auto Sales and the Environment S h a n j u n Li, J o s h u a L i n n, a n d Elisheba
Motor Vehicle Crashes, Injuries, and Deaths in Relation to Driver Age: United States, 1995 2010
 Car crashes rank among the leading causes of death in the United States. Motor Vehicle Crashes, Injuries, and Deaths in Relation to Driver Age: United States, 1995 2010 November 2012 607 14th Street, NW,
B-322486. September 30, 2011
 United States Government Accountability Office Washington, DC 20548 B-322486 September 30, 2011 The Honorable Barbara Boxer Chairman The Honorable James M. Inhofe Ranking Member Committee on Environment
GM and Ford Investment Plans and California Greenhouse Gas Emission Standards
 GM & Ford Plans and s GM and Ford Investment Plans and California Greenhouse Gas Emission s Fuel Economy Improvements in Federal Loan Plans Show that Automakers Can Comply with California Greenhouse Gas
When are Alternative Fuel Vehicles a Cost-Effective Option for Local Governments? Christopher R Sherman
 by Christopher R Sherman A paper submitted to the faculty of the University of North Carolina at Chapel Hill in partial fulfillment of the requirements for the degree of Master of Public Administration
Technical Report Documentation Page. 2. Government Accession No. 3. Recipient's Catalog No. 1. Report No. FHWA/TX-13/0-6737-1
 1. Report No. FHWA/TX-13/0-6737-1 4. Title and Subtitle EXECUTIVE REPORT: TOLL ROADS, TOLL RATES, AND DRIVER BEHAVIOR 2. Government Accession No. 3. Recipient's Catalog No. Technical Report Documentation
Analysis of the Relationship Between Vehicle Weight/Size and Safety, and Implications for Federal Fuel Economy Regulation
 LBNL-3143E Analysis of the Relationship Between Vehicle Weight/Size and Safety, and Implications for Federal Fuel Economy Regulation Final Report prepared for the Office of Energy Efficiency and Renewable
July 6, 2016. SUBJECT: Electric Vehicle (EV) and Utilities a Win-Win investment?
 and Utilities a Win-Win investment?") Henry Lorenzen Chair Oregon Bill Bradbury Oregon Phil Rockefeller Washington Tom Karier Washington W. Bill Booth Vice Chair Idaho James Yost Idaho Pat Smith Montana Jennifer Anders Montana July 6, 2016
Henry Lorenzen Chair Oregon Bill Bradbury Oregon Phil Rockefeller Washington Tom Karier Washington W. Bill Booth Vice Chair Idaho James Yost Idaho Pat Smith Montana Jennifer Anders Montana July 6, 2016
Automobile Fuel Economy: Under-valued, Over-valued, or Both?
 Automobile Fuel Economy: Under-valued, Over-valued, or Both? Molly Espey John E. Walker Department of Economics Clemson University Clemson, SC 29634 mespey@clemson.edu Selected Paper prepared for presentation
How Does Coal Price Affect Heat Rates?
 Regulating Greenhouse Gases from Coal Power Plants Under the Clean Air Act Joshua Linn (RFF) Dallas Burtraw (RFF) Erin Mastrangelo (Maryland) Power Generation and the Environment: Choices and Economic
September 9, 2015. Mr. John Eichberger Executive Director Fuels Institute 1600 Duke Street, Suite 700 Alexandria, Virginia 22314
 September 9, 2015 Mr. John Eichberger Executive Director Fuels Institute 1600 Duke Street, Suite 700 Alexandria, Virginia 22314 RE: CMU Life Cycle Greenhouse Gas Study for Light Duty Vehicles Dear John:
carbon footprinting a guide for fleet managers
 carbon footprinting a guide for fleet managers Introduction For some organisations, carbon footprinting is perceived to be about reducing emissions purely for environmental reasons. But it is primarily
Independence Day 2016 Holiday Period Traffic Fatality Estimate
 Independence Day 2016 Holiday Period Traffic Fatality Estimate The 2016 Independence Day holiday period begins at 6:00 p.m., Friday, July 1, and ends at 11:59 p.m., Monday, July 4. Our estimate of traffic
Chapter 12: Gross Domestic Product and Growth Section 1
 Chapter 12: Gross Domestic Product and Growth Section 1 Key Terms national income accounting: a system economists use to collect and organize macroeconomic statistics on production, income, investment,
RE D U C I N G U S G A S O L I N E C O N S U M P T I O N M I G H T S E E M A
 If Cars Were More Efficient, Would We Use Less Fuel? B Y K E N N E T H A. S M A L L A N D K U R T VA N D E N D E R RE D U C I N G U S G A S O L I N E C O N S U M P T I O N M I G H T S E E M A straightforward
Author s Accepted Manuscript
 Author s Accepted Manuscript Evaluating Cash-for-Clunkers : Program Effects on Auto Sales and the Environment Shanjun Li, Joshua Linn, Elisheba Spiller PII: DOI: Reference: S0095-0696(12)00067-8 http://dx.doi.org/10.1016/j.jeem.2012.07.004
Two miles per day may not seem like much, but do the math.
 February 2008 Chicago sgreen Dividend Joe Cortright jcortright@impresaconsulting.com Senior Policy Advisor, CEOs for Cities Chicago has placed an increasing emphasis on pursuing green policies in recent
ITSMR Research Note. Cell Phone Use and Other Driver Distractions: A Status Report KEY FINDINGS ABSTRACT INTRODUCTION.
 September 2012 KEY FINDINGS Observational Surveys 15% of the drivers observed in 2012 were engaged in some type of distracted driving behavior, down from in 2007. 4. of the drivers observed in the 2012
Young teen crash risk by vehicle type
 Bulletin Vol. 31, No. 4 : April 214 teen crash risk by vehicle type Previous HLDI studies have shown that collision claim frequencies are highest for young drivers. The purpose of this analysis is to explore
EPA/NHTSA Phase 2 Fuel Efficiency and Greenhouse Gas Standards for Heavy-Duty Trucks: Projected Effect on Freight Costs
 EPA/NHTSA Phase 2 Fuel Efficiency and Greenhouse Gas Standards for Heavy-Duty Trucks: Projected Effect on Freight Costs May 2014 Submitted to: Environmental Defense Fund 18 Tremont Street Boston, MA 02108
Life-cycle Cost Analysis: Aluminum versus Steel in Passenger Cars
 Title of Publication Edited by TMS (The Minerals, Metals & Materials Society), 27 Life-cycle Cost Analysis: versus in Passenger Cars C.A. Ungureanu 1, S. Das 2, I.S. Jawahir 1 1 University of Kentucky,
DISCUSSION PAPER. Voluntary Environmental Information Disclosure and Firm Size. Evidence from the Hydraulic Fracturing Chemical Registry FracFocus
 DISCUSSION PAPER December 2014 RFF DP 14-43 Voluntary Environmental Information Disclosure and Firm Size Evidence from the Hydraulic Fracturing Chemical Registry FracFocus Z h o n g m i n W a n g 1616
Noncrash fire safety recall losses
 Bulletin Vol. 30, No. 33 : December 2013 Noncrash fire safety recall losses Vehicles with known fire-related defects have significantly higher risk of noncrash fire insurance losses compared with vehicles
Do Commodity Price Spikes Cause Long-Term Inflation?
 No. 11-1 Do Commodity Price Spikes Cause Long-Term Inflation? Geoffrey M.B. Tootell Abstract: This public policy brief examines the relationship between trend inflation and commodity price increases and
Péter Gábriel and Ádám Reiff: The effect of the change in VAT rates on the consumer price index
 Péter Gábriel and Ádám Reiff: The effect of the change in VAT rates on the consumer price index In the autumn of 2006 the Magyar Nemzeti Bank launched a series of research projects on the pricing of products
Vision Fleet: Fleet Assessment Overview Alternative fuel vehicles for fleets: Low Cost, Low Carbon, Low Hassle
 Vision Fleet: Fleet Assessment Overview Alternative fuel vehicles for fleets: Low Cost, Low Carbon, Low Hassle Overview: A Vision Fleet Opportunity Assessment is both quantitative and qualitative and will
Corporate Carbon Neutral Plan
 This Carbon Neutral Plan will guide the District of 100 Mile House decision making process in terms of reducing corporate energy consumption and greenhouse gas emissions and in achieving carbon neutrality.
Reducing America s Dependence on Foreign Oil Supplies. Martin Feldstein *
 Reducing America s Dependence on Foreign Oil Supplies Martin Feldstein * The United States now imports nearly 60 percent of the oil that we consume. This dependence on foreign supplies makes us vulnerable
STAYING ON THE ROAD TO 54.5 MPG BY 2025 RIDING THE GASOLINE ROLLER COASTER
 STAYING ON THE ROAD TO 54.5 MPG BY 2025 RIDING THE GASOLINE ROLLER COASTER DR. MARK COOPER DIRECTOR OF RESEARCH FEBRUARY 19, 2015 EXECUTIVE SUMMARY Section I: Since the start of the 21 st century, gasoline
Group A (sales per week)
") Practice Questions and Answers from Lesson I-7: Elasticity The following questions practice these skills: Use the midpoint method for calculating percent change. Compute price elasticity of demand. Identify
Practice Questions and Answers from Lesson I-7: Elasticity The following questions practice these skills: Use the midpoint method for calculating percent change. Compute price elasticity of demand. Identify
The labour market, I: real wages, productivity and unemployment 7.1 INTRODUCTION
 7 The labour market, I: real wages, productivity and unemployment 7.1 INTRODUCTION Since the 1970s one of the major issues in macroeconomics has been the extent to which low output and high unemployment
#1 Automobile Problems (answer key at end)
") #1 Automobile Problems (answer key at end) 1. A car is traveling at 60 mph and is tailgating another car at distance of only 30 ft. If the reaction time of the tailgater is 0.5 seconds (time between seeing
#1 Automobile Problems (answer key at end) 1. A car is traveling at 60 mph and is tailgating another car at distance of only 30 ft. If the reaction time of the tailgater is 0.5 seconds (time between seeing
A Review of Cost of AB 32 on California Small Businesses Summary Report of Findings by Varshney & Associates
 A Review of Cost of AB 32 on California Small Businesses Summary Report of Findings by Varshney & Associates Matthew E. Kahn UCLA and NBER Professor, Institute of the Environment Department of Economics
DISCUSSION PAPER. Regulating Greenhouse Gases from Coal Power Plants under the Clean Air Act
 DISCUSSION PAPER February 2013 RFF DP 13-05 Regulating Greenhouse Gases from Coal Power Plants under the Clean Air Act J o s h u a L i n n, Erin M a s t r a n g e l o, a n d D a l l a s B u r t r aw A
Are crashworthiness and fuel economy necessarily conflicting outcomes? Mark Symmons and Narelle Haworth Monash University Accident Research Centre
 Are crashworthiness and fuel economy necessarily conflicting outcomes? Mark Symmons and Narelle Haworth Monash University Accident Research Centre Abstract It has been demonstrated that larger, heavier
Pain at the Pump: How Gasoline Prices Affect Automobile Purchasing
 Pain at the Pump: How Gasoline Prices Affect Automobile Purchasing Meghan R. Busse Northwestern University and NBER Christopher R. Knittel University of California, Davis and NBER Florian Zettelmeyer Northwestern
Association Between Variables
 Contents 11 Association Between Variables 767 11.1 Introduction............................ 767 11.1.1 Measure of Association................. 768 11.1.2 Chapter Summary.................... 769 11.2 Chi
Implications of Abundant Natural Gas
 Implications of Abundant Natural Gas JAE EDMONDS AND HAEWON MCJEON APRIL 2013 May 29, 2013 1 Background May 29, 2013 2 The natural gas revolution The application of technologies for accessing unconventional
Washington s Greenhouse Gas Emissions: Sources and Trends
 Washington s Greenhouse Gas Emissions: Sources and Trends By Stacey Waterman-Hoey and Greg Nothstein WA State Dept. of Community, Trade & Economic Development Energy Policy Division December 06 (Revised
Proper Tire Inflation Increases Fuel Economy and Reduces Greenhouse Gas Emissions Laura Swenson
 Proper Tire Inflation Increases Fuel Economy and Reduces Greenhouse Gas Emissions Laura Swenson Abstract California has recognized the threat from global warming and has put forth legislation to curb greenhouse
ECO-DRIVING: STRATEGIC, TACTICAL, AND OPERATIONAL DECISIONS OF THE DRIVER THAT IMPROVE VEHICLE FUEL ECONOMY
 UMTRI-2011-34 AUGUST 2011 ECO-DRIVING: STRATEGIC, TACTICAL, AND OPERATIONAL DECISIONS OF THE DRIVER THAT IMPROVE VEHICLE FUEL ECONOMY MICHAEL SIVAK BRANDON SCHOETTLE ECO-DRIVING: STRATEGIC, TACTICAL, AND
Demand, Supply and Elasticity
 Demand, Supply and Elasticity CHAPTER 2 OUTLINE 2.1 Demand and Supply Definitions, Determinants and Disturbances 2.2 The Market Mechanism 2.3 Changes in Market Equilibrium 2.4 Elasticities of Supply and
Clean Diesel versus CNG Buses: Cost, Air Quality, & Climate Impacts
 CONCORD, MA - MANCHESTER, NH - WASHINGTON, DC 1000 ELM STREET, 2 ND FLOOR MANCHESTER, NH 03101 603-647-5746 www.mjbradley.com DATE February 22, 2012 TO FROM RE: Conrad Schneider, Clean Air Task Force Dana
Automobile and Light Truck Fuel Economy: The CAFE Standards
 Order Code RL33413 Automobile and Light Truck Fuel Economy: The CAFE Standards Updated January 19, 2007 Brent D. Yacobucci Specialist in Energy Policy Resources, Science, and Industry Division Robert Bamberger
Title: Comparing Price Forecast Accuracy of Natural Gas Models and Futures Markets
 Title: Comparing Price Forecast Accuracy of Natural Gas Models and Futures Markets Gabrielle Wong-Parodi (Corresponding Author) Lawrence Berkeley National Laboratory One Cyclotron Road, MS 90-4000 Berkeley,
THE TECHNOLOGY TO REACH 60 MPG BY 2025
 THE TECHNOLOGY TO REACH 60 MPG BY 2025 Putting Fuel-Saving Technology to Work to Save Oil and Cut Pollution Increasing the fuel efficiency of new cars and trucks is a critical step towards cutting America
Four-wheel drive vehicle crash involvement patterns
 Four-wheel drive vehicle crash involvement patterns August 2006 Report Summary 06/05 Introduction This document is a summary of a larger research report prepared by the Monash University Accident Research
ClimatE leaders GrEENHOUsE Gas inventory PrOtOCOl COrE module GUidaNCE
 United States Environmental Protection Agency may 2008 EPa430-r-08-006 www.epa.gov/climateleaders Office of air and radiation ClimatE leaders GrEENHOUsE Gas inventory PrOtOCOl COrE module GUidaNCE Optional
Characteristics of Motorcycle Crashes in the U.S.
 Characteristics of Motorcycle Crashes in the U.S. Jeya Padmanaban, M.S. JP Research Inc., USA. 7 West El Camino Real, Suite 2 Mountain View, CA, 944 jeya@jpresearch.com Vitaly Eyges, PhD., JP Research,
Exhibit D. Willingness to Pay for MY 2025 Fuel Economy Mandates: Government Estimates vs. Economic Reality
 NADA COMMENTS TO NHTSA/EPA RE: MY 2017-2025 PROPOSED STANDARDS Exhibit D Willingness to Pay for MY 2025 Fuel Economy Mandates: Government Estimates vs. Economic Reality Walton and Drake 2/13/2012 Willingness
LAST SPRING S Senate hearings on Corporate Average
 Are Really Safer Than Cars? BY TOM WENZEL AND MARC ROSS LAST SPRING S Senate hearings on Corporate Average Fuel Economy standards made much about the increased risk Americans would face if forced to give
Beef Demand: What is Driving the Market?
 Beef Demand: What is Driving the Market? Ronald W. Ward Food and Economics Department University of Florida Demand is a term we here everyday. We know it is important but at the same time hard to explain.
Environmental Defense Fund NAFA Fleet Management Association
 August 2009 Introduction About Our Organizations Highway Emissions Carbon Dioxide Methane and Nitrous Oxide Refrigerants (HFCs) Non-highway Emissions Sample Calculations Private light-duty fleet Private
Journal Vol 37 / Issue No.2
 22 / Motor innovation FEATURE Hybrid, electric and driverless cars: innovation driving change in motor vehicle insurance Motor insurers have had to keep up with rapid developments in the car industry for
Strategic Use of Electric Vehicle Charging to Reduce Renewable Energy Curtailment on Oahu
 Strategic Use of Electric Vehicle Charging to Reduce Renewable Energy Curtailment on Oahu An analysis of the use of electric vehicle charging to mitigate renewable energy curtailment based on detailed
Gasoline Taxes and Fuel Economy: A Preference Heterogeneity Approach
 Gasoline Taxes and Fuel Economy: A Preference Heterogeneity Approach Mario Samano March, 2012 Abstract This paper estimates an equilibrium model for the U.S. car market to measure the value of two policies
climate change policy partnership
 climate change policy partnership Transportation Emissions Response to Carbon Pricing Programs Craig Raborn Duke University September 2009 CCPP 09-05 Nicholas School of the Environment Nicholas Institute
A Technical Research Report: The Electric Vehicle
 March 11, 2010 A Technical Research Report: The Electric Vehicle Prepared for Ann Holms University of California Santa Barbara College of Engineering Prepared By Rony Argueta University of California Santa
Predicted availability of safety features on registered vehicles
 Bulletin Vol. 28, No. 26 : April 2012 Predicted availability of safety features on registered vehicles Introduction In 2008, the Insurance Institute for Highway Safety (IIHS) estimated the potential benefits
Natural Gas Passenger Vehicles: Availability, Cost, and Performance
 Natural Gas Passenger Vehicles: Availability, Cost, and Performance Brent D. Yacobucci Specialist in Energy and Environmental Policy February 3, 2010 Congressional Research Service CRS Report for Congress
A Short Tour of the Predictive Modeling Process
 Chapter 2 A Short Tour of the Predictive Modeling Process Before diving in to the formal components of model building, we present a simple example that illustrates the broad concepts of model building.
Fuel Efficiency for the Long Haul An overview of proposed standards for medium- and heavy-duty vehicles
 Fuel Efficiency for the Long Haul An overview of proposed standards for medium- and heavy-duty vehicles Clean Energy Initiative Our goal is to accelerate the clean energy economy for its national security,
Calculating Carbon Intensity: Implications of Projection Horizon and Future Land Use Prepared for the Renewable Fuels Association
 April 30, 2009 Calculating Carbon Intensity: Implications of Projection Horizon and Future Land Use Prepared for the Renewable Fuels Association Project Team David Harrison, Jr., Ph.D. Albert L. Nichols,
Vehicle Fuel Economy and Emission Standards
 National Stakeholder Consultation and Capacity Building Workshop On Development of Sustainable and Inclusive Transport Policy Vehicle Fuel Economy and Emission Standards M. Absar Alam 9-10 April, 2015
Portfolio Manager and Green Power Tracking
 Building owners and operators can buy green power products as a way of reducing the environmental impacts associated with purchased electricity use in their facilities. The Environmental Protection Agency
Statement of Steve Douglas Senior Director of Environmental Affairs,
 Before the United States Copyright Office Public Hearings on Section 1201(a) Rulemaking Statement of Steve Douglas Senior Director of Environmental Affairs, Alliance of Automobile Manufacturers May 19,
STATEMENT OF HOWARD GRUENSPECHT DEPUTY ADMINISTRATOR ENERGY INFORMATION ADMINISTRATION U.S. DEPARTMENT OF ENERGY BEFORE THE
 STATEMENT OF HOWARD GRUENSPECHT DEPUTY ADMINISTRATOR ENERGY INFORMATION ADMINISTRATION U.S. DEPARTMENT OF ENERGY BEFORE THE COMMITTEE ON ENERGY AND COMMERCE SUBCOMMITTEE ON ENERGY AND POWER UNITED STATES
Canadian Automotive Fuel Economy Policy Regulatory Policies Economic Instruments Labeling References
 Canadian Automotive Fuel Economy Policy Regulatory Policies Economic Instruments Labeling References 1.1Background Vehicles in Canada are required to comply with emission standards for a defined full useful
PAYING THE FREIGHT: THE CONSUMER BENEFITS OF INCREASING THE FUEL ECONOMY OF MEDIUM AND HEAVY DUTY TRUCKS. Dr. Mark Cooper Director of Research, CFA
 2 PAYING THE FREIGHT: THE CONSUMER BENEFITS OF INCREASING THE FUEL ECONOMY OF MEDIUM AND HEAVY DUTY TRUCKS Dr. Mark Cooper Director of Research, CFA With contributions from Jack Gillis Director of Public
Level Crossing Crash Taxonomy for Connected Vehicle Safety Research
 Level Crossing Crash Taxonomy for Connected Vehicle Safety Research Adrian Hellman Systems Safety and Engineering Division August 5, 2014 Volpe The National Transportation Systems Center Advancing transportation
Relationships Between Two Variables: Scatterplots and Correlation
 Relationships Between Two Variables: Scatterplots and Correlation Example: Consider the population of cars manufactured in the U.S. What is the relationship (1) between engine size and horsepower? (2)
Quarterly Economics Briefing
 Quarterly Economics Briefing March June 2015 2016 Review of Current Conditions: The Economic Outlook and Its Impact on Workers Compensation The exhibits below are updated to reflect the current economic
Revisiting the Coming Grape Shortage
 Revisiting the Coming Grape Steven S. Cuellar, Ph.D Professor and Chair, Department of Economics, Sonoma State University Senior Research Economist, Sonoma Research Associates The cover story of the April