Pearson s Correlation
|
|
|
- Heather Robbins
- 7 years ago
- Views:
Transcription
1 Pearson s Correlation

2 Correlation the degree to which two variables are associated (co-vary). Covariance may be either positive or negative. Its magnitude depends on the units of measurement. Assumes the data are from a bivariate normal population. Does not necessarily imply causation.

, standard deviation (4.1), correlation (0.")
3 The four y variables have the same mean (7.5), standard deviation (4.1), correlation (0.81) and regression line (y = x).
, correlation (0.")
4 Pearson s correlation coefficient is a measure of the intensity of the linear association between variables. It is possible to have non-linear associations. Need to examine data closely to determine if any association exhibits linearity. Linear Non-linear

5 This is called Pearson s Correlation Coefficient. It ranges from -1 to +1. where y x xy r n Y X XY xy n Y Y y n X X x

6 The correlation coefficient is a measure of the intensity of the association between variables. r is a unit-less number. It can not be used to extrapolate a change in y based on a change in x. If variables are highly correlated, then we may want to investigate their association further to determine if there is a causal mechanism operating.

7 1 versus -tailed hypotheses -tailed hypotheses concerning r would state that there is a significant correlation between two variables. e.g. H o : r = 0, H a : r 0 1-tailed hypotheses concerning r would state that the association is either positive or negative. e.g. H o : r 0, H a : r > 0

8 Significance Testing for r If the data are normally distributed we can calculate a t-statistic for the correlation coefficient (r) using the equation: t r s r where s r 1 ( r) n df = n- since there is one df for each column. Here we are testing the null hypothesis that r = 0.

9 Dissolved Oxygen and Temperature 16 Dissolved Oxygen Temperature (C)

10 Temp (X) DO (Y)

11 Temp (X) DO (Y) X Y

12 Temp(X) DO(Y) XY

13 sign) the (ignore ) ( (11.93)(6.80) (93.)(193.93) (193.93) (93.) sum) then Y, and X (multiply observations) squared the (sum of colums) the (sum of , 13 Critical r t t s r xy y x XY Y X Y X n df n therefore reject H 0
 the (sum of 193.93 93.")
14
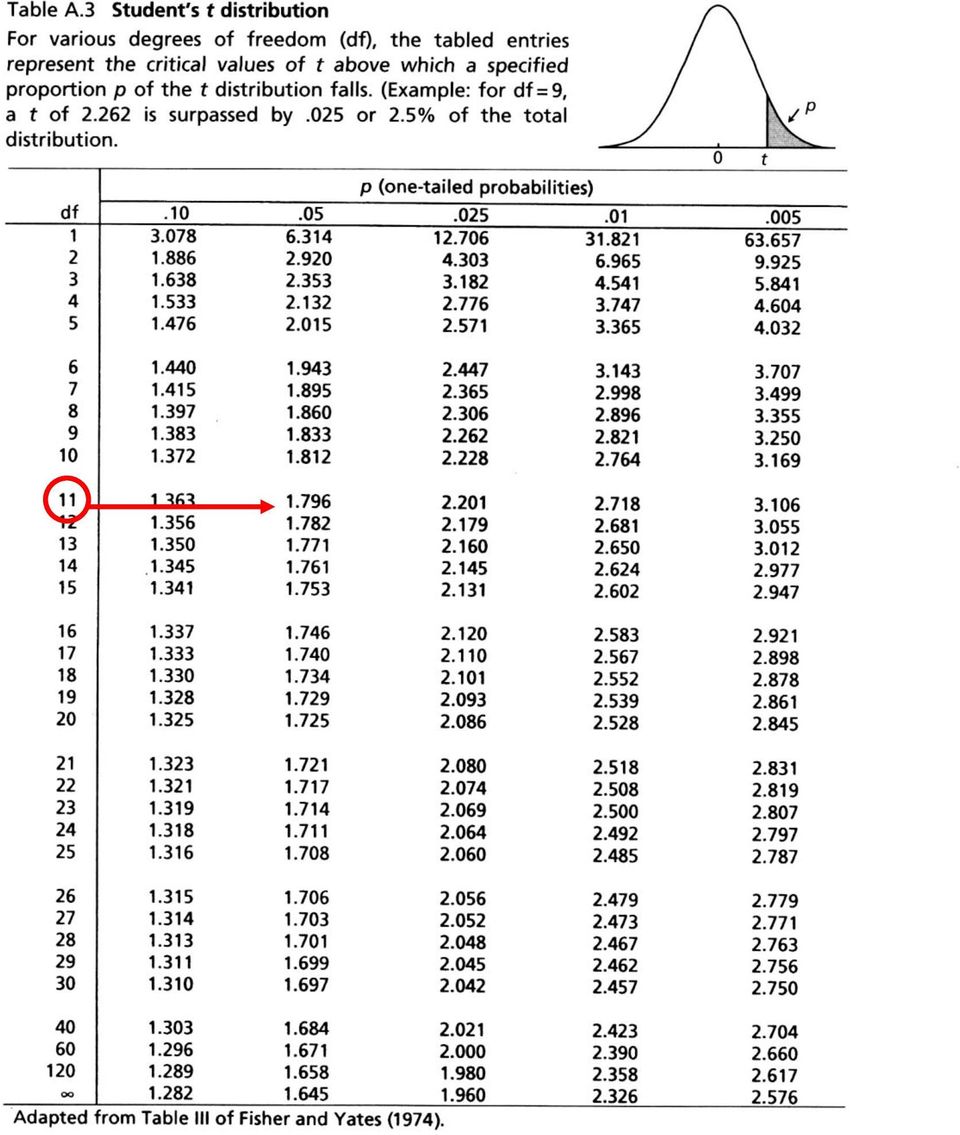
15 Since the value of r can be either positive or negative the critical value is a range in this case: to Our t-statistic (-4.94) falls beyond that range so we reject H 0. There is a significant inverse (negative) correlation between temperature and dissolved oxygen (t -4.94, p < 0.005, r=-0.83).
 correlation between temperature")
16 Since the range of the correlation coefficient is from -1 to +1, a value of tells us what? 1. The association is inverse meaning as one variable increases the other decreases.. The intensity of this inverse association between temperature and dissolved oxygen is fairly high.

17 Be aware that r is influenced by samples size. Therefore if the sample size is large, even smaller r values may be important.

18 Do by hand on the board: State Black Lung Rate Underground Miners Kentucky West Virginia Ohio Utah Oklahoma Tennessee Alabama Virginia Pennsylvania Colorado r t x y xy r s r xy x X Y XY where y n n Y where X X Y s r n 1 ( r) n SPSS data set s:\geo\pgmarr\quantitative Methods\SPSS Data\BlackLung.sav
 n SPSS data set")
19 Correlati ons BlackLung Underground BlackLung Pearson Correlation Sig. (-tailed) 1.79*.017 N Underground Pearson Correlation.79* 1 Sig. (-tailed) N *. Correlation is signif icant at the 0.05 lev el (-tailed).
 N.017 10 10 *.")
20 Correlation vs Regression Correlation measures of association, but no causal relationship is implied. There are no dependent or independent variables. Regression measures association where a causal relationship is believed to exist. A dependent and 1+ independent variables are assumed. Both correlation and regression assume that the relationship under investigation is linear, but it may be either positive (direct) or negative (inverse).

21 Boas Native American Tribe Anthropometric Measurements Note that arm and leg lengths are significantly correlated. However, longer arms do not cause longer legs. The causal mechanism is body proportions, meaning that larger individuals tend to have both longer arms and legs.
22 Remember that causation will result in correlation, but that correlation does not necessarily result in causation. Therefore, correlation is a necessary but not sufficient condition to make causal inferences regarding our data. Causation can really only be determined through controlled data analysis and a firm understanding of the underlying mechanisms which may result in a causal relationship.
SPSS Guide: Regression Analysis
 SPSS Guide: Regression Analysis I put this together to give you a step-by-step guide for replicating what we did in the computer lab. It should help you run the tests we covered. The best way to get familiar
Unit 31 A Hypothesis Test about Correlation and Slope in a Simple Linear Regression
 Unit 31 A Hypothesis Test about Correlation and Slope in a Simple Linear Regression Objectives: To perform a hypothesis test concerning the slope of a least squares line To recognize that testing for a
Multiple Regression in SPSS This example shows you how to perform multiple regression. The basic command is regression : linear.
 Multiple Regression in SPSS This example shows you how to perform multiple regression. The basic command is regression : linear. In the main dialog box, input the dependent variable and several predictors.
SIMPLE LINEAR CORRELATION. r can range from -1 to 1, and is independent of units of measurement. Correlation can be done on two dependent variables.
 SIMPLE LINEAR CORRELATION Simple linear correlation is a measure of the degree to which two variables vary together, or a measure of the intensity of the association between two variables. Correlation
Chapter 7: Simple linear regression Learning Objectives
 Chapter 7: Simple linear regression Learning Objectives Reading: Section 7.1 of OpenIntro Statistics Video: Correlation vs. causation, YouTube (2:19) Video: Intro to Linear Regression, YouTube (5:18) -
Simple Linear Regression Inference
 Simple Linear Regression Inference 1 Inference requirements The Normality assumption of the stochastic term e is needed for inference even if it is not a OLS requirement. Therefore we have: Interpretation
Hypothesis testing - Steps
 Hypothesis testing - Steps Steps to do a two-tailed test of the hypothesis that β 1 0: 1. Set up the hypotheses: H 0 : β 1 = 0 H a : β 1 0. 2. Compute the test statistic: t = b 1 0 Std. error of b 1 =
CHAPTER 13 SIMPLE LINEAR REGRESSION. Opening Example. Simple Regression. Linear Regression
 Opening Example CHAPTER 13 SIMPLE LINEAR REGREION SIMPLE LINEAR REGREION! Simple Regression! Linear Regression Simple Regression Definition A regression model is a mathematical equation that descries the
Correlational Research
 Correlational Research Chapter Fifteen Correlational Research Chapter Fifteen Bring folder of readings The Nature of Correlational Research Correlational Research is also known as Associational Research.
Module 5: Multiple Regression Analysis
 Using Statistical Data Using to Make Statistical Decisions: Data Multiple to Make Regression Decisions Analysis Page 1 Module 5: Multiple Regression Analysis Tom Ilvento, University of Delaware, College
Module 3: Correlation and Covariance
 Using Statistical Data to Make Decisions Module 3: Correlation and Covariance Tom Ilvento Dr. Mugdim Pašiƒ University of Delaware Sarajevo Graduate School of Business O ften our interest in data analysis
Course Objective This course is designed to give you a basic understanding of how to run regressions in SPSS.
 SPSS Regressions Social Science Research Lab American University, Washington, D.C. Web. www.american.edu/provost/ctrl/pclabs.cfm Tel. x3862 Email. SSRL@American.edu Course Objective This course is designed
Association Between Variables
 Contents 11 Association Between Variables 767 11.1 Introduction............................ 767 11.1.1 Measure of Association................. 768 11.1.2 Chapter Summary.................... 769 11.2 Chi
" Y. Notation and Equations for Regression Lecture 11/4. Notation:
 Notation: Notation and Equations for Regression Lecture 11/4 m: The number of predictor variables in a regression Xi: One of multiple predictor variables. The subscript i represents any number from 1 through
Simple Regression Theory II 2010 Samuel L. Baker
 SIMPLE REGRESSION THEORY II 1 Simple Regression Theory II 2010 Samuel L. Baker Assessing how good the regression equation is likely to be Assignment 1A gets into drawing inferences about how close the
Study Guide for the Final Exam
 Study Guide for the Final Exam When studying, remember that the computational portion of the exam will only involve new material (covered after the second midterm), that material from Exam 1 will make
Elementary Statistics Sample Exam #3
 Elementary Statistics Sample Exam #3 Instructions. No books or telephones. Only the supplied calculators are allowed. The exam is worth 100 points. 1. A chi square goodness of fit test is considered to
POLYNOMIAL AND MULTIPLE REGRESSION. Polynomial regression used to fit nonlinear (e.g. curvilinear) data into a least squares linear regression model.
 data into a least squares linear regression model.") Polynomial Regression POLYNOMIAL AND MULTIPLE REGRESSION Polynomial regression used to fit nonlinear (e.g. curvilinear) data into a least squares linear regression model. It is a form of linear regression
Polynomial Regression POLYNOMIAL AND MULTIPLE REGRESSION Polynomial regression used to fit nonlinear (e.g. curvilinear) data into a least squares linear regression model. It is a form of linear regression
Two Related Samples t Test
 Two Related Samples t Test In this example 1 students saw five pictures of attractive people and five pictures of unattractive people. For each picture, the students rated the friendliness of the person
Chapter 2 Probability Topics SPSS T tests
 Chapter 2 Probability Topics SPSS T tests Data file used: gss.sav In the lecture about chapter 2, only the One-Sample T test has been explained. In this handout, we also give the SPSS methods to perform
1. What is the critical value for this 95% confidence interval? CV = z.025 = invnorm(0.025) = 1.96
 = 1.96") 1 Final Review 2 Review 2.1 CI 1-propZint Scenario 1 A TV manufacturer claims in its warranty brochure that in the past not more than 10 percent of its TV sets needed any repair during the first two years
1 Final Review 2 Review 2.1 CI 1-propZint Scenario 1 A TV manufacturer claims in its warranty brochure that in the past not more than 10 percent of its TV sets needed any repair during the first two years
Session 7 Bivariate Data and Analysis
 Session 7 Bivariate Data and Analysis Key Terms for This Session Previously Introduced mean standard deviation New in This Session association bivariate analysis contingency table co-variation least squares
X X X a) perfect linear correlation b) no correlation c) positive correlation (r = 1) (r = 0) (0 < r < 1)
 perfect linear correlation b) no correlation c) positive correlation (r = 1) (r = 0) (0 < r < 1)") CORRELATION AND REGRESSION / 47 CHAPTER EIGHT CORRELATION AND REGRESSION Correlation and regression are statistical methods that are commonly used in the medical literature to compare two or more variables.
CORRELATION AND REGRESSION / 47 CHAPTER EIGHT CORRELATION AND REGRESSION Correlation and regression are statistical methods that are commonly used in the medical literature to compare two or more variables.
Module 5: Statistical Analysis
 Module 5: Statistical Analysis To answer more complex questions using your data, or in statistical terms, to test your hypothesis, you need to use more advanced statistical tests. This module reviews the
Class 19: Two Way Tables, Conditional Distributions, Chi-Square (Text: Sections 2.5; 9.1)
") Spring 204 Class 9: Two Way Tables, Conditional Distributions, Chi-Square (Text: Sections 2.5; 9.) Big Picture: More than Two Samples In Chapter 7: We looked at quantitative variables and compared the
Spring 204 Class 9: Two Way Tables, Conditional Distributions, Chi-Square (Text: Sections 2.5; 9.) Big Picture: More than Two Samples In Chapter 7: We looked at quantitative variables and compared the
Introduction to Regression and Data Analysis
 Statlab Workshop Introduction to Regression and Data Analysis with Dan Campbell and Sherlock Campbell October 28, 2008 I. The basics A. Types of variables Your variables may take several forms, and it
Chapter Seven. Multiple regression An introduction to multiple regression Performing a multiple regression on SPSS
 Chapter Seven Multiple regression An introduction to multiple regression Performing a multiple regression on SPSS Section : An introduction to multiple regression WHAT IS MULTIPLE REGRESSION? Multiple
Univariate Regression
 Univariate Regression Correlation and Regression The regression line summarizes the linear relationship between 2 variables Correlation coefficient, r, measures strength of relationship: the closer r is
MULTIPLE REGRESSION AND ISSUES IN REGRESSION ANALYSIS
 MULTIPLE REGRESSION AND ISSUES IN REGRESSION ANALYSIS MSR = Mean Regression Sum of Squares MSE = Mean Squared Error RSS = Regression Sum of Squares SSE = Sum of Squared Errors/Residuals α = Level of Significance
CORRELATION ANALYSIS
 CORRELATION ANALYSIS Learning Objectives Understand how correlation can be used to demonstrate a relationship between two factors. Know how to perform a correlation analysis and calculate the coefficient
INTERPRETING THE ONE-WAY ANALYSIS OF VARIANCE (ANOVA)
") INTERPRETING THE ONE-WAY ANALYSIS OF VARIANCE (ANOVA) As with other parametric statistics, we begin the one-way ANOVA with a test of the underlying assumptions. Our first assumption is the assumption of
INTERPRETING THE ONE-WAY ANALYSIS OF VARIANCE (ANOVA) As with other parametric statistics, we begin the one-way ANOVA with a test of the underlying assumptions. Our first assumption is the assumption of
Example: Boats and Manatees
 Figure 9-6 Example: Boats and Manatees Slide 1 Given the sample data in Table 9-1, find the value of the linear correlation coefficient r, then refer to Table A-6 to determine whether there is a significant
Bivariate Statistics Session 2: Measuring Associations Chi-Square Test
 Bivariate Statistics Session 2: Measuring Associations Chi-Square Test Features Of The Chi-Square Statistic The chi-square test is non-parametric. That is, it makes no assumptions about the distribution
This chapter will demonstrate how to perform multiple linear regression with IBM SPSS
 CHAPTER 7B Multiple Regression: Statistical Methods Using IBM SPSS This chapter will demonstrate how to perform multiple linear regression with IBM SPSS first using the standard method and then using the
Chapter 13 Introduction to Linear Regression and Correlation Analysis
 Chapter 3 Student Lecture Notes 3- Chapter 3 Introduction to Linear Regression and Correlation Analsis Fall 2006 Fundamentals of Business Statistics Chapter Goals To understand the methods for displaing
CALCULATIONS & STATISTICS
 CALCULATIONS & STATISTICS CALCULATION OF SCORES Conversion of 1-5 scale to 0-100 scores When you look at your report, you will notice that the scores are reported on a 0-100 scale, even though respondents
Outline. Topic 4 - Analysis of Variance Approach to Regression. Partitioning Sums of Squares. Total Sum of Squares. Partitioning sums of squares
 Topic 4 - Analysis of Variance Approach to Regression Outline Partitioning sums of squares Degrees of freedom Expected mean squares General linear test - Fall 2013 R 2 and the coefficient of correlation
EPS 625 INTERMEDIATE STATISTICS FRIEDMAN TEST
 EPS 625 INTERMEDIATE STATISTICS The Friedman test is an extension of the Wilcoxon test. The Wilcoxon test can be applied to repeated-measures data if participants are assessed on two occasions or conditions
Descriptive Statistics
 Descriptive Statistics Primer Descriptive statistics Central tendency Variation Relative position Relationships Calculating descriptive statistics Descriptive Statistics Purpose to describe or summarize
Independent t- Test (Comparing Two Means)
") Independent t- Test (Comparing Two Means) The objectives of this lesson are to learn: the definition/purpose of independent t-test when to use the independent t-test the use of SPSS to complete an independent
Independent t- Test (Comparing Two Means) The objectives of this lesson are to learn: the definition/purpose of independent t-test when to use the independent t-test the use of SPSS to complete an independent
Regression Analysis: A Complete Example
 Regression Analysis: A Complete Example This section works out an example that includes all the topics we have discussed so far in this chapter. A complete example of regression analysis. PhotoDisc, Inc./Getty
Simple linear regression
 Simple linear regression Introduction Simple linear regression is a statistical method for obtaining a formula to predict values of one variable from another where there is a causal relationship between
THE KRUSKAL WALLLIS TEST
 THE KRUSKAL WALLLIS TEST TEODORA H. MEHOTCHEVA Wednesday, 23 rd April 08 THE KRUSKAL-WALLIS TEST: The non-parametric alternative to ANOVA: testing for difference between several independent groups 2 NON
The Dummy s Guide to Data Analysis Using SPSS
 The Dummy s Guide to Data Analysis Using SPSS Mathematics 57 Scripps College Amy Gamble April, 2001 Amy Gamble 4/30/01 All Rights Rerserved TABLE OF CONTENTS PAGE Helpful Hints for All Tests...1 Tests
Chapter 5 Analysis of variance SPSS Analysis of variance
 Chapter 5 Analysis of variance SPSS Analysis of variance Data file used: gss.sav How to get there: Analyze Compare Means One-way ANOVA To test the null hypothesis that several population means are equal,
Section 13, Part 1 ANOVA. Analysis Of Variance
 Section 13, Part 1 ANOVA Analysis Of Variance Course Overview So far in this course we ve covered: Descriptive statistics Summary statistics Tables and Graphs Probability Probability Rules Probability
Scatter Plot, Correlation, and Regression on the TI-83/84
 Scatter Plot, Correlation, and Regression on the TI-83/84 Summary: When you have a set of (x,y) data points and want to find the best equation to describe them, you are performing a regression. This page
Non-Parametric Tests (I)
") Lecture 5: Non-Parametric Tests (I) KimHuat LIM lim@stats.ox.ac.uk http://www.stats.ox.ac.uk/~lim/teaching.html Slide 1 5.1 Outline (i) Overview of Distribution-Free Tests (ii) Median Test for Two Independent
Lecture 5: Non-Parametric Tests (I) KimHuat LIM lim@stats.ox.ac.uk http://www.stats.ox.ac.uk/~lim/teaching.html Slide 1 5.1 Outline (i) Overview of Distribution-Free Tests (ii) Median Test for Two Independent
II. DISTRIBUTIONS distribution normal distribution. standard scores
 Appendix D Basic Measurement And Statistics The following information was developed by Steven Rothke, PhD, Department of Psychology, Rehabilitation Institute of Chicago (RIC) and expanded by Mary F. Schmidt,
Additional sources Compilation of sources: http://lrs.ed.uiuc.edu/tseportal/datacollectionmethodologies/jin-tselink/tselink.htm
 Mgt 540 Research Methods Data Analysis 1 Additional sources Compilation of sources: http://lrs.ed.uiuc.edu/tseportal/datacollectionmethodologies/jin-tselink/tselink.htm http://web.utk.edu/~dap/random/order/start.htm
We are often interested in the relationship between two variables. Do people with more years of full-time education earn higher salaries?
 Statistics: Correlation Richard Buxton. 2008. 1 Introduction We are often interested in the relationship between two variables. Do people with more years of full-time education earn higher salaries? Do
UNDERSTANDING THE DEPENDENT-SAMPLES t TEST
 UNDERSTANDING THE DEPENDENT-SAMPLES t TEST A dependent-samples t test (a.k.a. matched or paired-samples, matched-pairs, samples, or subjects, simple repeated-measures or within-groups, or correlated groups)
Part 2: Analysis of Relationship Between Two Variables
 Part 2: Analysis of Relationship Between Two Variables Linear Regression Linear correlation Significance Tests Multiple regression Linear Regression Y = a X + b Dependent Variable Independent Variable
Correlations. MSc Module 6: Introduction to Quantitative Research Methods Kenneth Benoit. March 18, 2010
 Correlations MSc Module 6: Introduction to Quantitative Research Methods Kenneth Benoit March 18, 2010 Relationships between variables In previous weeks, we have been concerned with describing variables
LINEAR INEQUALITIES. less than, < 2x + 5 x 3 less than or equal to, greater than, > 3x 2 x 6 greater than or equal to,
 LINEAR INEQUALITIES When we use the equal sign in an equation we are stating that both sides of the equation are equal to each other. In an inequality, we are stating that both sides of the equation are
Question 2: How do you solve a matrix equation using the matrix inverse?
 Question : How do you solve a matrix equation using the matrix inverse? In the previous question, we wrote systems of equations as a matrix equation AX B. In this format, the matrix A contains the coefficients
2 Sample t-test (unequal sample sizes and unequal variances)
") Variations of the t-test: Sample tail Sample t-test (unequal sample sizes and unequal variances) Like the last example, below we have ceramic sherd thickness measurements (in cm) of two samples representing
Variations of the t-test: Sample tail Sample t-test (unequal sample sizes and unequal variances) Like the last example, below we have ceramic sherd thickness measurements (in cm) of two samples representing
Roadmap to Data Analysis. Introduction to the Series, and I. Introduction to Statistical Thinking-A (Very) Short Introductory Course for Agencies
 Short Introductory Course for Agencies") Roadmap to Data Analysis Introduction to the Series, and I. Introduction to Statistical Thinking-A (Very) Short Introductory Course for Agencies Objectives of the Series Roadmap to Data Analysis Provide
Roadmap to Data Analysis Introduction to the Series, and I. Introduction to Statistical Thinking-A (Very) Short Introductory Course for Agencies Objectives of the Series Roadmap to Data Analysis Provide
A full analysis example Multiple correlations Partial correlations
 A full analysis example Multiple correlations Partial correlations New Dataset: Confidence This is a dataset taken of the confidence scales of 41 employees some years ago using 4 facets of confidence (Physical,
2013 MBA Jump Start Program. Statistics Module Part 3
 2013 MBA Jump Start Program Module 1: Statistics Thomas Gilbert Part 3 Statistics Module Part 3 Hypothesis Testing (Inference) Regressions 2 1 Making an Investment Decision A researcher in your firm just
Data Analysis for Marketing Research - Using SPSS
 North South University, School of Business MKT 63 Marketing Research Instructor: Mahmood Hussain, PhD Data Analysis for Marketing Research - Using SPSS Introduction In this part of the class, we will learn
Statistical tests for SPSS
 Statistical tests for SPSS Paolo Coletti A.Y. 2010/11 Free University of Bolzano Bozen Premise This book is a very quick, rough and fast description of statistical tests and their usage. It is explicitly
A Primer on Forecasting Business Performance
 A Primer on Forecasting Business Performance There are two common approaches to forecasting: qualitative and quantitative. Qualitative forecasting methods are important when historical data is not available.
Odds ratio, Odds ratio test for independence, chi-squared statistic.
 Odds ratio, Odds ratio test for independence, chi-squared statistic. Announcements: Assignment 5 is live on webpage. Due Wed Aug 1 at 4:30pm. (9 days, 1 hour, 58.5 minutes ) Final exam is Aug 9. Review
COMPARISONS OF CUSTOMER LOYALTY: PUBLIC & PRIVATE INSURANCE COMPANIES.
 277 CHAPTER VI COMPARISONS OF CUSTOMER LOYALTY: PUBLIC & PRIVATE INSURANCE COMPANIES. This chapter contains a full discussion of customer loyalty comparisons between private and public insurance companies
DATA INTERPRETATION AND STATISTICS
 PholC60 September 001 DATA INTERPRETATION AND STATISTICS Books A easy and systematic introductory text is Essentials of Medical Statistics by Betty Kirkwood, published by Blackwell at about 14. DESCRIPTIVE
Correlational Research. Correlational Research. Stephen E. Brock, Ph.D., NCSP EDS 250. Descriptive Research 1. Correlational Research: Scatter Plots
 Correlational Research Stephen E. Brock, Ph.D., NCSP California State University, Sacramento 1 Correlational Research A quantitative methodology used to determine whether, and to what degree, a relationship
MULTIPLE REGRESSION EXAMPLE
 MULTIPLE REGRESSION EXAMPLE For a sample of n = 166 college students, the following variables were measured: Y = height X 1 = mother s height ( momheight ) X 2 = father s height ( dadheight ) X 3 = 1 if
Interaction between quantitative predictors
 Interaction between quantitative predictors In a first-order model like the ones we have discussed, the association between E(y) and a predictor x j does not depend on the value of the other predictors
This can dilute the significance of a departure from the null hypothesis. We can focus the test on departures of a particular form.
 One-Degree-of-Freedom Tests Test for group occasion interactions has (number of groups 1) number of occasions 1) degrees of freedom. This can dilute the significance of a departure from the null hypothesis.
UNDERSTANDING ANALYSIS OF COVARIANCE (ANCOVA)
") UNDERSTANDING ANALYSIS OF COVARIANCE () In general, research is conducted for the purpose of explaining the effects of the independent variable on the dependent variable, and the purpose of research design
UNDERSTANDING ANALYSIS OF COVARIANCE () In general, research is conducted for the purpose of explaining the effects of the independent variable on the dependent variable, and the purpose of research design
1) Write the following as an algebraic expression using x as the variable: Triple a number subtracted from the number
 Write the following as an algebraic expression using x as the variable: Triple a number subtracted from the number") 1) Write the following as an algebraic expression using x as the variable: Triple a number subtracted from the number A. 3(x - x) B. x 3 x C. 3x - x D. x - 3x 2) Write the following as an algebraic expression
1) Write the following as an algebraic expression using x as the variable: Triple a number subtracted from the number A. 3(x - x) B. x 3 x C. 3x - x D. x - 3x 2) Write the following as an algebraic expression
Introduction to Hypothesis Testing. Hypothesis Testing. Step 1: State the Hypotheses
 Introduction to Hypothesis Testing 1 Hypothesis Testing A hypothesis test is a statistical procedure that uses sample data to evaluate a hypothesis about a population Hypothesis is stated in terms of the
Categorical Data Analysis
 Richard L. Scheaffer University of Florida The reference material and many examples for this section are based on Chapter 8, Analyzing Association Between Categorical Variables, from Statistical Methods
Simple Linear Regression, Scatterplots, and Bivariate Correlation
 1 Simple Linear Regression, Scatterplots, and Bivariate Correlation This section covers procedures for testing the association between two continuous variables using the SPSS Regression and Correlate analyses.
Ordinal Regression. Chapter
 Ordinal Regression Chapter 4 Many variables of interest are ordinal. That is, you can rank the values, but the real distance between categories is unknown. Diseases are graded on scales from least severe
Formula for linear models. Prediction, extrapolation, significance test against zero slope.
 Formula for linear models. Prediction, extrapolation, significance test against zero slope. Last time, we looked the linear regression formula. It s the line that fits the data best. The Pearson correlation
DEPARTMENT OF PSYCHOLOGY UNIVERSITY OF LANCASTER MSC IN PSYCHOLOGICAL RESEARCH METHODS ANALYSING AND INTERPRETING DATA 2 PART 1 WEEK 9
 DEPARTMENT OF PSYCHOLOGY UNIVERSITY OF LANCASTER MSC IN PSYCHOLOGICAL RESEARCH METHODS ANALYSING AND INTERPRETING DATA 2 PART 1 WEEK 9 Analysis of covariance and multiple regression So far in this course,
Linear Models in STATA and ANOVA
 Session 4 Linear Models in STATA and ANOVA Page Strengths of Linear Relationships 4-2 A Note on Non-Linear Relationships 4-4 Multiple Linear Regression 4-5 Removal of Variables 4-8 Independent Samples
Correlation and Regression Analysis: SPSS
 Correlation and Regression Analysis: SPSS Bivariate Analysis: Cyberloafing Predicted from Personality and Age These days many employees, during work hours, spend time on the Internet doing personal things,
Overview of Factor Analysis
 Overview of Factor Analysis Jamie DeCoster Department of Psychology University of Alabama 348 Gordon Palmer Hall Box 870348 Tuscaloosa, AL 35487-0348 Phone: (205) 348-4431 Fax: (205) 348-8648 August 1,
HYPOTHESIS TESTING WITH SPSS:
 HYPOTHESIS TESTING WITH SPSS: A NON-STATISTICIAN S GUIDE & TUTORIAL by Dr. Jim Mirabella SPSS 14.0 screenshots reprinted with permission from SPSS Inc. Published June 2006 Copyright Dr. Jim Mirabella CHAPTER
Premaster Statistics Tutorial 4 Full solutions
 Premaster Statistics Tutorial 4 Full solutions Regression analysis Q1 (based on Doane & Seward, 4/E, 12.7) a. Interpret the slope of the fitted regression = 125,000 + 150. b. What is the prediction for
Introduction to Hypothesis Testing
 I. Terms, Concepts. Introduction to Hypothesis Testing A. In general, we do not know the true value of population parameters - they must be estimated. However, we do have hypotheses about what the true
Analysing Questionnaires using Minitab (for SPSS queries contact -) Graham.Currell@uwe.ac.uk
 Graham.Currell@uwe.ac.uk") Analysing Questionnaires using Minitab (for SPSS queries contact -) Graham.Currell@uwe.ac.uk Structure As a starting point it is useful to consider a basic questionnaire as containing three main sections:
Analysing Questionnaires using Minitab (for SPSS queries contact -) Graham.Currell@uwe.ac.uk Structure As a starting point it is useful to consider a basic questionnaire as containing three main sections:
Chapter 23. Inferences for Regression
 Chapter 23. Inferences for Regression Topics covered in this chapter: Simple Linear Regression Simple Linear Regression Example 23.1: Crying and IQ The Problem: Infants who cry easily may be more easily
Covariance and Correlation
 Covariance and Correlation ( c Robert J. Serfling Not for reproduction or distribution) We have seen how to summarize a data-based relative frequency distribution by measures of location and spread, such
Independent samples t-test. Dr. Tom Pierce Radford University
 Independent samples t-test Dr. Tom Pierce Radford University The logic behind drawing causal conclusions from experiments The sampling distribution of the difference between means The standard error of
An analysis appropriate for a quantitative outcome and a single quantitative explanatory. 9.1 The model behind linear regression
 Chapter 9 Simple Linear Regression An analysis appropriate for a quantitative outcome and a single quantitative explanatory variable. 9.1 The model behind linear regression When we are examining the relationship
Factor Analysis. Principal components factor analysis. Use of extracted factors in multivariate dependency models
 Factor Analysis Principal components factor analysis Use of extracted factors in multivariate dependency models 2 KEY CONCEPTS ***** Factor Analysis Interdependency technique Assumptions of factor analysis
Multiple Linear Regression
 Multiple Linear Regression A regression with two or more explanatory variables is called a multiple regression. Rather than modeling the mean response as a straight line, as in simple regression, it is
Multicollinearity Richard Williams, University of Notre Dame, http://www3.nd.edu/~rwilliam/ Last revised January 13, 2015
 Multicollinearity Richard Williams, University of Notre Dame, http://www3.nd.edu/~rwilliam/ Last revised January 13, 2015 Stata Example (See appendices for full example).. use http://www.nd.edu/~rwilliam/stats2/statafiles/multicoll.dta,
Multiple Regression. Page 24
 Multiple Regression Multiple regression is an extension of simple (bi-variate) regression. The goal of multiple regression is to enable a researcher to assess the relationship between a dependent (predicted)
Doing Multiple Regression with SPSS. In this case, we are interested in the Analyze options so we choose that menu. If gives us a number of choices:
 Doing Multiple Regression with SPSS Multiple Regression for Data Already in Data Editor Next we want to specify a multiple regression analysis for these data. The menu bar for SPSS offers several options:
Mgmt 469. Regression Basics. You have all had some training in statistics and regression analysis. Still, it is useful to review
 Mgmt 469 Regression Basics You have all had some training in statistics and regression analysis. Still, it is useful to review some basic stuff. In this note I cover the following material: What is a regression
KSTAT MINI-MANUAL. Decision Sciences 434 Kellogg Graduate School of Management
 KSTAT MINI-MANUAL Decision Sciences 434 Kellogg Graduate School of Management Kstat is a set of macros added to Excel and it will enable you to do the statistics required for this course very easily. To
Regression and Correlation
 Regression and Correlation Topics Covered: Dependent and independent variables. Scatter diagram. Correlation coefficient. Linear Regression line. by Dr.I.Namestnikova 1 Introduction Regression analysis
Binary Logistic Regression
 Binary Logistic Regression Main Effects Model Logistic regression will accept quantitative, binary or categorical predictors and will code the latter two in various ways. Here s a simple model including
A STUDY ON ONBOARDING PROCESS IN SIFY TECHNOLOGIES, CHENNAI
 A STUDY ON ONBOARDING PROCESS IN SIFY TECHNOLOGIES, CHENNAI ABSTRACT S. BALAJI*; G. RAMYA** *Assistant Professor, School of Management Studies, Surya Group of Institutions, Vikravandi 605652, Villupuram