LIST OF CONTENTS AND TABLES
|
|
|
- Philomena Norris
- 7 years ago
- Views:
Transcription
1
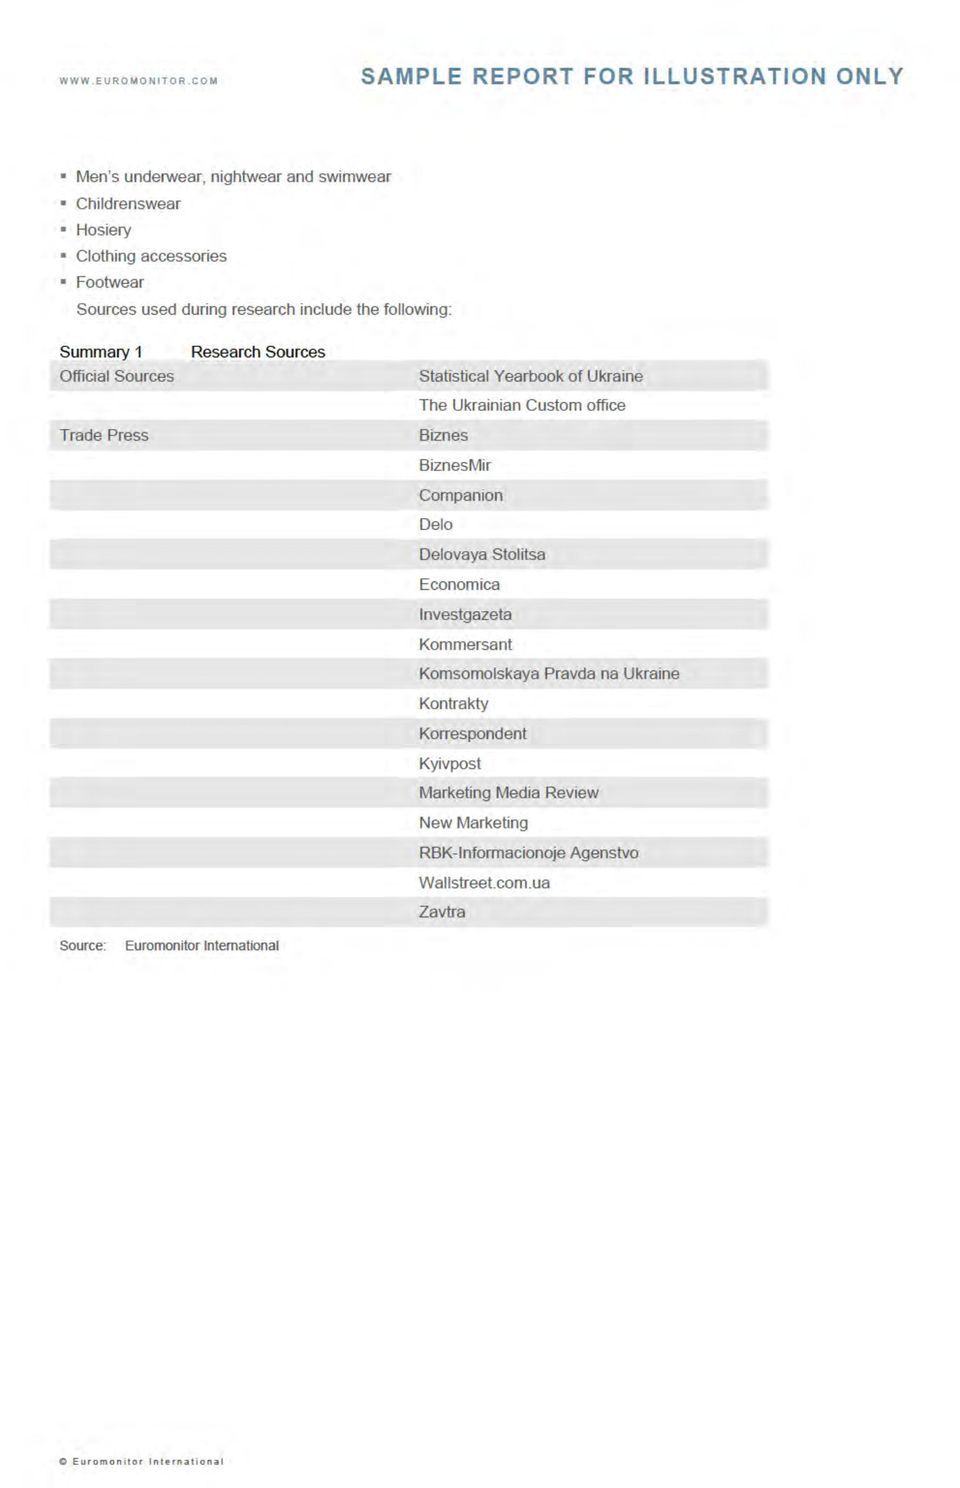
2 LIST OF CONTENTS AND TABLES Apparel in Ukraine - Industry Overview... 1 Executive Summary... 1 Recovery of Apparel Market Begins... 1 Slow Shift Towards Modern Retail... 1 State Focuses on Unofficial Imports... 1 Expansion of New Apparel Specialist Brands Slows Down... 1 Further Apparel Market Development on the Way... 2 Key Trends and Developments... 2 Slow Recovery From Economic Recession... 2 Growing Cotton Prices Influence To Ukrainian Apparel Market... 3 Domestic Producers Look To Specialisation in Order To Compete... 3 Logistical Obstacles Limit Expansion To Country s Regions... 4 Slow Development of Apparel s Internet Retailing... 4 Market Data... 5 Table 1 Sales of Apparel by Category: Volume Table 2 Sales of Apparel by Category: Value Table 3 Sales of Apparel by Category: % Volume Growth Table 4 Sales of Apparel by Category: % Value Growth Table 5 Apparel Company Shares Table 6 Apparel Brand Shares Table 7 Sales of Apparel by Distribution Format: % Analysis Table 8 Sales of Apparel by Category and Distribution Format: % Analysis Table 9 Forecast Sales of Apparel by Category: Volume Table 10 Forecast Sales of Apparel by Category: Value Table 11 Forecast Sales of Apparel by Category: % Volume Growth Table 12 Forecast Sales of Apparel by Category: % Value Growth Definitions... 9 Summary 1 Research Sources Apparel in Ukraine - Company Profiles Adidas Ukrayina Dp in Apparel (ukraine) Strategic Direction Key Facts Summary 2 Adidas Ukraina DP: Key Facts Company Background Production Competitive Positioning Summary 3 Adidas Ukraina DP: Competitive Position Internet Strategy Argo-torgovelna Merezha Tov in Apparel (ukraine) Strategic Direction Key Facts Summary 4 ARGO-Torgovelna Merezha TOV: Key Facts Company Background... 13

3 Production Competitive Positioning Summary 5 ARGO-Torgovelna Merezha TOV: Competitive Position Internet Strategy Delta Sport Tov in Apparel (ukraine) Strategic Direction Key Facts Summary 6 Delta Sport Ukraina TOV: Key Facts Company Background Production Competitive Positioning Summary 7 Delta Sport Ukraina TOV: Competitive Position Internet Strategy Intertop Tov in Apparel (ukraine) Strategic Direction Key Facts Summary 8 Intertop TOV: Key Facts Summary 9 Intertop TOV: Operational Indicators Company Background Production Competitive Positioning Summary 10 Intertop TOV: Competitive Position Internet Strategy Marateks Dp in Apparel (ukraine) Strategic Direction Key Facts Summary 11 Marateks DP: Key Facts Summary 12 Maratex DP: Operational Indicators Company Background Production Competitive Positioning Summary 13 Marateks DP: Competitive Position Internet Strategy Mikhail Voronin Td in Apparel (ukraine) Strategic Direction Key Facts Summary 14 Sela Ukraina TOV: Key Facts Summary 15 Sela Ukraina TOV : Operational Indicators Company Background Production Competitive Positioning Internet Strategy Royal Shoes Tov in Apparel (ukraine) Strategic Direction Key Facts... 23

4 Summary 16 Royal Shoes TOV: Key Facts Summary 17 Royal Shoes TOV: Operational Indicators Company Background Production Competitive Positioning Summary 18 Royal Shoes TOV: Competitive Position Internet Strategy Sela Ukraina Ooo in Apparel (ukraine) Strategic Direction Key Facts Summary 19 MIKHAIL VORONIN TD: Key Facts Company Background Production Competitive Positioning Ultra-jins, Tov in Apparel (ukraine) Strategic Direction Key Facts Summary 20 Ultra-Jins TOV: Key Facts Company Background Production Competitive Positioning Summary 21 Ultra-Jins TOV: Competitive Position Internet Strategy Zara Ukraina Tov in Apparel (ukraine) Strategic Direction Key Facts Summary 22 ZARA Ukraina TOV: Key Facts Summary 23 ZARA Ukraina TOV: Operational Indicators Company Background Production Competitive Positioning Summary 24 ZARA Ukraina TOV: Competitive Position Internet Strategy Childrenswear in Ukraine - Category analysis Headlines Trends Competitive Landscape Prospectss Category Data Table 13 Sales of Childrenswear by Category: Volume Table 14 Sales of Childrenswear by Category: Value Table 15 Sales of Childrenswear by Category: % Volume Growth Table 16 Sales of Childrenswear by Category: % Value Growth Table 17 Childrenswear Company Shares Table 18 Childrenswear Brand Shares Table 19 Sales of Childrenswear by Distr bution Format: % Analysis

5 Table 20 Forecast Sales of Childrenswear by Category: Volume Table 21 Forecast Sales of Childrenswear by Category: Value Table 22 Forecast Sales of Childrenswear by Category: % Volume Growth Table 23 Forecast Sales of Childrenswear by Category: % Value Growth Clothing Accessories in Ukraine - Category analysis Headlines Trends Competitive Landscape Prospects Category Data Table 24 Sales of Clothing Accessories by Category: Volume Table 25 Sales of Clothing Accessories by Category: Value Table 26 Sales of Clothing Accessories by Category: % Volume Growth Table 27 Sales of Clothing Accessories by Category: % Value Growth Table 28 Clothing Accessories Company Shares Table 29 Clothing Accessories Brand Shares Table 30 Sales of Clothing Accessories by Distribution Format: % Analysis Table 31 Forecast Sales of Clothing Accessories by Category: Volume Table 32 Forecast Sales of Clothing Accessories by Category: Value Table 33 Forecast Sales of Clothing Accessories by Category: % Volume Growth Table 34 Forecast Sales of Clothing Accessories by Category: % Value Growth Hosiery in Ukraine - Category analysis Headlines Trends Competitive Landscape Prospects Category Data Table 35 Sales of Hosiery by Category: Volume Table 36 Sales of Hosiery by Category: Value Table 37 Sales of Hosiery by Category: % Volume Growth Table 38 Sales of Hosiery by Category: % Value Growth Table 39 Hosiery Company Shares Table 40 Hosiery Brand Shares Table 41 Sales of Hosiery by Distribution Format: % Analysis Table 42 Forecast Sales of Hosiery by Category: Volume Table 43 Forecast Sales of Hosiery by Category: Value Table 44 Forecast Sales of Hosiery by Category: % Volume Growth Table 45 Forecast Sales of Hosiery by Category: % Value Growth Men's Outerwear in Ukraine - Category analysis Headlines... 49

6 Trends Competitive Landscape Prospects Category Data Table 46 Apparel Size Chart for Men: (Mikhail Voronin, Jeans) Table 47 Apparel Size Chart for Men: (Domestic, No-name Brand, Coats & Jackets) Table 48 Apparel Size Chart for Men: (Domestic, No-name Brand, Sports Shirt) Table 49 Sales of Men s Outerwear: Volume Table 50 Sales of Men s Outerwear: Value Table 51 Sales of Men s Outerwear: % Volume Growth Table 52 Sales of Men s Outerwear: % Value Growth Table 53 Men s Outerwear Company Shares Table 54 Men s Outerwear Brand Shares Table 55 Sales of Men s Outerwear by Distribution Format: % Analysis Table 56 Forecast Sales of Men s Outerwear: Volume Table 57 Forecast Sales of Men s Outerwear: Value Table 58 Forecast Sales of Men s Outerwear: % Volume Growth Table 59 Forecast Sales of Men s Outerwear: % Value Growth Men's Jeans in Ukraine - Category analysis Headlines Trends Competitive Landscape Prospects Category Data Table 60 Sales of Men s Jeans: Volume Table 61 Sales of Men s Jeans: Value Table 62 Sales of Men s Jeans: % Volume Growth Table 63 Sales of Men s Jeans: % Value Growth Table 64 Sales of Men s Jeans by Type: % Volume Breakdown Table 65 Sales of Men s Jeans by Type: % Value Breakdown Table 66 Men s Jeans Company Shares Table 67 Men s Jeans Brand Shares Table 68 Forecast Sales of Men s Jeans: Volume Table 69 Forecast Sales of Men s Jeans: Value Table 70 Forecast Sales of Men s Jeans: % Volume Growth Table 71 Forecast Sales of Men s Jeans: % Value Growth Men's Underwear, Nightwear and Swimwear in Ukraine - Category analysis Headlines Trends Competitive Landscape Prospects Category Data Table 72 Table 73 Sales of Men s Underwear, Nightwear and Swimwear by Category: Volume Sales of Men s Underwear, Nightwear and Swimwear by Category: Value

7 Table 74 Sales of Men s Underwear, Nightwear and Swimwear by Category: % Volume Growth Table 75 Sales of Men s Underwear, Nightwear and Swimwear by Category: % Value Growth Table 76 Men s Underwear, Nightwear and Swimwear Company Shares Table 77 Men s Underwear, Nightwear and Swimwear Brand Shares Table 78 Sales of Men s Underwear, Nightwear and Swimwear by Distribution Format: % Analysis Table 79 Forecast Sales of Men s Underwear, Nightwear and Swimwear by Category: Volume Table 80 Forecast Sales of Men s Underwear, Nightwear and Swimwear by Category: Value Table 81 Forecast Sales of Men s Underwear, Nightwear and Swimwear by Category: % Volume Growth Table 82 Forecast Sales of Men s Underwear, Nightwear and Swimwear by Category: % Value Growth Women's Outerwear in Ukraine - Category analysis Headlines Trends Competitive Landscape Prospects Category Data Table 83 Apparel Size Chart for Women: (No-name Brand, Jackets) Table 84 Apparel Size Chart for Women: (No-name Brand, Jeans) Table 85 Apparel Size Chart for Women: (No-name Brand, Women's underwear) Table 86 Sales of Women s Outerwear: Volume Table 87 Sales of Women s Outerwear: Value Table 88 Sales of Women s Outerwear: % Volume Growth Table 89 Sales of Women s Outerwear: % Value Growth Table 90 Women s Outerwear Company Shares Table 91 Women s Outerwear Brand Shares Table 92 Sales of Women s Outerwear by Distribution Format: % Analysis Table 93 Forecast Sales of Women s Outerwear: Volume Table 94 Forecast Sales of Women s Outerwear: Value Table 95 Forecast Sales of Women s Outerwear: % Volume Growth Table 96 Forecast Sales of Women s Outerwear: % Value Growth Women's Jeans in Ukraine - Category analysis Headlines Trends Competitive Landscape Prospects Category Data Table 97 Sales of Women s Jeans: Volume Table 98 Sales of Women s Jeans: Value Table 99 Sales of Women s Jeans: % Volume Growth

8 Table 100 Sales of Women s Jeans: % Value Growth Table 101 Sales of Women s Jeans by Type: % Volume Breakdown Table 102 Sales of Women s Jeans by Type: % Value Breakdown Table 103 Women s Jeans Company Shares Table 104 Women s Jeans Brand Shares Table 105 Forecast Sales of Women s Jeans: Volume Table 106 Forecast Sales of Women s Jeans: Value Table 107 Forecast Sales of Women s Jeans: % Volume Growth Table 108 Forecast Sales of Women s Jeans: % Value Growth Women's Underwear, Nightwear and Swimwear in Ukraine - Category analysis Headlines Trends Competitive Landscape Prospects Category Data Table 109 Sales of Women s Underwear, Nightwear and Swimwear by Category: Volume Table 110 Sales of Women s Underwear, Nightwear and Swimwear by Category: Value Table 111 Sales of Women s Underwear, Nightwear and Swimwear by Category: % Volume Growth Table 112 Sales of Women s Underwear, Nightwear and Swimwear by Category: % Value Growth Table 113 Women s Underwear, Nightwear and Swimwear Company Shares Table 114 Women s Underwear, Nightwear and Swimwear Brand Shares Table 115 Sales of Women s Underwear, Nightwear and Swimwear by Distribution Format: % Analysis Table 116 Forecast Sales of Women s Underwear, Nightwear and Swimwear by Category: Volume Table 117 Forecast Sales of Women s Underwear, Nightwear and Swimwear by Category: Value Table 118 Forecast Sales of Women s Underwear, Nightwear and Swimwear by Category: % Volume Growth Table 119 Forecast Sales of Women s Underwear, Nightwear and Swimwear by Category: % Value Growth Footwear in Ukraine - Category analysis Headlines Trends Competitive Landscape Prospects Category Data Table 120 Sales of Footwear by Category: Volume Table 121 Sales of Footwear by Category: Value Table 122 Sales of Footwear by Category: % Volume Growth Table 123 Sales of Footwear by Category: % Value Growth Table 124 Footwear Company Shares Table 125 Footwear Brand Shares

9 Table 126 Sales of Footwear by Distribution Format: % Analysis Table 127 Forecast Sales of Footwear by Category: Volume Table 128 Forecast Sales of Footwear by Category: Value Table 129 Forecast Sales of Footwear by Category: % Volume Growth Table 130 Forecast Sales of Footwear by Category: % Value Growth

10 APPAREL IN UKRAINE - INDUSTRY OVERVIEW EXECUTIVE SUMMARY Recovery of Apparel Market Begins The recent economic recession noticeably affected the Ukrainian apparel market. Almost all brands and product group sales in volume and value terms dropped except those of some premium brands which target consumers who are less sensitive to the impact of recession. In 2010, the apparel market started its way towards recovery due, according to national statistics, to recovering disposable incomes, growing consumer confidence and delayed purchases for more expensive products. Value sales were additionally boosted by increased prices and slow shifting towards modern retail. However, volume sales were still way below pre-crisis levels. Men s apparel (underwear, outerwear and footwear) value sales showed the best performance in 2010, as its target audience was the most solvent. Slow Shift Towards Modern Retail Branded apparel remains expensive for a majority of Ukrainian consumers and low price remains very important to Ukrainians. Most people still purchase clothes at open markets, which is the biggest distr bution channel for apparel, and second-hand stores are still very popular. The recent recession helped to hold strong positions for these retail channels. Despite that, modern retail is developing and the share of clothing and footwear specialist retailers gradually expanded over the review period at the expense of open markets, mainly thanks to citizens of large cities. Expansion of such outlets supported by promotional campaigns combined with general cultural westernisation underpins this switch. State Focuses on Unofficial Imports During the review period, the majority of apparel in Ukraine was imported under various shadow schemes devoted to avoiding taxes. Most often, the value of imported goods was largely underestimated; for example, fashionable apparel was imported as second-hand goods during the process of customs declaration. Usually it was done with the knowledge of corrupt customs officers. Such schemes created a competitive advantage for illegal importers, stimulated corruption and lost the country huge amounts of unpaid taxes. In 2010, the State Customs Administration started changing its approach to unofficial proceedings during clearance, which in the long term should facilitate a more transparently functioning apparel market. However, it is not very likely that illegal import schemes will disappear in the short term. Expansion of New Apparel Specialist Brands Slows Down The Ukrainian apparel specialist retailing market is far from saturated, which allows current operators to set high margins and at the same time keep a big share of price-sensitive consumers switching from shopping at the open markets. The main obstacles for new companies to enter the market are administrative barriers, industry s opacity and poor logistics infrastructure. Imperfect legislation is a key factor, too: a great number of controlling bodies, sophisticated accounting paperwork requirements and unpredictable customs are amongst the main hampering factors. Additionally there are not enough modern shopping malls where retailers can open their outlets, a lack that has resulted in higher rental prices in existing ones.

11 The economic recession caused large multinational brands to postpone expansion or entrance to Ukrainian market even more, which gave additional support for current players development. Despite that, there were some noticeable entrants in 2010 such as New Look and Finn Flarre, and GAP announced about plans to enter Ukraine in Further Apparel Market Development on the Way Ukrainian apparel market value has strong potential for growth over the long term, considering the currently huge share of open markets and second-hand stores operating in this market. This puts Ukraine on the radar of all major international brands. Over the forecast period, many international companies are expected to enter this market, where competition is still not too strong and there is a lack of branded products. On other hand, they are concerned about still relatively low purchasing power of Ukrainians and possible political instability, which has delayed their investments in the past. However, expansion of apparel specialist retailers, followed by promotional campaigns combined with growing consumer purchasing power inevitably will lead to the apparel market growth. KEY TRENDS AND DEVELOPMENTS Slow Recovery From Economic Recession Current Impact Outlook

12 Future Impact Growing Cotton Prices Influence To Ukrainian Apparel Market A cotton supply crisis that originated in Asia caused raw material prices to grow significantly in This increased production cost of domestic apparel, making competition against cheap imported products even more difficult. Current Impact Outlook Future Impact Domestic Producers Look To Specialisation in Order To Compete Current Impact

13 Outlook Future Impact Logistical Obstacles Limit Expansion To Country s Regions Current Impact Outlook Future Impact

14 Current Impact Outlook Future Impact MARKET DATA Table 1 Sales of Apparel by Category: Volume mn units Clothing Footwear Apparel Table 2 Sales of Apparel by Category: Value UAH million Clothing Footwear Apparel

15 Table 3 Sales of Apparel by Category: % Volume Growth % volume growth Clothing Footwear Apparel 2009/ CAGR 2005/10 Total Table 4 Sales of Apparel by Category: % Value Growth % current value growth Clothing Footwear Apparel 2009/ CAGR 2005/10 Total Table 5 Apparel Company Shares % retail value rsp Company Total Table 6 Apparel Brand Shares % retail value rsp Brand Company

16 Total Table 7 Sales of Apparel by Distribution Format: % Analysis % retail value rsp Store-Based Retailing - Grocery Retailers - Non-Grocery Retailers - - Mixed Retailers Department Stores Mass Merchandisers Variety Stores Warehouse Clubs - - Clothing and footwear specialist retailers - - Leisure and Personal Goods Specialist Retailers Sports goods stores Other Leisure and Personal Goods Specialist Retailers - - Other Non-Grocery Retailers Non-Store Retailing - Homeshopping - Internet Retailing - Direct Selling - Vending Total Table 8 Sales of Apparel by Category and Distribution Format: % Analysis 2010 % retail value rsp Store-Based Retailing Grocery Retailers C CW CA H MO MU

17 Non-Grocery Retailers Mixed Retailers Department Stores Mass Merchandisers Variety Stores Warehouse Clubs Clothing and footwear specialist retailers Leisure and Personal Goods Specialist Retailers Sports goods stores Other Leisure and Personal Goods Specialist Retailers Other Non-Grocery Retailers Non-Store Retailing Homeshopping Internet Retailing Direct Selling Vending Total WO WU F Store-Based Retailing Grocery Retailers Non-Grocery Retailers Mixed Retailers Department Stores Mass Merchandisers Variety Stores Warehouse Clubs Clothing and footwear specialist retailers Leisure and Personal Goods Specialist Retailers Sports goods stores Other Leisure and Personal Goods Specialist Retailers Other Non-Grocery Retailers Non-Store Retailing Homeshopping Internet Retailing Direct Selling Vending Total Key: C = clothing; CW = childrenswear; CA = clothing accessories; H = hosiery; MO = men s outerwear; MU = men's underwear, nightwear and swimwear; WO = women's outerwear; WU = women's underwear, nightwear and swimwear; F = footwear Table 9 Forecast Sales of Apparel by Category: Volume

18 mn units Clothing Footwear Apparel Euromonitor International from trade associations, trade press, company research, trade interviews, trade sources Table 10 Forecast Sales of Apparel by Category: Value UAH million Clothing Footwear Apparel Euromonitor International from trade associations, trade press, company research, trade interviews, trade sources Table 11 Forecast Sales of Apparel by Category: % Volume Growth % volume growth Clothing Footwear Apparel 2014/ CAGR 2010/15 Total Euromonitor International from trade associations, trade press, company research, trade interviews, trade sources Table 12 Forecast Sales of Apparel by Category: % Value Growth % constant value growth Clothing Footwear Apparel CAGR 2010/15 TOTAL Euromonitor International from trade associations, trade press, company research, trade interviews, trade sources DEFINITIONS This report analyses the market for Apparel in Ukraine. For the purposes of the study, the market has been defined as follows: Women s jeans Women s outerwear Men s jeans Men s outerwear Women s underwear, nightwear and swimwear

19
20
21
22
23
24
25
26
27
28
29
30
31 Company Background Production Competitive Positioning
32
33
34
35 Company Background Controlling stock of production plant PAO Shveina Fabryka Voronin belongs to Mikhail Voronin. Michael Voronin is the most famous Ukrainian fashion designer. He obtained wide recognition thanks to his invention of the unique vest model method of suit tailoring without fitting. Production Competitive Positioning ULTRA-JINS, TOV IN APPAREL (UKRAINE) Strategic Direction
36
37
38
39
40 CHILDRENSWEAR IN UKRAINE - CATEGORY ANALYSIS HEADLINES In 2010 volume sales see marginal increase and current value sales increase by 14% Childrenswear suffers the least amongst all clothing categories during the recession, and accordingly demonstrates lower recovery growth rates in 2010 Baby and toddler wear is the prominent category in both volume and value terms, up by 2% and 18%, respectively Unit prices increase by 13% to UAH126 With unsatisfactory number of retail outlets and product assortments, competition in this category is considered not strong Over the forecast period childrenswear is expected to grow at a volume CAGR of 6% and a constant value CAGR of 8% TRENDS In 2010 childrenswear did not show a quick recovery, as growth of volume sales was marginal. Most Ukrainian families are very price sensitive regarding children s clothing, as children outgrow their clothes very quickly. This leads to high popularity of cheap products and second-hand clothes shops. The market was also mildly affected by slightly decreased birth rate. The dominance of positive moods amongst purchasers of girls clothing (resulting in volume sales rising by 1% compared with 2009) could be explained by the natural proportion of girls born amongst newborn babies and traditionally higher average girls wardrobe volume (number of goods bought). Baby and toddler wear showed the best performance inside the category (2% volume growth in 2010). Parents look for more quality clothes, as they consider babies health a higher priority than some other of the family s everyday needs. Boys apparel dropped by 1% in volume sales and in 2010 accounted for 39% of childrenswear. The average childrenswear unit price grew by 13% to UAH126, but the price increase for boys clothing was less (10%) than the price increases for baby and toddler wear and girls clothing (about 17% in both categories). It is worth noting that the average price of baby and toddler clothing is about three times cheaper (by approximately UAH44) than girls and boys clothing (UAH ). Distribution channel structure displays a weak transition to modern retail formats: the value share of clothing and footwear specialist retailers is slowly growing (26% in 2010), however, mostly at the expense of dominating other non-grocery retailers (61% in 2010). At the same time the value share of grocery stores is also increasing (3% in 2010) due to high demand for cheap childrenswear. Share of grocery retailers expected to grow further, as now it is limited by a small product assortment. All these channels additionally have to compete with secondhand stores, which account for a significant market share, but not covered by Euromonitor International research.
41 COMPETITIVE LANDSCAPE The Ukrainian childrenswear market is very fragmented and dominated by inexpensive products, as parents do not want to spend much on clothes that will not be worn for a long time. The branded products segment is relatively small with dominance of well-advertised international brands sold at special departments of existing stores oriented for an adult audience. However, none of the leading brands exceeds even a 2% value share in overall childrenswear. Well-established N ke is the leading brand with a 2% value share followed by combination of brands primarily represented by Marateks DP and adidas. PROSPECTSS Over the forecast period through 2015 childrenswear is expected to demonstrate impressive growth, ignoring the recession s influence. Volume sales are expected to increase at a 6% CAGR and constant value sales are expected to increase at an 8% CAGR over this time period.
42 CATEGORY DATA Table 1 Sales of Childrenswear by Category: Volume '000 units Boys' Clothing Girls' Clothing Baby and Toddler Wear Childrenswear Table 2 Sales of Childrenswear by Category: Value UAH million Boys' Clothing Girls' Clothing Baby and Toddler Wear Childrenswear,,,,,, Table 3 Sales of Childrenswear by Category: % Volume Growth % volume growth Boys' Clothing 2009/ CAGR 2005/10 Total
43 Girls' Clothing Baby and Toddler Wear Childrenswear Table 4 Sales of Childrenswear by Category: % Value Growth % current value growth Boys' Clothing Girls' Clothing Baby and Toddler Wear Childrenswear 2009/ CAGR 2005/10 Total Table 5 Childrenswear Company Shares % retail value rsp Company Total Table 6 Childrenswear Brand Shares % retail value rsp Brand Company Total
44 Table 7 Sales of Childrenswear by Distribution Format: % Analysis % retail value rsp Store-Based Retailing - Grocery Retailers - Non-Grocery Retailers - - Mixed Retailers Department Stores Mass Merchandisers Variety Stores Warehouse Clubs - - Clothing and footwear specialist retailers - - Leisure and Personal Goods Specialist Retailers Sports goods stores Other Leisure and Personal Goods Specialist Retailers - - Other Non-Grocery Retailers Non-Store Retailing - Homeshopping - Internet Retailing - Direct Selling - Vending Total Table 8 Forecast Sales of Childrenswear by Category: Volume '000 units Boys' Clothing Girls' Clothing Baby and Toddler Wear Childrenswear Euromonitor International from trade associations, trade press, company research, trade interviews, trade sources Table 9 Forecast Sales of Childrenswear by Category: Value UAH million Boys' Clothing Girls' Clothing Baby and Toddler Wear Childrenswear
45 Euromonitor International from trade associations, trade press, company research, trade interviews, trade sources Table 10 Forecast Sales of Childrenswear by Category: % Volume Growth % volume growth Boys' Clothing Girls' Clothing Baby and Toddler Wear Childrenswear 2014/ CAGR 2010/15 Total Euromonitor International from trade associations, trade press, company research, trade interviews, trade sources Table 11 Forecast Sales of Childrenswear by Category: % Value Growth % constant value growth Boys' Clothing Girls' Clothing Baby and Toddler Wear Childrenswear CAGR 2010/15 TOTAL Euromonitor International from trade associations, trade press, company research, trade interviews, trade sources
46 CLOTHING ACCESSORIES IN UKRAINE - CATEGORY ANALYSIS HEADLINES In 2010 sales of clothing accessories increase by 4% and 17% in volume and value, respectively Slowly recovering incomes allow consumers to renew their wardrobe in line with domestic fashion trends and own purchasing capabilities With 9% volume sales increase other clothing accessories registers higher growth than other product groups Unit prices grow in line with macroeconomic trends to cover expenses for source materials, as accessories are mainly produced outside of Ukraine Competition remains tough, but average market value of UAH2.1 billion and excessive fragmentation do not allow active promotion Clothing accessories is expected to grow at a volume CAGR of 6% and at a constant value CAGR of 7% over the forecast period TRENDS In 2010 volume sales of clothing accessories increased by 4%, and current value sales grew by 17%. Clothing accessories is one of the smallest apparel categories, representing 8% of the total clothing market in volume terms, and 7% in value terms. Women are the main drivers of clothing accessories sales, as they are influenced by fashion trends much more than men are and in general have a wider wardrobe. Men also do buy accessories, but they do it much more rarely. Clothing accessories is at or nearing the stage of primary saturation in Ukraine, especially in the economy segment. Accessories trading developed despite the economic crisis instability through sales in small stores (or even temporary selling points) operating on streets or similar places with high concentrations of consumer traffic, such as underground passageways. According to industry representatives, accessories sales have seasonal fluctuation. The seasonal peak is from April-September, when 60-70% of accessories are sold. Some premium accessories were sold only before Christmas/New Year holidays, very often as gifts. Nevertheless, accessories remain highly marginal goods with more than average profitability. The fastest volume growth in 2010 was demonstrated by other clothing accessories (up by 9%) due to sporadic marketing activities of small producers and growing demand for cheap uncommon products, such as arm warmers or sleeves. Other categories demonstrated volume growth ranging from 3-4% and current value growth ranging from 14-19%. In all, the category started to recover from crisis with 4% growth in units in 2010, but the absolute level of peak, 2007 sales will not be reached before The majority of small domestic producers of accessories operate in the shadow market to avoid taxes and overall bureaucratic hassle, which helps to keep production costs low. Some of those producers are individuals producing small quantities at home. Such producers mostly make hand-sewn accessories, apparel decorations, handbags and the like. Up to 60% of
47 domestically produced clothing accessories including the type of shadow market accessories are exported. The average unit price of clothing accessories grew by UAH11 or 13% to reach UAH98 per unit in Unit price growth was a result of increasing raw materials costs and other factors influenced by relatively high inflation. Accessory pricing was aimed at reaching some level of profitability rather than at capturing market share: commonly, people buy accessories as a present or as a substitution for a spoiled one. Considering that clothing accessories have a lifetime that is longer than that of other apparel and that buyers are less influenced by fashion trends when purchasing accessories, traders saw good sales volumes with slack attention paid to price. Other non-grocery retailers (open markets and street stalls) still accounts for the highest value share of 65% amongst distribution channels, but shows a trend towards further shrinkage to the benefit of store-based retailing. Clothing and footwear specialist retailers boasted a 22% value share and grocery retailers increased its share to 6% in 2010, thanks to a widening assortment, economy prices and expanding number of chained outlets. In non-store retailing, internet retailing and sports good stores also saw slight upticks in value share in COMPETITIVE LANDSCAPE Obviously, the clothing accessories market is very fragmented due to there being so many different product types covered in this category and so many small producers. Overall, the biggest volumes of sales were achieved by small no-name and domestic producers selling relatively cheap products. PROSPECTS Over the forecast period clothing accessories is expected to grow at a volume CAGR of 6% and at a constant value CAGR of 7%. This will translate to a market size of 29 million units and UAH2.9 billion. Increasing disposable incomes and accordingly growing spending will be the main reasons driving sectors growth. Additionally growth will be supported by expansion and entrance of well-known branded stores such as Zara, Mango, Gap and others.
48 CATEGORY DATA Table 1 Sales of Clothing Accessories by Category: Volume '000 units Belts Gloves Hats/Caps Scarves Ties Other Clothing Accessories Clothing Accessories Table 2 Sales of Clothing Accessories by Category: Value UAH million Belts Gloves Hats/Caps Scarves Ties Other Clothing Accessories Clothing Accessories Table 3 Sales of Clothing Accessories by Category: % Volume Growth
49 % volume growth Belts Gloves Hats/Caps Scarves Ties Other Clothing Accessories Clothing Accessories 2009/ CAGR 2005/10 Total Table 4 Sales of Clothing Accessories by Category: % Value Growth % current value growth Belts Gloves Hats/Caps Scarves Ties Other Clothing Accessories Clothing Accessories 2009/ CAGR 2005/10 Total Table 5 Clothing Accessories Company Shares % retail value rsp Company Total Table 6 Clothing Accessories Brand Shares % retail value rsp Brand Company
50 Total Table 7 Sales of Clothing Accessories by Distribution Format: % Analysis % retail value rsp Store-Based Retailing - Grocery Retailers - Non-Grocery Retailers - - Mixed Retailers Department Stores Mass Merchandisers Variety Stores Warehouse Clubs - - Clothing and footwear specialist retailers - - Leisure and Personal Goods Specialist Retailers Sports goods stores Other Leisure and Personal Goods Specialist Retailers - - Other Non-Grocery Retailers Non-Store Retailing - Homeshopping - Internet Retailing - Direct Selling - Vending Total Table 8 Forecast Sales of Clothing Accessories by Category: Volume '000 units Belts Gloves Hats/Caps Scarves Ties Other Clothing Accessories Clothing Accessories
51 Euromonitoar International from trade associations, trade press, company research, trade interviews, trade sources Table 9 Forecast Sales of Clothing Accessories by Category: Value UAH million Belts Gloves Hats/Caps Scarves Ties Other Clothing Accessories Clothing Accessories,,,,,, Euromonitoar International from trade associations, trade press, company research, trade interviews, trade sources Table 10 Forecast Sales of Clothing Accessories by Category: % Volume Growth % volume growth Belts Gloves Hats/Caps Scarves Ties Other Clothing Accessories Clothing Accessories 2014/ CAGR 2010/15 Total Euromonitoar International from trade associations, trade press, company research, trade interviews, trade sources Table 11 Forecast Sales of Clothing Accessories by Category: % Value Growth % constant value growth Belts Gloves Hats/Caps Scarves Ties Other Clothing Accessories Clothing Accessories CAGR 2010/15 TOTAL Euromonitoar International from trade associations, trade press, company research, trade interviews, trade sources
52 HOSIERY IN UKRAINE - CATEGORY ANALYSIS HEADLINES Volume sales of hosiery grow by 4% and current value sales by 17% in 2010 Open markets (other non-grocery retailers) remain the most common channel for sales of hosiery Other hosiery shows slightly faster growth (up by 4% in volume and 18% in value) in 2010 than socks and tights Average unit price grew by 13% to UAH17 in 2010 Several importers lead in standard and premium segments, while local producers and noname economy production from Asia drives other sales Volume and constant value sales of hosiery, which are everyday usage goods, are expected to increase at CAGRs of 7% and 9%, respectively over forecast period TRENDS Volume sales of hosiery increased by 4% in 2010, whilst current value sales increased by 17%. Due to the low average prices, this segment represented 20% of the total Ukrainian clothes market in volume terms, but only 3% in value terms. Socks, reaching 4% volume growth, remained largest product group in volume terms with 30 million units sold, representing 54% of hosiery sales. Obviously, socks is an essential product, regardless of income or economic situation. However, tights accounted for the highest sales of UAH440 million, or 46% of all hosiery sales in Tights were the sphere of dominance of Chinese producers in the economy segment; Polish and other European ones were active in mid-range and premium segments. Fashion trends touched hosiery only during recent years ( ) when certain products, such as leg warmers or special socks became fashionable attributes amongst sports or fitness fans. Earlier it was an apparel category consumers tried to save money on. Hosiery has a wide representation in different distribution channels, as it has also become a product of impulsive purchase. In 2010 volume sales of socks, tights and other hosiery increased by 4%, following doubledigit declines seen during , which had mainly affected sales of the more expensive. It is important to mention value sales of hosiery overall showed quite another picture: a 9% decline for category in 2009 was converted into 17% current value growth in This resulted from unit price increases caused by high inflation, increased production costs and a slow shift towards shopping in modern retail outlets. Average unit price of socks reached UAH11 per pair in 2010, tights cost up to UAH22 and other hosiery rose to UAH33. The dominant value share of hosiery products 65% is sold via other non-grocery retailers, usually in open stalls, as quality requirements for such products are low and the main purchase factor is low price. Over the review period, this channel saw its value share slowly decrease due to a slow shift towards modern retail outlets. Clothing and footwear specialist retailers accounted for the second highest (19%) value share as it continued to experience
53 the growth trend. Grocery retailers held a growing value share of 7%, which is a higher sales share than this channel has in any other type of apparel. COMPETITIVE LANDSCAPE adidas Ukrayina brands lost value share in 2010, but remained leading brand family on the Ukrainian hosiery market. Company s sales come from sports socks considered as premium hosiery, priced from UAH20-40 per pair. The further development of adidas brand indicates that adidas Ukrayina will be amongst the leaders in the premium hosiery segment during the forecast period, but its overall value share should be decreasing due competition from cheaper products. PROSPECTS Over the forecast period, hosiery will experience tough competition between strong domestic producers and cheap imported brands (especially Chinese ones). This should be beneficial to customers, as it will often lead to a decrease in prices for some promoted goods types.
54 CATEGORY DATA Table 1 Sales of Hosiery by Category: Volume '000 units Socks Tights Other Hosiery Hosiery Table 2 Sales of Hosiery by Category: Value UAH million Socks Tights Other Hosiery Hosiery Table 3 Sales of Hosiery by Category: % Volume Growth % volume growth Socks Tights Other Hosiery Hosiery 2009/ CAGR 2005/10 Total Table 4 Sales of Hosiery by Category: % Value Growth % current value growth Socks Tights Other Hosiery Hosiery 2009/ CAGR 2005/10 Total
55 Table 5 Hosiery Company Shares % retail value rsp Company Total Table 6 Hosiery Brand Shares % retail value rsp Brand Company Total Table 7 Sales of Hosiery by Distribution Format: % Analysis % retail value rsp Store-Based Retailing - Grocery Retailers - Non-Grocery Retailers - - Mixed Retailers Department Stores Mass Merchandisers Variety Stores Warehouse Clubs - - Clothing and footwear specialist retailers - - Leisure and Personal Goods Specialist Retailers Sports goods stores Other Leisure and Personal Goods Specialist Retailers
56 - - Other Non-Grocery Retailers Non-Store Retailing - Homeshopping - Internet Retailing - Direct Selling - Vending Total Table 8 Forecast Sales of Hosiery by Category: Volume '000 units Socks Tights Other Hosiery Hosiery,,,,,, Euromonitor International from trade associations, trade press, company research, trade interviews, trade sources Table 9 Forecast Sales of Hosiery by Category: Value UAH million Socks Tights Other Hosiery Hosiery Euromonitor International from trade associations, trade press, company research, trade interviews, trade sources Table 10 Forecast Sales of Hosiery by Category: % Volume Growth % volume growth Socks Tights Other Hosiery Hosiery 2014/ CAGR 2010/15 Total Euromonitor International from trade associations, trade press, company research, trade interviews, trade sources Table 11 Forecast Sales of Hosiery by Category: % Value Growth % constant value growth Socks CAGR 2010/15 TOTAL
57 Tights Other Hosiery Hosiery Euromonitor International from trade associations, trade press, company research, trade interviews, trade sources
58 MEN'S OUTERWEAR IN UKRAINE - CATEGORY ANALYSIS HEADLINES With 7% volume growth and 18% current value growth, 2010 is the first year showing positive growth for men s outerwear after two years of significant volume declines and one year of current value decline Increased consumer income partially combined with resumption of delayed purchases drives the market Men s suits, jumpers and shirts have highest current value growth and are the most demanded goods because of convenience and practicality for everyday usage Unit prices increase by 10% to UAH237, as affordability remains a key factor when considering a purchase Competition is characterised by oscillating shares of domestic licensees of famous global brands and strivings of local producers to survive Men s outerwear expected to see sales increase at CAGRs ranging from 4-6% in volume and from 5-8% in constant value TRENDS Men s outerwear remained unsaturated, reflecting some demand decrease. The economic crisis did present an opportunity for domestic players to develop: international retail chains are not expected to appear earlier than State Statistics has reported that some domestic operators have started to realise the possibilities: for example, production of knitted clothes rose by 2% and suits went up by 13%in Value sales of domestic producers averaged 5% growth in However, despite this growth domestic companies are not expected to recover their previous positions, as they cannot compete with imported economy products by price, or with imported branded products having the advantages of fashionable designers, brands status and marketing support. In 2010 men s outerwear reached 7% growth in volume and 18% in current value sales. Intensified consumer spending due to higher incomes and resumption of previously delayed purchases of products types such as suits, coats and sometimes jeans, were pushing volume sales up. Inflation caused product prices to increase and this, combined with slow up trading, contributed to higher value sales. Men s outerwear was driven mostly by demand from young men with higher interest in shopping. Men are usually much more realistic when buying new clothes, and only rarely purchase apparel on impulse or after seeing an advert. However, a noticeable share of men s outerwear is bought by their women, especially amongst older adults. A large and still growing part of local production of men s outerwear in Ukraine has been oriented towards filling external orders rather than toward domestic demand, as Ukrainian customers have turned to imported apparel made from cheaper fabric leading to lower prices. Cheap imported apparel (including sports apparel) originating from China/Turkey was mostly sold at markets (bazaars). Despite being of lower (but satisfactory for the most of population) quality and unable to suit professional requirements (sports, tourism) these imports are very
59 popular due to their low prices. Sports apparel in Ukraine is popular to wear not only when exercising, but also during leisure time and at home. Sports fashion in Ukraine is quite conservative, with people, especially younger ones, opting for well-known brands such as Nike or adidas. Such brands in a large part of society remain social status symbols. However, for many Ukrainians original products for these brands are not affordable, so they opt for widely available fake copies. Within men s outerwear, suits showed strongest performance with 9% volume and 23% value growth. Suits are usually worn by consumers with higher than average incomes and level of incomes in this group recovered faster compared to that of average consumers, which contributed to this value growth. Additionally, during the recession some people postponed purchases of suits, one of the most expensive men s outerwear pieces, until better times. Resumption of such delayed purchases contr buted to noticeable suits growth in Sales of premium men s outwear products and most expensive clothing products in general were strongly hurt during the recession. When experiencing demand shrinkage traders optimised and stocked only popular category models. As a result, sales of expensive outerwear were occurred mostly in big cities. In 2010, excluding sales of suits, sales of the more expensive types of men s outerwear in general recovered much more slowly than sales of average men s outerwear, as consumers are more cautious about where and on what to spend. For example wool products were substituted by cheaper textile products. Men s jacket and coats the most expensive outerwear category showed negative growth by -1% in volume terms in Women s jackets, coats and suits experienced the highest unit price growth (UAH45-60 on average) in 2010 compared with that of other men s outerwear products. It was caused by a plenty of factors with an accent on lower men s demand sensitivity to those product groups prices. All mentioned product groups were the most expensive goods in the category with average price (UAH498 and UAH433, respectively). COMPETITIVE LANDSCAPE Nike brand was slightly ahead of adidas in 2010, with each holding a value share of 3%. Both brands success is attributable to widely recognisable brand names, wide distribution networks and substantial marketing support. Adidas expected to meet some troubles in the forecast period due to its decision to change retail format (open more own brand stores) in the Ukrainian market. The company will switch to own store development instead of cooperating with domestic retail chains.
LIST OF CONTENTS AND TABLES
 LIST OF CONTENTS AND TABLES in Morocco - Category analysis... 1 Headlines... 1 Trends... 1 Competitive Landscape... 2 Prospects... 3 Category Data... 4 Table 1 Machine Sales: 2005-2010... 4 Table 2 Retail
List of Contents and Tables
 List of Contents and Tables PERSONAL GOODS IN SWEDEN... 1 Executive Summary... 1 Sales of Personal Goods Unaffected by Global Crisis... 1 Sales in More Sectors Driven by Well-known Brands... 1 Swedish
LIST OF CONTENTS AND TABLES
 LIST OF CONTENTS AND TABLES Baby Care in the United Arab Emirates - Category analysis... 1 Headlines... 1 Trends... 1 Competitive Landscape... 2 Prospects... 3 Category Data... 3 Table 1 Sales of Baby
LIST OF CONTENTS AND TABLES
 LIST OF CONTENTS AND TABLES Away-from-home Tissue and Hygiene in Thailand - Category analysis... 1 Headlines... 1 Trends... 1 Competitive Landscape... 2 Prospects... 2 Category Data... 3 Table 1 Away-From-Home
LIST OF CONTENTS AND TABLES
 LIST OF CONTENTS AND TABLES Oral Care in the United Arab Emirates - Category analysis... 1 Headlines... 1 Trends... 1 Competitive Landscape... 1 Prospects... 2 Category Data... 2 Table 1 Sales of Oral
LIST OF CONTENTS AND TABLES
 LIST OF CONTENTS AND TABLES Fruit/vegetable Juice in South Korea - Category analysis... 1 Headlines... 1 Trends... 1 Competitive Landscape... 2 Prospects... 2 Category Data... 3 Table 1 Off-trade Sales
LIST OF CONTENTS AND TABLES
 LIST OF CONTENTS AND TABLES Bottled Water in South Korea - Category analysis... 1 Headlines... 1 Trends... 1 Competitive Landscape... 2 Prospects... 2 Category Data... 3 Institutional Bottled Water Sales...
LIST OF CONTENTS AND TABLES
 LIST OF CONTENTS AND TABLES Dog Food in Taiwan - Category analysis... 1 Headlines... 1 Trends... 1 Competitive Landscape... 2 Prospects... 3 Category Indicators... 4 Table 1 Dog Owning Households: % Analysis
LIST OF CONTENTS AND TABLES
 LIST OF CONTENTS AND TABLES Apparel Specialist Retailers in Italy - Category analysis... 1 Headlines... 1 Trends... 1 Channel Formats... 3 Chart 1 Apparel Specialist Retailers: Stefanel in Padova... 3
List of Contents and Tables
 List of Contents and Tables HERBAL/TRADITIONAL PRODUCTS IN SWEDEN - CATEGORY ANALYSIS... 1 Headlines... 1 Trends... 1 Competitive Landscape... 2 Prospects... 2 Category Data... 3 Table 1 Sales of Products:
LIST OF CONTENTS AND TABLES
 LIST OF CONTENTS AND TABLES Mobile Phones in the Netherlands - Category analysis... 1 Headlines... 1 Trends... 1 Competitive Landscape... 2 Prospects... 3 Category Data... 4 Table 1 Sales of Mobile Phones:
LIST OF CONTENTS AND TABLES
 LIST OF CONTENTS AND TABLES Sports and Energy Drinks in South Korea - Category analysis... 1 Headlines... 1 Trends... 1 Competitive Landscape... 2 Prospects... 2 Category Data... 3 Table 1 Still vs Carbonated
LIST OF CONTENTS AND TABLES
 LIST OF CONTENTS AND TABLES Rtd Coffee in South Korea - Category analysis... 1 Headlines... 1 Trends... 1 Competitive Landscape... 2 Prospects... 2 Category Data... 3 Table 1 Off-trade Sales of : Volume
LIST OF CONTENTS AND TABLES
 LIST OF CONTENTS AND TABLES Direct Selling in Italy - Category analysis... 1 Headlines... 1 Trends... 1 Competitive Landscape... 1 Prospects... 2 Channel Data... 2 Table 1 Direct Selling by Category: Value
LIST OF CONTENTS AND TABLES
 LIST OF CONTENTS AND TABLES Health and Beauty Specialist Retailers in Italy - Category analysis... 1 Headlines... 1 Trends... 1 Competitive Landscape... 2 Prospects... 3 Channel Data... 4 Table 1 Health
List of Contents and Tables
 List of Contents and Tables ANALGESICS IN SWEDEN - CATEGORY ANALYSIS... 1 Headlines... 1 Trends... 1 Switches... 2 Competitive Landscape... 2 Prospects... 3 Category Data... 3 Table 1 Sales of Analgesics
Direct Selling in the US
 Brochure More information from http://www.researchandmarkets.com/reports/1542416/ Direct Selling in the US Description: Value sales through direct selling increased by just 1% in 2014 amid struggles from
The Research of Vancl Network Marketing
 The Research of Vancl Network Marketing WU Zhonghua School of Business Administration, Jiangxi University of Finance and Economics, China, 330013 13870916825@163.com Abstract: In recent years, the garment
LIST OF CONTENTS AND TABLES
 LIST OF CONTENTS AND TABLES Internet in Italy - Category analysis... 1 Headlines... 1 Trends... 1 Competitive Landscape... 2 Prospects... 2 Channel Data... 3 Table 1 Internet by Category: Value 2006-2011...
FASHION MERCHANDISING AND MARKETING EVENT PARTICIPANT INSTRUCTIONS
 CAREER CLUSTER Marketing CAREER PATHWAY Merchandising INSTRUCTIONAL AREA Channel Management FASHION MERCHANDISING AND MARKETING EVENT PARTICIPANT INSTRUCTIONS PROCEDURES 1. The event will be presented
Retailing in the Philippines
 Brochure More information from http://www.researchandmarkets.com/reports/354797/ Retailing in the Philippines Description: The significant growth in the private sector, which includes many businesses operating
LIST OF CONTENTS AND TABLES
 LIST OF CONTENTS AND TABLES Breakfast Cereals in Argentina - Category analysis... 1 Headlines... 1 Trends... 1 Competitive Landscape... 2 Prospects... 2 Category Data... 3 Table 1 Sales of Breakfast Cereals
Burberry Group plc. Second Half Trading Update
 14 April 2016 Burberry Group plc Second Half Trading Update Highlights for the six months to 31 March 2016 Total revenue 1,410m, down 1% underlying Retail revenue 1,064m, unchanged year-on-year underlying
LIST OF CONTENTS AND TABLES
 LIST OF CONTENTS AND TABLES Soft Drinks in South Korea - Industry Overview... 1 Executive Summary... 1 Premiumisation Leads Healthy Growth... 1 Health and Wellness Continues To Attract Consumers... 1 Two
Grocery Retailers in Turkey
 Brochure More information from http://www.researchandmarkets.com/reports/1668358/ Grocery Retailers in Turkey Description: Grocery retailers registers a slightly higher growth than 2013 in current value
INDUSTRY OVERVIEW SOURCE OF INFORMATION. Report prepared by Euromonitor
 The information that appears in this Industry Overview has been prepared by Euromonitor International Limited and reflects estimates of market conditions based on publicly available sources and trade opinion
Delivery Matters. Understanding the needs of online shoppers in the USA in 2015. USA Edition
 Home Delivery Matters Leading Insight Online Shopping Delivery Matters Understanding the needs of online shoppers in the in 2015 Home > Delivery Matters > Contents Home > Delivery Matters > Welcome Contents
Procurement Outsourcing Services¹
 Procurement Outsourcing Services¹ The following overview of the procurement outsourcing services in Australia is mainly based on the information provided by IBISWorld and consists of additional information
Turkey: Retail & Consumer Update
 Turkey: Retail & Consumer Update CCI & Cotton Incorporated s Global Lifestyle Monitor Survey Marsha Powell Director, Turkey Consumer Economic & Spending Outlook Outlook Towards Personal Financial Situation
The Role of the Fashion Buyer
 Chapter 2 The buying role differs between companies but all fashion buyers are responsible for overseeing the development of a range of products aimed at a specific type of customer and price bracket.
Growth of E-commerce in Fashion Businesses
 Growth of E-commerce in Fashion Businesses By Amit Gugnani, Sr. VP - Fashion & Sakshi Chhillar, Associate Consultant, Textile and Apparel, Technopak THE INDIAN RETAIL INDUSTRY WITNESSED A BOLSTERED GROWTH
The rapid growth of online shopping is driving structural changes in the retail model
 Australian online shopping market and digital insights An executive overview July The rapid growth of online shopping is driving structural changes in the retail model pwc.com.au Executive overview The
STATS WINDOW. Retail industry
 Volume 8, Issue 4, October 2015 STATS WINDOW The Pacific Business Review International has taken an initiative to start a section which will provide a snapshot of major Global & Indian economic indicators
Made in Greece. Having taken the Greek market by storm with its. Folli Follie makes a global statement
 GREECE REPORT Folli Follie October/November 2005 Made in Greece Folli Follie makes a global statement By Martin Moodie Folli Follie is one of the luxury industry s most unlikely success stories the tale
LIST OF CONTENTS AND TABLES
 LIST OF CONTENTS AND TABLES Pet Care in Taiwan - Industry Overview... 1 Executive Summary... 1 Market Size Booms Due To Higher Volume Growth and Increasing Unit Prices... 1 Pet Demographic Shift Leads
The Future of Retailing in UK to 2015
 Brochure More information from http://www.researchandmarkets.com/reports/1533374/ The Future of Retailing in UK to Description: Synopsis This report provides uniquely detailed data on the size and development
FNB HOME BUYING ESTATE AGENT SURVEY 4 th QUARTER 2012
 22 January 203 JOHN LOOS: HOUSEHOLD AND CONSUMER SECTOR STRATEGIST 0-6902 John.loos@fnb.co.za THEO SWANEPOEL: PROPERTY MARKET ANALYST FNB ASSET FINANCE 0-632060 tswanepoel@fnb.co.za The information in
WHAT WILL WE MAKE OF THIS MOMENT? HENKEL SHOWER PROJECT: MARKETING CAMPAIGN FOCUSED ON SUSTAINABILITY
 WHAT WILL WE MAKE OF THIS MOMENT? HENKEL SHOWER PROJECT: MARKETING CAMPAIGN FOCUSED ON SUSTAINABILITY Exploring Sustainability as a Strategic Opportunity (08.05.2015) Anastasia Lavrentyeva, Davide Bramati,
PERIPHERAL ACTIVITIES Fashion photography Hair care and cosmetics Accessories Perfumes Modelling
 designer fashion PERIPHERAL ACTIVITIES Fashion photography Hair care and cosmetics Accessories Perfumes Modelling RELATED ACTIVITIES Magazine publishing Design education Graphic design Product design CORE
商 业 计 划 书 BUSINESS PLAN PROPOSAL
 商 业 计 划 书 BUSINESS PLAN PROPOSAL 关 于 国 际 服 装 服 饰 品 牌 引 进 及 推 广 商 业 计 划 书 International Fashion & Accessories Brands Introduction and Promotion Business Plan Proposal 大 连 东 北 亚 国 际 品 牌 商 品 交 易 中 心 Dalian
Grocery Retailers in Hungary
 Brochure More information from http://www.researchandmarkets.com/reports/1830115/ Grocery Retailers in Hungary Description: 2014 was the first full financial year in which the tobacco retailing system
Total Factor Productivity of the United Kingdom Food Chain 2014 final estimate
 28 th July 2016 Total Factor Productivity of the United Kingdom Food Chain 2014 final estimate 1. Key messages Total factor productivity of the UK food chain beyond the farmgate has decreased by 2.8 per
DISTRIBUTION CHANNELS
 Distribution channels Factors influencing the method of distribution Activity 27 : ASOS and Place Distribution channels The place element of the marketing mix refers to where products are made available
American Wear. Business Overview/Executive Summary
 American Wear Business Overview/Executive Summary American Wear is a British company that supplies American clothing to the UK market. Research has proven that most people in the UK tend to prefer the
Chapter 12: Gross Domestic Product and Growth Section 1
 Chapter 12: Gross Domestic Product and Growth Section 1 Key Terms national income accounting: a system economists use to collect and organize macroeconomic statistics on production, income, investment,
COMMERCIAL LEASE TRENDS FOR 2014
 COMMERCIAL LEASE TRENDS FOR 2014 Notes from a Presentation given by N B Maunder Taylor BSc (Hons) MRICS, Partner of Maunder Taylor The following is a written copy of the presentation given by Nicholas
The credit card industry in China The rise of a national champion and challenges for the future
 Student Research Projects/Outputs No.040 The credit card industry in China The rise of a national champion and challenges for the future Javier L Santomá Vilaclara MBA 2009 China Europe International Business
Eurozone. EY Eurozone Forecast September 2013
 Eurozone EY Eurozone Forecast September 213 Austria Belgium Cyprus Estonia Finland France Germany Greece Ireland Italy Luxembourg Malta Netherlands Portugal Slovakia Slovenia Spain Outlook for Finland
THE STATE OF THE ECONOMY
 THE STATE OF THE ECONOMY CARLY HARRISON Portland State University Following data revisions, the economy continues to grow steadily, but slowly, in line with expectations. Gross domestic product has increased,
Investing In the Downstream:
 Investing In the Downstream: The Point Of View of a National Oil Company Dr. Shokri M. Ghanem Chairman The National Oil Corporation of Libya Good afternoon ladies and gentlemen. Indeed I am delighted to
The Future of Retailing in Philippines to 2015
 Brochure More information from http://www.researchandmarkets.com/reports/1578887/ The Future of Retailing in Philippines to Description: Synopsis This report provides uniquely detailed data on the size
Fifty years of Australia s trade
 Fifty years of Australia s trade Introduction This edition of Australia s Composition of Trade marks the publication s 50th anniversary. In recognition of this milestone, this article analyses changes
BRICKS-AND- MORTAR RETAIL
 HOW TO THRIVE IN AN ONLINE WORLD BRICKS-AND- MORTAR RETAIL Today, e-commerce matters in every retail market. In some such as books, entertainment, and electronics it has already brought massive upheaval
MALL WORLD TIPS & TRICKS
 MALL WORLD TIPS & TRICKS Quick Start Guide Mall World is a Facebook game developed by 50 Cubes and published by 6 Waves where players can start their own boutique, be creative by decorating it, offer fashionable
Overview of the Belgium Retail & Food Service market. November 2008
 Overview of the Belgium Retail & Food Service market November 2008 Overview Economy: The Belgian economy grew by 2.7% in 2007 (forecast 2008: 2.1%) Unemployment rate at end of Sept. 2008: 6.6% Belgian
Press October 2010. Texprocess Leading International Trade Fair for Processing Textile and Flexible Materials Frankfurt am Main, 24 to 27 May 2011
 Press October 2010 Texprocess Leading International Trade Fair for Processing Textile and Flexible Materials Frankfurt am Main, Dr. Michael Sturm Tel. +49 69 7575-6463 Fax +49 69 7575-6758 Michael.sturm@messefrankfurt.com
Global Retail Sports Apparel Market 2012-2017: Market Trends, Profit and Forecast Analysis
 Brochure More information from http://www.researchandmarkets.com/reports/2078441/ Global Retail Sports Apparel Market 2012-2017: Market Trends, Profit and Forecast Analysis Description: The global retail
Executive Summary. Executive Summary. Executive Summary of the KPMG Study Trends in Retail 2020 CONSUMER MARKETS MARKETS
 Executive Summary Executive Summary CONSUMER MARKETS MARKETS Executive Summary of the KPMG Study Trends in Retail 2020 2 Executive Summary Trends in Retail 2020 Trends in Retail 2020 Mark Sievers Head
OPERATIONAL CASE STUDY PRACTICE EXAM ANSWERS
 OPERATIONAL CASE STUDY PRACTICE EXAM ANSWERS The Practice Exam can be viewed at http://www.pearsonvue.com/cima/practiceexams/ These answers have been provided by CIMA for information purposes only. The
WHAT YOU D KNOW IF WE COULD TALK TO YOU
 PRESENTS DATA DRIVEN BRAND MARKETING PART TWO YOUR DEFINITIVE GUIDE TO FINDING THE CHANNELS THAT DRIVE THE BEST RESPONSE WHAT YOU D KNOW IF WE COULD TALK TO YOU 1. Building Value on Existing Segmentations
Buying and Setting up a Business with a Post Office A Guide
 Buying and Setting up a Business with a Post Office A Guide NOTE: The information in this document is not intended as an exhaustive list of all the information you require in order to set up a business
Economic Overview. East Asia managed to weather the global recession by relying on export-oriented
 Economic Overview Economic growth remains strong in East Asia and retains healthy momentum thanks to strong commodity prices and increases in exports. leads the region in growth and its GDP is expected
BUSINESS INTELLIGENCE
 Insight Report FINANCIAL SOLUTIONS BUSINESS INTELLIGENCE Data from arvato s payment systems yields valuable insights into customer behaviours and trends. Convenience in every transaction Executive summary
QUALITY OF LIFE REPORT
 / 01 SURVEY QUALITY OF LIFE REPORT Private Assets in 2015 Amount to 110 Trillion CNY respondents will increase luxury consumption next year 2.01 Million High Net Worth Families China's Growing Wealth respondents
COI Research Management Summary on behalf of the Department of Health
 COI Research Management Summary on behalf of the Department of Health Title: Worth Talking About Campaign Evaluation 2010 / 2011 Quantitative research conducted by TNS-BMRB COI Reference number: 114770
B.C. Agrifoods Trade Overview
 B.C. Agrifoods Trade Overview Water Focus on Japan and China Prepared by: Corporate Statistics and Research Unit, Ministry of Agriculture Britney.Elder@gov.bc.ca Source: Global Trade Atlas (May 2014),
Home Improvement Franchises Predicted to Rise
 WWW.IBISWORLD.COM October 2013 1 October 2013 Fastest Growing Franchises in Home Improvement By Lauren Setar As the economy improves and residential market recovers, franchises in the home improvement
Coca-Cola Case Analyses. <Student Name> <Name and Section # of course> <Instructor Name> <Date>
 Running Head: COCA-COLA CASE Coca-Cola Case Analyses Coca-Cola Case 2 Coca-Cola Case Analyses This paper is about the company Coca-Cola
INFLATION REPORT PRESS CONFERENCE. Thursday 4 th February 2016. Opening remarks by the Governor
 INFLATION REPORT PRESS CONFERENCE Thursday 4 th February 2016 Opening remarks by the Governor Good afternoon. At its meeting yesterday, the Monetary Policy Committee (MPC) voted 9-0 to maintain Bank Rate
DIY retail in Poland 2015. Market analysis and development forecasts for 2015-2020
 2 Language: English Date of publication: March 2015 Delivery: pdf Price from: 700 Find out Which are the top selling DIY retailers in Poland? Which trends have recently emerged in the Polish DIY retail
Case Study: Marks & Spencer
 Case Study: Marks & Spencer by Angelika Brix Bartosz Konior Stephan Richter Vienna, October 2006 Annushorribilis-1999 Drop in sales profit share price What happened in 1999 Reversal of company fortunes
How To Understand The Growth In Private Health Insurance
 COMPETITION IN THE AUSTRALIAN PRIVATE HEALTH INSURANCE MARKET Page 1 of 11 1. To what extent has the development of different markets in the various states had an impact on competition? The development
MEASURING A NATION S INCOME
 10 MEASURING A NATION S INCOME WHAT S NEW IN THE FIFTH EDITION: There is more clarification on the GDP deflator. The Case Study on Who Wins at the Olympics? is now an FYI box. LEARNING OBJECTIVES: By the
Cisco StyleMe Virtual Fashion Mirror
 Cisco StyleMe Virtual Fashion Mirror How New Consumer Behaviors Are Enabling Retailers To Revitalize Their Stores by Combining the Virtual and Physical Worlds Written by Lisa Fretwell Solution Developed
Top 5 Riskiest Industries in the Mid-Atlantic
 WWW.IBISWORLD.COM August 2013 1 August 2013 Top 5 Riskiest Industries in the Mid-Atlantic By Brandon Ruiz The Mid-Atlantic population is forecast to grow, but that will not help all industries in the region;
! Giving the subscribers a choice of watching streaming content or receiving quickly delivered DVDs by mail.
 Netflix s Business Model and Strategy in renting Movies and TV Episodes Reed Hastings, founder and CEO, launched Netflix as an online rental movie service in 1999. Netflix is a company that distributes
The retail productivity agenda Paving the path for a productive store network
 The retail productivity agenda Paving the path for a productive store network Stores have always been at the centre of the retail world. It is where consumers go to get to know brands, discover products,
Making Sainsbury s Great Again. 19 October 2004
 Making Sainsbury s Great Again 19 October 2004 Philip Hampton Chairman Justin King Chief Executive Making Sainsbury s great again What we have found New and experienced management team Restoring universal
Professional Etiquette. How to: Dress For Success. Career and Professional Readiness Center
 Professional Etiquette How to: Dress For Success Career and Professional Readiness Center What are the types of Professional Dress? Overview: Making an Impression Building your Professional Wardrobe Specifics
THE CPA AUSTRALIA ASIA-PACIFIC SMALL BUSINESS SURVEY 2015 HONG KONG REPORT
 THE CPA AUSTRALIA ASIA-PACIFIC SMALL BUSINESS SURVEY 2015 HONG KONG REPORT 2 THE CPA AUSTRALIA ASIA-PACIFIC SMALL BUSINESS SURVEY 2015 HONG KONG REPORT LEGAL NOTICE CPA Australia Ltd ( CPA Australia )
The Consumer Holiday Trends Report
 The Consumer Holiday Trends Report ABTA Consumer Survey 2014 Number of holidays taken The past 12 months have been mixed from a consumer confidence and sales perspective Overall, eight in ten (80%) consumers
The Beginner s Guide to. Investing in Precious Metals
 The Beginner s Guide to Investing in Precious Metals Since the beginning of time, gold and silver have been recognized as valuable and a sign of wealth. Even today, precious metals hold a strong place
Global Apparel Market: Segment Analysis
 Brochure More information from http://www.researchandmarkets.com/reports/481988/ Global Apparel Market: Segment Analysis Description: The global apparel market is growing with multinational corporations
Ralph Lauren. Shelby Gray Group #2 BUS 440.02 11:30
 Ralph Lauren Shelby Gray Group #2 BUS 440.02 11:30 0 COMPANY OVERVIEW Polo Ralph Lauren is a company specializing in the production of lifestyle products. Ralph Lauren began forty years ago with simply
E-retailing Project. E-retailing - An Exciting Opportunity for the Logistics Sector
 E-retailing Project E-retailing - An Exciting Opportunity for the Logistics Sector May 2012 Goodman E retailing Research Report About Transport Intelligence Headquartered in the UK, Ti is one of the world
Chapter 2 Market Structure, Types and Segmentation
 Market Structure There are a variety of differing market structures which are separated by the levels of competition that exist within each market and the market conditions in which the businesses operate.
International Trade Monitor
 British Small and Medium-Sized Enterprises Split Over Health of the UK Economy Overall SME importer and exporter confidence sees dip in Q1 Increase in SMEs hurt by sterling volatility Eurozone concerns
Executive Cover Memo. The Allround brand is in a favorable position, but the cold medicine is also becoming a
 Executive Cover Memo The Allround brand is in a favorable position, but the cold medicine is also becoming a cash cow. I believe that Allround needs to increase its unit sales with both grocery stores
Quarterly Economics Briefing
 Quarterly Economics Briefing March June 2015 2016 Review of Current Conditions: The Economic Outlook and Its Impact on Workers Compensation The exhibits below are updated to reflect the current economic
METRO GROUP increases sales 2012 in a challenging consumer environment
 METRO GROUP increases sales in a challenging consumer environment Sales rose by 1.2% to 66.7 billion (adjusted for portfolio measures: +2.3%); EBIT before special items reached around 2.0 billion Operating
Interviewing. Tips for Success
 Interviewing Tips for Success First Impressions The first words you speak count It is a pleasure meeting with you Thank you for for scheduling this time to meet Walk with vigor and show confidence People
Clear Returns changes the way retailers think
 Clear Returns changes the way retailers think Understanding the causes, likelihood and impact of returns helps to drive profitability It s not what they buy, it s what they keep. Shopping behaviour has
What this topic is about. The purpose of marketing Different approaches to marketing Segmentation Niche &mass markets B2C & B2B marketing
 Effective Marketing What this topic is about The purpose of marketing Different approaches to marketing Segmentation Niche &mass markets B2C & B2B marketing What is Marketing? The process of identifying,
UNIFE World Rail Market Study
 UNIFE World Rail Market Study Status quo and outlook 2020 Commissioned by UNIFE, the European Rail Industry And conducted by The Boston Consulting Group 2 1 Executive Summary This is the third "World Rail
Indian Agrochemical Industry
 Indian Agrochemical Industry Introduction. India is the fourth largest producer of agrochemicals globally, after United States, Japan and China. The agrochemicals industry is a significant industry for
Q1 / 2015: INTERIM REPORT WITHIN THE FIRST HALF-YEAR OF 2015. Berentzen-Gruppe Aktiengesellschaft Haselünne / Germany
 Q1 / 2015: INTERIM REPORT WITHIN THE FIRST HALF-YEAR OF 2015 Berentzen-Gruppe Aktiengesellschaft Haselünne / Germany Securities Identification Number 520 163 International Securities Identification Numbers
Economic Development Planning, Summary 7
 Economic Development Planning, Summary 7 Unless otherwise noted, summaries represent findings and analyses by the listed source, not by Morrison Institute for Public Policy or Arizona State University.
Position Paper Cross Border e-logistics
 Position Paper Cross Border e-logistics A Need for Integrated European E-Logistics Solutions www.ecommerce-europe.eu POSITION PAPER 3 Table of contents Summary Summary & Recommendations 3 Introduction
Total Factor Productivity of the United Kingdom Food Chain 2013 final estimate
 30 th July 2015 Total Factor Productivity of the United Kingdom Food Chain 2013 final estimate 1. Key messages Total factor productivity of the UK food chain beyond the farmgate has increased by 0.5 per