Virtual Instrumentation With LabVIEW
|
|
|
- Jeremy Lang
- 7 years ago
- Views:
Transcription
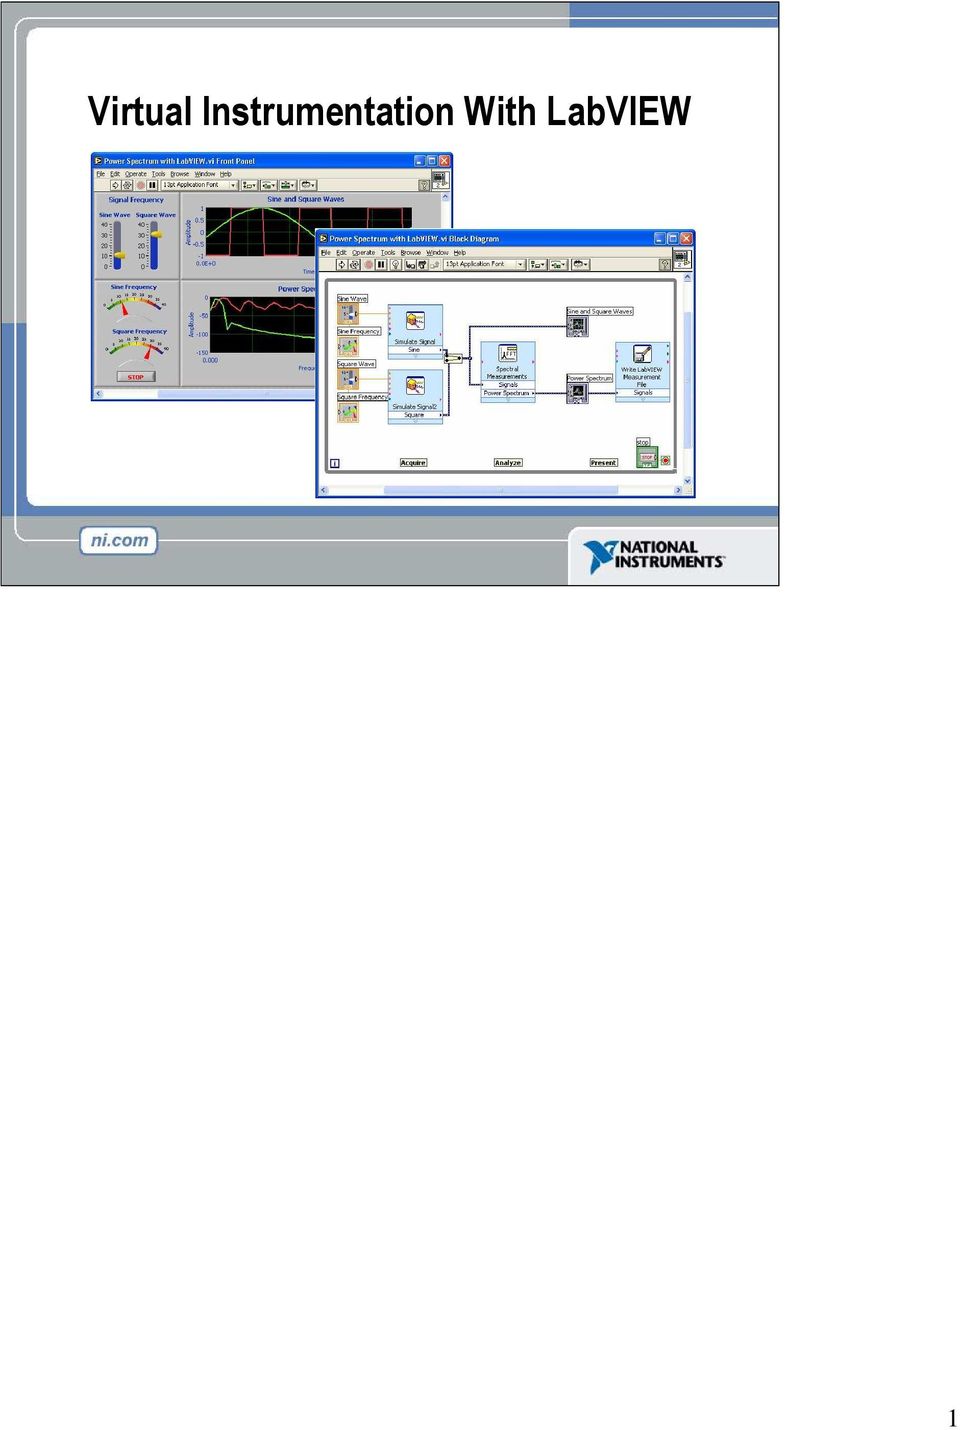
1 Virtual Instrumentation With LabVIEW 1
2 Course Goals Understand the components of a Virtual Instrument Introduce LabVIEW and common LabVIEW functions Build a simple data acquisition application Create a subroutine in LabVIEW Work with Arrays, Clusters, and Structures Learn About Printing & Documentation Features Develop in Basic Programming Architectures Publish VIs on the Web This is a list of the objectives of the course. This course prepares you to do the following: Use LabVIEW to create applications. Understand front panels, block diagrams, and icons and connector panes. Use built-in LabVIEW functions. Create and save programs in LabVIEW so you can use them as subroutines. Create applications that use plug-in DAQ devices. This course does not describe any of the following: Programming theory Every built-in LabVIEW function or object Analog-to-digital (A/D) theory 2

3 Section I LabVIEW terms Components of a LabVIEW application LabVIEW programming tools Creating an application in LabVIEW 3

4 LabVIEW Programs Are Called Virtual Instruments (VIs) Front Panel Controls = Inputs Indicators = Outputs Block Diagram Accompanying program for front panel Components wired together LabVIEW programs are called virtual instruments (VIs). Stress that controls equal inputs, indicators equal outputs. Each VI contains three main parts: Front Panel How the user interacts with the VI. Block Diagram The code that controls the program. Icon/Connector Means of connecting a VI to other VIs. The Front Panel is used to interact with the user when the program is running. Users can control the program, change inputs, and see data updated in real time. Stress that controls are used for inputs- adjusting a slide control to set an alarm value, turning a switch on or off, or stopping a program. Indicators are used as outputs. Thermometers, lights, and other indicators indicate values from the program. These may include data, program states, and other information. Every front panel control or indicator has a corresponding terminal on the block diagram. When a VI is run, values from controls flow through the block diagram, where they are used in the functions on the diagram, and the results are passed into other functions or indicators. 4


5 VI Front Panel Front Panel Toolbar Boolean Control Icon Graph Legend Waveform Graph Plot Legend Scale Legend The front panel is the user interface of the VI. You build the front panel with controls and indicators, which are the interactive input and output terminals of the VI, respectively. Controls are knobs, pushbuttons, dials, and other input devices. Indicators are graphs, LEDs, and other displays. Controls simulate instrument input devices and supply data to the block diagram of the VI. Indicators simulate instrument output devices and display data the block diagram acquires or generates. In this picture, the Power switch is a boolean control. A boolean contains either a true or false value. The value is false until the switch is pressed. When the switch is pressed, the value becomes true. The temperature history indicator is a waveform graph. It displays multiple numbers. In this case, the graph will plot Deg F versus Time (sec). The front panel also contains a toolbar, whose functions we will discuss later. 5

6 VI Block Diagram Block Diagram Toolbar Divide Function SubVI Graph Terminal Wire Data While Loop Structure Numeric Constant Timing Function Boolean Control Terminal The block diagram contains this graphical source code. Front panel objects appear as terminals on the block diagram. Additionally, the block diagram contains functions and structures from built-in LabVIEW VI libraries. Wires connect each of the nodes on the block diagram, including control and indicator terminals, functions, and structures. In this block diagram, the subvi Temp calls the subroutine which retrieves a temperature from a Data Acquisition (DAQ) board. This temperature is plotted along with the running average temperature on the waveform graph Temperature History. The Power switch is a boolean control on the Front Panel which will stop execution of the While Loop. The While Loop also contains a Timing Function to control how frequently the loop iterates. 6
 board.")
7 Express VIs, VIs and Functions Express VIs: interactive VIs with configurable dialog page Standard VIs: modularized VIs customized by wiring Functions: fundamental operating elements of LabVIEW; no front panel or block diagram Function Express VI Standard VI LabVIEW 7.0 introduced a new type of subvi called Express VIs. These are interactive VIs that have a configuration dialog box that allows the user to customize the functionality of the Express VI. LabVIEW then generates a subvi based on these settings. Standard VIs are VIs (consisting of a front panel and a block diagram) that are used within another VI. Functions are the building blocks of all VIs. Functions do not have a front panel or a block diagram. 7
 that are used within another VI.")

8 Controls and Functions Palettes Controls Palette (Front Panel Window) Functions Palette (Block Diagram Window) Use the Controls palette to place controls and indicators on the front panel. The Controls palette is available only on the front panel. Select Window»Show Controls Palette or right-click the front panel workspace to display the Controls palette. You also can display the Controls palette by right-clicking an open area on the front panel. Tack down the Controls palette by clicking the pushpin on the top left corner of the palette. Use the Functions palette, to build the block diagram. The Functions palette is available only on the block diagram. Select Window»Show Functions Palette or right-click the block diagram workspace to display the Functions palette. You also can display the Functions palette by right-clicking an open area on the block diagram. Tack down the Functions palette by clicking the pushpin on the top left corner of the palette. 8

9 Tools Palette Floating Palette Used to operate and modify front panel and block diagram objects. Automatic Selection Tool Operating Tool Positioning/Resizing Tool Labeling Tool Wiring Tool Shortcut Menu Tool Scrolling Tool Breakpoint Tool Probe Tool Color Copy Tool Coloring Tool If automatic tool selection is enabled and you move the cursor over objects on the front panel or block diagram, LabVIEW automatically selects the corresponding tool from the Tools palette. Toggle automatic tool selection by clicking the Automatic Tool Selection button in the Tools palette. Use the Operating tool to change the values of a control or select the text within a control. Use the Positioning tool to select, move, or resize objects. The Positioning tool changes shape when it moves over a corner of a resizable object. Use the Labeling tool to edit text and create free labels. The Labeling tool changes to a cursor when you create free labels. Use the Wiring tool to wire objects together on the block diagram. 9

10 Status Toolbar Run Button Continuous Run Button Abort Execution Pause/Continue Button Text Settings Align Objects Distribute Objects Reorder Additional Buttons on the Diagram Toolbar Execution Highlighting Button Step Into Button Step Over Button Step Out Button Resize front panel objects Click the Run button to run the VI. While the VI runs, the Run button appears with a black arrow if the VI is a top-level VI, meaning it has no callers and therefore is not a subvi. Click the Continuous Run button to run the VI until you abort or pause it. You also can click the button again to disable continuous running. While the VI runs, the Abort Execution button appears. Click this button to stop the VI immediately. Note: Avoid using the Abort Execution button to stop a VI. Either let the VI complete its data flow or design a method to stop the VI programmatically. By doing so, the VI is at a known state. For example, place a button on the front panel that stops the VI when you click it. Click the Pause button to pause a running VI. When you click the Pause button, LabVIEW highlights on the block diagram the location where you paused execution. Click the Pause button again to continue running the VI. Select the Text Settings pull-down menu to change the font settings for the VI, including size, style, and color. Select The Align Objects pull-down menu to align objects along axes, including vertical, top edge, left, and so on. Select the Distribute Objects pull-down menu to space objects evenly, including gaps, compression, and so on. Select the Resize Objects pull-down menu to change the width and height of front panel objects. 10

11 Select the Reorder pull-down menu when you have objects that overlap each other and you want to define which one is in front or back of another. Select one of the objects with the Positioning tool and then select from Move Forward, Move Backward, Move To Front, and Move To Back. <the following items only appear on the bock diagram toolbar> Click the Highlight Execution button to see the flow of data through the block diagram. Click the button again to disable execution highlighting. Click the Step Into button to single-step into a loop, subvi, and so on. Singlestepping through a VI steps through the VI node to node. Each node blinks to denote when it is ready to execute. By stepping into the node, you are ready to single-step inside the node. Click the Step Over button to step over a loop, subvi, and so on. By stepping over the node, you execute the node without single-stepping through the node. Click the Step Out button to step out of a loop, subvi, and so on. By stepping out of a node, you complete single-stepping through the node and go to the next node. 11

12 Open and Run a Virtual Instrument Example finder 1. Select Start» Programs» National Instruments» LabVIEW 7.0» LabVIEW to launch LabVIEW. The LabVIEW dialog box appears. 2. Select Find Examples from the Help menu. The dialog box that appears lists and links to all available LabVIEW example VIs. 3. You can browse examples by categories, or you can use a keyword search. Click the Search tab to open the keyword browser. 4. In the Enter Keyword(s) box enter Signal 5. A list of related topics will appear in the examples window. Double-click on signals, this will list examples on the right side. 6. Click on any program to see a detailed description of the example. Doubleclick Signal Generation and Processing.vi to launch this example. This will open the Signal Generation and Processing.vi Front Panel. Examine the VI and run it. Change the frequencies and types of the input signals and notice how the display on the graph changes. Change the Signal Processing Window and Filter options. After you have examined the VI and the different options you can change, stop the VI by pressing the Stop button. Note You also can open the VI by clicking the Open VI button and navigating to labview\examples\apps\demos.llb\signal Generation and Processing.vi. 12

13 Creating a VI Front Panel Window Block Diagram Window Control Terminals Indicator Terminals When you create an object on the Front Panel, a terminal will be created on the Block Diagram. These terminals give you access to the Front Panel objects from the Block Diagram code. Each terminal contains useful information about the Front Panel object it corresponds to. For example, the color and symbols provide the data type. Double-precision, floating point numbers are represented with orange terminals and the letters DBL. Boolean terminals are green with TF lettering. In general, orange terminals should wire to orange terminals, green to green, and so on. This is not a hard-and-fast rule; LabVIEW will allow a user to connect a blue terminal (integer value) to an orange terminal (fractional value), for example. But in most cases, look for a match in colors. Controls have an arrow on the right side and have a thick border. Indicators have an arrow on the left and a thin border. Logic rules apply to wiring in LabVIEW: Each wire must have one (but only one) source (or control), and each wire may have multiple destinations (or indicators). The program in this slide takes data from A and B and passes the values to both an Add function and a subtract function. The results are displayed on the appropriate indicators. 13


14 Creating a VI Block Diagram In addition to Front Panel terminals, the Block diagram contains functions. Each function may have multiple input and output terminals. Wiring to these terminals is an important part of LabVIEW programming. Once you have some experience programming in LabVIEW, wiring will become easy. At first, you may need some assistance. Here are some tips to get you started: The wiring tool is used to wire to the nodes of the functions. When you aim with the wiring tool, aim with the end of the wire hanging from the spool. This is where the wire will be placed. As you move the wiring tool over functions, watch for the yellow tip strip. This will tell you the name of the terminal you are wiring to. As you move the wiring tool over a terminal, it will flash. This will help you identify where the wire will attach. For more help with the terminals, right-click on the function and select Visible Items>>Terminals. The function s picture will be pulled back to reveal the connection terminals. Notice the colors- these match the data types used by the front panel terminals. For additional help, select Help>>Show Context Help, or press CTRL+H. This will bring up the context help window. As you move your mouse over the function, this window will show you the function, terminals, and a brief help description. Use this with the other tools to help you as you wire. 14

15 Wiring Tips Block Diagram Wiring Hot Spot Click To Select Wires Use Automatic Wire Routing Clean Up Wiring In addition to Front Panel terminals, the Block diagram contains functions. Each function may have multiple input and output terminals. Wiring to these terminals is an important part of LabVIEW programming. Once you have some experience programming in LabVIEW, wiring will become easy. At first, you may need some assistance. Here are some tips to get you started: The wiring tool is used to wire to the nodes of the functions. When you aim with the wiring tool, aim with the end of the wire hanging from the spool. This is where the wire will be placed. As you move the wiring tool over functions, watch for the yellow tip strip. This will tell you the name of the terminal you are wiring to. As you move the wiring tool over a terminal, it will flash. This will help you identify where the wire will attach. For more help with the terminals, right-click on the function and select Visible Items>>Terminals. The function s picture will be pulled back to reveal the connection terminals. Notice the colors- these match the data types used by the front panel terminals. For additional help, select Help>>Show Context Help, or press CTRL+H. This will bring up the context help window. As you move your mouse over the function, this window will show you the function, terminals, and a brief help description. Use this with the other tools to help you as you wire. If your wiring becomes doesn t look very good, right-click on the particular wire in question and choose Clean Up Wire to automatically re-route that wire. 15

16 Wiring is very flexible in LabVIEW. Experiment with keystroke and clicking combinations when wiring. Here are some of the most often used features: Single, double, and triple clicking a wire selects the wire for movement or deletion Clicking while wiring tacks down a bend in the wire Right-clicking or pressing Escape while wiring cancels the wiring operation Don t worry about wire colors- LabVIEW will automatically select the right wire for each situation. Automatically Wiring Objects LabVIEW automatically wires objects as you place them on the block diagram. You also can automatically wire objects already on the block diagram. LabVIEW connects the terminals that best match and leaves terminals that do not match unconnected. As you move a selected object close to other objects on the block diagram, LabVIEW draws temporary wires to show you valid connections. When you release the mouse button to place the object on the block diagram, LabVIEW automatically connects the wires. Toggle automatic wiring by pressing the spacebar while you move an object using the Positioning tool. You can adjust the automatic wiring settings by selecting Tools» Options and selecting Block Diagram from the top pull-down menu. 16

17 Dataflow Programming Block diagram executes dependent on the flow of data; block diagram does NOT execute left to right Node executes when data is available to ALL input terminals Nodes supply data to all output terminals when done LabVIEW follows a dataflow model for running VIs. A block diagram node executes when all its inputs are available. When a node completes execution, it supplies data to its output terminals and passes the output data to the next node in the dataflow path. Visual Basic, C++, JAVA, and most other text-based programming languages follow a control flow model of program execution. In control flow, the sequential order of program elements determines the execution order of a program. Consider the block diagram above. It adds two numbers and then subtracts 50.0 from the result of the addition. In this case, the block diagram executes from left to right, not because the objects are placed in that order, but because one of the inputs of the Subtract function is not valid until the Add function has finished executing and passed the data to the Subtract function. Remember that a node executes only when data are available at all of its input terminals, and it supplies data to its output terminals only when it finishes execution. In the code to the right, consider which code segment would execute first the Add, Random Number, or Divide function. You cannot know because inputs to the Add and Divide functions are available at the same time, and the Random Number function has no inputs. In a situation where one code segment must execute before another, and no data dependency exists between the functions, use a Sequence structure to force the order of execution. 17


18 Help Options Context Help Online help Lock help Simple/Complex Diagram help Ctrl + H Online reference All menus online Pop up on functions in diagram to access online info directly Use the Context Help window and the LabVIEW Help to help you build and edit VIs. Refer to the LabVIEW Help and manuals for more information. Context Help Window To display the Context Help window, select Help»Show Context Help or press the <Ctrl-H> keys. When you move the cursor over front panel and block diagram objects, the Context Help window displays the icon for subvis, functions, constants, controls, and indicators, with wires attached to each terminal. When you move the cursor over dialog box options, the Context Help window displays descriptions of those options. In the window, required connections are bold, recommended connections are plain text, and optional connections are dimmed or do not appear. Above is an example Context Help window. Click the Simple/Detailed Context Help button located on the lower left corner of the Context Help window to change between simple and detailed context help. The simple mode emphasizes the important connections. Optional terminals are shown by wire stubs, informing you that other connections exist. Click the Lock Context Help button to lock the current contents of the Context Help window. When the contents are locked, moving the cursor over another object does not change the contents of the window. To unlock the window, click the button again. You also can access this option from the Help menu. 18

19 Click the More Help button to display the corresponding topic in the LabVIEW Help, which describes the object in detail. LabVIEW Help You can access the LabVIEW Help either by clicking the More Help button in the Context Help window, selecting Help»VI, Function, & How-To Help, clicking the sentence Click here for more help in the Context Help window, or pressing <Ctrl-?>. The LabVIEW Help contains detailed descriptions of most palettes, menus, tools, VIs, and functions. It also includes step-by-step instructions for using LabVIEW features and links to the LabVIEW Tutorial, PDF versions of all the LabVIEW manuals and Application Notes, and technical support resources on the National Instruments Web site. 19


20 Exercise 1 - Convert C to F Estimate completion time: 20 minutes. The exercise is easy, but since it will be the first VI that we actually create, it is good to allow ample time to explore the LabVIEW environment. Instructions: Build a VI that converts C to F. When run, the VI should take an input value ( C), multiply it by 1.8, add 32, and display the result ( F). The front panel should display both the input value and the result. Save the VI as Convert C to F.vi. 20
, multiply it by 1.8, add 32, and display the result ( F).")
21 Debugging Techniques Finding Errors Click on broken Run button Window showing error appears Execution Highlighting Probe Click on Execution Highlighting button; data flow is animated using bubbles. Values are displayed on wires. Right-click on wire to display probe and it shows data as it flows through wire segment You can also select Probe tool from Tools palette and click on wire When your VI is not executable, a broken arrow is displayed in the Run button in the palette. Finding Errors: To list errors, click on the broken arrow. To locate the bad object, click on the error message. Execution Highlighting: Animates the diagram and traces the flow of the data, allowing you to view intermediate values. Click on the light bulb on the toolbar. Probe: Used to view values in arrays and clusters. Click on wires with the Probe tool or right-click on the wire to set probes. Breakpoint: Set pauses at different locations on the diagram. Click on wires or objects with the Breakpoint tool to set breakpoints. Use Debug Demonstrate VI from BASICS.LLB to demonstrate the options and tools. 21

22 Section II SubVIs What is a subvi? Making an icon and connector for a subvi Using a VI as a subvi 22
23 Block Diagram Nodes Icon Expandable Node Expanded Node Function Generator VI Same VI, viewed three different ways Yellow field designates a standard VI Blue field designates an Express VI Just as control or indicator terminals on the block diagram can be viewed as an icon or a simple terminal, subvis can be viewed as an icon, an expandable node, or an expanded node. The different views merely depend on user preference and do not change the functionality of the subvi. 23
24 SubVIs A SubVI is a VI that can be used within another VI Similar to a subroutine Advantages Modular Easier to debug Don t have to recreate code Require less memory After you build a VI and create its icon and connector pane, you can use it in another VI. A VI within another VI is called a subvi. A subvi corresponds to a subroutine in text-based programming languages. Using subvis helps you manage changes and debug the block diagram quickly. 24
25 Icon and Connector Icon Terminals Connector An icon represents a VI in other block diagrams A connector shows available terminals for data transfer Every VI displays an icon, shown above, in the upper right corner of the front panel and block diagram windows. An icon is a graphical representation of a VI. It can contain text, images, or a combination of both. If you use a VI as a subvi, the icon identifies the subvi on the block diagram of the VI. The connector shows terminals available for transfer or data to and from the subvi. There are several connector patterns to choose from. Right click on the connector and select the pattern from the Patterns menu. From there you can assign controls and indicators on the front panel to the connector terminal, as we will see later. 25
26 SubVIs Sub VIs The above block diagram contains two subvis. To see the front panel of a subvi, simply double click the subvi. You can also view the hierarchy of subvis within a top level VI by clicking on Browse» Show VI Hierarchy. 26
27 Steps to Create a SubVI Create the Icon Create the Connector Assign Terminals Save the VI Insert the VI into a Top Level VI 27

28 Create the Icon Right-click on the icon in the block diagram or front panel Create custom icons to replace the default icon by right-clicking the icon in the upper right corner of the front panel or block diagram and selecting Edit Icon from the shortcut menu or by double-clicking the icon in the upper right corner of the front panel. You also can edit icons by selecting File»VI Properties, selecting General from the Category pull-down menu, and clicking the Edit Icon button. Use the tools on the left side of the Icon Editor dialog box to create the icon design in the editing area. The normal size image of the icon appears in the appropriate box to the right of the editing area. You also can drag a graphic from anywhere in your file system and drop it in the upper right corner of the front panel or block diagram. LabVIEW converts the graphic to a pixel icon. 28

29 Create the Connector Right click on the icon pane (front panel only) To use a VI as a subvi, you need to build a connector pane. The connector pane is a set of terminals that corresponds to the controls and indicators of that VI, similar to the parameter list of a function call in text-based programming languages. The connector pane defines the inputs and outputs you can wire to the VI so you can use it as a subvi. Define connections by assigning a front panel control or indicator to each of the connector pane terminals. To define a connector pane, right-click the icon in the upper right corner of the front panel window and select Show Connector from the shortcut menu. The connector pane replaces the icon. Each rectangle on the connector pane represents a terminal. Use the rectangles to assign inputs and outputs. The number of terminals LabVIEW displays on the connector pane depends on the number of controls and indicators on the front panel. The above front panel has four controls and one indicator, so LabVIEW displays four input terminals and one output terminal on the connector pane. 29

30 Assign Terminals After you select a pattern to use for your connector pane, you must define connections by assigning a front panel control or indicator to each of the connector pane terminals. When you link controls and indicators to the connector pane, place inputs on the left and outputs on the right to prevent complicated, unclear wiring patterns in your VIs. To assign a terminal to a front panel control or indicator, click a terminal of the connector pane. Click the front panel control or indicator you want to assign to the terminal. Click an open area of the front panel. The terminal changes to the data type color of the control to indicate that you connected the terminal. You also can select the control or indicator first and then select the terminal. Make sure you save the VI after you have made the terminal assignments. 30
31 Save The VI Choose an Easy to Remember Location Organize by Functionality Save Similar VIs into one directory (e.g. Math Utilities) Organize by Application Save all VIs Used for a Specific Application into one directory or library file (e.g. Lab 1 Frequency Response) Library Files (.llbs) combine many VI s into a single file, ideal for transferring entire applications across computers There are several ways to organize your subvis. The most common way is to organize by application. In this case, all the VI s for a particular application are saved into the same directory or into a VI Library file. Saving into a library file allows you to transport an entire application within a single file. Saving into library is simple. After clicking Save As, click New VI Library. This will allow you to name the library, and then save your VI into it. To add subsequent VI s, simply double click the.llb file from the standard Save window, and give the VI a name. 31

32 Insert the SubVI into a Top Level VI Accessing user-made subvis Functions >>All Functions >> Select a VI Or Drag icon onto target diagram After you build a VI and create its icon and connector pane, you can use it as a subvi. To place a subvi on the block diagram, select Functions»Select a VI. Navigate to and double-click the VI you want to use as a subvi and place it on the block diagram. You also can place an open VI on the block diagram of another open VI by using the Positioning tool to click the icon in the upper right corner of the front panel or block diagram of the VI you want to use as a subvi and drag the icon to the block diagram of the other VI. 32
33 Tips for Working in LabVIEW Keystroke Shortcuts <Ctrl-H> Activate/Deactivate Context Help Window <Ctrl-B> Remove Broken Wires From Block Diagram <Ctrl-E> Toggle Between Front Panel and Block Diagram <Ctrl-Z> Undo (Also in Edit Menu) Tools» Options Set Preferences in LabVIEW VI Properties Configure VI Appearance, Documentation, etc. LabVIEW has many keystroke shortcuts that make working easier. The most common shortcuts are listed above. While the Automatic Selection Tool is great for choosing the tool you would like to use in LabVIEW, there are sometimes cases when you want manual control. Use the Tab key to toggle between the four most common tools (Operate Value, Position/Size/Select, Edit Text, Set Color on Front Panel and Operate Value, Position/Size/Select, Edit Text, Connect Wire on Block Diagram). Once you are finished with the tool you choose, you can press <Shift- Tab> to turn the Automatic Selection Tool on. In the Tools» Options dialog, there are many configurable options for customizing your Front Panel, Block Diagram, Colors, Printing, and much more. Similar to the LabVIEW Options, you can configure VI specific properties by going to File» VI Properties There you can document the VI, change the appearance of the window, and customize it in several other ways. 33
34 Section III Data Acquisition Data acquisition (DAQ) basics Connecting Signals Simple DAQ application Sensors DAQ Device Computer Cable Terminal Block 34

35 Data Acquisition in LabVIEW Traditional NI-DAQ Specific VIs for performing: Analog Input Analog Output Digital I/O Counter operations NI-DAQmx Next generation driver: VIs for performing a task One set of VIs for all measurement types The Data Acquisition palette in LabVIEW contains a palette for traditional NI-DAQ and one for NI-DAQmx. Traditional VIs are divided by the type of measurement; DAQmx VIs are divided by the type of task. You must complete several steps before you can use the Data Acquisition VIs. The devices should be configured for the computers in this class. 1. NI-DAQ software must be installed on the computer 2. You must have installed an E-series DAQ board and configured it using Measurement & Automation Explorer (MAX). For more information on installing and configuring National Instruments hardware, consult the DAQ Quick Start Guide: 35
36 DAQ Data Acquisition Temperature Acquisition using the DAQ Assistant Above is the DAQ Assistant window that can be quickly configured to read temperature from a Data Acquisition (DAQ) board. 36
37 Data Acquisition Terminology Resolution - Determines How Many Different Voltage Changes Can Be Measured Larger Resolution More Precise Representation of Signal Range - Minimum and Maximum Voltages Smaller range More Precise Representation of Signal Gain - Amplifies or Attenuates Signal for Best Fit in Range Resolution: When acquiring data to a computer, an Analog-to-Digital Converter (ADC) takes an analog signal and turns it into a binary number. Therefore, each binary number from the ADC represents a certain voltage level. The ADC returns the highest possible level without going over the actual voltage level of the analog signal. Resolution refers to the number of binary levels the ADC can use to represent a signal. To figure out the number of binary levels available based on the resolution you simply take 2 Resolution. Therefore, the higher the resolution, the more levels you will have to represent your signal. For instance, an ADC with 3-bit resolution can measure 2 3 or 8 voltage levels, while an ADC with 12-bit resolution can measure 2 12 or 4096 voltage levels. Range: Unlike the resolution of the ADC, the range of the ADC is selectable. Most DAQ devices offer a range from or -10 to +10. The range is chosen when you configure your device in NI-DAQ. Keep in mind that the resolution of the ADC will be spread over whatever range you choose. The larger the range, the more spread out your resolution will be, and you will get a worse representation of your signal. Thus it is important to pick your range to properly fit your input signal. 37
38 Gain: Properly choosing the range of your ADC is one way to make sure you are maximizing the resolution of your ADC. Another way to help your signal maximize the resolution of the ADC is by applying a gain. Gain refers to any amplification or attenuation of a signal. The gain setting is a scaling factor. Each voltage level on your incoming signal is multiplied by the gain setting to achieve the amplified or attenuated signal. Unlike resolution that is a fixed setting of the ADC, and range that is chosen when the DAQ device is configured, the gain is specified indirectly through a setting called input limits. Input limits refers to the minimum and maximum values of your actual analog input signal. Based on the input limits you set, the largest possible gain is applied to your signal that will keep the signal within the chosen range of the ADC. So instead of needing to calculate the best gain based on your signal and the chosen range, all you need to know is the minimum and maximum values of your signal. 38
39 Hardware Connections BNC-2120 SC-2075 NI-ELVIS SCB-68 There are many different hardware setups possible when acquiring data. All Data Acquisition systems require some sort of connection terminal that accepts a signal from your transducer and transmits it to the DAQ card. Four such terminal blocks are the BNC-2120, SC-2075, SCB-68, and NI-ELVIS. The BNC-2120 is a shielded connector block with signal-labeled BNC connectors for easy connectivity to your DAQ device. It also provides a function generator, quadrature encoder, temperature reference, thermocouple connector, and LED so that you can test the functionality of your hardware. The SC-2075 provides breadboard area for prototyping and BNC and spring terminal connectivity. The built-in ±15 V or adjustable 0 to 5 V power supply and LED s make the SC-2075 ideal for academic laboratories. The SCB-68 is a shielded I/O connector block for rugged, very low-noise signal termination. It includes general-purpose breadboard areas (two) as well as an IC temperature sensor for cold-junction compensation in temperature measurements. NI-ELVIS (Educational Laboratory Virtual Instrumentation Suite) is a LabVIEW-based design and prototyping environment and consists of LabVIEW-based virtual instruments, a multifunction data acquisition device, and a custom-designed bench-top workstation and prototyping board. 39

40 Exercise 2 Simple Data Acquisition Complete Convert C to F.vi, then create Thermometer.vi. Note: To complete this exercise, you will need the IC temperature sensor available on either the BNC-2120, SCB-68 or DAQ Signal Accessory. Estimated completion time: 30 minutes. Instructions: This exercise has three parts. First, create an icon and connector for Convert C to F.vi (Exercise 1). The icon should remind you of the functionality of the VI (e.g. C F or CtoF). The connector should have one input and one output, allowing a terminal for C in, and F out. Second, create a top level VI that acquires a data point from channel 0 (the temperature sensor) of your DAQ board and allows the user to display the temperature in Celsius or Fahrenheit. To do this you will need to acquire a single data point from your DAQ board and scale it by a factor of 100. This will give you C. You should have a Boolean switch or button that allows the user to select Celsius or Fahrenheit. If the user selects Celsius, the scaled value should be displayed in a thermometer indicator. If the user selects Fahrenheit, the Celsius value should be passed into Convert C to F.vi (used as a subvi), and the output Fahrenheit value should be displayed. Hint: Use the Select function in the Comparison palette. 40
41 Finally, create an Icon and Connector for Thermometer.vi. One possible Icon would be a picture of a thermometer. The connector should have two terminals. One for the Boolean input ( C or F), and the second for the scaled temperature output. Save the VI as Thermometer.vi. 41
42 Section IV Loops and Charts For Loop While Loop Charts Multiplots 42
43 Loops While Loops Have Iteration Terminal Always Run at least Once Run According to Conditional Terminal For Loops Have Iteration Terminal Run According to input N of Count Terminal Both the While and For Loops are located on the Functions»Structures palette. The For Loop differs from the While Loop in that the For Loop executes a set number of times. A While Loop stops executing the subdiagram only if the value at the conditional terminal exists. While Loops Similar to a Do Loop or a Repeat-Until Loop in text-based programming languages, a While Loop, shown at the top right, executes a subdiagram until a condition is met. The While Loop executes the sub diagram until the conditional terminal, an input terminal, receives a specific Boolean value. The default behavior and appearance of the conditional terminal is Continue If True, shown at left. When a conditional terminal is Continue If True, the While Loop executes its subdiagram until the conditional terminal receives a FALSE value. The iteration terminal (an output terminal), shown at left, contains the number of completed iterations. The iteration count always starts at zero. During the first iteration, the iteration terminal returns 0. For Loops A For Loop, shown at left, executes a subdiagram a set number of times. The value in the count terminal (an input terminal) represented by the N, indicates how many times to repeat the subdiagram. The iteration terminal (an output terminal), shown at left, contains the number of completed iterations. The iteration count always starts at zero. During the first iteration, the iteration terminal returns 0. 43
: When selected, the mouse cursor becomes a")
44 Loops (cont.) 1. Select the loop 2. Enclose code to be repeated 3. Drop or drag additional nodes and then wire Place loops in your diagram by selecting them from the Structures palette of the Functions palette (demonstrate): When selected, the mouse cursor becomes a special pointer that you use to enclose the section of code you want to repeat. Click the mouse button to define the top-left corner, click the mouse button again at the bottom-right corner, and the While Loop boundary is created around the selected code. Drag or drop additional nodes in the While Loop if needed. 44
45 Charts Waveform chart special numeric indicator that can display a history of values Controls >> Graph Indicators >> Waveform Chart The waveform chart is a special numeric indicator that displays one or more plots. The waveform chart is located on the Controls»Graph Indicators palette. Waveform charts can display single or multiple plots. The following front panel shows an example of a multi-plot waveform chart. You can change the min and max values of either the x or y axis by double clicking on the value with the labeling tool and typing the new value. Similarly, you can change the label of the axis. You can also right click the plot legend and change the style, shape, and color of the trace that is displayed on the chart. 45
46 Wiring Data into Charts Single Plot Charts Multiplot Charts You can wire a scalar output directly to a waveform chart to display one plot. To display multiple plots on one chart, use the Merge Signals function found in the Functions >> Signal Manipulation palette. The Merge Signal function bundles multiple outputs to plot on the waveform chart. To add more plots, use the Positioning tool to resize the Merge Signal function. The context help contains very good information on how the different ways to wire data into charts. 46

47 Exercise 3 Using loops Students build Use a loop.vi. This exercise should take minutes. Instructions: Create a VI that generates a random number at a specified rate and displays the readings on a Waveform Chart until stopped by the user. Connect the termination terminal to a front panel stop button, and add a slider control to the front panel. The slider control should range from 0 to 2000 in value, and be connected to the Time Delay Express VI function inside your while loop. Save the VI as Use a loop.vi. 47
48 Section V Arrays & File I/O Build arrays manually Have LabVIEW build arrays automatically Write to a spreadsheet file Read from a spreadsheet file Arrays group data elements of the same type. An array consists of elements and dimensions. Elements are the data that make up the array. A dimension is the length, height, or depth of an array. An array can have one or more dimensions and as many as 2^31 1 elements per dimension, memory permitting. You can build arrays of numeric, Boolean, path, string, waveform, and cluster data types. Consider using arrays when you work with a collection of similar data and when you perform repetitive computations. Arrays are ideal for storing data you collect from waveforms or data generated in loops, where each iteration of a loop produces one element of the array. Array elements are ordered. An array uses an index so you can readily access any particular element. The index is zero-based, which means it is in the range 0 to n 1, where n is the number of elements in the array. For example, n = 9 for the nine planets, so the index ranges from 0 to 8. Earth is the third planet, so it has an index of 2. File I/O operations pass data to and from files. Use the File I/O VIs and functions located on the Functions» File I/O palette to handle all aspects of file I/O. In this class we will cover reading and writing spreadsheet files using the Express VIs for File I/O. 48
49 Adding an Array to the Front Panel From the Controls >> All Controls >> Array and Cluster subpalette, select the Array Shell Drop it on the screen. To create an array control or indicator as shown, select an array on the Controls»All Controls»Array & Cluster palette, place it on the front panel, and drag a control or indicator into the array shell. If you attempt to drag an invalid control or indicator such as an XY graph into the array shell, you are unable to drop the control or indicator in the array shell. You must insert an object in the array shell before you use the array on the block diagram. Otherwise, the array terminal appears black with an empty bracket. 49
 To add dimensions to an array one at a time, right-click the index display and select Add Dimension from the shortcut menu.")
50 Adding an Array (cont.) Place data object into shell (i.e. Numeric Control) To add dimensions to an array one at a time, right-click the index display and select Add Dimension from the shortcut menu. You also can use the Positioning tool to resize the index display until you have as many dimensions as you want. 50

51 Creating an Array with a Loop Loops accumulate arrays at their boundaries If you wire an array to a For Loop or While Loop input tunnel, you can read and process every element in that array by enabling auto-indexing. When you autoindex an array output tunnel, the output array receives a new element from every iteration of the loop. The wire from the output tunnel to the array indicator becomes thicker as it changes to an array at the loop border, and the output tunnel contains square brackets representing an array, as shown in the following illustration. Disable auto-indexing by right-clicking the tunnel and selecting Disable Indexing from the shortcut menu. For example, disable auto-indexing if you need only the last value passed to the tunnel in the previous example, without creating an array. Note Because you can use For Loops to process arrays an element at a time, LabVIEW enables auto-indexing by default for every array you wire to a For Loop. Auto-indexing for While Loops is disabled by default. To enable auto-indexing, right-click a tunnel and select Enable Indexing from the shortcut menu. If you enable auto-indexing on an array wired to a For Loop input terminal, LabVIEW sets the count terminal to the array size so you do not need to wire the count terminal. If you enable auto-indexing for more than one tunnel or if you wire the count terminal, the count becomes the smaller of the choices. For example, if you wire an array with 10 elements to a For Loop input tunnel and you set the count terminal to 15, the loop executes 10 times. 51

52 Creating 2D Arrays You can use two For Loops, one inside the other, to create a 2D array. The outer For Loop creates the row elements, and the inner For Loop creates the column elements. 52
53 File I/O File I/O passing data to and from files - Files can be binary, text, or spreadsheet - Write/Read LabVIEW Measurements file (*.lvm) Writing to LVM file Reading from LVM file File I/O operations pass data to and from files. In LabVIEW, you can use File I/O functions to: Open and close data files Read data from and write data to files Read from and writ to spreadsheet-formatted files Move and rename files and directories Change file characteristics Create, modify, and read a configuration file Write to or read from LabVIEW Measurements files. In this course we will examine how to write to or read from LabVIEW Measurements files (*.lvm files). 53
54 Write LabVIEW Measurement File Includes the open, write, close and error handling functions Handles formatting the string with either a tab or comma delimiter Merge Signals function is used to combine data into the dynamic data type The Write LVM file can write to spreadsheet files. However, its main purpose is for logging data, that will be used in LabVIEW. This VI creates a.lvm file which can be opened in a spreadsheet application. For simple spreadsheet files, use the Express VIs: Write LVM and Read LVM. 54
55 Exercise 4 Analyzing and Logging Data Students build Temperature Logger.vi Estimated completion time: minutes. Instructions: Create a VI that acquires and displays temperature data at a fixed rate until stopped by the user. If you have completed Exercise 2 and have a DAQ card, use Thermometer.vi to obtain your data. If you have not completed the exercise or do not have a DAQ card, you can use the Digital Thermometer.vi from the Tutorial subpalette of the functions palette. Once stopped, the VI should perform analysis on the data it collected while running. Build up an array of data points and values on the tunnel border of the while loop. Find the maximum, minimum, and mean value of the temperature data and display them in numeric indicators (the mean function can be found in Functions»Analyze»Mathematics»Probability and Statistics, and the Array Max & Min function can be found in Functions»Array). Use the Write LabVIEW Measurements File Express VI, which can be found at Functions»Output. Once it is run, verify that the file was properly created by opening it in Notepad or by creating a VI that reads it back using the Read LabVIEW Measurements File. When you have completed the exercise, save your VI as Temperature Logger.vi. 55
56 Section VI Array Functions & Graphs Basic Array Functions Use graphs Create multiplots with graphs 56


57 Array Functions Basics Functions >> All functions>> Array Use the Array functions located on the Functions»All Functions»Array palette to create and manipulate arrays. Array functions include the following: Array Size Returns the number of elements in each dimension of an array. If the array is n-dimensional, the size output is an array of n elements. Initialize Array Creates an n-dimensional array in which every element is initialized to the value of element. Resize the function to increase the number of dimensions of the output array. Build Array Concatenates multiple arrays or appends elements to an n- dimensional array. Resize the function to increase the number of elements in the output array. Array Subset Returns a portion of an array starting at index and containing length elements. Index Array Returns an element of an array at index. You also can use the Index Array function to extract a row or column of a 2D array to create a subarray of the original. To do so, wire a 2D array to the input of the function. Two index terminals are available. The top index terminal indicates the row, and the second terminal indicates the column. You can wire inputs to both index terminals to index a single element, or you can wire only one terminal to extract a row or column of data. For example, wire the following array to the input of the function. 57


58 Array Functions Build Array Build Array can perform two distinct functions. It Concatenates multiple arrays or appends elements to an n-dimensional array. Resize the function to increase the number of elements in the output array. To concatenate the inputs into a longer array of the same dimension as shown in the following array, right-click the function node and select Concatenate Inputs from the shortcut menu. 58

59 Graphs Selected from the Graph palette of Controls menu Controls>>All Controls>>Graphs Waveform Graph Plot an array of numbers against their indices Express XY Graph Plot one array against another Digital Waveform Graph Plot bits from binary data VIs with graphs usually collect the data in an array and then plot the data to the graph. The graphs located on the Controls» All Controls» Graph palette include the waveform graph and XY graph. The waveform graph plots only single-valued functions, as in y = f(x), with points evenly distributed along the x-axis, such as acquired time-varying waveforms. Express XY graphs display any set of points, evenly sampled or not. Resize the plot legend to display multiple plots. Use multiple plots to save space on the front panel and to make comparisons between plots. XY and waveform graphs automatically adapt to multiple plots. Single-Plot Waveform Graphs The waveform graph accepts a single array of values and interprets the data as points on the graph and increments the x index by one starting at x = 0. The graph also accepts a cluster of an initial x value, a.x, and an array of y data. Refer to the Waveform Graph VI in the examples\general\graphs\gengraph.llb for examples of the data types that single-plot waveform graphs accept. 59
60 Multiple-Plot Waveform Graphs A multiplot waveform graph accepts a 2D array of values, where each row of the array is a single plot. The graph interprets the data as points on the graph and increments the x index by one, starting at x = 0. Wire a 2D array data type to the graph, right-click the graph, and select Transpose Array from the shortcut menu to handle each column of the array as a plot. Refer to the (Y) Multi Plot 1 graph in the Waveform Graph VI in the examples\general\graphs\gengraph.llb for an example of a graph that accepts this data type. A multiplot waveform graph also accepts a cluster of an x value, a x value, and a 2D array of y data. The graph interprets the y data as points on the graph and increments the x index by x, starting at x = 0. Refer to the (Xo, x, Y) Multi Plot 3 graph in the Waveform Graph VI in the examples\general\graphs\gengraph.llb for an example of a graph that accepts this data type. A multiplot waveform graph accepts a cluster of an initial x value, a.x value, and an array that contains clusters. Each cluster contains a point array that contains the y data. You use the Bundle function to bundle the arrays into clusters, and you use the Build Array function to build the resulting clusters into an array. You also can use the Build Cluster Array, which creates arrays of clusters that contain inputs you specify. Refer to the (Xo, x, Y) Multi Plot 2 graph in the Waveform Graph VI in the examples\general\graphs\gengraph.llb for an example of a graph that accepts this data type. Single-Plot XY Graphs The single-plot XY graph accepts a cluster that contains an x array and a y array. The XY graph also accepts an array of points, where a point is a cluster that contains an x value and a y value. Refer to the XY Graph VI in the examples\general\graph\gengraph.llb for an example of single-plot XY graph data types. Multiplot XY Graphs The multiplot XY graph accepts an array of plots, where a plot is a cluster that contains an x array and a y array. The multiplot XY graph also accepts an array of clusters of plots, where a plot is an array of points. A point is a cluster that contains an x value and a y value. Refer to the XY Graph VI in the examples\general\graph\gengraph.llb for an example of multiplot XY graph data types. 60

61 Graphs Right-Click on the Graph and choose Properties to Interactively Customize Graphs are very powerful indicators in LabVIEW. The can are highly customizable, and can be used to concisely display a great deal of information. The properties page of the Graph allows you to display settings for plot types, scale and cursor options, and many other features of the graph. 61


62 Exercise 5 Using Waveform Graphs Estimated Completion Time: 20 minutes. Create a VI like the one pictured above. The VI should use a while loop with a 100 millisecond delay to continuously generate sine and square waves and display them on a waveform graph. Use Simulate Signal Express VI from the Functions»Input palette to generate the signals. The frequency input to each function is chosen by the user Change the colors, visible items, and plot styles of the graph. Experiment with some of the cursor and zooming options available. 62
63 Section VII Strings, Clusters, & Error Handling Strings Creating Clusters Cluster Functions Error I/O 63
64 Strings A string is a sequence of displayable or nondisplayable characters (ASCII) Many uses displaying messages, instrument control, file I/O String control/indicator is in the Controls»Text Control or Text Indicator A string is a sequence of displayable or nondisplayable (ASCII) characters. Strings often are used to send commands to instruments, to supply information about a test (such as operator name and date), or to display results to the user. String controls and indicators are in the Text Control or Text Indicator subpalette of the Controls palette. Enter or change text by using the Operating or Text tool and clicking in the string control. Strings are resizable. String controls and indicators can have scrollbars: Right-click and select Visible Items» Scrollbar. The scroll bar will not be active if the control or indicator is not tall enough. 64
65 Clusters Data structure that groups data together Data may be of different types Analogous to struct in C Elements must be either all controls or all indicators Thought of as wires bundled into a cable Clusters group like or unlike components together. Equivalent to a record in Pascal or a struct in C. Cluster components may be of different data types. Examples: Error information Grouping a Boolean error flag, a numeric error code, and an error source string to specify the exact error. User information Grouping a string indicating a user s name and an ID number specifying their security code. All elements of a cluster must be either controls or indicators. You cannot have a string control and a Boolean indicator. Clusters can be thought of as grouping individual wires (data objects) together into a cable (cluster). 65

66 Creating a Cluster 1. Select a Cluster shell 2. Place objects inside the shell Controls >> All Controls >> Array & Cluster Demonstrate how to create a cluster front panel object by choosing Cluster from the Controls»All Controls»Array & Cluster palette. This option gives you a shell (similar to the array shell when creating arrays). You can size the cluster shell when you drop it. Right click inside the shell and add objects of any type. Note: You can even have a cluster inside of a cluster. The cluster becomes a control or an indicator cluster based on the first object you place inside the cluster. You can also create a cluster constant on the block diagram by choosing Cluster Constant from the Cluster palette. This gives you an empty cluster shell. You can size the cluster when you drop it. Put other constants inside the shell. Note: You cannot place terminals for front panel objects in a cluster constant on the block diagram, nor can you place special constants like the Tab or Empty String constant within a block diagram cluster shell. 66
67 Cluster Functions In the Cluster subpalette of the Functions>>All functions palette Can also be accessed by right-clicking on the cluster terminal (Terminal labels reflect data type) Bundle Bundle By Name Bundle function Forms a cluster containing the given objects (explain the example). Bundle by Name function Updates specific cluster object values (the object must have an owned label). Note: You must have an existing cluster wired into the middle terminal of the function to use Bundle By Name. 67
68 Cluster Functions Unbundle Unbundle By Name Unbundled cluster in the diagram Unbundle function Use to access all of the objects in the cluster. Unbundle by Name function Use to access specific objects (one or more) in the cluster. Note: Only objects in the cluster having an owned label can be accessed. When unbundling by name, click on the terminal with the Operating tool to choose the element you want to access. The Unbundle function must have exactly the same number of terminals as there are elements in the cluster. Adding or removing elements to the cluster breaks wires on the diagram. You can also obtain the Bundle, Unbundle, Bundle by Name, and Unbundle by Name functions by right clicking on the cluster terminal in the diagram and choosing Cluster Tools from the pop-up menu. When you choose Cluster Tools, the Bundle and Unbundle functions automatically contain the correct number of terminals. The Bundle by Name and Unbundle by Name functions appear with the first cluster element. 68
69 Error Clusters Error cluster contains the following information: Boolean to report whether error occurred Integer to report a specific error code String to give information about the error Error clusters are a powerful means of handling errors. The LabVIEW DAQ VIs, File I/O functions, networking VIs, and many other VI s use this method to pass error information between nodes. The error cluster contains the following elements: status, a Boolean which is set to True if an error occurs. code, a numeric which is set to a code number corresponding to the error that occurred. source, a string which identifies the VI in which the error occurred. 69
70 Error Handling Techniques Error information is passed from one subvi to the next If an error occurs in one subvi, all subsequent subvis are not executed in the usual manner Error Clusters contain all error conditions Automatic Error Handling error clusters Error clusters are useful in determining the execution of subvis when an error is encountered. Note also that error clusters can be useful in determining program flow due to the dataflow programming paradigm. This can be especially useful when setting up sampling on more than one DAQ board simultaneously. The unbundle by name function shows the components of an error cluster. 70
71 Section VIII - Case & Sequence Structures, Formula Nodes 71
72 Case Structures In the Structures subpalette of Functions palette Enclose nodes or drag them inside the structure Stacked like a deck of cards, only one case visible Functions >> Execution control The Case structure allows you to choose a course of action depending on an input value. In the Execution Control subpalette of the Functions palette. Analogous to an if-then-else statement in other languages. Like a deck of cards. You can see only one case at a time. Example 1: Boolean input: Simple if-then case. If the Boolean input is TRUE, the true case will execute; otherwise the FALSE case will execute. Example 2: Numeric input. The input value determines which box to execute. If out of range of the cases, LabVIEW will choose the default case. Example 3: String input. Like the numeric input case, the value of the string determines which box to execute. Stress that the value much match exactly or the structure will execute the default case. 72

73 Exercise 6 Error Clusters & Handling Estimated Completion Time: 20 minutes. Create a VI that takes the square root of a number. If the number is greater than or equal to zero, the VI should return its square root, and generate no error. If the number is less than zero, the VI should return the value , and insert an error into the error cluster. Use a Case structure from the and the Greater or Equal To 0? function from the numeric palette to determine whether the VI will compute the square root or generate the error. The False case shown above is the error case. Use a Bundle By Name function from the cluster palette to insert a Boolean, Numeric, and String Constant into the Status, Code, and Source cluster items, respectively. The values of the constants should be True, 5008 (an arbitrary user defined error code), and Square Root.vi (the name of the VI that generated the error). Wire the new cluster into the Error Out indicator, and a constant value of to the Square Root indicator. The True case, not shown, should merely wire the error in control directly through the case to the error out indicator. The Square Root Input should be wired to the Square Root function from the numeric palette, and the result should be wired out of the case into the Square Root indicator. Point out that this VI could be easily configured as a subvi for a larger piece of code, and troubleshooting and debugging is much easier when errors clusters are properly used. 73

74 Sequence Structures In the Execution Control subpalette of Functions palette Executes diagrams sequentially Right-click to add new frame In a text-based language, program statements execute in the order in which they appear. In data flow, a node executes when data is available at all its input terminals. Sometimes it is hard to tell the exact order of execution. Often, certain events must take place before other events. When you need to control the order of execution of code in your block diagram, you can use a sequence structure. Sequence structure: Used to control the order in which nodes in a diagram will execute. In the Execution Control subpalette. Looks like a frame of film. Used to execute diagrams sequentially. Right-click on the border to create a new frame. 74
75 Formula Nodes In the Structures subpalette Implement complicated equations Variables created at border Variable names are case sensitive Each statement must terminate with a semicolon (;) Context Help Window shows available functions Note semicolon Sometimes it is preferable to program mathematical expressions with text-based function calls, rather than icons (which can take up a lot of room on the diagram). Formula Node: allows you to implement complicated equations using textbased instructions. Located in the Structures subpalette. Resizable box for entering algebraic formulas directly into block diagrams. To add variables, right-click and choose Add Input or Add Output. Name variables as they are used in formula. (Names are case sensitive.) Statements must be terminated with a semicolon. When using several formulas in a single formula node, every assigned variable (those appearing on the left hand side of each formula) must have an output terminal on the formula node. These output terminals do not need to be wired, however. Compare the examples on the slide. 75
76 Section IX Printing & Documentation Print From File Menu to Printer, HTML, Rich Text File Programmatically Print Graphs or Front Panel Images Document VIs in VI Properties» Documentation Dialog Add Comments Using Free Labels on Front Panel & Block Diagram 76
77 Printing File» Print Gives Many Printing Options Choose to Print Icon, Front Panel, Block Diagram, VI Hierarchy, Included SubVIs, VI History Print Panel.vi (Programmatically Prints a Front Panel) Functions» All Functions» Application Control Generate & Print Reports (Functions» Output» Report) LabVIEW offers many options for printing VIs. From the standard File» Print menu, the user can print a hard copy of his or her VI, or print the VI to a file for storage or publishing. Using the Print Panel VI in LabVIEW allows the user to programmatically print the results of a test. VIs can also be configured to print automatically after execution. This option is set in VI Properties» Print Options. For more advanced applications, LabVIEW has report generation tools that allow the user to create custom reports for individual applications. LabVIEW 7.0 includes an Express VI called Report. This VI generates a preformatted report that contains VI documentation, data the VI returns, and report properties, such as the author, company, and number of pages. 77
78 Documenting VIs VI Properties» Documentation Provide a Description and Help Information for a VI VI Properties» Revision History Track Changes Between Versions of a VI Individual Controls» Description and Tip Right Click to Provide Description and Tip Strip Use Labeling Tool to Document Front Panels & Block Diagrams By opening a VI s properties a developer can add documentation to his or her VI. The documentation placed in the Description field of the VI Documentation window shows up in Context Help, and prints with the VI. If a user has an application that is continually developing, he or she can track changes in the development with Revision History, also found in VI Properties. Any control or indicator on the Front Panel can be documented by right-clicking and choosing Description and Tip The Description information appears in the Context Help menu when a user hovers the mouse over the object, and the Tip information pops up in a small strip next to the mouse when the user pauses above the object. Much like comments in a text-based language, the developer may want to explain a portion of his code, or provide directions on a front panel. Either of these needs can be met by using the labeling tool to create a free text box with as many instructions or explanations as necessary. 78
79 Section X Basic Programming Architecture Simple VI Architecture General VI Architecture State Machine Architecture You can structure VIs differently depending on what functionality you want them to have. This section discusses some of the most common types of VI architectures, along with their advantages/disadvantages: simple, general, and state machines. 79

80 Simple VI Architecture Functional VI that produces results when run No start or stop options Suitable for lab tests, calculations Example: Convert C to F.vi Simple VI Architecture When making quick lab measurements, you do not need a complicated architecture. Your program may consist of a single VI that takes a measurement, performs calculations, and either displays the results or records them to disk. The measurement can be initiated when the user clicks on the run arrow. In addition to being commonly used for simple applications, this architecture is used for functional components within larger applications. You can convert these simple VIs into subvis that are used as building blocks for larger applications. 80
81 General VI Architecture Three Main Steps Startup Main Application Shutdown General VI Architecture In designing an application, you generally have up to three main phases: Startup Use this area to initialize hardware, read configuration information from files, or prompt the user for data file locations. Main Application Generally consists of at least one loop that repeats until the user decides to exit the program, or the program terminates for other reasons such as I/O completion. Shutdown This section usually takes care of closing files, writing configuration information to disk, or resetting I/O to its default state. The diagram above shows this general architecture. For simple applications, the main application loop can be fairly straightforward. When you have complicated user interfaces or multiple events (user action, I/O triggers, and so on), this section can get more complicated. 81
82 State Machine Architecture Advantages Can go from any state from any other Easy to modify and debug Disadvantages Can lose events if two occur at the same time States: 0: Startup 1: Idle 2: Event 1 3: Event 2 4: Shutdown State Machine VI Architecture You can make your diagrams more compact by using a single case structure to handle all of your events. In this model, you scan the list of possible events, or states, and then map that to a case. For the VI shown above, the possible states are startup, idle, event 1, event 2, and shutdown. These states are stored in an enumerated constant. Each state has its own case where you place the appropriate nodes. While a case is running, the next state is determined based on the current outcome. The next state to run is stored in the shift register. If an error occurs an any of the states, the shutdown case is called. The advantage of this model is that your diagram can become significantly smaller (left to right), making it easier to read and debug. One drawback of the Sequence structure is that it cannot skip or break out of a frame. This method solves that problem because each case determines what the next state will be as it runs. A disadvantage to this approach is that with the simple approach shown above, you can lose events. If two events occur at the same time, this model handles only the first one, and the second one is lost. This can lead to errors that are difficult to debug because they may occur only occasionally. More complex versions of the state machine VI architecture contain extra code that builds a queue of events (states) so that you do not miss any events. 82
83 Exercise 7 Simple State Machine Estimated Completion Time: 25 minutes. In this exercise we will create a VI using state machine architecture. The VI will have an idle state, where it waits for input. When the user presses a button, the VI will go to State 1. State 1 will generate a pop-up dialog box that allows the sure to proceed to State 2 or start over. From State 2 the user can choose to exit the program or start over. Rather than start from scratch, we will use a VI template to create our state machine. From the File menu, instead of selecting New VI,select New, and click on Start from template. Browse to \Program Files\National Instruments\LabVIEW 6.1\templates\State Machine.vit, and open it. This opens a template for a state machine using strings to control the state. Examine the template, and then save it in another directory before you begin working on it. The first state we will make is the Initialize state. Notice this state has already been created for us, and is the default state. In the Initialize case, place a One Button Dialog (Functions» Time & Dialog), and wire Initialized. Click OK to proceed. into the message terminal. Replace the text Next State with Idle. 83
84 Right click on the case structure and, choose Add Case After, and name the case Idle. Inside the Idle case, place a second case structure. Wire a Boolean called Begin Test to the select terminal for the inner case structure, and wire a string constant with the value Test out of the True case to the shift register. In the False case, wire the value Idle out to the shift register. This setup will keep the state machine in the Idle state until the user presses the button to begin the test. Right click on the Boolean output tunnel and choose Create» Constant. Set the constant value to True. Right click on the main case structure and add another case. Call this case Test. In the Test case, place a Two Button Dialog (Functions» Time & Dialog). Wire the text The test has run. Click OK to quit, Cancel to test again. into the message terminal. Place another case structure inside the Test case, and wire T button? the output of the Two Button Dialog into the selection terminal. Wire a value of Idle out of the False case into the shift register, and a Boolean True constant into the termination condition of the while loop. The True case should contain an empty string constant, and a Boolean False wired into the termination condition. This will terminate the program if the user presses OK, and return it back to the idle state if the user presses Cancel. 84
85 Section XI Remote Front Panels View & Control LabVIEW Front Panels from a Web Browser Requires no programming Remote clients see live front panel updates Multiple clients can view the same panel simultaneously Only one client can control the front panel at a time In LabVIEW, a feature called remote front panels allow users to view and control the VI front panels remotely from LabVIEW or from a web browser without any programming. A user can run an application or check progress from anywhere. In addition, several users at different locations all can access the VI simultaneously. Remote panel clients will see live updates to the VI front panel, as opposed to static images. There can be multiple clients simultaneously viewing the same front panel. However, only one client can control the front panel at a time. 85

86 Remote Panel Web Publishing Tool Tools» Web Publishing Tool Click Save to Disk and VI is embedded into an HTML file After file is saved, it can be reopened and customized in any HTML editor To embed your VI into a web page, simply open the Web Publishing Tool from the Tools pull-down menu. The Web Publishing Tool creates a simple html file with the LabVIEW front panel embedded inside it. From the tool, you can create a title, and supply text before and after the front panel object. Once you have created the html file, you can preview it in a web browser, and save the file to disk. Saving the file places the html file in your LabVIEW www directory, which is the default directory for the LabVIEW web server. You can start the web server from the Web Publishing Tool, or from Tools» Options» Web Server: Configuration. (Note: in the Tools» Options menu you can also configure access rights and exposed VI s for your web server. If you would like to customize your web page beyond what the Web Publishing Tool provides, simply open the html file in another html editor, and customize around the embedded LabVIEW panel code. 86
EET 310 Programming Tools
 Introduction EET 310 Programming Tools LabVIEW Part 1 (LabVIEW Environment) LabVIEW (short for Laboratory Virtual Instrumentation Engineering Workbench) is a graphical programming environment from National
LabVIEW Day 1 Basics. Vern Lindberg. 1 The Look of LabVIEW
 LabVIEW Day 1 Basics Vern Lindberg LabVIEW first shipped in 1986, with very basic objects in place. As it has grown (currently to Version 10.0) higher level objects such as Express VIs have entered, additional
Introduction to LabVIEW
 Telemark University College Department of Electrical Engineering, Information Technology and Cybernetics Introduction to LabVIEW HANS- PETTER HALVORSEN, 2014.03.07 Faculty of Technology, Postboks 203,
LabVIEW Tutorial Manual
 LabVIEW Tutorial Manual January 1996 Edition Part Number 320998A-01 Copyright 1993, 1996 National Instruments Corporation. All Rights Reserved. Internet Support GPIB: gpib.support@natinst.com DAQ: daq.support@natinst.com
Exercise 10: Basic LabVIEW Programming
 Exercise 10: Basic LabVIEW Programming In this exercise we will learn the basic principles in LabVIEW. LabVIEW will be used in later exercises and in the project part, as well in other courses later, so
LabVIEW Lesson 5 Clusters
 LabVIEW Lesson 5 Clusters Lesson Overview What are clusters? How to create a cluster. How to create a constant cluster. How to use the various cluster functions. I. What is a cluster? a. A cluster is similar
Lab 4 - Data Acquisition
 Spring 11 Lab 4 - Data Acquisition Lab 4-1 Lab 4 - Data Acquisition Format This lab will be conducted during your regularly scheduled lab time in a group format. Each student is responsible for learning
Lab 3: Introduction to Data Acquisition Cards
 Lab 3: Introduction to Data Acquisition Cards INTRODUCTION: In this lab, you will be building a VI to display the input measured on a channel. However, within your own VI you will use LabVIEW supplied
Excel 2007 Basic knowledge
 Ribbon menu The Ribbon menu system with tabs for various Excel commands. This Ribbon system replaces the traditional menus used with Excel 2003. Above the Ribbon in the upper-left corner is the Microsoft
Sample. LabVIEW TM Core 1 Course Manual. Course Software Version 2010 August 2010 Edition Part Number 325290B-01
 LabVIEW TM Core 1 Course Manual Course Software Version 2010 August 2010 Edition Part Number 325290B-01 LabVIEW Core 1 Course Manual Copyright 1993 2010 National Instruments Corporation. All rights reserved.
User Guide to LabVIEW & APT
 User Guide to LabVIEW & APT Guide to LabVIEW and APT Page 1 Contents CHAPTER 1 INTRODUCTION TO LABVIEW AND APT...6 LabVIEW...6 APT...6 APT within LabVIEW...6 CHAPTER 2 LABVIEW PROGRAMS...7 Front Panel...7
Advanced Presentation Features and Animation
 There are three features that you should remember as you work within PowerPoint 2007: the Microsoft Office Button, the Quick Access Toolbar, and the Ribbon. The function of these features will be more
Getting Started with the LabVIEW Embedded Module for ARM Microcontrollers 1.0 For the Keil MCB2300
 Getting Started with the LabVIEW Embedded Module for ARM Microcontrollers 1.0 For the Keil MCB2300 Contents The LabVIEW Embedded Module for ARM Microcontrollers is a comprehensive graphical development
Getting Started with the LabVIEW Mobile Module Version 2009
 Getting Started with the LabVIEW Mobile Module Version 2009 Contents The LabVIEW Mobile Module extends the LabVIEW graphical development environment to Mobile devices so you can create applications that
Handout: Word 2010 Tips and Shortcuts
 Word 2010: Tips and Shortcuts Table of Contents EXPORT A CUSTOMIZED QUICK ACCESS TOOLBAR... 2 IMPORT A CUSTOMIZED QUICK ACCESS TOOLBAR... 2 USE THE FORMAT PAINTER... 3 REPEAT THE LAST ACTION... 3 SHOW
Microsoft Excel 2010 Tutorial
 1 Microsoft Excel 2010 Tutorial Excel is a spreadsheet program in the Microsoft Office system. You can use Excel to create and format workbooks (a collection of spreadsheets) in order to analyze data and
Microsoft Excel 2010 Charts and Graphs
 Microsoft Excel 2010 Charts and Graphs Email: training@health.ufl.edu Web Page: http://training.health.ufl.edu Microsoft Excel 2010: Charts and Graphs 2.0 hours Topics include data groupings; creating
Microsoft Excel 2010 Part 3: Advanced Excel
 CALIFORNIA STATE UNIVERSITY, LOS ANGELES INFORMATION TECHNOLOGY SERVICES Microsoft Excel 2010 Part 3: Advanced Excel Winter 2015, Version 1.0 Table of Contents Introduction...2 Sorting Data...2 Sorting
Windows XP Pro: Basics 1
 NORTHWEST MISSOURI STATE UNIVERSITY ONLINE USER S GUIDE 2004 Windows XP Pro: Basics 1 Getting on the Northwest Network Getting on the Northwest network is easy with a university-provided PC, which has
Dash 18X / Dash 18 Data Acquisition Recorder
 75 Dash 18X / Dash 18 Data Acquisition Recorder QUICK START GUIDE Supports Recorder System Software Version 3.1 1. INTRODUCTION 2. GETTING STARTED 3. HARDWARE OVERVIEW 4. MENUS & BUTTONS 5. USING THE DASH
Microsoft PowerPoint 2010 Handout
 Microsoft PowerPoint 2010 Handout PowerPoint is a presentation software program that is part of the Microsoft Office package. This program helps you to enhance your oral presentation and keep the audience
PowerPoint 2007 Basics Website: http://etc.usf.edu/te/
 Website: http://etc.usf.edu/te/ PowerPoint is the presentation program included in the Microsoft Office suite. With PowerPoint, you can create engaging presentations that can be presented in person, online,
Introduction to Microsoft Excel 2007/2010
 to Microsoft Excel 2007/2010 Abstract: Microsoft Excel is one of the most powerful and widely used spreadsheet applications available today. Excel's functionality and popularity have made it an essential
Introduction to dobe Acrobat XI Pro
 Introduction to dobe Acrobat XI Pro Introduction to Adobe Acrobat XI Pro is licensed under the Creative Commons Attribution-NonCommercial-NoDerivatives 4.0 International License. To view a copy of this
Microsoft Word 2010. Quick Reference Guide. Union Institute & University
 Microsoft Word 2010 Quick Reference Guide Union Institute & University Contents Using Word Help (F1)... 4 Window Contents:... 4 File tab... 4 Quick Access Toolbar... 5 Backstage View... 5 The Ribbon...
Data Acquisition Using NI-DAQmx
 Instructor s Portion Data Acquisition Using NI-DAQmx Wei Lin Department of Biomedical Engineering Stony Brook University Summary This experiment requires the student to use NI-DAQmx to acquire voltage
Ohio University Computer Services Center August, 2002 Crystal Reports Introduction Quick Reference Guide
 Open Crystal Reports From the Windows Start menu choose Programs and then Crystal Reports. Creating a Blank Report Ohio University Computer Services Center August, 2002 Crystal Reports Introduction Quick
Using Microsoft Word. Working With Objects
 Using Microsoft Word Many Word documents will require elements that were created in programs other than Word, such as the picture to the right. Nontext elements in a document are referred to as Objects
MicroStrategy Analytics Express User Guide
 MicroStrategy Analytics Express User Guide Analyzing Data with MicroStrategy Analytics Express Version: 4.0 Document Number: 09770040 CONTENTS 1. Getting Started with MicroStrategy Analytics Express Introduction...
Getting Started with Excel 2008. Table of Contents
 Table of Contents Elements of An Excel Document... 2 Resizing and Hiding Columns and Rows... 3 Using Panes to Create Spreadsheet Headers... 3 Using the AutoFill Command... 4 Using AutoFill for Sequences...
PowerWorld Simulator
 PowerWorld Simulator Quick Start Guide 2001 South First Street Champaign, Illinois 61820 +1 (217) 384.6330 support@powerworld.com http://www.powerworld.com Purpose This quick start guide is intended to
Microsoft Office 2010: Introductory Q&As PowerPoint Chapter 1
 Microsoft Office 2010: Introductory Q&As PowerPoint Chapter 1 Are the themes displayed in a specific order? (PPT 6) Yes. They are arranged in alphabetical order running from left to right. If you point
LabVIEW Day 6: Saving Files and Making Sub vis
 LabVIEW Day 6: Saving Files and Making Sub vis Vern Lindberg You have written various vis that do computations, make 1D and 2D arrays, and plot graphs. In practice we also want to save that data. We will
Intro to Excel spreadsheets
 Intro to Excel spreadsheets What are the objectives of this document? The objectives of document are: 1. Familiarize you with what a spreadsheet is, how it works, and what its capabilities are; 2. Using
Introduction to Modern Data Acquisition with LabVIEW and MATLAB. By Matt Hollingsworth
 Introduction to Modern Data Acquisition with LabVIEW and MATLAB By Matt Hollingsworth Introduction to Modern Data Acquisition Overview... 1 LabVIEW Section 1.1: Introduction to LabVIEW... 3 Section 1.2:
Excel 2003 Tutorial I
 This tutorial was adapted from a tutorial by see its complete version at http://www.fgcu.edu/support/office2000/excel/index.html Excel 2003 Tutorial I Spreadsheet Basics Screen Layout Title bar Menu bar
Custom Reporting System User Guide
 Citibank Custom Reporting System User Guide April 2012 Version 8.1.1 Transaction Services Citibank Custom Reporting System User Guide Table of Contents Table of Contents User Guide Overview...2 Subscribe
Test Generator. Creating Tests
 Test Generator Creating Tests Table of Contents# Cognero Overview... 1 Cognero Basic Terminology... 2 Logging On to Cognero... 3 Test Generator Organization... 4 Question Sets Versus Tests... 4 Editing
Microsoft Access 2010 Part 1: Introduction to Access
 CALIFORNIA STATE UNIVERSITY, LOS ANGELES INFORMATION TECHNOLOGY SERVICES Microsoft Access 2010 Part 1: Introduction to Access Fall 2014, Version 1.2 Table of Contents Introduction...3 Starting Access...3
SMART NOTEBOOK 10. Instructional Technology Enhancing ACHievement
 SMART NOTEBOOK 10 Instructional Technology Enhancing ACHievement TABLE OF CONTENTS SMART Notebook 10 Themes... 3 Page Groups... 4 Magic Pen... 5 Shape Pen... 6 Tables... 7 Object Animation... 8 Aligning
Intellect Platform - The Workflow Engine Basic HelpDesk Troubleticket System - A102
 Intellect Platform - The Workflow Engine Basic HelpDesk Troubleticket System - A102 Interneer, Inc. Updated on 2/22/2012 Created by Erika Keresztyen Fahey 2 Workflow - A102 - Basic HelpDesk Ticketing System
Hands-onIntroduction todataacquisition
 ni.com/events Hands-onIntroduction todataacquisition withlabview ni.com/uk ni.com/ireland ni.com/uk/handson Introduction to LabVIEW and Computer-Based Measurements Hands-On Seminar 1 Company Profile Leaders
Dash 8Xe / Dash 8X Data Acquisition Recorder
 75 Dash 8Xe / Dash 8X Data Acquisition Recorder QUICK START GUIDE Supports Recorder System Software Version 2.0 1. INTRODUCTION 2. GETTING STARTED 3. HARDWARE OVERVIEW 4. MENUS & BUTTONS 5. USING THE DASH
Microsoft Excel 2010. Understanding the Basics
 Microsoft Excel 2010 Understanding the Basics Table of Contents Opening Excel 2010 2 Components of Excel 2 The Ribbon 3 o Contextual Tabs 3 o Dialog Box Launcher 4 o Quick Access Toolbar 4 Key Tips 5 The
Creating Drawings in Pro/ENGINEER
 6 Creating Drawings in Pro/ENGINEER This chapter shows you how to bring the cell phone models and the assembly you ve created into the Pro/ENGINEER Drawing mode to create a drawing. A mechanical drawing
Internet Explorer 7. Getting Started The Internet Explorer Window. Tabs NEW! Working with the Tab Row. Microsoft QUICK Source
 Microsoft QUICK Source Internet Explorer 7 Getting Started The Internet Explorer Window u v w x y { Using the Command Bar The Command Bar contains shortcut buttons for Internet Explorer tools. To expand
Welcome to CorelDRAW, a comprehensive vector-based drawing and graphic-design program for the graphics professional.
 Workspace tour Welcome to CorelDRAW, a comprehensive vector-based drawing and graphic-design program for the graphics professional. In this tutorial, you will become familiar with the terminology and workspace
Visualization with Excel Tools and Microsoft Azure
 Visualization with Excel Tools and Microsoft Azure Introduction Power Query and Power Map are add-ins that are available as free downloads from Microsoft to enhance the data access and data visualization
Desktop, Web and Mobile Testing Tutorials
 Desktop, Web and Mobile Testing Tutorials * Windows and the Windows logo are trademarks of the Microsoft group of companies. 2 About the Tutorial With TestComplete, you can test applications of three major
First Bytes Programming Lab 2
 First Bytes Programming Lab 2 This lab is available online at www.cs.utexas.edu/users/scottm/firstbytes. Introduction: In this lab you will investigate the properties of colors and how they are displayed
Excel 2007: Basics Learning Guide
 Excel 2007: Basics Learning Guide Exploring Excel At first glance, the new Excel 2007 interface may seem a bit unsettling, with fat bands called Ribbons replacing cascading text menus and task bars. This
Navios Quick Reference
 Navios Quick Reference Purpose: The purpose of this Quick Reference is to provide a simple step by step outline of the information needed to perform various tasks on the system. We begin with basic tasks
Excel Unit 4. Data files needed to complete these exercises will be found on the S: drive>410>student>computer Technology>Excel>Unit 4
 Excel Unit 4 Data files needed to complete these exercises will be found on the S: drive>410>student>computer Technology>Excel>Unit 4 Step by Step 4.1 Creating and Positioning Charts GET READY. Before
Getting Started with Vision 6
 Getting Started with Vision 6 Version 6.9 Notice Copyright 1981-2009 Netop Business Solutions A/S. All Rights Reserved. Portions used under license from third parties. Please send any comments to: Netop
Contents. Launching FrontPage... 3. Working with the FrontPage Interface... 3 View Options... 4 The Folders List... 5 The Page View Frame...
 Using Microsoft Office 2003 Introduction to FrontPage Handout INFORMATION TECHNOLOGY SERVICES California State University, Los Angeles Version 1.0 Fall 2005 Contents Launching FrontPage... 3 Working with
Formulas, Functions and Charts
 Formulas, Functions and Charts :: 167 8 Formulas, Functions and Charts 8.1 INTRODUCTION In this leson you can enter formula and functions and perform mathematical calcualtions. You will also be able to
Introduction to Microsoft Excel 2010
 Introduction to Microsoft Excel 2010 Screen Elements Quick Access Toolbar The Ribbon Formula Bar Expand Formula Bar Button File Menu Vertical Scroll Worksheet Navigation Tabs Horizontal Scroll Bar Zoom
To launch the Microsoft Excel program, locate the Microsoft Excel icon, and double click.
 EDIT202 Spreadsheet Lab Assignment Guidelines Getting Started 1. For this lab you will modify a sample spreadsheet file named Starter- Spreadsheet.xls which is available for download from the Spreadsheet
Excel 2007 A Beginners Guide
 Excel 2007 A Beginners Guide Beginner Introduction The aim of this document is to introduce some basic techniques for using Excel to enter data, perform calculations and produce simple charts based on
Creating a Poster in PowerPoint 2010. A. Set Up Your Poster
 View the Best Practices in Poster Design located at http://www.emich.edu/training/poster before you begin creating a poster. Then in PowerPoint: (A) set up the poster size and orientation, (B) add and
ABOUT THIS DOCUMENT ABOUT CHARTS/COMMON TERMINOLOGY
 A. Introduction B. Common Terminology C. Introduction to Chart Types D. Creating a Chart in FileMaker E. About Quick Charts 1. Quick Chart Behavior When Based on Sort Order F. Chart Examples 1. Charting
Instructions for Use. CyAn ADP. High-speed Analyzer. Summit 4.3. 0000050G June 2008. Beckman Coulter, Inc. 4300 N. Harbor Blvd. Fullerton, CA 92835
 Instructions for Use CyAn ADP High-speed Analyzer Summit 4.3 0000050G June 2008 Beckman Coulter, Inc. 4300 N. Harbor Blvd. Fullerton, CA 92835 Overview Summit software is a Windows based application that
Basic Excel Handbook
 2 5 2 7 1 1 0 4 3 9 8 1 Basic Excel Handbook Version 3.6 May 6, 2008 Contents Contents... 1 Part I: Background Information...3 About This Handbook... 4 Excel Terminology... 5 Excel Terminology (cont.)...
Using Microsoft Project 2000
 Using MS Project Personal Computer Fundamentals 1 of 45 Using Microsoft Project 2000 General Conventions All text highlighted in bold refers to menu selections. Examples would be File and Analysis. ALL
The Center for Teaching, Learning, & Technology
 The Center for Teaching, Learning, & Technology Instructional Technology Workshops Microsoft Excel 2010 Formulas and Charts Albert Robinson / Delwar Sayeed Faculty and Staff Development Programs Colston
Maple Quick Start. Introduction. Talking to Maple. Using [ENTER] 3 (2.1)
![Maple Quick Start. Introduction. Talking to Maple. Using [ENTER] 3 (2.1)](/thumbs/19/376447.jpg "Maple Quick Start. Introduction. Talking to Maple. Using [ENTER] 3 (2.1)") Introduction Maple Quick Start In this introductory course, you will become familiar with and comfortable in the Maple environment. You will learn how to use context menus, task assistants, and palettes
Introduction Maple Quick Start In this introductory course, you will become familiar with and comfortable in the Maple environment. You will learn how to use context menus, task assistants, and palettes
CORSAIR GAMING KEYBOARD SOFTWARE USER MANUAL
 CORSAIR GAMING KEYBOARD SOFTWARE USER MANUAL TABLE OF CONTENTS CORSAIR UTILITY ENGINE OVERVIEW PROFILES 1 9 Introduction 2 Starting the Corsair Utility Engine 2 Profiles: Settings for a Specific Program
MicroStrategy Desktop
 MicroStrategy Desktop Quick Start Guide MicroStrategy Desktop is designed to enable business professionals like you to explore data, simply and without needing direct support from IT. 1 Import data from
MICROSOFT OFFICE ACCESS 2007 - NEW FEATURES
 MICROSOFT OFFICE 2007 MICROSOFT OFFICE ACCESS 2007 - NEW FEATURES Exploring Access Creating and Working with Tables Finding and Filtering Data Working with Queries and Recordsets Working with Forms Working
BIGPOND ONLINE STORAGE USER GUIDE Issue 1.1.0-18 August 2005
 BIGPOND ONLINE STORAGE USER GUIDE Issue 1.1.0-18 August 2005 PLEASE NOTE: The contents of this publication, and any associated documentation provided to you, must not be disclosed to any third party without
Sample Table. Columns. Column 1 Column 2 Column 3 Row 1 Cell 1 Cell 2 Cell 3 Row 2 Cell 4 Cell 5 Cell 6 Row 3 Cell 7 Cell 8 Cell 9.
 Working with Tables in Microsoft Word The purpose of this document is to lead you through the steps of creating, editing and deleting tables and parts of tables. This document follows a tutorial format
Navigator Software. Contents 1. NAVIGATOR SOFTWARE 2. INSTALLATION 3. USING NAVIGATOR SOFTWARE 3.1 STARTING THE PROGRAM 3.
 Navigator Software Contents 1. NAVIGATOR SOFTWARE 2. INSTALLATION 3. USING NAVIGATOR SOFTWARE 3.1 STARTING THE PROGRAM 3.2 SYSTEM SET UP 3.3 LOAD DATA FILE 3.3.1 LOADING PARTIAL FILES 3.4 DATA TABLE WINDOW
How To Run A Factory I/O On A Microsoft Gpu 2.5 (Sdk) On A Computer Or Microsoft Powerbook 2.3 (Powerpoint) On An Android Computer Or Macbook 2 (Powerstation) On
 On A Computer Or Microsoft Powerbook 2.3 (Powerpoint) On An Android Computer Or Macbook 2 (Powerstation) On") User Guide November 19, 2014 Contents 3 Welcome 3 What Is FACTORY I/O 3 How Does It Work 4 I/O Drivers: Connecting To External Technologies 5 System Requirements 6 Run Mode And Edit Mode 7 Controls 8 Cameras
User Guide November 19, 2014 Contents 3 Welcome 3 What Is FACTORY I/O 3 How Does It Work 4 I/O Drivers: Connecting To External Technologies 5 System Requirements 6 Run Mode And Edit Mode 7 Controls 8 Cameras
Adobe Dreamweaver CC 14 Tutorial
 Adobe Dreamweaver CC 14 Tutorial GETTING STARTED This tutorial focuses on the basic steps involved in creating an attractive, functional website. In using this tutorial you will learn to design a site
Excel Tutorial. Bio 150B Excel Tutorial 1
 Bio 15B Excel Tutorial 1 Excel Tutorial As part of your laboratory write-ups and reports during this semester you will be required to collect and present data in an appropriate format. To organize and
How to test and debug an ASP.NET application
 Chapter 4 How to test and debug an ASP.NET application 113 4 How to test and debug an ASP.NET application If you ve done much programming, you know that testing and debugging are often the most difficult
Business Objects Version 5 : Introduction
 Business Objects Version 5 : Introduction Page 1 TABLE OF CONTENTS Introduction About Business Objects Changing Your Password Retrieving Pre-Defined Reports Formatting Your Report Using the Slice and Dice
Joomla! 2.5.x Training Manual
 Joomla! 2.5.x Training Manual Joomla is an online content management system that keeps track of all content on your website including text, images, links, and documents. This manual includes several tutorials
Smart Board Notebook Software A guide for new Smart Board users
 Smart Board Notebook Software A guide for new Smart Board users This guide will address the following tasks in Notebook: 1. Adding shapes, text, and pictures. 2. Searching the Gallery. 3. Arranging objects
Basic Microsoft Excel 2007
 Basic Microsoft Excel 2007 The biggest difference between Excel 2007 and its predecessors is the new layout. All of the old functions are still there (with some new additions), but they are now located
Excel. Microsoft Office s spreadsheet application can be used to track. and analyze numerical data for display on screen or in printed
 Excel Microsoft Office s spreadsheet application can be used to track and analyze numerical data for display on screen or in printed format. Excel is designed to help you record and calculate data, and
Excel 2003 A Beginners Guide
 Excel 2003 A Beginners Guide Beginner Introduction The aim of this document is to introduce some basic techniques for using Excel to enter data, perform calculations and produce simple charts based on
EXCEL PIVOT TABLE David Geffen School of Medicine, UCLA Dean s Office Oct 2002
 EXCEL PIVOT TABLE David Geffen School of Medicine, UCLA Dean s Office Oct 2002 Table of Contents Part I Creating a Pivot Table Excel Database......3 What is a Pivot Table...... 3 Creating Pivot Tables
Introduction to MS WINDOWS XP
 Introduction to MS WINDOWS XP Mouse Desktop Windows Applications File handling Introduction to MS Windows XP 2 Table of Contents What is Windows XP?... 3 Windows within Windows... 3 The Desktop... 3 The
Getting Started on the Computer With Mouseaerobics! Windows XP
 This handout was modified from materials supplied by the Bill and Melinda Gates Foundation through a grant to the Manchester City Library. Getting Started on the Computer With Mouseaerobics! Windows XP
PowerPoint 2013: Basic Skills
 PowerPoint 2013: Basic Skills Information Technology September 1, 2014 1 P a g e Getting Started There are a variety of ways to start using PowerPoint software. You can click on a shortcut on your desktop
Macros in Word & Excel
 Macros in Word & Excel Description: If you perform a task repeatedly in Word or Excel, you can automate the task by using a macro. A macro is a series of steps that is grouped together as a single step
I ntroduction. Accessing Microsoft PowerPoint. Anatomy of a PowerPoint Window
 Accessing Microsoft PowerPoint To access Microsoft PowerPoint from your home computer, you will probably either use the Start menu to select the program or double-click on an icon on the Desktop. To open
Chapter 23: Drafting in Worksheet View
 Chapter 23: Drafting in Worksheet View Worksheet View is a powerful, 2D production drafting module. Here you can find all of the drawing and editing tools needed to create fast, accurate, detailed working
Getting Started with the NI LabVIEW Embedded Module for ARM Microcontrollers
 Getting Started with the NI LabVIEW Embedded Module Contents The LabVIEW Embedded Module is a comprehensive graphical development environment for embedded design. This module seamlessly integrates the
Data Tool Platform SQL Development Tools
 Data Tool Platform SQL Development Tools ekapner Contents Setting SQL Development Preferences...5 Execution Plan View Options Preferences...5 General Preferences...5 Label Decorations Preferences...6
Lecture 2 Mathcad Basics
 Operators Lecture 2 Mathcad Basics + Addition, - Subtraction, * Multiplication, / Division, ^ Power ( ) Specify evaluation order Order of Operations ( ) ^ highest level, first priority * / next priority
Plots, Curve-Fitting, and Data Modeling in Microsoft Excel
 Plots, Curve-Fitting, and Data Modeling in Microsoft Excel This handout offers some tips on making nice plots of data collected in your lab experiments, as well as instruction on how to use the built-in
Create a Poster Using Publisher
 Contents 1. Introduction 1. Starting Publisher 2. Create a Poster Template 5. Aligning your images and text 7. Apply a background 12. Add text to your poster 14. Add pictures to your poster 17. Add graphs
Chapter 14: Links. Types of Links. 1 Chapter 14: Links
 1 Unlike a word processor, the pages that you create for a website do not really have any order. You can create as many pages as you like, in any order that you like. The way your website is arranged and
Sharing Presentations, Documents, and Whiteboards
 Chapter 19 19 Sharing Presentations, Documents, and Whiteboards Your user role in an event determines your level of sharing. Whichever role you take, the following table describes the basic tasks associated
SA-9600 Surface Area Software Manual
 SA-9600 Surface Area Software Manual Version 4.0 Introduction The operation and data Presentation of the SA-9600 Surface Area analyzer is performed using a Microsoft Windows based software package. The
Getting Started with the LabVIEW Mobile Module
 Getting Started with the LabVIEW Mobile Module Contents The LabVIEW Mobile Module extends the LabVIEW graphical development environment to Mobile devices so you can create applications that run on Windows
Tips Tricks and Techniques for Efficient LabVIEW Development
 Tips Tricks and Techniques for Efficient LabVIEW Development Presented by Nick Golas Telephonics Corp. IEEE I&M Society LI Section & Long Island LabVIEW Users Group (LILUG) Thursday 12/06/2007 Use the
How to Edit Your Website
 How to Edit Your Website A guide to using your Content Management System Overview 2 Accessing the CMS 2 Choosing Your Language 2 Resetting Your Password 3 Sites 4 Favorites 4 Pages 5 Creating Pages 5 Managing