Notes on using capture-recapture techniques to assess the sensitivity of rapid case-finding methods
|
|
|
- Jemimah Malone
- 7 years ago
- Views:
Transcription
1 Notes on using capture-recapture techniques to assess the sensitivity of rapid case-finding methods VALID International Ltd. Version 0.71 July 2006

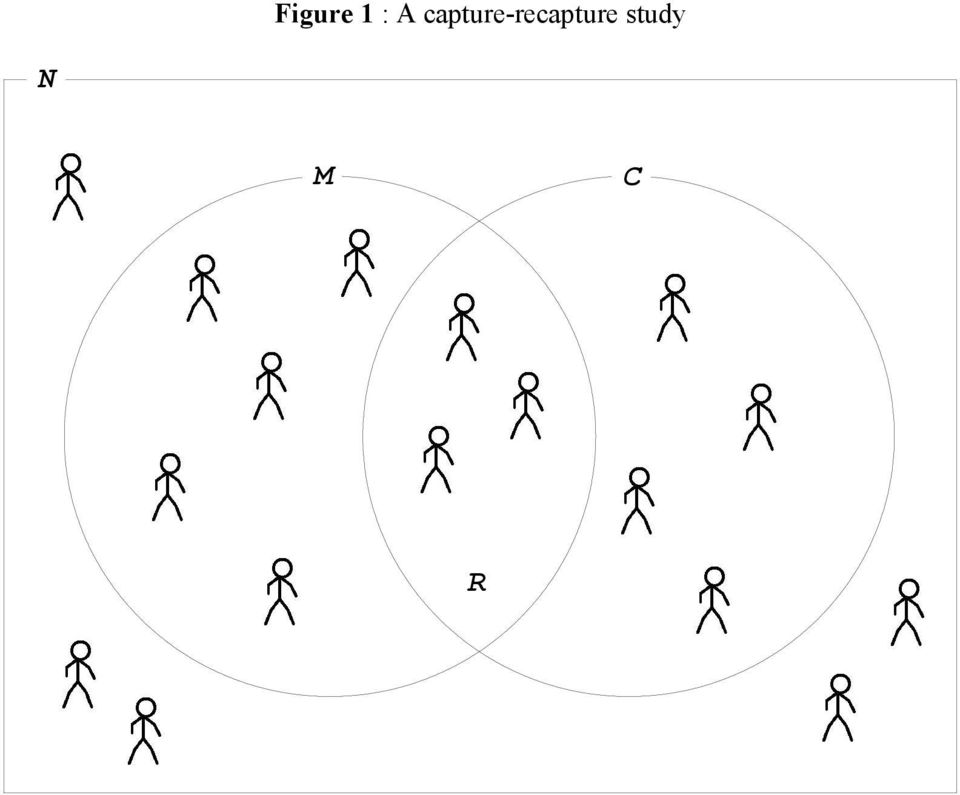
2 Capture-recapture studies Capture-recapture studies are used to estimate the size of a population when a census may be infeasible or impossible to conduct. The basic idea of capture-recapture studies is to sample and identify individuals, or cases, from a population and then resample the population to see what fraction of individuals, or cases, in the second sample were identified in the first sample (i.e. the fraction of individuals, or cases, that were found in both samples). In this document we will explore the use of capture-recapture techniques to estimate the sensitivity (also called exhaustivity) of two case-finding methods. The sensitivity of a case-finding method is a measure of how well the method performs at finding cases. This is useful for: 1. Selecting a rapid case-finding method for use by outreach workers. 2. Selecting a rapid case-finding method for use in coverage surveys using the centric systematic area sampling (CSAS) method or related methods. In both cases we would want a rapid case-finding method that finds all or nearly all cases (i.e. a rapid casefinding method with a high sensitivity). This document focuses on severe acute undernutrition but the methods outlined may be applied to moderate acute undernutrition and also to non-nutritional conditions. Figure 1 shows a capture-recapture study in diagram form. In this diagram: N = Total number of cases in the study population. M = Number of cases found in the first sample. C = Number of cases found in the second sample. R = Number of cases found in both samples. For this application, one sample will usually be collected using a census (or census-like) sampling method such as central-location screening or house-to-house screening and the other sample will be collected using a rapid case-finding method. Figure 2 presents a capture-recapture study with four sets of cases labelled a, b, c, and x. In this diagram: M =a b C=a c R=a N =a b c x Where x, the number of cases not found by either sample, is unknown. This information can be presented as a two-by-two table (Figure 3).
 of two case-finding methods.")
3 If we assume: 1. The population is closed (i.e. there is no change in the population during the investigation). 2. Cases sampled on both occasions can be identified and matched. 3. Each case has an equal chance of being included in each sample (equal catchability). 4. The presence of a case in the second sample is not influenced by the presence of the same case in the first sample (independence). then we can calculate a value for the unknown x cell in the table. Under these assumptions (and particularly the assumption of independence) the probability of a case being present in the second sample if it is present in the first sample: P in sample 2 in sample 1 = a a b and the probability of a case being present in the second sample if it is not present in the first sample: are the same: This formula can be re-arranged to find x: P in sample 2 in sample 1 = c c x a a b = c c x a a b = c c x c a b =a c x b c=a x x= b c a Knowing x allows us to estimate the total number of cases in the study population: This can be expressed more simply as: N =a b c x N =a b c b c a N = a b a c a N = M C R
 the probability of a case being present in the second sample if it is present in the first sample: P in sample 2 in sample 1")
4 This formula can overestimate the total number of cases in the study population when used with small sample sizes and the following formula: N = M 1 C 1 1 R 1 is preferred. This formula is commonly implemented in software that can work with data from capturerecapture studies (e.g. the EpiTable module in EpiInfo). This formula should always be used in preference to the simpler formula. Since it is impossible to have part of a case, the estimate of N should be rounded to the nearest whole number. If the fractional part is 0.5 then rounding up (e.g. from 19.5 to 20) is preferred for this application. Estimating case-finding sensitivity using capture-recapture study data Once we have an estimate of the total number of cases in the study population we can estimate the sensitivity of the case-finding methods used for each sample: Sensitivity of method one % = a b N 100= M N 100 Sensitivity of method two % = a c N 100= C N 100 Confidence intervals can be calculated for these estimates. The details of the calculations required are beyond the scope of this document. The required calculations can be performed using the EpiTable module in EpiInfo. We are usually only interested in the sensitivity of the rapid case-finding method. More specifically, we are interested in confirming that the sensitivity of the rapid case-finding method is 100% (i.e. all cases found) or nearly 100% (i.e. nearly all cases found). See the sections Estimating case-finding sensitivity and Case-finding sensitivity and coverage estimates (below) for guidance on interpreting sensitivity estimates from capture-recapture study data and acceptable levels of case-finding sensitivity for use in coverage surveys using the centric systematic area sampling (CSAS) method or related methods.
 is preferred for this application.")
5 Underlying assumptions It is important that the assumptions behind the estimate of the total number of cases in the study population are not violated. If the closed population assumption is violated then cases found in one sample cannot be found in the other sample. This reduces the probability of recapture and will lead to an overestimation of N and an underestimation of sensitivity. Our experience using capture-recapture techniques in CSAS coverage surveys suggests that this assumption can be met provided that only a short time is allowed between the collection of the two samples so that cases are not lost from the study population due to mortality, recovery, or displacement and cases do not enter the study population either as new cases or as existing cases arriving from outside of the study area. It is also important to ensure that neither sample is taken on market days, feast days, holidays, distribution days, or days / times when many people may be absent from their home community. In one study we found that people from neighbouring villages were attracted by central-location screening activities. This meant that the population for central-location screening was larger than the population for rapid case-finding. This was likely to lead to an overestimation of N and an underestimation of the sensitivity of the rapid case-finding method. In the same study, a study village was located close to a major road and passers-by attempted to join the central-location screening. Again, this meant that the population for central-location screening was larger than the population for rapid case-finding. This was likely to lead to an overestimation of N and an underestimation of the sensitivity of the rapid case-finding method. In such situations it is important to identify and censor excess members of the study population by asking the carers of children where they live and confirming this with a key informant or local guide such as a village health worker, traditional birth attendant, or traditional healer. In one study, community leaders recognised such outsiders and, after explaining the purpose of the screening exercise, asked them to leave. Such problems may also be avoided by careful selection of study sites. In both cases central-location screening acted as an attractor and the use of alternative methods such as house-to-house screening should be contemplated. Ensuring a closed population can be very difficult in refugee camps during the early stages of on an emergency. This is because the camp population may change on a daily basis as refugees arrive or are dispersed to other camps or to live within the host-population. The problem still exists once a camp population has stabilised as the population that can be feasibly sampled may change from day-to-day as carers attend activities such as education / health-promotion / vaccination programs and food or clothing distributions. In these situations it is important to work closely with camp authorities to identify if a violation of the closed population assumption is likely, and to become familiar with activity timetables to ensure that you take both samples when carers are likely to be at home with their children. Camps for internally displaced persons (IDPs) are even more challenging than refugee camps since IDP camps tend to be less organised than refugee camps and it can be very difficult to track population changes and IDPs may leave the camp for work or foraging activities on an irregular basis. In such situations you will probably be restricted to identifying whether or not a violation is likely to have occurred and use this information when interpreting sensitivity estimates. Care should be taken when sampling to ensure that the physical boundaries of areas to be sampled are well defined. Failure to do so is likely to results in different areas being used for the two samples. Since mistakes will be made at the boundaries of sampling areas this can have a large effect on the size of the population sampled on each occasion. This may be a particular problem in urban areas. In such situations it is a good idea to use existing boundaries such as roads and have the study team to produce a rough map of the area used for the first sample which can be used when collecting the second sample. In some situations you may find direct evidence of a violation of the closed population assumption and be able to correct for this during data-collection. In one study we were, during the recapture phase, directed to a household and were informed by the grandmother that the mother had taken the child to another village. The grandmother was able to provide matching information and the child could be matched with a case found in the capture phase of the study. In this case the child was treated as a recaptured case. In another study we were directed to a household in which the identified child had died between the capture and recapture phases of the study. In this case, the child was matched and treated as a recaptured case. Cases found in both samples must be reliably identified and matched. If true matches are missed then the number of recaptured cases is falsely reduced leading to an overestimation of N and an underestimation of sensitivity. If false matches are created then the number of recaptured cases is falsely increased leading to an underestimation of N and an overestimation of sensitivity. In our experience, matching has not proved to be a problem provided sufficient identifying information is collected. The minimum identifying information required is full name (i.e. first, middle, and last names), sex, and age.

6 The equal catchability assumption does not require that the probability of being found is the same for both methods. It requires that all cases have an equal chance of being found for each method. If some cases have a low probability of being found by either method then N will be underestimated and sensitivity overestimated. In our experience, carers of very sick children (i.e. children likely to be cases) tend to be reluctant to attend central-location screening particularly if simultaneous screening of several communities at a central point (leading to children being screened outside of their home community) is used. This is unlikely to be a major problem since such children tend to be found by a reasonably sensitive active casefinding method. The use of alternatives to central-location screening such as house-to-house screening should be contemplated should you have any doubts about the ability of the rapid case-finding method to find very sick children. You should be aware, however, that sick children may also be hidden in house-tohouse screening. It is vital to have a good understanding of how the local population defines sickness and malnutrition in order to develop a sensitive rapid case-finding method. In one study we found a marked reluctance in the population to attend for central-location screening and to co-operate with screening activities using a rapid case-finding method. This was found to be due to screening fatigue caused by the villages being repeatedly screened without any obvious and direct advantage to the community or to the screened individuals. This is likely to be a problem when villages are selected because of their proximity to feeding centres and main roads. Such problems may be avoided by careful selection of study sites. Screening fatigue may also be introduced by the capture-recapture study itself and this may negatively effect casefinding sensitivity during a subsequent coverage survey. For this reason it is recommended that villages close to but outside of the area of any planned coverage survey be used for the capture-recapture study. The assumption of independence (i.e. that the presence of a case in the second sample is not influenced by the presence of the same case in the first sample) underlies the derivation of the estimator for N. If there is positive dependence (i.e. if cases found in the first sample are more likely than cases not found in the first sample to be found in the second sample) then N will be underestimated and sensitivity overestimated. If there is negative dependence (i.e. if cases found in the first sample are less likely than cases not found in the first sample to be found in the second sample) then N will be overestimated and sensitivity underestimated. The assumption of independence is violated in almost all capture-recapture studies but efforts should be made to minimise the bias that this may introduce. For testing case-finding procedures for use in CSAS coverage surveys we have used separate teams assisted by different key informants to take the two samples (i.e. the same team never took both samples from a particular village) so as to avoid introducing positive dependence and issued referral slips only after the second sample has been taken so as to avoid introducing negative dependence. From the foregoing it should be clear that capture-recapture studies should be undertaken with considerable care so as to avoid gross violations of the assumptions behind the method. Most capture-recapture studies will violate the underlying assumptions to some degree but can still provide useful results because we can usually identify the violation and predict its likely effect on the estimate of case-finding sensitivity (Table 1). The assumptions behind the capture-recapture method and measures to avoid their gross violations should inform the planning and execution of capture-recapture studies (Table 1).
 tend to be reluctant to attend central-location screening particularly if simultaneous screening of several communities at a central point (leading to children being screened outside of their")
7 Sample sizes for capture-recapture studies Sample size calculation is more complicated for capture-recapture studies than it is for (e.g.) cross-sectional prevalence studies since there are three sample sizes (i.e. M, C, and R) to consider. Sample size calculations are informed by the fact that the formula: is an unbiased estimator provided: and: N = M 1 C 1 1 R 1 M C N R 7 The estimate of the total number of cases in the study population is unbiased if these constraints are met. Working with these constraints requires estimates of the case-finding sensitivity of both methods and an estimate of the total number of cases in a population. These estimates need only be rough guesses. Suitable guesses for case-finding sensitivity are: Central location screening : 50% 60% House-to-house screening : 90% 100% Active case-finding : 75% 85% It is best to use a high guess for the total number of cases in a population. This should be informed by the prevalence of the condition (e.g. from a recent nutritional anthropometry survey) and the size of the study population adjusted to take into account program eligibility criteria: N =Population Proportion of Population Elligible for Intervention Prevalence Census data should be used when available but it is usually safe to assume that 20% of the total population is aged between 6 and 59 months. Example 1 shows how to apply the sample size constraints when planning a capture-recapture study. It is also possible to apply sample size constraints retrospectively to check whether they were met (Example 2). If the sample size constraints are not met then the size of the study population should be increased. In some situations this may not be possible (e.g. due to cost or time constraints in very low prevalence situations). Just as with the assumptions underlying the the capture-recapture method, results from studies that do not meet the sample size constraints can still be useful. Failure to meet the sample size constraints will lead to an overestimation of N and an underestimation of sensitivity although the effect is likely to be small in low prevalence situations.

8 Estimating case-finding sensitivity Case-finding sensitivity is estimated by dividing the number of cases found using the case-finding procedure under test by the estimate the total number of cases in the study population found by the capture-recapture method. If the case-finding procedure being tested was used for the first sample then: Sensitivity % = M N 100 If the case-finding procedure being tested was used for the second sample then: Sensitivity % = C N 100 This procedure is illustrated in Example 3. The conduct of the capture-recapture study should always be evaluated to check if any of the assumptions underlying the capture-recapture method have been violated. Most capture-recapture studies will violate the underlying assumptions to some degree but can still provide useful results because we can usually identify the violation and predict its likely effect on the estimate of case-finding sensitivity (Table 1). It is usually possible to identify the direction but not the magnitude of any bias that may have been introduced by violations of the underlying assumptions. Any violations and their likely effect on the estimate of casefinding sensitivity should be documented in study or coverage survey reports and the estimate of casefinding sensitivity qualified by phrases such as at most x% or at least x% (see Example 3).

9 Case-finding sensitivity and coverage estimates The CSAS coverage survey method (and similar methods) relies on using a case-finding method with high sensitivity. Ideally this should be 100%. With careful design and testing it is often possible to achieve a case-finding sensitivity of 100% particularly for severe acute undernutrition. A case-finding sensitivity of below 100% found by a capture-recapture study could be due to violations of the assumptions behind the capture-recapture method or to failure to meet the sample size constraints. It may also be due to a poorly designed or applied case-finding procedure or to the fact that you are working with a difficult population (an example of a difficult population is one in which people do not know their neighbours such as the population of a recently established IDP camp). In such situations you should evaluate whether the capturerecapture assumptions were violated and whether the sample size constraints were met and take this into account when assessing case-finding sensitivity (see Table 1). You should also seriously consider whether the case-finding procedure is well designed and was properly applied during the capture-recapture study. If you have any doubts regarding the case-finding procedure then you should either redesign the procedure and test it again using a new capture-recapture study or consider whether to adopt a house-to-house census sampling approach which will usually have close to 100% sensitivity. You should certainly consider doing this if the case-finding sensitivity is below about 75% after taking into account the likely effects of violations of the capture-recapture assumptions or failures to meet the sample size constraints. It is possible, but not recommended, to proceed with a coverage survey using a low sensitivity case-finding method. Doing so will produce a biased survey result. The nature of the bias will depend upon the nature of the underlying faults in the case-finding procedure but the most likely effect will be to exclude cases that are difficult to find. Surveys using a low sensitivity case-finding procedure will be restricted to assessing coverage in easy to find cases. Since such cases are likely to have been found and recruited by the program this may cause the survey to overestimate program coverage. This likely bias should be noted in survey reports. Using a case-finding procedure with a sensitivity of between 75% and 100% is reasonable because such a method is likely to exclude only the most difficult to find and recruit cases which are unlikely to be covered by any program.

10 Case-finding sensitivity and coverage estimates for two or more programs It is important to avoid confusion regarding case-definitions when developing case-finding procedures and estimating their sensitivities for use in coverage surveys that estimate the coverage of two or more related programs with differing case-definitions. For example, a coverage survey may need to estimate the coverage of an outpatient therapeutic care program (OTP) and an associated supplementary feeding program (SFP). These programs will have different program entry-criteria (case-definitions). For example: Example entry-criteria for OTP and SFP programs Program OTP SFP Case-definition / program entry-criteria MUAC < 110 mm or bilateral pitting oedema MUAC between 110 mm and 124 mm (inclusive) or recent discharge from OTP In these situation you should estimate sensitivity separately for each case-definition using a capturerecapture study with a sample size calculated for the less common (more severe) condition. When you do this you will probably find that the case-finding method is 100% sensitive for the more severe condition but is considerably less than 100% sensitive for the less severe condition (typically, it will be between 60% and 80%). It is usually OK to proceed with a case-finding sensitivity of between 60% and 80% for the less severe condition because case-finding sensitivity is likely to be satisfactory for the more severe cases. For example: Example case-finding sensitivities and severity of wasting Program MUAC Sensitivity OTP < 110 mm 100% Between 110 mm and 115 mm (inclusive) 100% SFP Between 116 mm and 120 mm (inclusive) 80% Between 121 mm and 124 mm (inclusive) 65%
.")
11 Estimating prevalence from a CSAS coverage survey Prevalence can be estimated indirectly from coverage survey data using the formula: where: p = Prevalence estimate p= n POP 1 S 100 n = Number of cases found in the coverage survey POP = Population of communities sampled in the coverage survey S = Estimate of case-finding sensitivity The population of communities sampled in the coverage survey should be adjusted to take into account program eligibility criteria: POP=Population Proportion of Population Elligible for Intervention Census data should be used when available but it is usually safe to assume that 20% of the total population is aged between 6 and 59 months. If you have a confidence interval for the sensitivity of the case-finding method you can also calculate a confidence interval on the prevalence estimate using the following formulae: where: p LCL = n POP p S UCL = n UCL POP S LCL p LCL = Lower confidence limit for prevalence estimate p UCL = Upper confidence limit for prevalence estimate n = Number of cases found in the coverage survey POP = Population of communities sampled in the coverage survey S LCL = Lower confidence limit for the estimate of case-finding sensitivity S LCL = Upper confidence limit for the estimate of case-finding sensitivity Example 4 illustrates how to apply these formulae to coverage survey data. This method of estimating prevalence is sensitive to errors in the denominator (N). Where possible, census data should be used and corrected for population growth (and other population changes such as mortality, migration, and displacement). If census data is not available then roof counts can be used. This will require a small survey to estimate mean household size. Community populations can then be estimated as the number of roofs in the sampled community multiplied by mean household size. Local leaders may be able to provide accurate population figures in some situations.

12 Figure 1 : A capture-recapture study N M C R
13 Figure 2 : The four sets of cases in a capture-recapture study N M C b a c R x

14 Figure 3 : The four sets of cases in a capture-recapture study presented as a two-by-two table Case found in sample 2? Yes No Case found in sample 1? Yes No a c b x From Figure 2: M = a + b C = a + c R = a N = a + b + c + x

15 Table 1 : Assumptions, violations, effects, and preventatives Effect on... Violated assumption N Sensitivity Closed population Preventive measures Short time between samples. Avoid sampling on certain (e.g. market) days. Careful selection of study sites. Appropriate use of central-location screening. Testing for residency. Clearly define the physical boundary of each study site: Existing boundaries. Map study area for first sample. Ensure that local guides understand the scope of the study population and do not introduce bias by systematic exclusion of some individuals. Use community leaders and key informants to identify and exclude outsiders from inclusion in the study. True matched missed Reliable matching Collect sufficient identifying data. False matches created Equal catchability Use a method sensitive to very sick children. This may require qualitative work to understand how the local population defines sickness and malnutrition. Use house-to-house screening for one sample. Careful selection of study sites. Independence Positive dependence Use separate teams to collect each sample. Use different informants / local guides for each sample. Negative dependence Refer cases to service after second sample. Inadequate sample size Increase size of study population (if possible).

16 Example 1 : Applying sample size constraints during study planning A capture-recapture study is planned to take place in eight communities with an estimated total population of The prevalence of severe acute undernutrition is estimated to be around 2%. Census data indicates that 19% of the population are aged between 6 and 59 months. The total number of cases in the study population will be approximately: N = =18 Since it is impossible to have part of a case, the estimate of N has been rounded to the nearest whole number. If we estimate that the sensitivity of the first case finding method (central-location screening) will be 55% then the number of cases found by that method (M) will be: M = =10 Since it is impossible to have part of a case, the estimate of M has been rounded to the nearest whole number. If we estimate that the sensitivity of the active case-finding method will be 80% then the number of cases found by that method (C) will be: C= =14 Since it is impossible to have part of a case, the estimate of C has been rounded to the nearest whole number. In this example M + C would be: R would be: R= M C=10 14=24 M C N = =8 18 Since it is impossible to have part of a case, the estimate of R has been rounded to the nearest whole number. The sample size constraints: and: are likely to be met in the planned study. M C N R 7

17 Example 2 : Applying sample size constraints retrospectively A capture-recapture study found: Cases found by central-location screening (M) : 6 Cases found by active case-finding (C) : 8 Cases found in both methods (R) : 5 The total number of cases in the study population is estimated to be: N = M 1 C 1 1 R 1 N = =10 Since it is impossible to have part of a case and the fractional part of the calculated value for N is 0.5, the estimate of N has been rounded up to the nearest whole number. This study did meet the rule-of-thumb: since: which is larger than the estimate for N (10). The study failed to meet the constraint: since: M C N 6 8=14 R 7 R=5
.")
18 Example 3 : Assessing case-finding sensitivity A capture-recapture study found: Cases found by central screening (M) : 30 Cases found by active case-finding (C) : 43 Cases found in both methods (R) : 22 The total number of cases in the study population is estimated to be: N = M 1 C 1 1 R 1 N = =58 23 Since it is impossible to have part of a case, the estimate of N has been rounded to the nearest whole number. The sensitivity of the active case-finding method is: Sensitivity % = C N 100 Sensitivity % = =74 % During the survey there was some concern that the closed population assumption had been violated due to people from neighbouring villages being attracted by central-location screening activities. This is likely to have led to to an overestimation of N and an underestimation of sensitivity. The case-finding sensitivity is, therefore likely to be somewhat higher than the calculated estimate. This could be documented in the study report as at least 74%. The sensitivity of the tested case-finding method is, therefore, likely to be above about 75% and the tested case-finding method may be used in a coverage survey.

19 Example 4 : Estimating prevalence from a CSAS coverage survey A CSAS coverage survey found 195 cases of severe acute undernutrition. A capture-recapture study undertaken immediately prior to the coverage survey estimated the sensitivity of the active case-finding method used to be 74%. The 95% confidence interval for the case-finding sensitivity was 65% 87%. The total populations of the communities sampled in the coverage survey was 461,278. Census data indicated that 21.7% of the total population were aged between 6 and 59 months. The eligible populations was: POP=Population Proportion of Population Elligible for Intervention POP= = The prevalence of severe acute undernutrition was estimated as: p= n POP = S / =0.26% The lower 95% confidence limit on the prevalence estimate was: p LCL = n POP 1 100= 195 S UCL / =0.22 % The lower 95% confidence limit on the prevalence estimate was: p UCL = n POP 1 100= 195 S LCL / =0.30 %

Module 7 Expanded Programme of Immunization (EPI)
") Module 7 Expanded Programme of Immunization (EPI) (including Vitamin A, Tetanus Toxoid and Growth Monitoring) CONTENTS 7.1 What are the tools used for data collection?....................................2
Module 7 Expanded Programme of Immunization (EPI) (including Vitamin A, Tetanus Toxoid and Growth Monitoring) CONTENTS 7.1 What are the tools used for data collection?....................................2
Chapter 3. Sampling. Sampling Methods
 Oxford University Press Chapter 3 40 Sampling Resources are always limited. It is usually not possible nor necessary for the researcher to study an entire target population of subjects. Most medical research
Supporting choice and control
 www.in-control.org.uk Supporting choice and control A template policy framework for delivering person-centred outcomes by a positive approach to risk www.in-control.org.uk Supporting Choice and Control
The End Point: Example of a Good Survey Report
 CHAPTER The End Point: Example of a Good Survey Report This chapter serves to conclude with how important and crucial is to undertake an accurate assessment and present the findings in a comprehensive
Monitoring & Evaluation for Results. Reconstructing Baseline Data for Monitoring & Evaluation -Data Collection Methods-
 Monitoring & Evaluation for Results Reconstructing Baseline Data for Monitoring & Evaluation -Data Collection Methods- 2007. The World Bank Group. All rights reserved. Baseline Data Baseline data are initial
Tasmanian Adult Literacy Action Plan
 Tasmanian Adult Literacy Action Plan Department of Education 1. Message from the David Bartlett MP Premier and Minister for Education and Skills All Tasmanians deserve an equal chance at making a good
A Method of Population Estimation: Mark & Recapture
 Biology 103 A Method of Population Estimation: Mark & Recapture Objectives: 1. Learn one method used by wildlife biologists to estimate population size of wild animals. 2. Learn how sampling size effects
68 3,676,893 86.7 -49-2.9 -3.2 -2.5. making progress
 Per 1 LB African Region Maternal and Perinatal Health Profile Department of Maternal, Newborn, Child and Adolescent Health (MCA/WHO) Demographics and Information System Health status indicators Maternal
TOOL D14 Monitoring and evaluation: a framework
 TOOL D14 Monitoring and evaluation: a framework 159 TOOL D14 Monitoring and evaluation: a framework TOOL D14 For: About: Purpose: Use: Resource: Commissioners in primary care trusts (PCTs) and local authorities
Cabinet Member for Adult Social Care and Health ASCH04 (14/15)
") Cabinet Member for Adult Social Care and Health ASCH04 (14/15) Commissioning of Telecare as part of wider Assistive Technology Services for West Sussex July 2014 Report by Director of Public Health and
Cabinet Member for Adult Social Care and Health ASCH04 (14/15) Commissioning of Telecare as part of wider Assistive Technology Services for West Sussex July 2014 Report by Director of Public Health and
Digital Inclusion Programme Started. BL2a
 PROJECT BRIEF Project Name Digital Inclusion Programme Status: Started Release 18.05.2011 Reference Number: BL2a Purpose This document provides a firm foundation for a project and defines all major aspects
Methodology Understanding the HIV estimates
 UNAIDS July 2014 Methodology Understanding the HIV estimates Produced by the Strategic Information and Monitoring Division Notes on UNAIDS methodology Unless otherwise stated, findings in this report are
How Your Budget is Decided. V7 (Spring 2015)
") How Your Budget is Decided V7 (Spring 2015) CONTENTS YOUR PERSONAL BUDGET... 1 HOW WAS MY BUDGET ESTIMATED?... 1 HOW DOES THE FORMULA WORK?... 2 WHAT IF I THINK THE BUDGET IS TOO LITTLE OR TOO MUCH?...
How Your Budget is Decided V7 (Spring 2015) CONTENTS YOUR PERSONAL BUDGET... 1 HOW WAS MY BUDGET ESTIMATED?... 1 HOW DOES THE FORMULA WORK?... 2 WHAT IF I THINK THE BUDGET IS TOO LITTLE OR TOO MUCH?...
2. Incidence, prevalence and duration of breastfeeding
 2. Incidence, prevalence and duration of breastfeeding Key Findings Mothers in the UK are breastfeeding their babies for longer with one in three mothers still breastfeeding at six months in 2010 compared
150 7,114,974 75.8 -53-3.2 -3.6 -2.9. making progress
 Per 1 LB African Region Maternal and Perinatal Health Profile Department of Maternal, Newborn, Child and Adolescent Health (MCA/WHO) Demographics and Information System Health status indicators - Maternal
MANAGING THE RISKS OF CHANGE
 MANAGING THE RISKS OF CHANGE Dr Andrew Brazier, Consultant www.andybrazier.co.uk andy.brazier@gmail.com þ 44 7984 284642 The process industry has always had to deal with changes to plant and equipment,
Farm Business Survey - Statistical information
 Farm Business Survey - Statistical information Sample representation and design The sample structure of the FBS was re-designed starting from the 2010/11 accounting year. The coverage of the survey is
Snap shot. Cross-sectional surveys. FETP India
 Snap shot Cross-sectional surveys FETP India Competency to be gained from this lecture Design the concept of a cross-sectional survey Key areas The concept of a survey Planning a survey Analytical cross-sectional
Community-Based Management of Acute Malnutrition. Inpatient Care for the Management of SAM with Medical Complications in the Context of CMAM
 TRAINER S GUIDE Community-Based Management of Acute Malnutrition MODULE FIVE Inpatient Care for the Management of SAM with Medical Complications in the Context of CMAM MODULE OVERVIEW This module provides
Understanding sport and physical activity as a therapy choice for young disabled people. Views and opinions of paediatric physiotherapists
 Understanding sport and physical activity as a therapy choice for young disabled people Views and opinions of paediatric physiotherapists 2 Contents Acknowledgements... 4 Executive Summary... 6 Section
Objectives. What is undernutrition? What is undernutrition? What does undernutrition look like?
 Objectives Basics Jean-Pierre Habicht, MD, PhD Professor Division of Nutritional Sciences Cornell University Types and causes Determinants Consequences Global occurrence and progress Way forward What is
Fostering data in England
 Fostering data in England Methodology and Quality Report Last updated: 17 December 2015 Introduction This paper contains methodology and quality information relevant to the Office for Standards in Education,
Article Four Different Types of Evidence / Literature Reviews
 Article Four Different Types of Evidence / Literature Reviews The rapid growth in the number of reviews undertaken can partly be explained by the current emphasis on evidence-based practice. Healthcare
CALL FOR PROPOSALS. Provision of Health Service Delivery Activities in Kismayo, Somalia. Migration Health Division (MHD)
") CALL FOR PROPOSALS Provision of Health Service Delivery Activities in Kismayo, Somalia Migration Health Division (MHD) Date: 26 th August 2015 Closing Date: 6 th September 2015 Eligible Parties: Eligible
CALL FOR PROPOSALS Provision of Health Service Delivery Activities in Kismayo, Somalia Migration Health Division (MHD) Date: 26 th August 2015 Closing Date: 6 th September 2015 Eligible Parties: Eligible
Estimation and Confidence Intervals
 Estimation and Confidence Intervals Fall 2001 Professor Paul Glasserman B6014: Managerial Statistics 403 Uris Hall Properties of Point Estimates 1 We have already encountered two point estimators: th e
117 4,904,773 -67-4.7 -5.5 -3.9. making progress
 Per 1 LB Eastern Mediterranean Region Maternal and Perinatal Health Profile Department of Maternal, Newborn, Child and Adolescent Health (MCA/WHO) Demographics and Information System Health status indicators
[03.03] Guidelines for the User Cost Method to calculate rents for owner occupied housing. International Comparison Program
![[03.03] Guidelines for the User Cost Method to calculate rents for owner occupied housing. International Comparison Program](/thumbs/40/21493679.jpg "[03.03] Guidelines for the User Cost Method to calculate rents for owner occupied housing. International Comparison Program") International Comparison Program [03.03] Guidelines for the User Cost Method to calculate rents for owner occupied housing Global Office 3 rd Technical Advisory Group Meeting June 10-11, 2010 Paris, France
International Comparison Program [03.03] Guidelines for the User Cost Method to calculate rents for owner occupied housing Global Office 3 rd Technical Advisory Group Meeting June 10-11, 2010 Paris, France
Means, standard deviations and. and standard errors
 CHAPTER 4 Means, standard deviations and standard errors 4.1 Introduction Change of units 4.2 Mean, median and mode Coefficient of variation 4.3 Measures of variation 4.4 Calculating the mean and standard
Management Accounting 303 Segmental Profitability Analysis and Evaluation
 Management Accounting 303 Segmental Profitability Analysis and Evaluation Unless a business is a not-for-profit business, all businesses have as a primary goal the earning of profit. In the long run, sustained
Action Against Hunger s Tool to Determine Where and When Nutritional Interventions are Needed in Times of Crises
 ACF Canada. Action Against Hunger s Tool to Determine Where and When Nutritional Interventions are Needed in Times of Crises Tracy McDonough, M.Sc. Human Nutrition & Nadia Browne, M.Sc. Human Nutrition
SERVICE SPECIFICATION
 SERVICE SPECIFICATION Provision of a Service for Young Carers Wokingham Borough Council OFFICIAL - SENSITIVE Page 1 1. Introduction This is the service specification for the provision of a Young Carers
SELF ASSESSMENT GUIDE FOR PLACEMENT SERVICE PROVIDERS 2009/2010
 SELF ASSESSMENT GUIDE FOR PLACEMENT SERVICE PROVIDERS 2009/2010 Electronic copies of this document are available by contacting the Manager Standards Monitoring Unit on 9222 2598 CONTENTS OVERVIEW...3 PURPOSE
Reflections on Probability vs Nonprobability Sampling
 Official Statistics in Honour of Daniel Thorburn, pp. 29 35 Reflections on Probability vs Nonprobability Sampling Jan Wretman 1 A few fundamental things are briefly discussed. First: What is called probability
2003 Annual Survey of Government Employment Methodology
 2003 Annual Survey of Government Employment Methodology The U.S. Census Bureau sponsors and conducts this annual survey of state and local governments as authorized by Title 13, United States Code, Section
DETERMINATION. Case reference: ADA002326, 002336, 002337, 002338, 002339, 002340, 002341, 002353, 002368
 DETERMINATION Case reference: ADA002326, 002336, 002337, 002338, 002339, 002340, 002341, 002353, 002368 Objectors: Admission Authority: A number of parents Wokingham Borough Council Date of decision: 28
V1.0 - Eurojuris ISO 9001:2008 Certified
 Risk Management Manual V1.0 - Eurojuris ISO 9001:2008 Certified Section Page No 1 An Introduction to Risk Management 1-2 2 The Framework of Risk Management 3-6 3 Identification of Risks 7-8 4 Evaluation
THE JOINT HARMONISED EU PROGRAMME OF BUSINESS AND CONSUMER SURVEYS
 THE JOINT HARMONISED EU PROGRAMME OF BUSINESS AND CONSUMER SURVEYS List of best practice for the conduct of business and consumer surveys 21 March 2014 Economic and Financial Affairs This document is written
Social Return on Investment
 Social Return on Investment Valuing what you do Guidance on understanding and completing the Social Return on Investment toolkit for your organisation 60838 SROI v2.indd 1 07/03/2013 16:50 60838 SROI v2.indd
18.6.1 Terms concerned with internal quality control procedures
 18.6.1 Terms concerned with internal quality control procedures Quality assurance in analytical laboratories Quality assurance is the essential organisational infrastructure that underlies all reliable
Biostatistics: DESCRIPTIVE STATISTICS: 2, VARIABILITY
 Biostatistics: DESCRIPTIVE STATISTICS: 2, VARIABILITY 1. Introduction Besides arriving at an appropriate expression of an average or consensus value for observations of a population, it is important to
SAMPLE DESIGN RESEARCH FOR THE NATIONAL NURSING HOME SURVEY
 SAMPLE DESIGN RESEARCH FOR THE NATIONAL NURSING HOME SURVEY Karen E. Davis National Center for Health Statistics, 6525 Belcrest Road, Room 915, Hyattsville, MD 20782 KEY WORDS: Sample survey, cost model
Beyond 2011: Administrative Data Sources Report: The English School Census and the Welsh School Census
 Beyond 2011 Beyond 2011: Administrative Data Sources Report: The English School Census and the Welsh School Census February 2013 Background The Office for National Statistics is currently taking a fresh
abc Mark Scheme Statistics 6380 General Certificate of Education 2006 examination - January series SS02 Statistics 2
 Version 1.0: 0106 General Certificate of Education abc Statistics 6380 SS0 Statistics Mark Scheme 006 examination - January series Mark schemes are prepared by the Principal Examiner and considered, together
What Is Patient Safety?
 Patient Safety Research Introductory Course Session 1 What Is Patient Safety? David W. Bates, MD, MSc External Program Lead for Research, WHO Professor of Medicine, Harvard Medical School Professor of
DETERMINATION. Date of decision: 6 August 2013. Determination
 DETERMINATION Case reference: Objector: Admission Authority: ADA/002492 Parent Trafford Council Date of decision: 6 August 2013 Determination In accordance with section 88H(4) of the School Standards and
NHS Business Services Authority HR Policies Annual Leave
 1. POLICY STATEMENT 1.1 The aim of the Policy is to ensure a uniform and equitable approach to the calculation of annual leave and general entitlements which take into account the arrangements as defined
Statistics 2014 Scoring Guidelines
 AP Statistics 2014 Scoring Guidelines College Board, Advanced Placement Program, AP, AP Central, and the acorn logo are registered trademarks of the College Board. AP Central is the official online home
Sure Start children s centres statutory guidance. For local authorities, commissioners of local health services and Jobcentre Plus
 Sure Start children s centres statutory guidance For local authorities, commissioners of local health services and Jobcentre Plus April 2013 Contents Summary 3 Sure Start children s centres statutory guidance
STATEMENT ON ESTIMATING THE MORTALITY BURDEN OF PARTICULATE AIR POLLUTION AT THE LOCAL LEVEL
 COMMITTEE ON THE MEDICAL EFFECTS OF AIR POLLUTANTS STATEMENT ON ESTIMATING THE MORTALITY BURDEN OF PARTICULATE AIR POLLUTION AT THE LOCAL LEVEL SUMMARY 1. COMEAP's report 1 on the effects of long-term
SUMMARY- REPORT on CAUSES of DEATH: 2001-03 in INDIA
 SUMMARY- REPORT on CAUSES of DEATH: 2001-03 in INDIA Background: Long-term mortality measurement by cause, gender and geographic area has been the requirement of every country. With this in view, Medical
p ˆ (sample mean and sample
 Chapter 6: Confidence Intervals and Hypothesis Testing When analyzing data, we can t just accept the sample mean or sample proportion as the official mean or proportion. When we estimate the statistics
Non-response bias in a lifestyle survey
 Journal of Public Health Medicine Vol. 19, No. 2, pp. 203-207 Printed in Great Britain Non-response bias in a lifestyle survey Anthony Hill, Julian Roberts, Paul Ewings and David Gunnell Summary Background
IPDET Module 6: Descriptive, Normative, and Impact Evaluation Designs
 IPDET Module 6: Descriptive, Normative, and Impact Evaluation Designs Intervention or Policy Evaluation Questions Design Questions Elements Types Key Points Introduction What Is Evaluation Design? Connecting
Chapter 8: Quantitative Sampling
 Chapter 8: Quantitative Sampling I. Introduction to Sampling a. The primary goal of sampling is to get a representative sample, or a small collection of units or cases from a much larger collection or
How do we know what we know?
 Research Methods Family in the News Can you identify some main debates (controversies) for your topic? Do you think the authors positions in these debates (i.e., their values) affect their presentation
Workplace Pension Reform: Multiple Jobholders
 Workplace Pension Reform: Multiple Jobholders July 2013 1 Introduction The analysis presented in this paper is intended to support the passage of the 2013-14 Pensions Bill through Parliament. It provides
CRIDE report on 2012 survey on educational provision for deaf children in England
 INTRODUCTION CRIDE report on 2012 survey on educational provision for deaf children in England In 2012, the Consortium for Research into Deaf Education (CRIDE) carried out its second annual survey on educational
NON-PROBABILITY SAMPLING TECHNIQUES
 NON-PROBABILITY SAMPLING TECHNIQUES PRESENTED BY Name: WINNIE MUGERA Reg No: L50/62004/2013 RESEARCH METHODS LDP 603 UNIVERSITY OF NAIROBI Date: APRIL 2013 SAMPLING Sampling is the use of a subset of the
Integrated Performance Report
 Integrated Performance Report Southwark Social Services and Southwark Primary Care Trust 2003/04 Provisional Indicators Integrated Performance Report: 2003/04 Provisional Indicators 1. Recommendation 1.1
Module Three. Risk Assessment
 Module Three Risk Assessment 136 Module Three Introduction to Risk Assessment Time Allotted: 90 Minutes Objectives: Upon completion of this module, the learner will be able to # Define and understand the
CRITICAL PATH ANALYSIS AND GANTT CHARTS
 CRITICAL PATH ANALYSIS AND GANTT CHARTS 1. An engineering project is modelled by the activity network shown in the figure above. The activities are represented by the arcs. The number in brackets on each
Children s centre self-evaluation form guidance
 Children s centre self-evaluation form guidance Age group: 0 5 Published: March 2010 Reference no: 100008 The Office for Standards in Education, Children's Services and Skills (Ofsted) regulates and inspects
Attendance management Policy
 Attendance management Policy Policy summary West Yorkshire Police supports police officers and police staff, absent from work due to sickness and will treat them with compassion and respect. This policy
Simple Regression Theory II 2010 Samuel L. Baker
 SIMPLE REGRESSION THEORY II 1 Simple Regression Theory II 2010 Samuel L. Baker Assessing how good the regression equation is likely to be Assignment 1A gets into drawing inferences about how close the
Learning Disabilities
 Learning Disabilities Positive Practice Guide January 2009 Relieving distress, transforming lives Learning Disabilities Positive Practice Guide January 2009 Contents 1. Background and policy framework
Moving Home Guide. A simple step by step guide to buying & selling
 RESIDENTIAL PROPERTY BUYING & SELLING Moving Home Guide A simple step by step guide to buying & selling 2 Turn to page 11 of this Guide where there is a useful checklist that details all the things you
MDG 4: Reduce Child Mortality
 143 MDG 4: Reduce Child Mortality The target for Millennium Development Goal (MDG) 4 is to reduce the mortality rate of children under 5 years old (under-5 mortality) by two-thirds between 1990 and 2015.
Successfully Implementing ERP Software
 A Solution Source White Paper 1769 Stafford Court Goshen, IN 46526 574-533-2659 www.solution-source.net Successfully Implementing ERP Software By Ryan Britsch, Operating Partner Page 1 Contents Introduction...
Guidance paper - The use of calculators in the teaching and learning of mathematics
 Guidance paper - The use of calculators in the teaching and learning of mathematics Background and context In mathematics, the calculator can be an effective teaching and learning resource in the primary
Chi-square test Fisher s Exact test
 Lesson 1 Chi-square test Fisher s Exact test McNemar s Test Lesson 1 Overview Lesson 11 covered two inference methods for categorical data from groups Confidence Intervals for the difference of two proportions
POLITY research & CONSULTING
 research & CONSULTING Workplace RAP Barometer 2014 Darryl Nelson Managing Director Polity Pty. Ltd. darryl@polityresearch.com.au May 2015 Contents RESEARCH & Consulting 1. Introduction & background 2.
Childcare and early years survey of parents 2014 to 2015
 Childcare and early years survey of parents 2014 to 2015 March 2016 Tom Huskinson, Sylvie Hobden, Dominic Oliver, Jennifer Keyes, Mandy Littlewood, Julia Pye, and Sarah Tipping Contents Executive Summary...
Point and Interval Estimates
 Point and Interval Estimates Suppose we want to estimate a parameter, such as p or µ, based on a finite sample of data. There are two main methods: 1. Point estimate: Summarize the sample by a single number
UNIVERSITY OF SUSSEX
 UNIVERSITY OF SUSSEX STRESS MANAGEMENT POLICY 1. INTRODUCTION 1.1 Introductory note 1.2 Note on terminology CONTENTS 2. STRESS MANAGEMENT POLICY 2.1 Policy statement 2.2 Stress in the workplace 2.3 The
Q&A on methodology on HIV estimates
 Q&A on methodology on HIV estimates 09 Understanding the latest estimates of the 2008 Report on the global AIDS epidemic Part one: The data 1. What data do UNAIDS and WHO base their HIV prevalence estimates
SITUATION IN LEBANON
 MIDDLE EAST CRISIS UNICEF Situation Report No. 13 Thursday 3 August 2006 Key Statistics IMPACT OF CONFLICT Duration of Conflict 23 days (since July 12) Deaths 835 (source: Higher Relief Committee) Casualties
The Standard Normal distribution
 The Standard Normal distribution 21.2 Introduction Mass-produced items should conform to a specification. Usually, a mean is aimed for but due to random errors in the production process we set a tolerance
Content Sheet 7-1: Overview of Quality Control for Quantitative Tests
 Content Sheet 7-1: Overview of Quality Control for Quantitative Tests Role in quality management system Quality Control (QC) is a component of process control, and is a major element of the quality management
Explaining the difference your project makes A BIG guide to using an outcomes approach. Sara Burns and Joy MacKeith Triangle Consulting October 2006
 Explaining the difference your project makes A BIG guide to using an outcomes approach Sara Burns and Joy MacKeith Triangle Consulting October 2006 Explaining the difference your project makes Stock code
1.17 Life expectancy at birth
 1.17 Life expectancy at birth The life expectancy of Aboriginal and Torres Strait Islander males and females for a given period. Data sources Life expectancy estimates for the years 2005 2007 presented
SAMPLING DISTRIBUTIONS
 0009T_c07_308-352.qd 06/03/03 20:44 Page 308 7Chapter SAMPLING DISTRIBUTIONS 7.1 Population and Sampling Distributions 7.2 Sampling and Nonsampling Errors 7.3 Mean and Standard Deviation of 7.4 Shape of
GETTING RECRUITMENT RIGHT
 INTRODUCTION GETTING RECRUITMENT RIGHT Getting recruitment right is one of the biggest challenges for any employer. Now age discrimination laws are in place, it s a high risk area. To help employers deliver
Community Services Sector
 Community Services Sector Q ueensland s community services sector provides effective, inclusive human services by supporting communities in building skills, finding solutions and promoting social justice.
Pathway Family Services LLC JOB DESCRIPTION JOB TITLE: Independent Living Specialist
 Pathway Family Services LLC JOB DESCRIPTION JOB TITLE: Independent Living Specialist EXEMPT: BENEFITS ELIGIBLE: DEPARTMENT: REPORTS TO: Yes Yes TRAIL Director, Transitional Living PREPARED BY: Human Resources
GLOBAL GUIDELINES Independent Monitoring of Polio Supplementary Immunization Activities (SIA)
") GLOBAL GUIDELINES Independent Monitoring of Polio Supplementary Immunization Activities (SIA) Introduction What is independent monitoring? Independent monitoring of SIAs is an objective measure of SIA
GLOBAL GUIDELINES Independent Monitoring of Polio Supplementary Immunization Activities (SIA) Introduction What is independent monitoring? Independent monitoring of SIAs is an objective measure of SIA
Decimals and other fractions
 Chapter 2 Decimals and other fractions How to deal with the bits and pieces When drugs come from the manufacturer they are in doses to suit most adult patients. However, many of your patients will be very
Key Steps to a Management Skills Audit
 Key Steps to a Management Skills Audit COPYRIGHT NOTICE PPA Consulting Pty Ltd (ACN 079 090 547) 2005-2013 You may only use this document for your own personal use or the internal use of your employer.
Equations, Inequalities & Partial Fractions
 Contents Equations, Inequalities & Partial Fractions.1 Solving Linear Equations 2.2 Solving Quadratic Equations 1. Solving Polynomial Equations 1.4 Solving Simultaneous Linear Equations 42.5 Solving Inequalities
A Review of the Integration of Brokerage Services in the South West
 A Review of the Integration of Brokerage Services in the South West EXECUTIVE SUMMARY This report presents the findings of the research study, A Review of the Integration of Brokerage Services in the South
Summary. Accessibility and utilisation of health services in Ghana 245
 Summary The thesis examines the factors that impact on access and utilisation of health services in Ghana. The utilisation behaviour of residents of a typical urban and a typical rural district are used
Childhood Lead Poisoning
 7 Childhood Lead Poisoning in Wisconsin The Scope of the Problem The WCLPPP began systematically collecting information on all blood lead tests conducted in Wisconsin since 994. Under the requirements
Internal Quality Assurance Arrangements
 National Commission for Academic Accreditation & Assessment Handbook for Quality Assurance and Accreditation in Saudi Arabia PART 2 Internal Quality Assurance Arrangements Version 2.0 Internal Quality
PROJECT CRITERIA: ECONOMIC VIABILITY AND PROJECT ALTERNATIVES
 SESSION 1.2 PROJECT CRITERIA: ECONOMIC VIABILITY AND PROJECT ALTERNATIVES Introductory Course on Economic Analysis of Investment Projects Economics and Research Department (ERD) Discounted Cash Flow: Measures
General Certificate of Education Ordinary Level 4040 Statistics November 2012 Principal Examiner Report for Teachers
 STATISTICS General Certificate of Education Ordinary Level Paper 4040/12 Paper 12 Key Messages If a question specifies a certain degree of accuracy for numerical answers, full marks will not be obtained
Inclusion and Exclusion Criteria
 Inclusion and Exclusion Criteria Inclusion criteria = attributes of subjects that are essential for their selection to participate. Inclusion criteria function remove the influence of specific confounding
FAMILY MATTERS PARENTING AGREEMENT FOR SCOTLAND PLAN
 FAMILY MATTERS PARENTING AGREEMENT FOR SCOTLAND PLAN CONTENTS 2 3 4 Introduction Putting your children first Effective communication Future arrangements for your children: 7 9 11 13 15 17 18 19 20 - living
Cambridge English: First (FCE) Frequently Asked Questions (FAQs)
 Frequently Asked Questions (FAQs)") Cambridge English: First (FCE) Frequently Asked Questions (FAQs) Is there a wordlist for Cambridge English: First exams? No. Examinations that are at CEFR Level B2 (independent user), or above such as
Cambridge English: First (FCE) Frequently Asked Questions (FAQs) Is there a wordlist for Cambridge English: First exams? No. Examinations that are at CEFR Level B2 (independent user), or above such as
User Guide LFS TWO-QUARTER AND FIVE-QUARTER LONGITUDINAL DATASETS 2011
 User Guide LFS TWO-QUARTER AND FIVE-QUARTER LONGITUDINAL DATASETS 2011 Version 1.0 August 2011 LFS LONGITUDINAL USER GUIDE LFS TWO-QUARTER AND FIVE-QUARTER LONGITUDINAL DATASETS - 2011 Introduction 1.
RESEARCH. Poor Prescriptions. Poverty and Access to Community Health Services. Richard Layte, Anne Nolan and Brian Nolan.
 RESEARCH Poor Prescriptions Poverty and Access to Community Health Services Richard Layte, Anne Nolan and Brian Nolan Executive Summary Poor Prescriptions Poor Prescriptions Poverty and Access to Community