Introduction to Groundwater Investigations Workbook
|
|
|
- Alisha Baker
- 7 years ago
- Views:
Transcription
1 United States Environmental Protection Agency Offi ce of Solid Waste and Emergency Response January Superfund Introduction to Groundwater Investigations Workbook

2

3 TABLE OF CONTENTS History of Colbert Landfill Page 1 Problem 1: Cross Section Exercise Page 3 Problem 2: Hydrogeological Exercise Page 15 Part 1: Determining Groundwater Flow Direction Page 15 Part 2: Groundwater Gradient and Seepage Velocity Calculation Page 20 Part 3: Falling Head Test Page 26 Problem 3: Performing an Aquifer Test Page 29 Problem 4: Groundwater Investigation Page 32 Glossary and Acronyms Page 45 Selected Hydrogeology Slides and Equations Page 53 Lecture Notes Page 65

4

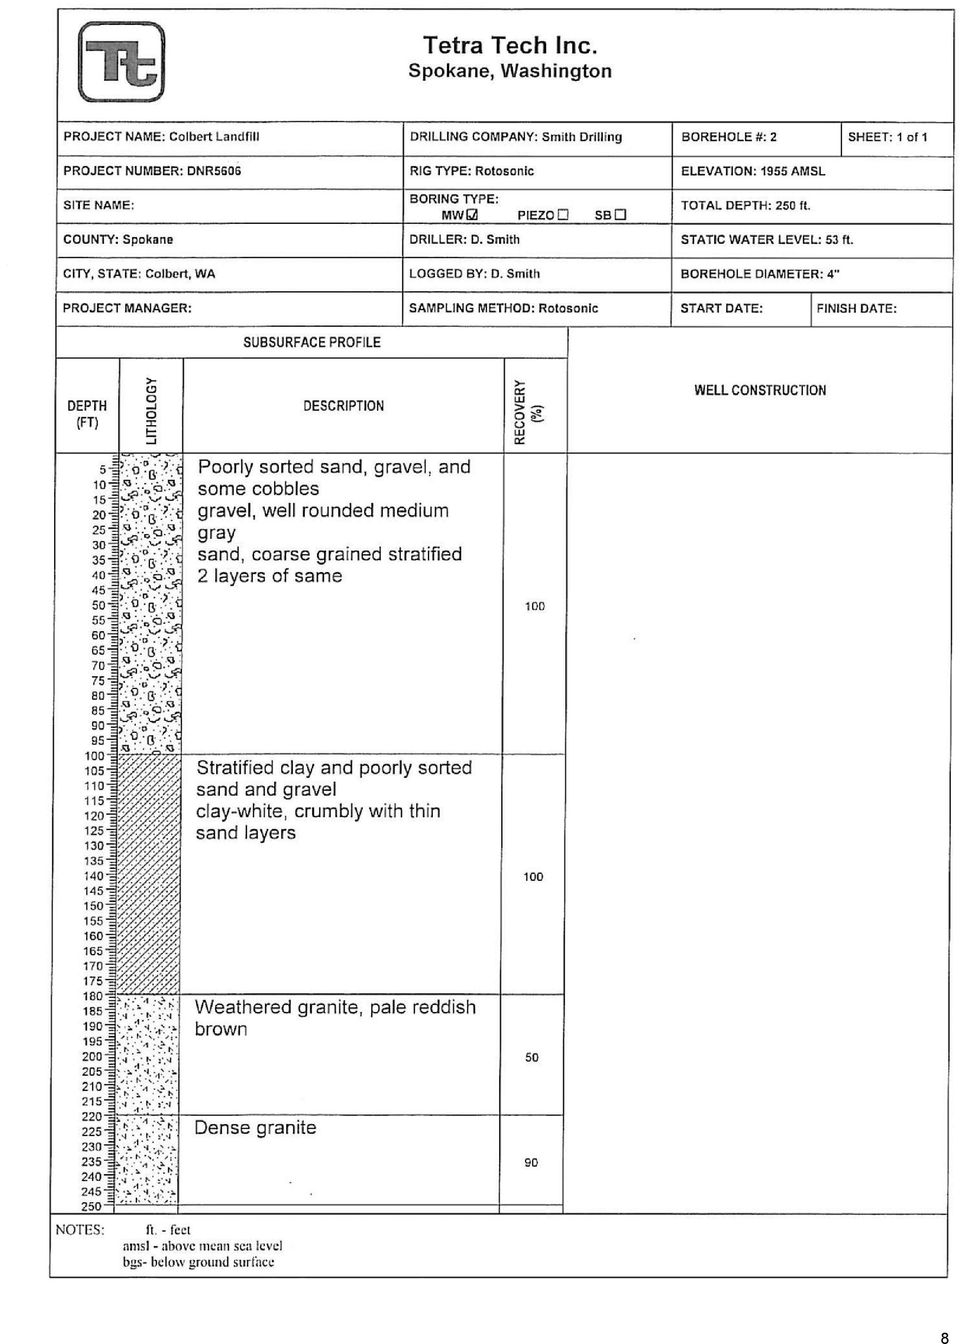
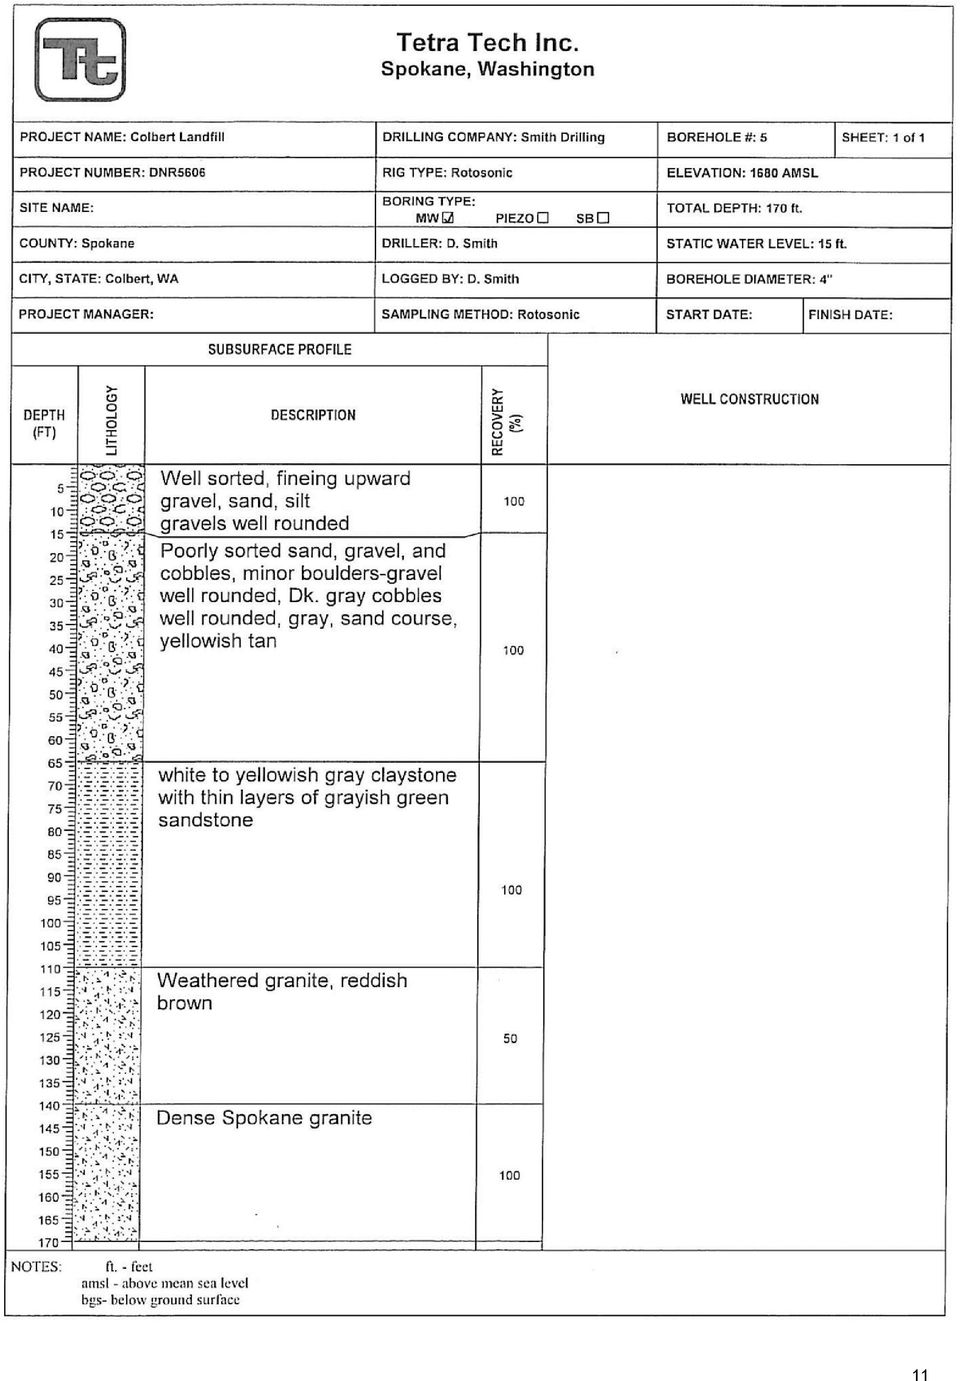
5 HISTORY OF COLBERT LANDFILL, SPOKANE, WASHINGTON The Colbert Landfill is located 2.5 miles north of the town of Colbert near Spokane, Washington, and is owned by the Spokane County Utilities Department. This 40-acre landfill was operated from 1968 to 1986, when it was filled to capacity and closed. It received both municipal and commercial wastes from many sources. From 1975 to 1980, a local electronics manufacturing company disposed spent solvents containing methylene chloride (MC) and 1,1,1-trichloroethane (TCA) into the landfill. A local Air Force base also disposed of solvents containing acetone and methyl ethyl ketone (MEK). These solvents were trucked to the landfill in 55-gallon drums and poured down the sides of open and unlined trenches within the landfill. Approximately gallons/month of MC and gallons/month of TCA were disposed. In addition, an unknown volume of pesticides and tar refinery residues from other sources were dumped into these trenches. The original site investigation was prompted by complaints from local residents who reported TCA contamination of their private wells. The population within 3 miles of the site is 1,500. In 1981, a Phase I investigation was conducted: a Phase 2 was completed in Groundwater samples collected from nearby private wells indicated TCA contamination at 5,600 µg/l, MC contamination at 2,500 µg/l, and acetone at a concentration of 445 µg/l. Investigation reports concluded that drinking groundwater posed the most significant risk to public health. EPA placed the site on the National Priority List (NPL) in Bottled water and a connection to the main municipal water system was supplied to residents with high TCA contamination (above the MCL), and the cost was underwritten by the potentially responsible parties (PRPs) involved. Hydrogeological Investigation The site lies within the drainage basin on the Little Spokane River, and residents with private wells live on all sides of the landfill. The surficial cover and subsequent lower strata in the vicinity of the site consist of glacially derived sediments of gravel and sand, below which lie layers of clay, basaltic lava flows, and granitic bedrock. The stratigraphic sequence beneath the landfill from the top (youngest) to the bottom (oldest) is: Qa Qfg Qglf Mcl Kiat Alluvium or stream deposits composed of well-sorted and stratified silts, sands, and gravels Upper sand and gravel glacial outwash and Missoula flood deposits which together form a water table aquifer Upper layers of glacial Lake Columbia deposits of impermeable silt and clay that serve as an aquitard; lower layers of older glaciofluvial and alluvial sand and gravel deposits that form a confined aquifer Impermeable and unweathered Latah Formation of silt and clay Fractured and unfractured granitic bedrock that serves as another confined aquifer 1
 and 1,1,1-trichloroethane (TCA) into the landfill.")
6 In the upper aquifer (Qfg), which is 8-15 feet thick, groundwater flows from 4 to 13 feet per day (ft/day). The lower confined sand and gravel aquifer (Qglf) varies from a few feet thick to 150 feet thick and is hydraulically connected to the Little Spokane River. Groundwater in this aquifer flows from 2 to 12 ft/day. To the northeast of the landfill, the upper aquifer is connected to the lower aquifer. Both of these aquifers are classified as current sources of drinking water according to EPA and are used locally for potable water. The area impacted by the site includes 6,800 acres and the contamination plume extends 5 miles toward the town of Colbert. Of the contaminants present, 90 percent occur as dense, nonaqueous-phase liquids (DNAPLs) at the bottom of the upper aquifer, and natural DNAPL degradation is slow. It has been estimated that only 10 percent of the solvents have gone into solution, whereas the remainder occurs in pore spaces and as pools of pure product above impermeable layers. The TCA plume in the upper aquifer has extended 9,000 feet in 8-10 years and it moves at a rate of 2-3 ft/day. The flow rate of the contamination plume in the lower sand and gravel aquifer (Qglf) has not been calculated because of the complexity and variability of the subsurface geology. However, TCA and MC have the highest concentrations in the lower sand and gravel aquifer. 2

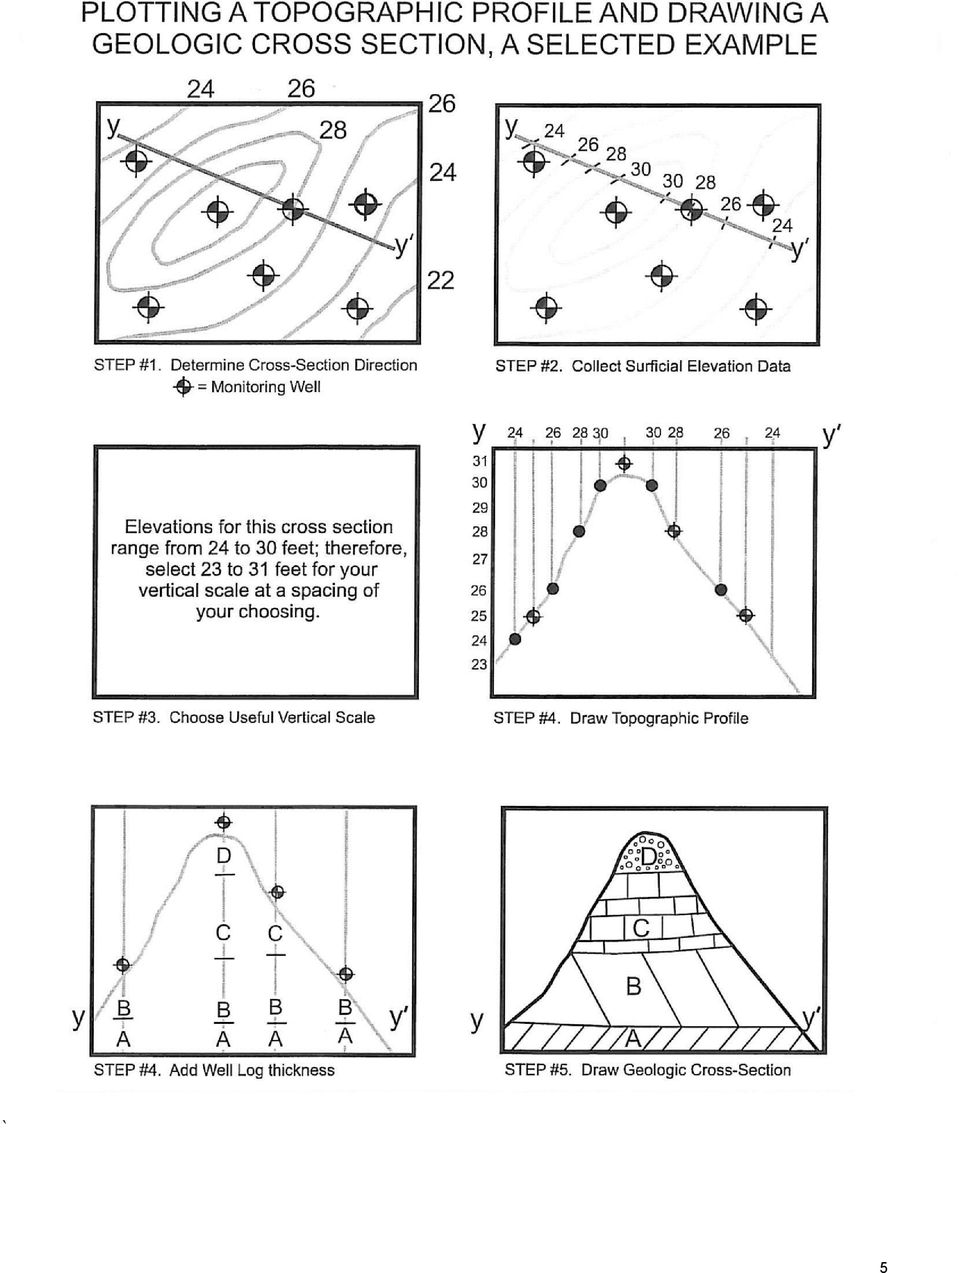
7 PROBLEM 1: CROSS-SECTION EXERCISE A. Student Performance Objectives 1. Draw a topographic profile of a specified area. 2. Calculate a vertical exaggeration for a topographic profile. 3. Obtain geological information from monitoring well logs. 4. Use the GSA Munsell color chart and McCulloch geotechnical gauge to identify rock sample colors and textures. 5. Given a geologic map, interpret surface elevations of geologic formations. 6. Draw a geologic cross section using monitoring well logs and a topographic profile. 7. Interpret subsurface geology to locate aquifers of concern and identify discontinuities in geologic formations. B. Background Information Students will examine rock/sediment samples labeled A, B, C, E, or F. These samples represent rock/sediment samples from five different geologic formations encountered during the installation of monitoring wells at, and in the vicinity of, the Colbert Landfill site in Spokane, Washington. During the site investigation, these samples were collected from cuttings generated by Roto-Sonic drilling. Each sample is also oriented with an arrow that indicates the top. C. Geologic Cross-Section 1. Using the GSA Munsell color chart and sample mask, match the overall color of the rocks, sand, clay, or gravel within the samples to the color chart. Do not determine every color if a sample is multicolored, but look for key sediment types or specific marker colors. 2. Using McCulloch s geotechnical gauge, generally determine and match the grain size of the sediments with the written descriptions. For example, actual fine sand or coarse sand sizes can be found on the chart. Sediments larger than coarse sand, such as gravel and cobbles, are NOT shown on the geotechnical card. Using the geotechnical gauge and the sediment characteristics diagram depicted in Figure 1, generally determine the degree of particle rounding and sediment sorting. Well sorted means most particles are of similar size and shape, whereas poorly sorted particles are of no particular size and vary greatly in size and shape, such as sand mixed with gravel or cobbles. 3

8 3. Using the SAMPLES and well log together, match these descriptions and your visual observations to a geologic formation listed on the Description of Geologic Units for Cross-Section of Colbert Landfill. Then identify each formation on the well logs in the space provided under the STRATA column; for example, Kiat, sample F. START WITH WELL LOG #6, AND PROCEED TO LOG #1. EACH SAMPLE REPRESENTS ONLY A PORTION OF ONE ROCK FORMATION! Your instructor will discuss the correct sample identification at the end of this portion of the exercise. 4. Using the appropriate topographic maps and graph paper provided, locate Wells 6 through 1 along the top of the graph paper from left to right along profile line A- A. Determine the respective surface elevations of the wells (your instructor will demonstrate this technique). 5. Label the Y-axis of the graph paper to represent the elevation, starting from 2,100 feet at the top to 1,400 feet at the bottom. Each box on the graph represents 20 FEET in elevation. 6. Plot the location, depicting the correct surface elevation of each well on the graph. Also determine and plot the elevations of SEVERAL EASILY DETERMINED POINTS on the profile line between each of the wells in order to add more detail to the profile. This will generate a series of dots representing the elevations of the six wells and the other elevations you have determined. Make sure to select contour lines that cross the profile line. The contour interval of this topographic map is 20 feet. 7. After plotting these elevations on the graph, connect them with a SMOOTH CURVE, which will represent the shape of the topography from A-A. 8. Using the well logs previously completed and the colored geologic map, add the existing geology and formation thickness to each well location. Each formation thickness must be determined by the depth on the left side of the well log. 9. Sketch in and interpret the geologic layers of the cross section, starting with the lowest bedrock formation. Connect all of the same geologic formations, keeping in mind that some formations have varying thicknesses and areal extent. 10. Using available groundwater information shown on the well logs, locate the shallow aquifer in the cross section. 11. Using the completed cross section, locate potential sites for the installation of additional monitoring wells or remediation wells and identify formation discontinuities. 12. Compare your interpretation with the suggested interpretation handed out by the instructor. 4

9 ` 5
10 DESCRIPTION OF GEOLOGIC UNITS IN THE AREA OF THE COLBERT LANDFILL SPOKANE, WASHINGTON MAP SYMBOL Qa Qfg Qls Qglf Mvwp Mcl Kiat DESCRIPTION Alluvium or stream deposits (Holocene) composed of silt, grayish-orange sand and gravel sediment that is well sorted and stratified. These deposits are found in flood plains, river terraces, and valley bottoms. Flood deposits (Pleistocene) poorly sorted, stratified mixture of boulders, gray cobbles, dark gray well-rounded gravel, and coarse sand resulting from multiple episodes of catastrophic outbursts from glacial-dammed lakes, such as glacial Lake Missoula. The Little Spokane River Valley was one of the main channelways for outburst flood waters from this ancient lake. Alluvial fan deposits (Pleistocene) composed of unstratified and poorly sorted (heterogeneous and anisotropic) clay-, silt-, pink sand-, and gravel-size sediment. Some fan deposits contain large blocks of gray basaltic rock as much as 8 meters (26 feet) in diameter. Lacustrine deposits (Pleistocene) composed of crumbly sediment of whiteclay, gray silt, and fine green sand, inter-bedded (mixed) with flood deposits (Pleistocene), composed of poorly sorted, but stratified mixtures of boulders, cobbles, gravel, and green sand. COLUMBIA RIVER BASALT GROUP-TERTIARY (MIOCENE) Wanapum extrusive basalt flows composed of dense, greenish-black, and weathered basalt; some have a vesicular (mineral-filled gas bubble) texture. Latah Formation white to yellowish gray siltstone and claystone, grayishgreen sandstone to lacustrine (lake) origin and grayish-orange sandstone from fluvial (river/stream) depositional environments. INTRUSIVE IGNEOUS ROCK-CRETACEOUS PERIOD, MESOZOIC ERA Mount Spokane granite massive, medium-grained pale, reddish-brown granite that is present on Mount Spokane. 6

11 7

12 8
13 9

14 10

15 11
16 12

17 13

18 W 6 V.E.= V.E.= V. Scale H. Scale 1"/80' 1"/2000' V.E.= 25 COLBERT LANDFILL 1" = 80' Vertical Scale 1" = 2,000' Map Scale Profile of Colbert Landfill, Spokane, Washington E 2 14

19 PROBLEM 2: HYDROGEOLOGICAL EXERCISES PART 1. DETERMINING GROUNDWATER FLOW DIRECTION A. General Discussion Methods for determining the direction of groundwater flow depend on the number of wells present on a particular site. When a site consists of only a few wells, a mathematical or graphical three-point problem can be used as shown in sections B and C. It is important to note that three-point problems can also be used to calculate the slope of the groundwater surface by dividing the difference in head (H 1 - H 3 ) by the measured map distance. When a site has a large number of wells, the slope of the groundwater surface can be calculated and depicted graphically by constructing a flow net, explained further in Part 2, section A. B. The Mathematic Three-Point Problem for Groundwater Flow Groundwater-flow direction can be determined from water-level measurements made on three wells at a site (Figure 1). 1. Given: Well Number Head (meters) Procedure: a. Select water-level elevations (head) for the three wells depicted in Figure 1. Label as H 1, H 2, and H 3 in descending order. b. Determine which well has a water-level elevation between the other wells (Well 2). c. Draw a line between Wells 1 and 3. Note that somewhere between these wells is a point, labeled A in Figure 2, where the water-level elevation at this point is equal to Well 2 (26.20 m). d. To determine the distance X from Well 1 to point A, solve the following equation (see Figure 3, 4, and 5): H 1 H 3 H 1 H 2 Y = X e. Distance Y is measured directly from the map (200 m) on Figure 3. f. After distance X is calculated, groundwater-flow direction based on the water-level elevations can be constructed 90 to the line representing equipotential elevation of m (Figure 6). 15
 by the measured map distance.")
20 16

21 17
22 18
23 C. The Graphical Three-Point Problem for Groundwater Flow Groundwater-level data can be used to determine direction of groundwater flow by constructing groundwater contour maps and flow nets. To calculate a flow direction, at least three observation points are needed. First, relate the groundwater field levels to a common datum map datum is usually best and then accurately plot their position on a scale plan. Second, draw a pencil line between each of the observation points, and divide each line into a number of short, equal lengths in proportion to the difference in elevation at each end of the line (Figure 7). The third step is to join points of equal height on each of the lines to form contour lines (lines of equal head). Select a contour interval that is appropriate to the overall variation in water levels in the study area. The direction of groundwater flow is at right angles to the contour lines from points of higher head to points of lower head (Figure 8). 19
24 PART 2. GROUNDWATER GRADIENT and SEEPAGE VELOCITY CALCULATION A. Purpose This part of the exercise uses basic principles defined in the determination of groundwater-flow directions. Groundwater gradients (slope of the top of the groundwater table) will be calculated as shown in the three-point problem. The three point procedure can be applied to a much larger number of water-level values to construct a groundwater-level contour map. Locate the position of each observation point on a base map of suitable scale and write the water level next to each well s position. Study these water-level values to decide which contour lines would cross the center of the map. Select one or two key contours to draw in first. Once the contour map is complete, flow lines can be drawn by first dividing a selected contour line into equal lengths. Flow lines are drawn at right angles from this contour, at each point marked on it. The flow lines are extended until the next contour line is intercepted, and are then continued at right angles tot his new contour line. Always select a contour that will enable you to draw the flow lines in a downgradient direction. B. Key Terms Head The energy contained in water mass produced by elevation, pressure, and/or velocity. It is a measure of the hydraulic potential due to pressure of the water column above the point of measurement and height of the measurement point above datum which is generally mean seal level. Head is usually expressed in feet or meters. Contour line A line that represents the points of equal values (e.g., elevation, concentration). Equipotential line A line that represents the points of equal head of groundwater in an aquifer. Flow lines Lines indicating the flow direction followed by groundwater toward points of discharge. Flow lines are always perpendicular to equipotential lines. They also indicate direction of maximum potential gradient. 20
25 21
26 22
27 23
28 Calculation of Seepage Velocity (Vs) Vs = KI Ne Given a hydraulic conductivity (K) of 5 ft/day and an effective porosity (Ne) of 15%; solve the amount of time (in Days) for groundwater to travel from point A to point B. Vs = KI Ne Vs = (5 ft/day) (0.017 ft/ft) 0.15 Vs = 0.56 ft/day Given a distance between Point A to B = 600 feet and using the velocity equation of (Vs) (Time) = Distance Time = Distance Vs Time = 600 ft = 1071 Days or 2.9 Years 0.56 ft/day Key Vs = Seepage velocity K = Hydraulic conductivity I = Gradient Ne = Effective porosity 24
29 C. Groundwater Gradient, Colbert Landfill Overlay the transparent sheet on top of the Colbert Landfill topographic map. Tape down to hold in place, and mark a few reference points to ensure correct placement throughout the exercise (i.e., make a + on an intersection or reference line on the map). Select an appropriate contour interval that fits the water levels available and the size of the map. Fifty-foot contour intervals should be appropriate for this problem. Draw the equipotential lines on the map interpolating between water-level measurements. Paragraph two of the Purpose also explains this technique. Construction flow lines perpendicular to the equipotential lines drawn in step 4 and discussed in paragraph three of Purpose. 25
30 PART 3. Falling Head Test Exercise A. Student Performance Objectives 1. Perform a falling head test on geologic materials. 2. Calculate total porosity, effective porosity, and estimated hydraulic conductivity. B. Perform a Falling Head Test 1. Set up burets using the stands and tube clamps. 2. Clamp the rubber tube at the bottom of the burets using the hose clamp. Fold the rubber hose to ensure a good seal before clamping (to help eliminate leaking water). 3. Position the small, round screen pieces in the bottom of the burets. Use the tamper to properly position the screens. 4. Measure 250 ml of colored water in the 500 ml plastic beaker. 5. Pour the water slowly into the buret to avoid disturbing the seated screen. 6. Measure 500 ml of gravel or sand material in the 500 ml plastic beaker. 7. Pour the gravel or sand slowly into the water column in the buret to prevent the disturbance of the screen traps and to allow any trapped air to flow to the surface of the water in the buret. 8. Add additional measured quantities of water or gravel/sand as needed until both the water and sediment reach the zero mark on the buret. To calculate the final total volumes of water and sediment, add the volumes of additional water and gravel/sand to the initial volumes of 250 and 500 ml of water and sediment. The total volumes of water and sediment are designated W and S respectively. 9. Measure the static water level in the buret to the base of the buret stand. This is the total head of the column of water at this elevation. This measurement is designated h Place a plastic, 500 ml graduated beaker below the buret. (The beaker will be used to collect the water drained from the buret.) The volume of water in the beaker is designated W D. 11. Undo the clamp and simultaneously start the timer to determine the flow rate of water through the buret. When the drained water front reaches the screen, stop the timer, clamp the buret hose, and record the elapsed time. Also record the volume of water drained during this time interval. This time is designated t. 26
31 12. Allow the water level in the buret to stabilize. Measure the length from this level to the base of the buret stand. This is the total head of the water column at this elevation after drainage has occurred. This measurement is designated h Subtract the measurement at h 1 from the height measurement at h 0. This length is designated L. 14. The porosity in the sediment of each buret is the volume of water necessary to fill the column of sediment in the buret to the initial static water mark at h 0 divided by the sediment volume (S). This value is total porosity and is designated N. 15. The effective porosity is estimated by dividing the volume of drained water by the sediment volume. Effective porosity is designated n. 16. Compare the initial volume of water (W) in the column before draining with the drained volume (W D ). The difference represents the volume of water retained (W R ), or the specific retention. The volume drained represents specific yield. To determine the percent effective porosity, divide the volume of drained water by the volume of total sediment volume. 17. The equation to estimate the hydraulic conductivity (K) of each buret column is derived from falling head permeameter experiments. The equations for this exercise are depicted below. 27
32 TABLE 2. TOTAL HEAD WORKSHEET Sample Number Volume Sediment (S) Volume Water (W) Volume Drained Water (WD) Volume Retained Water Total Porosity Calculated (N) Effective Porosity Calc. (n) Length (h 0 h 1 ) Time (t) Initial Head (H0) Final Head (H1) ln (h 0 /h 1 ) Est. Hydraulic Conductivity (K) Total Porosity Effective Porosity Est. Hydraulic Cond. N = W n = W D K = [2.3 x L] x ln (h 0 /h 1 ) S S [ t ] 28
33 PROBLEM 3: PERFORMING AN AQUIFER TEST JACOB TIME-DRAWNDOWN METHOD A. Background Information Each student will be given a sheet of semilogarithmic graph paper. Then, they should follow these directions: 1. Orient the semi-log paper, so the three-hole punches are at the top of the page. Label the long horizontal logarithmic axis (the side with the punched holes) of the graph paper t-times (minutes). Leave the first numbers (1 through 9) as is. Mark the next series of heavy lines from 10 to 100 in increments of 10 (10, 20, 30, etc.). Mark the next series from 100 to 1000 in increments of 100 (100, 200, 300, etc.). 2. Label the short vertical arithmetic axis s-drawdown (feet). This will be the drawdown (s) measured from the top of the casing (provided in Table 1). mark off the heavy lines by tens, starting with 0 at the top, then 10, 20, 30, 40 50, 60 and 70 (the bottom line). Each individual mark represents 1 foot. 3. Plot the data in Table 1 on the semilogarithmic paper with the values for drawdown on the arithmetic scale and corresponding pumping times on the logarithmic scale. 4. Draw a best-fit straight line through the data points. 5. Compute the change in drawdown over one log cycle where the data plot as a straight line. 6. Using the information given in Table 1 (Q = 109 gpm and b = 20 feet) and Jacob s formula shown below, calculate the value for hydraulic conductivity. ΔS = ft T = 35Q ΔS K = T b T = ft 2 /day K = ft/day 29
34 TABLE 1. PUMPING TEST DATA PUMPING TIME (t) (minutes) DRAWDOWN (h o h) MEASURED FROM TOP OF CASING Q = 109 gpm B 20 ft
35 PROBLEM 3: PERFORMING AN AQUIFER TEST HVORSLEV SLUG TEST A slug test is performed by lowering a metal slug into a piezometer that is screened in a silty clay aquifer. The inside diameter of both the well screen and the well casing is 2 inches. The borehole diameter is 4 inches. The well screen is 10 feet in length. The following data were obtained when the slug was rapidly pulled from the piezometer: TABLE 2. SLUG TEST DATA ELAPSED TIME (minutes) DEPTH TO WATER (feet) CHANGE IN WATER LEVEL h (feet) h/h o Static level (h o ) The time for the head to rise or fall to 37 percent of the initial value is T o. The following values are obtained from the geometry of the piezometer: r = feet R = feet L = 10.0 feet 1 cm/sec = 2835 ft/day The ratio L/R is 60.24, which is more than 8, so the following equation is used: K = r 2 ln(l/r) 2LT o 31
36 PROBLEM 4. GROUNDWATER INVESTIGTION BETTENDORF, IOWA A. Student Performance Objectives 1. This will be your final examination. Based on your performance, you and your group will be evaluated on your findings and conclusions that you presented to your peers. 2. Perform a site investigation using soil gas surveys and monitoring wells. 3. Determine the source(s) of hydrocarbon contamination at a contaminated site. 4. Present the results of the field investigation to the class. 5. Justify the conclusions of the field investigation. B. Desktop and Other Background Information History of the Leavings Residence On October 12, 1982, the Bettendorf, Iowa, fire department was called to the Leavings residence with complaints of gasoline vapors in the basement of the home. On October 16, 1982, the Leavings were required to evacuate their home for an indefinite period of time until the residence could be made safe for habitation. The gasoline vapors were very strong, so electrical service to the home was turned off. Basement windows were opened to reduce the explosion potential. 32
37 Pertinent Known Facts The contaminated site is in a residential neighborhood in Bettendorf, Iowa. It borders on commercially zoned property, which has only been partially developed to date. The residential area is about 10 years old and contains homes in the $40,000 to $70,000 range. There was apparently some cutting and filling activity at the time the area was developed. Within ¼ mile to the northwest and southwest, 11 reported underground storage tanks (USTs) are in use or have only recently been abandoned: * Two tanks owned and operated by the Iowa Department of Transportation (IDOT) are located 1000 ft northwest of the site. * Three in-place tanks initially owned by Continental Oil, and now by U-Haul, are located 700 ft southwest of the site. According to the Bettendorf Fire Department (BFD), one of the three tanks reportedly leaked. * Three tanks owned and operated by an Amoco service station are located 1200 ft southwest of the site. BFD reports no leaks. * Three tanks owned and operated by a Mobil Oil service station are located 1200 ft southwest of the site. BFD reports no leaks. Neighbors that own lots 8 and 10, which adjoin the Leavings residence (Lot 9), have complained about several trees dying at the back of their property. No previous occurrences of gasoline vapors have been reported at these locations. The general geologic setting is Wisconsin loess sediments mantling Kansan and Nebraskan glacial till. Valleys may expose the till surface on the side slope. Valley sediment typically consists of alluvial silts. Previous experience by your environmental consulting firm in this area includes a geotechnical investigation of the hotel complex located west of Utica Ridge Road and northwest of the Amoco service station. Loess sediments ranged from 22 ft thick on the higher elevations of the property (western half) to 10 ft thick on the side slope. Some silt fill (5-7 ft) was noted at the east end of the hotel property. Loess was underlain by a gray, clayey glacial till which apparently had groundwater perched on it. Groundwater was typically within ft of ground surface. This investigation was performed 8 years ago and nothing in the boring logs indicated the observation of hydrocarbon vapors. However, this type of observation was not routinely reported at that time. Other projects in the area included a maintenance yard pavement design and construction phase testing project at the IDOT facility located northwest of the Leavings residence. Loess sediments were also encountered in the shallow pavement subgrade project completed 3 years ago. Consulting firm records indicated that the facility manager reported a minor gasoline spill a year before and that the spill had been cleaned up when the leaking tank was removed and replaced with a new steel tank. The second tank at the IDOT facility apparently was not replaced at that time. 33
38 Results of Site Interviews Lot 9 (THE Leavings residence): Observations outside the residence indicate that the trees are in relatively good condition. The house was vacant. Six inches of free product that looks and smells like gasoline was observed in the open sump pit in the basement. The power to the residence was turned off, so the water level in the sump was allowed to rise. The fluid level in the sump was about 3 feet below the level of the basement floor. Neighbors (Lots 8 and 10): These property owners reported that several trees in their backyards died during the past spring. They contacted the developer of the area (who also owns the commercial property that adjoins their lots) and complained that the fill that was placed there several years ago killed some of their trees. No action was taken by the developer. Both neighbors said that when the source of the as was located, they wanted to be notified so they could file their own lawsuits. The neighbors also noted that this past September and October were unusually wet (lots of rainfall). IDOT: The manager remembers employees from your firm testing his parking lot. He reported that one UST was replaced in 1979, whereas the other tank was installed when the facility was built in Both of the original tanks were bare metal tanks. The older replaced tank always contained gasoline, but the newer one contains diesel fuel. No inventory records or leak testing records are available. The manager stated that he has never had any water in his tanks. He will check with his supervisor to have the USTs precision leak tested. U-Haul: The manager said that the station used to be a Continental Oil station with three USTs. The three USTs were installed by Continental in 1970 when the station was built. Currently, only one 6000-gal UST (unleaded) remains in service for the U- Haul fleet. This tank was found to be leaking a month ago, but the manager does not know how much fuel leaked. Mobil: The manager was pleasant until he found out the purpose of the interview. He did state that he built the station in 1970 and installed three USTs at that time. He would not answer any additional questions. Amoco: The manager was not in, but an assistant provided his telephone number. In a telephone interview, the manager said he was aware of the leaking tank at the U- Haul factory and was anxious to prove the product was not from his station. He said they installed three USTs for unleaded, premium, and regular gasoline in An additional diesel UST was installed in The tanks are tested every 2 years using the Petrotite test method. The tanks have always tested tight. No inventory control system is being used at present. He stated that if monitoring wells were needed on his property, he would be happy to cooperate. 34
39 Developer (Mr. M. Forester): Mr. Forester bought the property in question in the 1960s. He developed the residential area first and some of the commercial development followed. About 40 acres remain undeveloped to date. He plans to build a shopping center on the remaining 40 acres in the future. Mr. Forester obtained a lot of cheap dirt and fill when the interstate cut went through about ½ mile west of the property in the late 1960s. He filled in a couple of goodsized valleys at that time. He has a topographic map of the area after it was filled. He stated that he will cooperate fully with any investigation. If any wells are needed on the property, he would like to be notified in advance. There are no buried utilities on the property except behind the residential neighborhood. Review of Bettendorf City Hall Records An existing topographic map and scaled land use map are included in this exercise. Ownership records indicate the land was previously owned by Mr. and Mrs. Ralph Luckless. The city hall clerk stated that she had known them prior to the sale of the farm in Zoning at that time was agricultural only. The section of the farm now in question was primarily used for grazing cattle because it was too steep for crops. The clerk remembered a couple of wooded valleys in that same field. She also remembered a muddy stream that used to run where Golden Valley Drive is now and that children used to swim in it. She also stated that one valley was between Golden Valley Drive and where all the fill is now (near U-Hal and Amoco). The current owner of the underdeveloped property is Mr. M. Forester, a developer with an Iowa City, Iowa address. There is no record of storm of sanitary sewer lines along Utica Ridge Road south of Golden Valley Drive. Storm and sanitary sewer lines run along Spruce Hills Drive. Iowa Ecological Survey Information There are no records of any wells in the section. In an adjoining section, wells indicate top of bedrock at about 650 feet mean sea level (MSL). The uppermost usable aquifer is the Mississippian-age limestone for elevations from 350 feet to 570 feet MSL. The materials overlying the Mississippian are Pennsylvanian shales and limestone. Soil Conservation Survey Maps The 1974 edition indicates Made Land over nearly all of the area not designated as commercial zone. Made Land normally indicates areas of cut or fill. 35
40 36
41 37
42 38
43 ASSIGNMENT: FIELD INVESTIGATION TABULATION OF FEES FOR FIELD INVESTIGATION GROUP WORKSHEET #1 # UNITS COST TOTAL $500 LS Recommendations for making residence habitable 1 each $ (lump sum) Soil gas survey mobilization fee 1 each $500 LS $ Soil gas survey $1500/ac Monitoring wells mobilization fee 1 each $500 LS $ 2 PVC $1200 ea 15 ft screen 25 ft deep 2 stainless steel $ $1700 ea 15 ft screen 25 ft deep Well security locking protector pipe $300 ea $ Field investigation engineering analysis and report TOTAL COST 1 each 15% $2000 min $ $ SITE INVESTIGATION FIELD ACTIVITIES AT BETTENDORF, IOWA Each team is to perform a site investigation. (The instructors will select the groups.) All public written information has been provided, and we expect your team to gather field data and other information from us in order to identify the responsible parties for the contamination at the Leavings residence. Your group will need to select where to install monitoring wells and conduct soil gas surveys. Use the table on page 10 for monitoring well data and the base map on page 11 for soil gas survey results. The following caveats are a guide of activities for your group to follow while completing this task. 1. Teams will be determined by the instructors. 2. Review all prior desktop information. 3. Organize your effort in gathering more data and information. a. Determine the location of the groundwater table by installing monitoring wells. b. Determine source(s) of contamination and define the shape of the contaminant plume(s) on top of the groundwater table using i. Data from monitoring wells ii. Soil gas survey results c. Construct a cross section normal to groundwater flow. d. Determine hydraulic conductivity using slug test data. e. Calculate transport time of contaminants. f. Calculate cost of investigation. 39
44 40
45 41
46 Scale: = 100 ft 42
47 Group #: FINAL GROUNDWATER PROBLEM: BETTENDORF, IOWA Each group of students will determine, identify, draw, and calculate the items below and include them in brief class presentation. Group scores (out of 100%) are based upon completion of each category below. SCORE: 1. Determine groundwater flow direction by constructing a groundwater surface contour map and a flow net (not a 3-point problem) on the site map provided. 2. Identify the source(s) that contributed to the Leavings groundwater problem. 3. Sketch a contaminant plume map from your collected subsurface date on the site map sheet provided. 4. Draw a geologic cross section that lies perpendicular to the direction of the groundwater flow; identify geologic units and groundwater level on the graph paper provided. 5. Using your groundwater surface contour map, calculate the hydraulic gradient (I) in feet per foot between the source and the Leavings residence. 6. Plot your slug test data on the semi-log sheet provided. Label your axes. 7. Calculate the hydraulic conductivity (K) value in feet per day using the Hvorsley Method and the slug test data provided. Show calculations on the graph paper. 8. Calculate the seepage velocity (v) in feet per day using v s = KL/n e with an effective porosity (n e ) value of Calculate an approximate transport time in years of the contaminant from the source to the Leavings residence using the equation: v s T (time in years) = D (distance in feet). 10. Determine your final cost for conducting this hydrogeologic investigation: $. TOTAL GROUP SCORE: (To be filled in by Course Director.) Print group member names below: a. e. b. f. c. g. d. h. 43
48 LEAVINGS RESIDENCE SITE, IOWA SLUG TEST RESULTS MW-6, Grid Location at E-12 44
49 GLOSSARY AND ACRONYMS acre-foot adsorption advection alluvium anisotropic aquifer aquifer test aquitard artesian artesian aquifer artificial recharge enough water to cover 1 acre to a depth of 1 foot; equal to 43,560 cubic feet or 325,851 gallons the attraction and adhesion of a layer of ions from an aqueous solution to the solid mineral surfaces with which it is in contact the process by which solutes is transported by the bulk motion of the flowing groundwater a general term for clay, silt, sand, gravel, or similar unconsolidated material deposited during comparatively recent geologic time by a stream or other body of running water as sorted or semisorted sediment in the bed of the stream or on its floodplain or delta, or as a cone or fan at the base of a mountain slope hydraulic conductivity ( K ), differing with direction a geologic formation, group of formations, or a part of a formation that contains sufficient permeable material to yield significant quantities of groundwater to wells and springs. Use of the term should be restricted to classifying water bodies in accordance with stratigraphy or rock types. In describing hydraulic characteristics such as transmissivity and storage coefficient, be careful to refer those parameters to the saturated part of the aquifer only. a test involving the withdrawal of measured quantities of water from, or the addition of water to, a well (or wells) and the measurement of resulting changes in head (water level) in the aquifer both during and after the period of discharge or addition a saturated, but poorly permeable bed, formation, or group of formations that does not yield water freely to a well or spring confined; under pressure sufficient to raise the water level in a well above the top of the aquifer see confined aquifer recharge at a rate greater than natural, resulting from deliberate or incidental actions of man Introduction to Groundwater Investigations 45
50 BTEX capillary zone capture coefficient of storage cone of depression benzene, toluene, ethylbenzene, and xylenes negative pressure zone just above the water table where water is drawn up from saturated zone into matrix pores due to cohesion of water molecules and adhesion of these molecules to matrix particles. Zone thickness may be several inches to several feet depending on porosity and pore size. the decrease in water discharge naturally from a ground-water reservoir plus any increase in water recharged to the reservoir resulting from pumping the volume of water an aquifer releases from or takes into storage per unit surface area of the aquifer per unit change in head depression of heads surrounding a well caused by withdrawal of water (larger cone for confined aquifer than for unconfined) confined aquifer confining bed diffusion discharge velocity discharge area dispersion geological formation capable of storing and transmitting water in usable quantities overlain by a less permeable or impermeable formation (confining layer) placing the aquifer under pressure a body of impermeable material stratigraphically adjacent to one or more aquifers the process whereby particles of liquids, gases, or solids intermingle as a result of their spontaneous movement caused by thermal agitation an apparent velocity, calculated from Darcy s law, which represents the flow rate at which water would move through the aquifer if it were an open conduit (also called specific discharge) an area in which subsurface water, including both groundwater and water in the unsaturated zone, is discharged to the land surface, to surface water, or to the atmosphere the spreading and mixing of chemical constituents in groundwater caused by diffusion and by mixing due to microscopic variations in velocities within and between pores Introduction to Groundwater Investigations 46
51 DNAPL drawdown effective porosity evapotranspiration flow line gaining stream gpm groundwater reservoir groundwater divide groundwater system groundwater model groundwater head heterogeneous homogeneous dense, non-aqueous phase liquid the vertical distance through which the water level in a well is lowered by pumping from the well or nearby well the amount of interconnected pore space through which fluids can pass, expressed as a percent of bulk volume. Part of the total porosity will be occupied by static fluid being held to the mineral surface by surface tension, so effective porosity will be less than total porosity. the combined loss of water from direct evaporation and through the use of water by vegetation (transpiration) the path that a particle of water follows in its movement through saturated, permeable materials a steam or reach of a stream whose flow is being increased by inflow of groundwater (also called an effluent stream) gallons per minute all rocks in the zone of saturation (see also aquifer) a ridge in the water table or other potentiometric surface from which groundwater moves away in both directions normal to the ridge line a groundwater reservoir and its contained water; includes hydraulic and geochemical features simulated representation of a groundwater system to aid definition of behavior and decision-making water in the zone of saturation combination of elevation above datum and pressure energy imparted to a column of water (velocity energy is ignored because of low velocities of groundwater). Measured in length units (i.e., feet or meters). geological characteristics varying aerially or vertically in a given system geology of the aquifer is consistent; not changing with direction or depth Introduction to Groundwater Investigations 47
52 hydraulic conductivity hydraulic gradient volume flow through a unit cross-section area per unit decline in head change of head values over a distance H 1 H 2 L where: H = head L = distance between head measurement points hydrogeology hydrograph impermeable infiltration interface intrinsic permeability isotropic K laminar flow LNAPL losing stream the study of interactions of geologic materials and processes with water, especially groundwater graph that shows some property of groundwater or surface water as a function of time having a texture that does not permit water to move through it perceptibly under the head difference that commonly occurs in nature the flow of movement of water through the land surface into the ground in hydrology, the contact zone between two different fluids pertaining to the relative ease with which a porous medium can transmit a liquid under a hydrostatic or potential gradient. It is a property of the porous medium and is independent of the nature of the liquid or the potential field. hydraulic conductivity ( K ) is the same regardless of direction hydraulic conductivity (measured in velocity units and dependent on formation characteristics and fluid characteristics) low velocity flow with no mixing (i.e., no turbulence) light, non-aqueous phase liquid a stream or reach of a stream that is losing water to the subsurface (also called an influent stream) Introduction to Groundwater Investigations 48
53 mining MSL non-steady state steady state optimum yield overdraft perched aquifer permeability permeameter piezometer in reference to groundwater, withdrawals in excess of natural replenishment and capture. Commonly applied to heavily pumped areas in semiarid and arid regions, where opportunity for natural replenishment and capture is small. The term is hydrologic and excludes any connotation of unsatisfactory water-management practice mean sea level (also called non-steady shape or unsteady shape) the condition when non-steady shape the rate of flow through the aquifer is changing and water levels are declining. It exists during the early stage of withdrawal when the water level throughout the cone of depression is declining and the shape of the cone is changing at a relatively rapid rate. (also called steady shape) is the condition that exists during the intermediate stage of withdrawals when the water level is still declining but the shape of the central part of the cone is essentially constant the best use of groundwater that can be made under the circumstances; a use dependent not only on hydrologic factors but also on legal, social, and economic factors withdrawals of groundwater at rates perceived to be excessive and, therefore, an unsatisfactory water-management practice (see also mining) a zone of saturation in a formation that is discontinuous from the water table and the unsaturated zones surrounding this formation. Some regulatory agencies include an upper limit on the hydraulic conductivity of the perched aquifer the property of the aquifer allowing for transmission of fluid through pores (i.e., connection of pores) a laboratory device used to measure the intrinsic permeability and hydraulic conductivity of a soil or rock sample a non-pumping well, generally of small diameter, that is used to measure the elevation of the water table or potentiometric surface. A piezometer generally has a short well screen through which water can enter. Introduction to Groundwater Investigations 49
54 porosity potentiometric surface recharge recharge area safe yield saturated zone slug-test specific yield specific capacity steady-state storage coefficient S storage the ratio of the volume of the interstices or voids in a rock or soil to the total volume imaginary saturated surface (potential head of confined aquifer); a surface that represents the static head; the levels to which water will rise in tightly cased wells the processes of addition of water to the zone of saturation an area in which water that enters the subsurface eventually reaches the zone of saturation magnitude of yield that can be relied upon over a long period of time (similar to sustained yield) zone in which all voids are filled with water (the water table is the proper limit) an aquifer test made by either pouring a small instantaneous charge of water into a well or by withdrawing a slug of water from the well (when a slug of water is removed from the well, it is also called a bail-down test) ratio of volume of water released under gravity to total volume of saturated rock the rate of discharge from a well divided by the drawdown in it. The rate varies slowly with the duration of pumping, which should be stated when known. the condition when the rate of flow is steady and water levels have ceased to decline. It exists in the final stage of withdrawals when neither the water level nor the shape of the cone is changing. volume of water taken into or released from aquifer storage per unit surface area per unit change in head (dimensionless) (for confined, S = to 0.001; for unconfined, equal to porosity) in groundwater hydrology, refers to 1) water naturally detained in a groundwater reservoir, 2) artificial impoundment of water in groundwater reservoirs, and 3) the water so impounded Introduction to Groundwater Investigations 50
55 storativity sustained yield transmissivity unsaturated zone (vadose zone) the volume of water an aquifer releases from or takes into storage per unit surface area of the aquifer per unit change in head (also called coefficient of storage) continuous long-term groundwater production without progressive storage depletion (see also safe yield) the rate at which water is transmitted through a unit width of an aquifer under a unit hydraulic gradient the zone containing water under pressure less than that of the atmosphere, including soil water, intermediate unsaturated (vadose) water, and capillary water. Some references include the capillary water in the saturated zone. This upper limit of this zone is the land surface and the lower limit is the surface of the zone of saturation (i.e., the water table). water table surface of saturated zone area at atmospheric pressure; that surface in an unconfined water body at which the pressure is atmospheric. Defined by the levels at which water stands in wells that penetrate the water body just far enough to hold standing water. Introduction to Groundwater Investigations 51
56 52
57 Selected hydrogeology slides and equations Stream Flow v (velocity) Q (discharge) Q = Av A (cross sectional area) POROSITY (N t ) The volumetric ratio between the void spaces (V v ) and total rock (V t ): N t = V v ; N t = S y + S r V t S y = specific yield S r = specific retention 53
58 Porosity CLAY SAND TOTAL POROSITY (N t ): 40 85% 25 50% EFFECTIVE POROSITY (N e ): 1 10% 10 30% GRAVEL 25 45% 15 30% Total Head (h t ) Combination of elevation (z) and pressure head (h p ) h t = z + h p Total head is the energy imparted to a column of water GROUNDWATER LEVEL PRESSURE HEAD (h p ) HYDRAULIC OR (h t ) POINT OF MEASUREMENT ELEVATION HEAD (z) TOTAL HEAD DATUM (usually sea level) 54
59 Unconfined Aquifer WATER TABLE VADOSE ZONE GROUNDWATER FLOW UNCONFINED AQUIFER VERTICAL EQUIPOTENTIAL LINES GROUNDWATER FLOW CONFINING UNIT AQUITARD Confined Aquifer VADOSE ZONE CONFINING UNIT AQUITARD POTENTIOMETRIC SURFACE CONFINED AQUIFER BASE OF UPPER CONFINING UNIT CONFINING UNIT AQUITARD RECHARGE VADOSE ZONE WATER TABLE CONFINING LAYERS (AQUITARDS) 55
1.72, Groundwater Hydrology Prof. Charles Harvey Lecture Packet #2: Aquifers, Porosity, and Darcy s Law. Lake (Exposed Water Table)
") 1.72, Groundwater Hydrology Prof. Charles Harvey Lecture Packet #2: Aquifers, Porosity, and Darcy s Law Precipitation Infiltration Lake (Exposed Water Table) River Water table Saturated zone - Aquifer
1.72, Groundwater Hydrology Prof. Charles Harvey Lecture Packet #2: Aquifers, Porosity, and Darcy s Law Precipitation Infiltration Lake (Exposed Water Table) River Water table Saturated zone - Aquifer
CONSTANT HEAD AND FALLING HEAD PERMEABILITY TEST
 CONSTANT HEAD AND FALLING HEAD PERMEABILITY TEST 1 Permeability is a measure of the ease in which water can flow through a soil volume. It is one of the most important geotechnical parameters. However,
STATE OF VERMONT AGENCY OF NATURAL RESOURCES DEPARTMENT OF ENVIRONMENTAL CONSERVATION WASTE MANAGEMENT DIVISION SOLID WASTE MANAGEMENT PROGRAM
 STATE OF VERMONT AGENCY OF NATURAL RESOURCES DEPARTMENT OF ENVIRONMENTAL CONSERVATION WASTE MANAGEMENT DIVISION SOLID WASTE MANAGEMENT PROGRAM Solid Waste Management Program Waste Management Division 103
How To Prepare A Geotechnical Study For A Trunk Sewer Project In Lincoln, Nebraska
 APPENDIX B Geotechnical Engineering Report GEOTECHNICAL ENGINEERING REPORT Preliminary Geotechnical Study Upper Southeast Salt Creek Sanitary Trunk Sewer Lincoln Wastewater System Lincoln, Nebraska PREPARED
6. Base your answer to the following question on the graph below, which shows the average monthly temperature of two cities A and B.
 1. Which single factor generally has the greatest effect on the climate of an area on the Earth's surface? 1) the distance from the Equator 2) the extent of vegetative cover 3) the degrees of longitude
Ground-Water-Level Monitoring and the Importance of Long-Term Water-Level Data U.S. Geological Survey Circular 1217
 Ground-Water-Level Monitoring and the Importance of Long-Term Water-Level Data U.S. Geological Survey Circular 1217 by Charles J. Taylor William M. Alley Denver, Colorado 2001 U.S. DEPARTMENT OF THE INTERIOR
CHAPTER 2 HYDRAULICS OF SEWERS
 CHAPTER 2 HYDRAULICS OF SEWERS SANITARY SEWERS The hydraulic design procedure for sewers requires: 1. Determination of Sewer System Type 2. Determination of Design Flow 3. Selection of Pipe Size 4. Determination
WEATHERING, EROSION, AND DEPOSITION PRACTICE TEST. Which graph best shows the relative stream velocities across the stream from A to B?
 NAME DATE WEATHERING, EROSION, AND DEPOSITION PRACTICE TEST 1. The diagram below shows a meandering stream. Measurements of stream velocity were taken along straight line AB. Which graph best shows the
WILLOCHRA BASIN GROUNDWATER STATUS REPORT 2009-10
 WILLOCHRA BASIN GROUNDWATER STATUS REPORT 2009-10 SUMMARY 2009-10 The Willochra Basin is situated in the southern Flinders Ranges in the Mid-North of South Australia, approximately 50 km east of Port Augusta
Principles of groundwater flow
 Principles of groundwater flow Hydraulic head is the elevation to which water will naturally rise in a well (a.k.a. static level). Any well that is not being pumped will do for this, but a well that is
Vulnerability Assessment
 Vulnerability Assessment VULNERABILITY As used in this report, vulnerability refers to the sensitivity of groundwater to contamination, and is determined by intrinsic characteristics of the aquifer. It
SANITARY SEWER SPECIFICATIONS
 SANITARY SEWER SPECIFICATIONS OCTOBER 2003 HARVEST-MONROVIA WATER, SEWER, AND FIRE PROTECTION AUTHORITY SECTION 1.00 1.10 Purpose The purpose of this document is to assemble the sewer specifications, policies,
For Water to Move a driving force is needed
 RECALL FIRST CLASS: Q K Head Difference Area Distance between Heads Q 0.01 cm 0.19 m 6cm 0.75cm 1 liter 86400sec 1.17 liter ~ 1 liter sec 0.63 m 1000cm 3 day day day constant head 0.4 m 0.1 m FINE SAND
14.330 SOIL MECHANICS Assignment #4: Soil Permeability.
 Geotechnical Engineering Research Laboratory One University Avenue Lowell, Massachusetts 01854 Edward L. Hajduk, D.Eng, PE Lecturer PA105D Tel: (978) 94 2621 Fax: (978) 94 052 e mail: Edward_Hajduk@uml.edu
Ground Water in the Piedmont and Blue Ridge Provinces of North Carolina
 Ground Water in the Piedmont and Blue Ridge Provinces of North Carolina Prepared by: R.L. Huffman Extension Agricultural Engineering Specialist Published by: North Carolina Cooperative Extension Service
SLOPE AND TOPOGRAPHY
 SLOPE AND TOPOGRAPHY What are Slope and Topography? Slope and topography describe the shape and relief of the land. Topography is a measurement of elevation, and slope is the percent change in that elevation
CHAPTER: 6 FLOW OF WATER THROUGH SOILS
 CHAPTER: 6 FLOW OF WATER THROUGH SOILS CONTENTS: Introduction, hydraulic head and water flow, Darcy s equation, laboratory determination of coefficient of permeability, field determination of coefficient
MEMORANDUM. Further discussion regarding the Community s solid waste facility is described further in this memorandum.
 MEMORANDUM File: Sanikiluaq Improvement of the Existing Wastewater Treatment Facility To: Government of Nunavut Department of Community and Government Services Attention: Mr. Grigor Hope,, Project Officer
GROUNDWATER FLOW NETS Graphical Solutions to the Flow Equations. One family of curves are flow lines Another family of curves are equipotential lines
 GROUNDWTER FLOW NETS Graphical Solutions to the Flow Equations One family of curves are flow lines nother family of curves are equipotential lines B C D E Boundary Conditions B and DE - constant head BC
How To Map A Lake In The North Of The Holland (Fiji)
") 1. Hydrogelogical mapping Jiri Sima Aim of HG map Groundwater and rocks qualitative permeability and quantitative potential of rock units aquifers / aquitards / aquiclides Water points (spatial distribution
1. Hydrogelogical mapping Jiri Sima Aim of HG map Groundwater and rocks qualitative permeability and quantitative potential of rock units aquifers / aquitards / aquiclides Water points (spatial distribution
Flash Flood Science. Chapter 2. What Is in This Chapter? Flash Flood Processes
 Chapter 2 Flash Flood Science A flash flood is generally defined as a rapid onset flood of short duration with a relatively high peak discharge (World Meteorological Organization). The American Meteorological
COST AND PERFORMANCE REPORT
 COST AND PERFORMANCE REPORT Pump and Treat of Contaminated Groundwater at the United Chrome Superfund Site Corvallis, Oregon September 1998 Prepared by: SITE INFORMATION Identifying Information: United
Groundwater flow systems theory: an unexpected outcome of
 Groundwater flow systems theory: an unexpected outcome of early cable tool drilling in the Turner Valley oil field K. Udo Weyer WDA Consultants Inc. weyer@wda-consultants.com Introduction The Theory of
Utilizing an Innovative, Effective Site Assessment and Monitoring Tool
 Utilizing an Innovative, Effective Site Assessment and Monitoring Tool Jay W. Hodny, Ph.D. W. L. Gore & Associates, Inc., Elkton, MD, USA Laurie LaPlante, P.E. Kleinfelder, Inc., Salt Lake City, UT, USA
CHAPTER 13 LAND DISPOSAL
 CHAPTER 13 LAND DISPOSAL Supplemental Questions: Which of Shakespeare's plays is the source of the opening quote? The Tempest [1611-1612],Act: I, Scene: i, Line: 70. 13-1. Cite four reasons landfills remain
NUMERICAL ANALYSIS OF SEEPAGE THROUGH EMBANKMENT DAMS (CASE STUDY: KOCHARY DAM, GOLPAYEGAN)
") NUMERICAL ANALYSIS OF SEEPAGE THROUGH EMBANKMENT DAMS (CASE STUDY: KOCHARY DAM, GOLPAYEGAN) *Reza Naghmehkhan Dahande 1 and Ahmad Taheri 2 1 Department of Civil Engineering-Water Management, Islamic Azad
NUMERICAL ANALYSIS OF SEEPAGE THROUGH EMBANKMENT DAMS (CASE STUDY: KOCHARY DAM, GOLPAYEGAN) *Reza Naghmehkhan Dahande 1 and Ahmad Taheri 2 1 Department of Civil Engineering-Water Management, Islamic Azad
ENVIRONMENTAL CODE OF PRACTICE FOR CONCRETE BATCH PLANT & ROCK WASHING OPERATIONS
 ENVIRONMENTAL CODE OF PRACTICE FOR CONCRETE BATCH PLANT & ROCK WASHING OPERATIONS PREPARED BY: DEPARTMENT OF ENVIRONMENT AND LANDS INDUSTRIAL ENVIRONMENTAL ENGINEERING DIVISION APRIL 16, 1992 - TABLE OF
Ground Water Surveys and Investigation
 Ground Water Surveys and Investigation By Gautam Mahajan ASHISH PUBLISHING HOUSE 8/81, PUNJABI BAGH, NEW DELHI-110 026 - Contents Preface List of Abbrivations (v) (vii) 1.1 1.2 1.3 1.4 1.5 1.6 1.7 1.7.1
Well Records and Maintenance Guidelines
 1 Well Records and Maintenance Guidelines If you have a home well, you alone are responsible for maintaining the safety of our drinking water supply. When your well system is suitably located, correctly
6 Chemicals from human settlements
 6 Chemicals from human settlements 6.1 Introduction The world is becoming increasingly urban, particularly in developing countries. The transition of people from rural areas to cities represents a major,
Groundwater Flooding: a UK Perspective
 Groundwater Flooding: a UK Perspective David Macdonald British Geological Survey Maclean Building Crowmarsh Gifford Wallingford OX10 8BB Tel 01491 838800 NERC All rights reserved Talk outline Definition
GAS WELL/WATER WELL SUBSURFACE CONTAMINATION
 GAS WELL/WATER WELL SUBSURFACE CONTAMINATION Rick Railsback Professional Geoscientist CURA Environmental & Emergency Services rick@curaes.com And ye shall know the truth and the truth shall make you free.
Land Disturbance, Erosion Control and Stormwater Management Checklist. Walworth County Land Conservation Department
 Land Disturbance, Erosion Control and Stormwater Management Checklist Walworth County Land Conservation Department The following checklist is designed to assist the applicant in complying with the Walworth
Course Plan Day 1: Introduction and Overview Hydrology & Fluvial Geomorphology Day 2: Fieldwork on the Braid Burn Alan Jones
 Course Plan Day 1: Introduction and Overview Hydrology & Fluvial Geomorphology Alan Jones E:mail: Alan.Jones@ed.ac.uk Water cycle Globally & Locally River shapes and forms River behaviour Closer look at
1.34 WASTE CONTAINMENT AND SITE REMEDIATION TECHNOLOGY TAKE-HOME FINAL EXAM DUE FRIDAY MAY 7, 2004 AT 9:30 AM
 1.34 WASTE CONTAINMENT AND SITE REMEDIATION TECHNOLOGY TAKE-HOME FINAL EXAM DUE FRIDAY MAY 7, 2004 AT 9:30 AM This is an open-book exam, but the work should be yours alone. Please do not work with others
Water & Climate Review
 Water & Climate Review 1. The cross section below shows the direction of air flowing over a mountain. Points A and B are at the same elevation on opposite sides of the mountain. 4. The graph below shows
A perforated conduit such as pipe, tubing or tile installed beneath the ground to intercept and convey ground water. or structures.
 BMP: SUBSURFACE DRAIN Definition A perforated conduit such as pipe, tubing or tile installed beneath the ground to intercept and convey ground water. PurRoses 1. To prevent sloping soils from becoming
1. Michigan Geological History Presentation (Michigan Natural Resources)
") 1. Michigan Geological History Presentation (Michigan Natural Resources) The Michigan Geological History Presentation provides an overview of the approximately 3 billion years of Earth Processes that the
1. Michigan Geological History Presentation (Michigan Natural Resources) The Michigan Geological History Presentation provides an overview of the approximately 3 billion years of Earth Processes that the
SOUTHWEST FLORIDA WATER MANAGEMENT DISTRICT RESOURCE REGULATION TRAINING MEMORANDUM
 SOUTHWEST FLORIDA WATER MANAGEMENT DISTRICT RESOURCE REGULATION TRAINING MEMORANDUM DATE: December 04, 1996 This document is subject to change. If in doubt, verify current status with Technical Services
Module 9: Basics of Pumps and Hydraulics Instructor Guide
 Module 9: Basics of Pumps and Hydraulics Instructor Guide Activities for Unit 1 Basic Hydraulics Activity 1.1: Convert 45 psi to feet of head. 45 psis x 1 ft. = 103.8 ft 0.433 psi Activity 1.2: Determine
EXPLAINING GROUNDWATER AND WATER WELLS
 EXPLAINING GROUNDWATER AND WATER WELLS This document aims to provide a non-technical description of groundwater: how it occurs, how it moves underground, and the basic principles behind constructing and
Oil and Gas Terms. Anticline: An arch of stratified rock layers that may form a trap for hydrocarbons.
 Oil and Gas Terms American Petroleum Institute (API): The API is the trade organization for the oil and gas industry, which establishes standards governing industry operations, safety and the manufacturing
ALL GROUND-WATER HYDROLOGY WORK IS MODELING. A Model is a representation of a system.
 ALL GROUND-WATER HYDROLOGY WORK IS MODELING A Model is a representation of a system. Modeling begins when one formulates a concept of a hydrologic system, continues with application of, for example, Darcy's
NATURAL RESOURCES & NATURAL FEATURES
 A3 NATURAL RESOURCES & NATURAL FEATURES INTRODUCTION This chapter will discuss the topography, geology, soils, and other natural features found in Casco Township. The identification of the natural features
Barometric Effects on Transducer Data and Groundwater Levels in Monitoring Wells D.A. Wardwell, October 2007
 Barometric Effects on Transducer Data and Groundwater Levels in Monitoring Wells D.A. Wardwell, October 2007 Barometric Effects on Transducer Data Barometric Fluctuations can Severely Alter Water Level
What is the most obvious difference between pipe flow and open channel flow????????????? (in terms of flow conditions and energy situation)
") OPEN CHANNEL FLOW 1 3 Question What is the most obvious difference between pipe flow and open channel flow????????????? (in terms of flow conditions and energy situation) Typical open channel shapes Figure
OPEN CHANNEL FLOW 1 3 Question What is the most obvious difference between pipe flow and open channel flow????????????? (in terms of flow conditions and energy situation) Typical open channel shapes Figure
The University of Toledo Soil Mechanics Laboratory
 The University of Toledo Soil Mechanics Laboratory Permeability Testing - 1 Constant and Falling Head Tests Introduction In 1856 the French engineer Henri D arcy demonstrated by experiment that it is possible
How Did These Ocean Features and Continental Margins Form?
 298 10.14 INVESTIGATION How Did These Ocean Features and Continental Margins Form? The terrain below contains various features on the seafloor, as well as parts of three continents. Some general observations
Street Address (number and street): City: County: ZIP Code: B. CURRENT SITE PRIORITY INFORMATION Was free product present this quarter?
: City: County: ZIP Code: B. CURRENT SITE PRIORITY INFORMATION Was free product present this quarter?") QUARTERLY MONITORING REPORT (QMR) COVER SHEET AND REPORT FORMAT State Form 56087 (6-16) 329 IAC 9-5 Indiana Department of Environmental Management Office of Land Quality Leaking Underground Storage Tank
QUARTERLY MONITORING REPORT (QMR) COVER SHEET AND REPORT FORMAT State Form 56087 (6-16) 329 IAC 9-5 Indiana Department of Environmental Management Office of Land Quality Leaking Underground Storage Tank
All sediments have a source or provenance, a place or number of places of origin where they were produced.
 Sedimentary Rocks, Processes, and Environments Sediments are loose grains and chemical residues of earth materials, which include things such as rock fragments, mineral grains, part of plants or animals,
SECTION 5: SANITARY SEWER SYSTEM DESIGN
 SECTION 5: SANITARY SEWER SYSTEM DESIGN 5.01 GENERAL Sanitary sewer improvements shall be designed to serve the ultimate level of City development as defined in the General Plan and the Wastewater Facilities
Storm Drainage Systems 11.9-1
 Storm Drainage Systems 11.9-1 11.9 Gutter Flow Calculations 11.9.1 Introduction Gutter flow calculations are necessary in order to relate the quantity of flow (Q) in the curbed channel to the spread of
CIVL451. Soil Exploration and Characterization
 CIVL451 Soil Exploration and Characterization 1 Definition The process of determining the layers of natural soil deposits that will underlie a proposed structure and their physical properties is generally
Site Assessment for the Proposed Coke Point Dredged Material Containment Facility at Sparrows Point
 Site Assessment for the Proposed Coke Point Dredged Material Containment Facility at Sparrows Point Prepared for Maryland Port Administration 2310 Broening Highway Baltimore, MD 21224 (410) 631-1022 Maryland
CHAPTER 9 CHANNELS APPENDIX A. Hydraulic Design Equations for Open Channel Flow
 CHAPTER 9 CHANNELS APPENDIX A Hydraulic Design Equations for Open Channel Flow SEPTEMBER 2009 CHAPTER 9 APPENDIX A Hydraulic Design Equations for Open Channel Flow Introduction The Equations presented
Chapter 2 Stormwater Pollution Prevention Plan (SWPPP) for Park Operations
 for Park Operations") SWPPP for Park Operations 2 Chapter 2 Stormwater Pollution Prevention Plan (SWPPP) for Park Operations Bordered by Lake Washington & Lake Sammamish, the City of Bellevue has more than 60 miles of streams,
SWPPP for Park Operations 2 Chapter 2 Stormwater Pollution Prevention Plan (SWPPP) for Park Operations Bordered by Lake Washington & Lake Sammamish, the City of Bellevue has more than 60 miles of streams,
NJ650.1404 Interception Drainage
 NJ650.1404 Interception Drainage Interception drainage is used to intercept surface and subsurface water. The investigation, planning, and construction of surface interception drains follow the requirements
2.0 BASIC CONCEPTS OF OPEN CHANNEL FLOW MEASUREMENT
 2.0 BASIC CONCEPTS OF OPEN CHANNEL FLOW MEASUREMENT Open channel flow is defined as flow in any channel where the liquid flows with a free surface. Open channel flow is not under pressure; gravity is the
Citgo Service Station (Former Gulf Oil/Chevron) 14226 Jarrettsville Pike Baltimore County Jacksonville, Maryland Open Case No.
 14226 Jarrettsville Pike Baltimore County Jacksonville, Maryland Open Case No.") MARYLAND DEPARTMENT OF THE ENVIRONMENT 1800 Washington Boulevard Suite 620 Baltimore, Maryland 21230-1719 410-537-3442 800-633-6101 x 3442 www.mde.state.md.us Land Management Administration Oil Control
MARYLAND DEPARTMENT OF THE ENVIRONMENT 1800 Washington Boulevard Suite 620 Baltimore, Maryland 21230-1719 410-537-3442 800-633-6101 x 3442 www.mde.state.md.us Land Management Administration Oil Control
DESCRIPTION OF STORMWATER STRUCTURAL CONTROLS IN MS4 PERMITS
 DESCRIPTION OF STORMWATER STRUCTURAL CONTROLS IN MS4 PERMITS Phase I MS4 permits require continuous updating of the stormwater system inventory owned and operated by the MS4. They also include inspection
Chapter 9: Water, Hydrology and Drainage Land West of Uttoxeter
 Chapter 9: Water, Hydrology and Drainage Land West of Uttoxeter ENVIRONMENTAL STATEMENT: VOLUME 1 9.1 INTRODUCTION 9.1.1 This Chapter considers the effects of the Project on surface water and groundwater
By Gene Kitts, Senior Vice President-Mining Services, International Coal Group, Inc.
 Why Surface Mine? By Gene Kitts, Senior Vice President-Mining Services, International Coal Group, Inc. Why do we surface mine in Central Appalachia? It s certainly not because we like the public attention
Plate Tectonics: Ridges, Transform Faults and Subduction Zones
 Plate Tectonics: Ridges, Transform Faults and Subduction Zones Goals of this exercise: 1. review the major physiographic features of the ocean basins 2. investigate the creation of oceanic crust at mid-ocean
ESSENTIAL COMPONENTS OF WATER-LEVEL MONITORING PROGRAMS. Selection of Observation Wells
 ESSENTIAL COMPONENTS OF WATER-LEVEL MONITORING PROGRAMS Before discussing the uses and importance of long-term water-level data, it is useful to review essential components of a water-level monitoring
SECTION 10 WATER WELL SUPPLY 10.01 SCOPE OF WORK
 10.01 SCOPE OF WORK The work covered by this section of the specifications consists in furnishing all labor, equipment and material necessary to perform the installation of a Type I water supply well per
Map Patterns and Finding the Strike and Dip from a Mapped Outcrop of a Planar Surface
 Map Patterns and Finding the Strike and Dip from a Mapped Outcrop of a Planar Surface Topographic maps represent the complex curves of earth s surface with contour lines that represent the intersection
Assessment of groundwater inflow into a metro tunnel (Ankara)
") Géoline 25 Lyon, France 23 rd - 25 th, May/Mai 25 Assessment of groundwater inflow into a metro tunnel (Ankara) DOYURAN VEDAT Department of Geological Engineering, Middle East Technical University, 6531Ankara,
Géoline 25 Lyon, France 23 rd - 25 th, May/Mai 25 Assessment of groundwater inflow into a metro tunnel (Ankara) DOYURAN VEDAT Department of Geological Engineering, Middle East Technical University, 6531Ankara,
Module 7: Hydraulic Design of Sewers and Storm Water Drains. Lecture 7 : Hydraulic Design of Sewers and Storm Water Drains
 1 P age Module 7: Hydraulic Design of Sewers and Storm Water Drains Lecture 7 : Hydraulic Design of Sewers and Storm Water Drains 2 P age 7.1 General Consideration Generally, sewers are laid at steeper
FARM A SYST Farmstead Assessment System. Drinking Water Well Condition
 G3536 1W FARM A SYST Farmstead Assessment System Worksheet #1 Assessing the Risk of Groundwater Contamination from Why should I be concerned? Drinking Water Well Condition About 95 percent of this country
STORMWATER MANAGEMENT CHECKLIST
 STORMWATER MANAGEMENT CHECKLIST *This checklist must be completed and part of the Land Disturbing Permit submittal for review if the acreage disturbed is one (1) acre or more: I. SUPPORTING DATA Narrative
In-situ Chemical Oxidation via Ozone at a Multiple-Remedy UST Site - 9124
 ABSTRACT In-situ Chemical Oxidation via Ozone at a Multiple-Remedy UST Site - 9124 Frederic R. Coll and R.A. Moore URS Corporation Foster Plaza 4, Suite 300 501 Holiday Drive Pittsburgh, PA 15220 URS Corporation
Scheduling Maintenance for Infiltration Basins and Trenches
 Visual Inspection for Infiltration Practices Visual inspection is a rapid assessment procedure for qualitatively evaluating the functionality of a stormwater best management practice (BMP). Visual inspections
The Hydrologic Cycle. precipitation evaporation condensation transpiration infiltration surface runoff transport groundwater water table.
 The Hydrologic Cycle Page 1 of 1 Name Directions: The hydrologic cycle consists of the processes that change and move water through the earth s system. Use the terms below to label the hydrologic cycle.
Module 1 : Site Exploration and Geotechnical Investigation. Lecture 5 : Geophysical Exploration [ Section 5.1 : Methods of Geophysical Exploration ]
![Module 1 : Site Exploration and Geotechnical Investigation. Lecture 5 : Geophysical Exploration [ Section 5.1 : Methods of Geophysical Exploration ]](/thumbs/40/20679662.jpg "Module 1 : Site Exploration and Geotechnical Investigation. Lecture 5 : Geophysical Exploration [ Section 5.1 : Methods of Geophysical Exploration ]") Objectives In this section you will learn the following General Overview Different methods of geophysical explorations Electrical resistivity method Seismic refraction method 5 Geophysical exploration
Objectives In this section you will learn the following General Overview Different methods of geophysical explorations Electrical resistivity method Seismic refraction method 5 Geophysical exploration
Indiana State Department of Health Construction Guidelines for Gravity and Flood-Dose Trench Onsite Systems
 Indiana State Department of Health Construction Guidelines for Gravity and Flood-Dose Trench Onsite Systems The septic tank-absorption field sewage treatment system is composed of two major elements; the
PERMEABILITY TEST. To determine the coefficient of permeability of a soil using constant head method.
 PERMEABILITY TEST A. CONSTANT HEAD OBJECTIVE To determine the coefficient of permeability of a soil using constant head method. need and Scope The knowledge of this property is much useful in solving problems
SUSTAINABLE URBAN DRAINAGE SYSTEMS
 overflow can lead into a permeable conveyance system to increase further the benefit and reduce the need for pipe systems. Pollutant removal rates have been shown to be high, with some pollutants being
Appendix 4-C. Open Channel Theory
 4-C-1 Appendix 4-C Open Channel Theory 4-C-2 Appendix 4.C - Table of Contents 4.C.1 Open Channel Flow Theory 4-C-3 4.C.2 Concepts 4-C-3 4.C.2.1 Specific Energy 4-C-3 4.C.2.2 Velocity Distribution Coefficient
U. S. Army Corps of Engineers Ground Water Extraction System Subsurface Performance Checklist
 U. S. Army Corps of Engineers Ground Water Extraction System Subsurface Performance Checklist Installation Name Site Name / I.D. Evaluation Team Site Visit Date This checklist is meant to aid in evaluating
Preventing Basement Flooding
 Preventing Basement Flooding Perry Lindquist Land Resources Manager Waukesha County Dept. of Parks & Land Use Waukesha County Storm Water Workshop April 10, 2013 Presentation Outline Background Case study
SPECIFICATIONS FOR PRECAST MODULAR BLOCK RETAINING WALL SYSTEM (revised 11/5/13)
") Page 1 of 7 STONE STRONG SYSTEMS SPECIFICATIONS FOR PRECAST MODULAR BLOCK RETAINING WALL SYSTEM (revised ) PART 1: GENERAL 1.01 Description A. Work includes furnishing and installing precast modular blocks
Page 1 of 7 STONE STRONG SYSTEMS SPECIFICATIONS FOR PRECAST MODULAR BLOCK RETAINING WALL SYSTEM (revised ) PART 1: GENERAL 1.01 Description A. Work includes furnishing and installing precast modular blocks
WHAT YOU NEED TO KNOW ABOUT LIVING NEAR INDIANA COAL MINES
 WHAT YOU NEED TO KNOW ABOUT LIVING NEAR INDIANA COAL MINES Who Should Read This Guide? Home Buyers/Owners Lending Institutions Landowners Developers Local Officials Construction Design Realtors Companies
RESERVOIR EVALUATION. The volume of hydrocarbons in a reservoir can be calculated:
 RESERVOIR EVALUATION The volume of hydrocarbons in a reservoir can be calculated: 1. directly by volumetric methods 2. indirectly by material balance methods Volumetrics provide a static measure of oil
720 Contour Grading. General. References. Resources. Definitions
 720 Contour Grading General Contour grading directs water to a desired point, prevents erosion, provides noise deflection, provides visual fit of the facility into the landscape, and protects desirable
Travel Time. Computation of travel time and time of concentration. Factors affecting time of concentration. Surface roughness
 3 Chapter 3 of Concentration and Travel Time Time of Concentration and Travel Time Travel time ( T t ) is the time it takes water to travel from one location to another in a watershed. T t is a component
SIXTH GRADE WATER 1 WEEK LESSON PLANS AND ACTIVITIES
 SIXTH GRADE WATER 1 WEEK LESSON PLANS AND ACTIVITIES WATER CYCLE OVERVIEW OF SIXTH GRADE WATER WEEK 1. PRE: Evaluating components of the water cycle. LAB: Experimenting with porosity and permeability.
Long-Term Monitoring Network Optimization Evaluation. for. Wash King Laundry Superfund Site Lake County, Michigan
 Long-Term Monitoring Network Optimization Evaluation for Wash King Laundry Superfund Site Lake County, Michigan June 2006 Solid Waste and Emergency Response (5102P) EPA 542-R-06-004 December 2006 www.epa.gov
WEST LONDON PIPELINE AND STORAGE LIMITED AND UNITED KINGDOM OIL PIPELINES LIMITED
 WEST LONDON PIPELINE AND STORAGE LIMITED AND UNITED KINGDOM OIL PIPELINES LIMITED WLPS BUNCEFIELD REBUILD Flood Risk Assessment Green Lane Hemel Hempstead Hertfordshire HP2 7HZ September 2009 Prepared
Town of Elkton & Cecil Soil Conservation District Checklist for Joint Agency Review Stormwater Management / Erosion and Sediment Control
 Town of Elkton & Cecil Soil Conservation District Checklist for Joint Agency Review Stormwater Management / Erosion and Sediment Control Project Name: Tax Map Parcel: Acreage: Plat: ADC Map & Grid Engineering
CITY OF WASHINGTON SPILL PREVENTION, CONTROL AND COUNTERMEASURE PLAN
 CITY OF WASHINGTON SPILL PREVENTION, CONTROL AND COUNTERMEASURE PLAN Adopted October 5, 2009 Table of Contents Chapter Description Page 1 Facility Descriptions... 3 1.1 Municipal Power Plant, 1001 Park
TENNESSEE GAS PIPELINE COMPANY, L.L.C.
 TENNESSEE GAS PIPELINE COMPANY, L.L.C. HYDROLOGIC & HYDRAULIC CALCULATIONS FOR WATERBODIES CROSSED BY CONNECTICUT PIPELINE EXPANSION PROJECT CONNECTICUT LOOP Submitted by: Tennessee Gas Pipeline Company,
ANNEX D1 BASIC CONSIDERATIONS FOR REVIEWING STUDIES IN THE DETAILED RISK ASSESSMENT FOR SAFETY
 ANNEX D1 BASIC CONSIDERATIONS FOR REVIEWING STUDIES IN THE DETAILED RISK ASSESSMENT FOR SAFETY ANNEX D1: BASIC CONSIDERATIONS FOR REVIEWING STUDIES IN DRA FOR SAFETY D1-1 ANNEX D1 BASIC CONSIDERATIONS
Estimation of Compression Properties of Clayey Soils Salt Lake Valley, Utah
 Estimation of Compression Properties of Clayey Soils Salt Lake Valley, Utah Report Prepared for the Utah Department of Transportation Research Division by Steven F. Bartlett, PhD. P.E. Assistant Professor
CHECKLIST FOR FILING AN APPLICATION FOR A GROUND AND/OR SURFACE WATER WITHDRAWAL PROJECT IN THE DELAWARE RIVER BASIN
 CHECKLIST FOR FILING AN APPLICATION FOR A GROUND AND/OR SURFACE WATER WITHDRAWAL PROJECT IN THE DELAWARE RIVER BASIN PLEASE COMPLETE CHECKLIST AND ENCLOSE WITH THE APPLICATION. If you need assistance,
CONTAMINANT SOURCES. JUNE 1998 Printed on recycled paper
 Rural Wellhead Protection Protection Fact Sheet Fact Sheet CONTAMINANT SOURCES JUNE 1998 Printed on recycled paper INTRODUCTION More than 75 percent of Wyoming s population relies on groundwater for part
Weathering, Erosion, and Soils. Weathering and Erosion. Weathering and Erosion
 Weathering, Erosion, and Soils 1 The Grand Canyon, a landscape shaped by weathering and erosion 2 Weathering vs. erosion Types of weathering Physical Chemical Rates of weathering and erosion Climate Rock
PREDICTIVE MODELLING AND MONITORING NATURAL ATTENUATION TO SAVE REMEDIAL COSTS
 PREDICTIVE MODELLING AND MONITORING NATURAL ATTENUATION TO SAVE REMEDIAL COSTS A.Aziz Shaikh, Brian Tsang, Greg Sutor and Thomas Dance Abstract This paper describes the multidisciplinary components of
How To Use A Water Source Heat Pump
 Geothermal Energy Using Water-Source Heat Pumps By VIRSTAR Corporation Geothermal Expertise Since 1978 All information contained herein is the exclusive property of VIRSTAR Corporation, all rights reserved.
LAB 24 Transpiration
 Name: AP Biology Lab 24 LAB 24 Transpiration Objectives: To understand how water moves from roots to leaves in terms of the physical/chemical properties of water and the forces provided by differences
Experiment 3 Pipe Friction
 EML 316L Experiment 3 Pipe Friction Laboratory Manual Mechanical and Materials Engineering Department College of Engineering FLORIDA INTERNATIONAL UNIVERSITY Nomenclature Symbol Description Unit A cross-sectional