Contents. Introduction
|
|
|
- Rodney Todd
- 7 years ago
- Views:
Transcription
1
2 Contents Introduction Poverty Trends: Summary / Summary Table Poverty in Canada Poverty by Province Poverty by Age and Sex Poverty by Family Type and Number of Earners Vulnerable Groups Depth of Poverty Duration of Poverty Appendix: Measures of Poverty Introduction Poverty Trends Scorecard Canada 2012 In 2008, the collapse of financial markets around the world tipped country after country into recession. Canada was no exception. In a short eight month period, hundreds of thousands of Canadians lost their jobs and the Employment Insurance and Social Assistance rolls started to climb. The proportion of part-time and temporary jobs increased as full-time employment disappeared. Canadians had to stretch their dollars further to pay for rising food costs and shelter, many turning to food banks and credit cards to make ends meet. Before the recession hit, some economists were arguing that the days of boom and bust were over, that we had learned how to manage the business cycle as evidenced by over a decade of positive economic growth and rising average incomes. But the warning signs were there. Average incomes were rising yes but the very large increases of the top 1% earners were driving the trend. Income inequality was increasing steadily in Canada as the gap between those at the top and those down the income ladder widened. In 2009, Citizens for Public Justice (CPJ) launched the Bearing the Brunt project to try to capture and track the impact of the recession on Canadians and their families. Evidence from the last two recessions demonstrated that recessions can have a long-term detrimental impact as good jobs are lost and governments cut back community supports and services. Economic and social divisions become entrenched. The bonds that tie communities together weaken. The most vulnerable are left behind. 1 As part of this project, CPJ released a Poverty Trends Scorecard in 2010 that highlighted poverty trends and several key factors related to family economic security. The Scorecard, entitled Recovery: Not for many Canadian families, was based on a detailed research study: Bearing the Brunt: How the Recession Created Poverty for Canadian Families. 2 This report presents an update of the Poverty Trends Scorecard. Three years later, the recovery has yet to fully take hold. The individuals and families who bore the brunt of the recession face continuing economic uncertainty, 2 high levels of unemployment, and rising costs of living. Updating the Poverty Trends Scorecard affords an opportunity to not only assess how well Canadian families have done since the onset of the recession, but to turn our attention to the pressing problems of today. In particular, it examines the situation of groups especially vulnerable to poverty, including lone-parent families, individuals living alone, new immigrant and visible minority families, people with disabilities, and Aboriginal children and families. Scorecard 2012 is organized around an expanded set of themes and indicators, based on the framework developed in The new framework speaks to current trends influencing family economic security, highlighting the impact of growing income and wealth

3 inequality and the high cost of poverty. The key themes are: Poverty Trends; Labour Market Inclusion; Earning and Income; Savings and Wealth; and Making Ends Meet. A set of fact sheets is being prepared under each theme, summarizing key trends through tables, charts, and text. Each group will be released over the fall of While the primary focus of the Scorecard is the 2007 to 2011 period in order to track the progress of families since the recession the Scorecard will describe the longer term trends in order to set the context for the current period. In this regard, 2007 is an important benchmark, marking a 30-year low in the Canadian poverty rate. The Scorecard uses a very narrow set of indicators to look at poverty trends. However, poverty itself is not very narrow. The most visible aspect of poverty is low income, but poverty is much more than that. It is lack of access to a sustainable livelihood. It includes being forced to make hard choices between basic necessities like food, shelter, clothing, heat and other utilities. It is lack of opportunity and social exclusion. Poverty is also about well-being, including access to health and healthcare, pharmacare, dental care, education, safe and rewarding work, and the opportunity to engage in community life and activities. Poverty is not only felt materially it impacts every part of a person s life. Poverty makes it difficult for people to live in dignity. (Please see the Appendix: Measures of Poverty for a discussion of poverty measurement in Canada). The goal of this initiative is to create an accessible set of materials that will support national and community-level anti-poverty work across the country, including CPJ s own outreach and engagement activities, and Dignity for All: the campaign for a poverty-free Canada. Access to timely and relevant information on the poverty trends is key to: 3 identifying and developing effective strategies and programs that assist low-income children, youth and families to thrive and prosper; and sustaining advocacy that promotes greater justice, opportunity and well-being for all. In addition to the Poverty Trends Scorecard 2012, we are creating a series of fact sheets on poverty trends in five Canadian cities: Montreal, Toronto, Hamilton, Winnipeg and Vancouver. All of these reports will be available on the Citizen s for Public Justice website:

4 Poverty Trends: Summary Canada s Poverty Record Three years out and the economic recovery remains modest. Recent gains in real per capita Gross Domestic Product (GDP) and employment have been offset by the rise in self-employment and other forms of precarious employment. Unemployment is finally edging down, but the rate of employment is still below pre-recession levels and long-term unemployment continues to rise. This give and take in the economic data reveals that the recovery has yet to firmly take hold in many sectors of the economy. Our survey of poverty indicators reveals that in fact two recoveries are underway. For those on the lucky side, recovery has meant maintaining employment or finding a new job at the same wage level as the old job. For those on the unlucky side, however, recovery is either precarious or non-existent. They are still unemployed or precariously employed, with low wages, facing rising costs of living. They are living on poverty-level incomes with all the attendant stresses and struggles that living in poverty involves. The recession triggered an increase in poverty With the onset of the recession, rising unemployment and financial hardship resulted in an increase in national poverty levels between 2007 and The poverty rate recovered in Several provinces, notably Alberta and British Columbia, experienced a sharp increase in poverty in 2009 and 2010 and have yet to fully recover. People have experienced greater difficulty exiting low income since the recession. Certain groups continue to experience high levels of poverty and economic disadvantage Evidence suggests the poverty and disadvantage are becoming increasingly concentrated among certain groups and that the divide is widening between the very affluent and the poor in Canada. Working-age individuals living on their own are now much more likely to be poor than individuals living in family situations. Young adults, in particular, are more likely to be poor today than they were three decades ago. We have fewer young people working today than at the height of the recession. Aboriginal peoples, recent immigrants and racialized communities, and persons with disabilities all continue to face higher levels of poverty than others and are at higher risk of long-term poverty. The poor in Canada are very poor Little progress has been made in reducing the poverty gap. On average, low-income individuals and families live on incomes that are only two-thirds of the Statistics Canada s Low Income Cut-off. Canada s poor struggle in the low wage labour market and on subsistence-level social assistance benefits. People living in households with one worker account for almost 40% of the poor in Canada today, while households with two or more workers account for a shocking 12% of this group. Building on progress One of the notable successes of the past 15 years has been the overall decline in poverty rates, especially among children and seniors. In 2007, after years of sustained economic growth, the overall low income rate finally fell below 10%, a level last recorded back in There has been significant progress in reducing the incidence and depth of poverty, notably in Newfoundland and Labrador, Prince Edward Island, Saskatchewan and Quebec. Poverty among lone-parent families has fallen as women s position in the labour market has improved, and their average duration of poverty has decreased. 4

5 Concerted action is needed now to eradicate poverty in Canada Income security programs have been essential in tackling historically high rates of poverty, notably among Canada s seniors. The future prosperity for low- and modest-income families now depends on a concerted effort to boost education and training, improve the quality of job opportunities, expand programs that support families paid and unpaid work, and raise wages for the lowest paid. Without an anti-poverty strategy, the progress that Canada has made will erode, diminishing the life chance and opportunities of the poor, and undercutting Canada s future prosperity. Poverty Trends: Summary Table Poverty Rates by Selected Characteristics, 1981, 1989, 1996, Trend: Trend: Total Persons (%) Household Type Families (%) Under 65 years* and older** Unattached Individuals (%) Under 65 years and older Age (%) Children < 18 years Adults years Adults 65+ years Male (%) Female (%) Families with Children (%) Two-parent Families with Children Lone-parent Families Vulnerable Groups (%) Recent Immigrants*** Off-reserve Aboriginal Peoples na na Persons with Disabilities na na na Province (%) Newfoundland & Labrador Prince Edward Island Nova Scotia New Brunswick Quebec Ontario Manitoba Saskatchewan Alberta British Columbia Trends: = Increase equal or greater than 0.3 percentage points; = Little or no change (change less than 0.3 percentage points); = Decline equal or greater than 0.3 percentage points. Source: Statistics Canada (2012), Income in Canada, CANSIM Table Persons in low income families, annual. Note: After-tax Low Income Cut-off; Brian Murphy, Xuelin Zhang and Claude Dionne (2012), Low Income in Canada: a Multi-line and Multi-index Perspective, Statistics Canada, Income Research Paper Series, Catalogue no. 75F0002M No Note: * major income earner is less than 65; ** major income earner is 65 years or older; *** recent immigrants are defined as those who have been in Canada 2 to 10 years. na = not available. 5

6

7
8 Fact Sheet #2 Poverty by Province The rate of poverty varies significantly by province in Canada, reflecting differing economic realities across the country. Over the past decade, there has been significant progress in reducing the incidence and depth of poverty, notably in Newfoundland and Labrador, Prince Edward Island, Saskatchewan and Quebec. However, when the recession hit in 2008, progress ground to a halt. Several provinces experienced a sharp increase in poverty in 2009 and 2010 and have yet to fully recover. 5 Some provinces faring better than others In 2010, Prince Edward Island had the lowest rate of poverty among the provinces at 3.9%, followed by New Brunswick (5.5%), Saskatchewan (6.4%) and Newfoundland and Labrador (6.5%). The rate of poverty, by contrast, was higher than the Canadian average (9.0%) in British Columbia (11.5%), Quebec (10.0%) and Manitoba (9.2%). 6 Poverty trending down in Newfoundland, PEI and Saskatchewan; no progress in BC Looking at change over the past three decades, we see a significant reduction in poverty in Newfoundland and Labrador, Prince Edward Island, and Saskatchewan. Quebec has also experienced a notable reduction in its rate and depth of poverty since late 1990s. British Columbia has seen very little improvement in its poverty situation over the past 30 years. Recession drove up poverty rates in western and central Canada Alberta experienced the largest increase in poverty between 2007 and 2009 from 6.1% to 7.7%. Poverty rates were still above pre-recession levels in both Alberta and British Columbia in 2010 (at 6.8% and 11.5% respectively). Ontario experienced the second highest increase in poverty between 2007 and 2009, behind Alberta, while the poverty rate in Quebec increased between 2007 and 2008 and again between 2009 and The Atlantic provinces and Saskatchewan were sheltered from the worst of the economic downturn; poverty in these provinces declined between 2007 and Meaningful poverty reduction strategies have an impact Strong economic growth in western Canada and Newfoundland and Labrador has been decisive in lowering the incidence and depth of poverty in these provinces. The changing demographic composition notably population aging of these provinces is also significant as older families tend to have lower rates of poverty than younger families. Provinces such as Quebec and Newfoundland and Labrador introduced anti-poverty strategies in the 2000s which have helped to reduce rates of poverty, particularly among families with children. 8
, Saskatchewan (6.")
9 Poverty Trends by Province Poverty Rates and Total Numbers in Poverty, by Province, Province Household Type Rate (%) Number (x 1,000) NF Families (2 or more) Unattached Individuals Total Persons PEI Families Unattached Individuals Total Persons NS Families Unattached Individuals Total Persons NB Families Unattached Individuals Total Persons QC Families Unattached Individuals Total Persons ON Families Unattached Individuals Total Persons ,111 1,187 1,306 1,153 MB Families Unattached Individuals Total Persons SK Families Unattached Individuals Total Persons AB Families Unattached Individuals Total Persons BC Families Unattached Individuals Total Persons Source: Statistics Canada (2012), Income in Canada, CANSIM Table Persons in low income families, annual. Note: After-tax Low Income Cut-off. 9

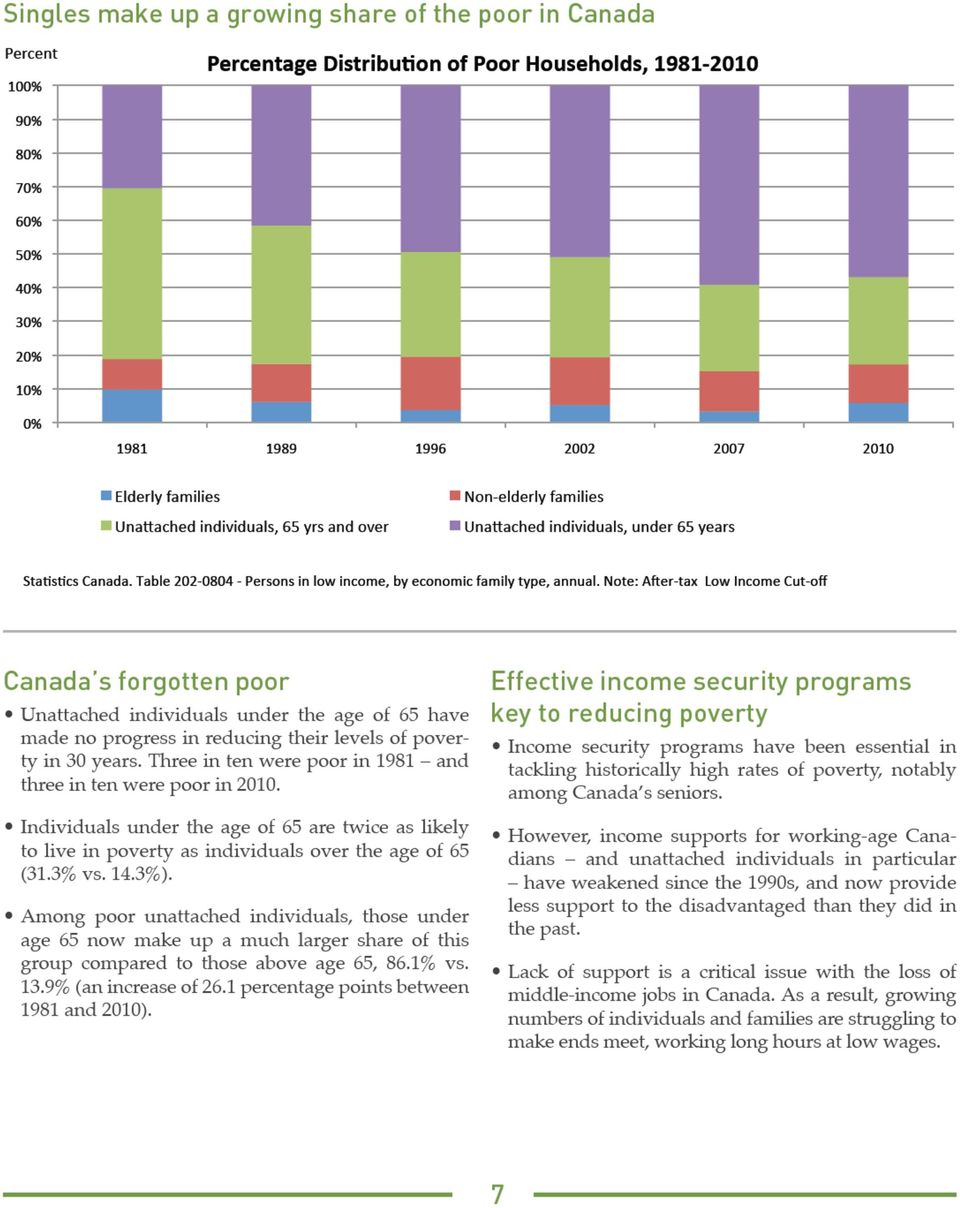
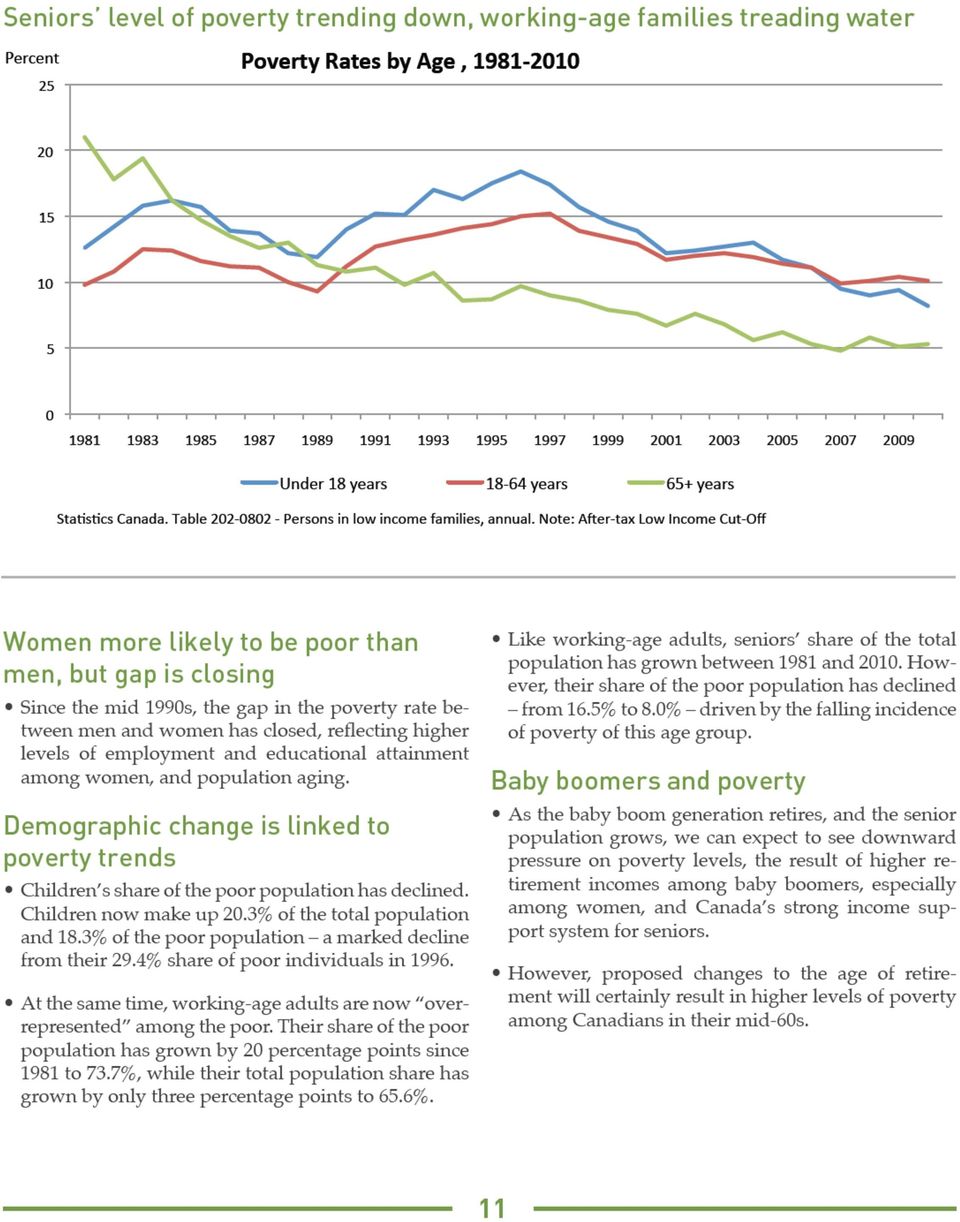
10 Fact Sheet #3 Poverty by Age and Sex The face of poverty continues to change in Canada. From the mid 1970s to the mid 1990s, the poverty rate declined steadily among seniors (65 years and older), from over 30% to less than 6%. At the same time, growth in poverty among children (under age 18) and young families emerged as a significant concern. More recently, families with children have benefitted from economic growth and the policy innovation of past 15 years. But working-age adults have been left behind. Young adults in particular are more likely to be poor today than they were three decades ago. Child poverty has fallen below prerecession levels The 1990s was truly a lost decade for children. Poverty rates among children (aged 0 to 17 years) increased by over 50% between 1989 and Since then, as the economy improved, families have made steady economic progress and child poverty rates have fallen, from 18.4% in 1996 to 9.0% in Programs like the National Child Benefit Supplement have also played an important role in supporting low-income families. The child poverty rate spiked during the recession, rising to 9.4% in 2009, but has fallen back below pre-recession levels in 2010, reaching 8.2%. But poverty among seniors is still higher Over the past few decades, poverty among seniors declined from historic highs, reaching a post-war low of 4.8% in As a result of the recession, poverty levels rose among seniors for the first time in years, from 4.8% to 5.8% in The rate edged down in 2009 and then moved up slightly in 2010, reaching 5.3%. The general decline in senior s poverty is the result of effective income support programs for seniors, including Old Age Security, Guaranteed Income Supplement payments and the Quebec/Canada Pension Plans. Working-age adults have seen no progress over 30 years; young adults have fallen behind There has effectively been no change in the risk of poverty among working-age adults aged 18 to 64 years over the last 30 years. Even after a decade of strong economic growth, poverty rates among adults had not fully recovered from the high levels of the mid 1990s. The situation of youth, in particular, has deteriorated. With high levels of unemployment and the erosion of good entry-level jobs, young adults are more likely to be poor today than they were three decades ago. During the recent recession, families headed by a young adult under age 25 experienced a three percentage point spike in poverty, as rates of youth unemployment climbed. One-third (33.3%) of these families were poor in Working-age Canadians make up growing share of poor population Percentage Distribution of Population and Poor Population, by Age, 1981 and 2010 Total Population Poor Population Persons under 18 years 27.9% 20.3% -7.6% 30.0% 18.3% -11.7% Persons 18 to 64 years 62.6% 65.6% 3.0% 53.5% 73.7% 20.2% Persons 65 years and over 9.6% 14.1% 4.6% 16.5% 8.0% -8.5% Source: Statistics Canada. Table Persons in low income families, annual. Note: After-tax Low Income Cut-off. 10

11
12
13

14 Fact Sheet #5 Poverty among Vulnerable Groups Several groups are especially vulnerable to economic disadvantage and persistent low income, including Aboriginal peoples, recent immigrants and racialized communities, unattached individuals aged 45 to 64, and persons with disabilities. 8 Economic disadvantage, in turn, is strongly correlated to poor health outcomes, lower educational attainment and employment, and lower levels of community connection and engagement. 9 Aboriginal and racialized communities as well as people with disabilities also face discrimination and exclusion that directly impact the quality of their lives and opportunities for the future. Evidence suggests that poverty and disadvantage are becoming increasingly concentrated as the divide has widened between the very affluent and the poor in Canada. Newcomers face significant economic barriers Today s recent immigrants 10 have lower rates of employment and labour market participation, and lower levels of earnings and family income than in the past. 11 Their incidence of poverty was also lower three decades ago. Poverty rates rose sharply after the recession in the early 1980s and again in the early 1990s, reaching a high of 33.0% in As the economy improved, the poverty levels among newcomers fell, reaching 15.8% in Even before the recession hit in 2008, however, the economic situation of newcomers had started to deteriorate. Their weeks of work dropped abruptly, and poverty increased by three percentage points between 2005 and Poverty a systemic problem in Aboriginal communities across the country The rate of poverty among Aboriginal peoples living off-reserve was 15.2% in 2010, compared to 9.0% for all of Canada. 14 In 2005, according to the Census, it was estimated the poverty rate for the entire Aboriginal population (i.e., both on and off-reserve) was 18.7% among Aboriginal families and 42.8% among unattached individuals. The recent recession had a significant impact on off-reserve Aboriginal peoples. There was a five percentage point drop in full-time, full-year employment between 2007 and 2009, and in turn, a sharp rise in poverty. The rate of poverty is still 2.6% percentage points above pre-recession levels. In 2010, the rate of poverty among new immigrants was 17.6%, 5.0 percentage points higher than in 1981, and almost twice the overall poverty rate for Canada. 12,13 Progress since the recession Poverty Rates among Vulnerable Groups, Vulnerable Groups Recent Immigrants Off-reserve Aboriginal Peoples Persons with Disabilities Note: Low income rates are calculated using the after-tax Low-Income Cut-Off (LICO). Recent immigrants are defined as those who have been in Canada 2 to 10 years. Source: Brian Murphy, Xuelin Zhang and Claude Dionne (2012), Low Income in Canada: a Multi-line and Multi-index Perspective, Statistics Canada, Income Research Paper Series, Catalogue no. 75F0002M No

15

16

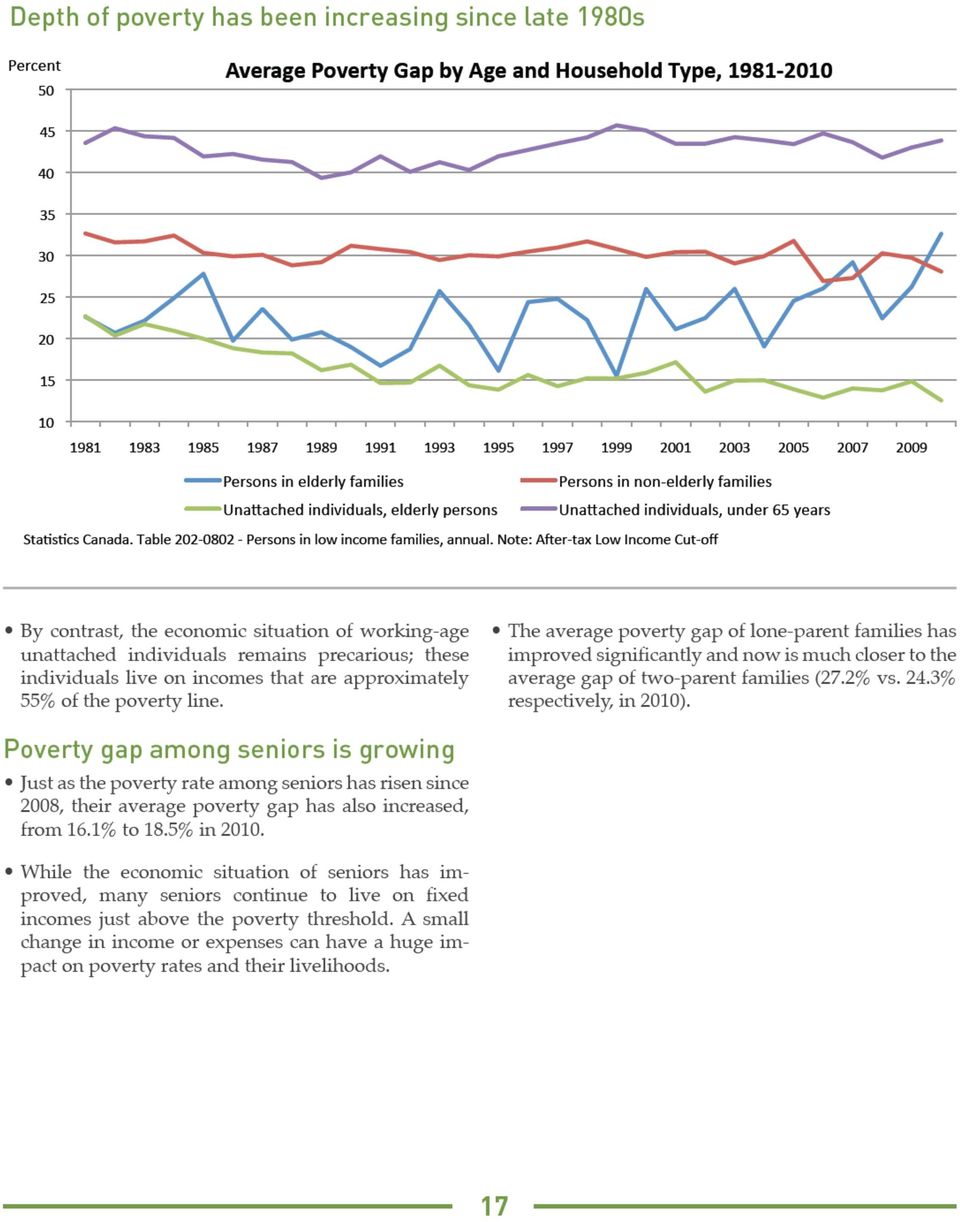
17
18
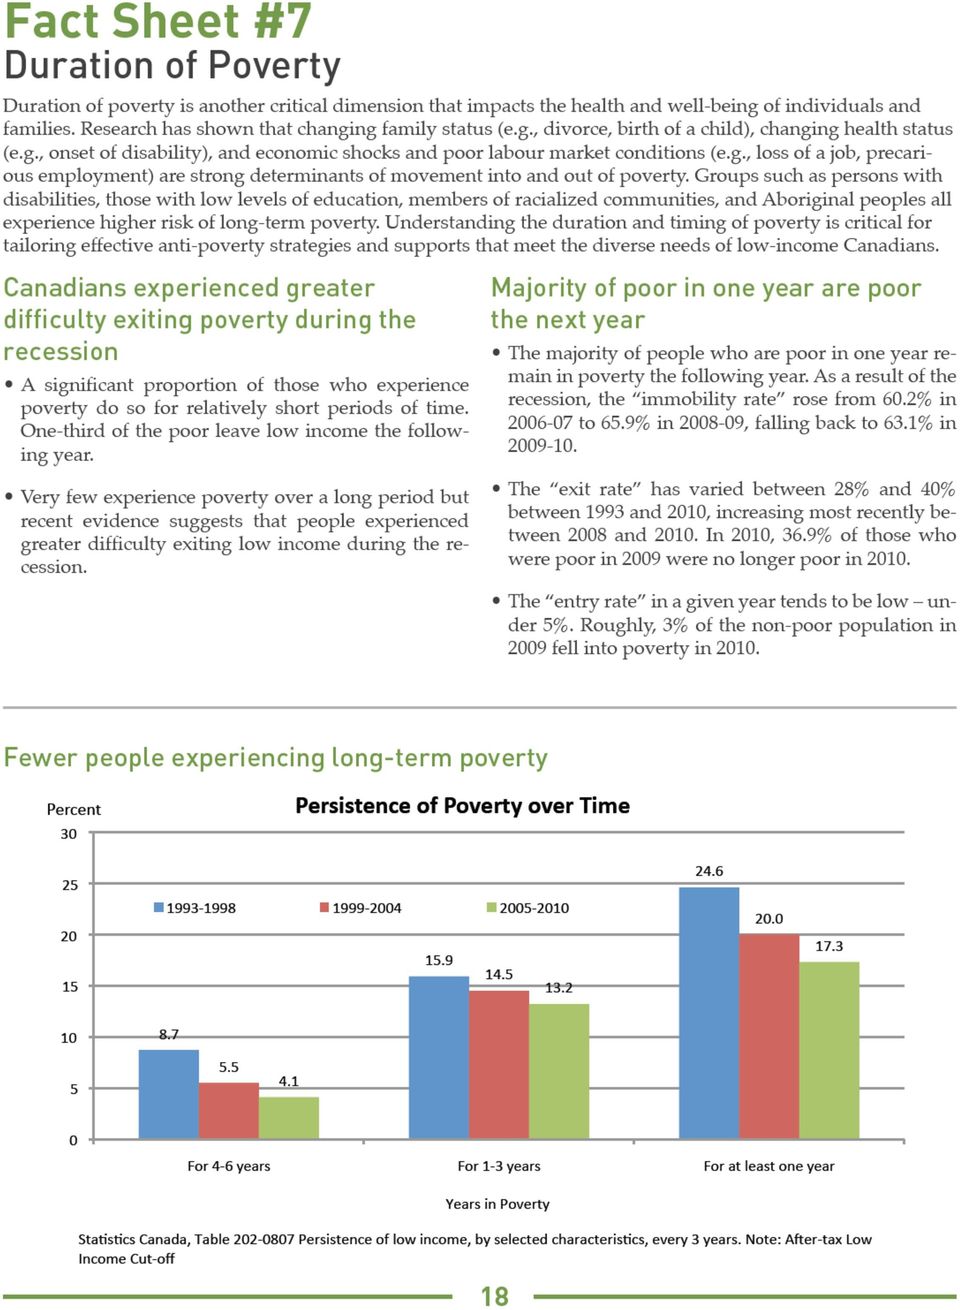
19 Majority of people who are poor one year are poor the next Percent 80 Canadians entering or leaving low income each year, / / / / / / / / /2010 Below Poverty Line Both Years Exit Poverty Enter Poverty StaBsBcs Canada, Table TransiBons of persons into and out of low income, annual. AOer- tax Low Income Cut- off The average duration of poverty has fallen since the mid-1990s How long do people stay in poverty? Over the period, 17.3% of Canadians experienced poverty for one or more years; 4.1% were in low income for at least four of the six years, and 1.5% were persistently poor over this period. The average time in low income was 2.4 years during the period, representing a slight decline in the duration of poverty from the mid-1990s (2.7 years in the period). 16 People with disabilities, unattached individuals and lone-parents at high risk of long-term poverty Several groups have a high risk of long-term poverty. People with disabilities have particularly high rates of persistent poverty: 8.4% of this group was poor each year between 2002 and 2007, while 14.4% were poor for four or more years during this period. The average spell of poverty was 3.4 years. 17 Lone-parent families and unattached individuals were also more likely to experience longer spells of poverty. These were the groups most likely to be poor for at least one year in the period (48.3% and 45.6%, respectively) and to be poor for the longest average period of time (3.6 and 2.8 years, respectively). 19

20 Appendix: Measures of Poverty In Canada, there are three main measures of low income: the Low-Income Cut-Off (LICO), the Low-Income Measure (LIM) and the Market Basket Measure (MBM). 18 Unless otherwise stated, this Scorecard uses the Low- Income Cut-Off based on after-tax income produced by Statistics Canada. The LICO is the oldest and most commonly used measure of low income in Canada, dating back to A family is considered to be in strained circumstances (i.e., below the LICO) if the income that it spends on food, clothing and shelter is 20 percentage points greater than the average equivalent household. Statistics Canada calculates 35 different LICOs, covering five different community sizes, and seven different family sizes. 19 LICOs are calculated on both before-tax income and after-tax income. The base year the last year in which overall household spending on food, shelter and clothing was estimated is Statistics Canada no longer collects the data necessary to update these spending patterns annually. Low income cut-offs (1992 base) after tax for 2011 Size of family unit Rural areas outside CMA or CA Community size Census Agglomeration (CA) Census Metropolitan Area (CMA) Less than 30,000 30,000-99, , , ,000 or more Current dollars 1 person 12,629 14,454 16,124 19,872 19,307 2 persons 15,371 17,592 19,625 19,308 23,498 3 persons 19,141 21,905 24,437 24,745 29,260 4 persons 23,879 27,329 30,487 30,871 36,504 Statistics Canada, Income Statistics Division (2012). Low Income Lines, Catalogue No. 75F0002M, No For example, a lone parent with one child living in Montreal with an after-tax income of $20,000 would fall below the LICO threshold. A similar family living in smaller community such as Saint John would not. LICOs have been criticized for their lack of sensitivity to regional differences in standards of living across the country, in particular, the cost of housing. They have also been criticized for exaggerating the differences in the cost of living by size of municipality. The 20 percentage point mark-up has been faulted for being arbitrary (a charge that can be leveled at other low-income measures as well). And because LICOs have not been adjusted for changing living standards since 1992, they are becoming in practice a de facto absolute measure of low income. The LIM is a purely relative measure that categorizes those individuals or households whose adjusted family income is below 50% of median income as living in low income. 21 It is commonly used in internationally comparative studies and has been adopted by the Ontario government to track progress under its Poverty Reduction Strategy. A third measure of poverty is the Market Basket Measure (MBM), developed by Human Resources and Skills Development Canada. It defines low income in relation to a specific basket of essential goods and services, without which (or without access to which) an individual or household is considered to be living in poverty. This approach determines what it costs to purchase the basket; one is poor if a household does not have the means to purchase this basket. 22 The basket was designed by an expert committee to represent a standard of consumption that is close to median standards of expenditure for food, clothing and footwear, and shelter, and somewhat below that standard for other categories of expenditure (including transportation, personal and household needs, furniture, telephone service and modest levels of reading, recreation, and entertainment). The strength of this approach is that it takes the local conditions into account in costing the basket. However, the specific contents of the basket and the method for costing individual items continue to be the subject of debate. Currently, market baskets are estimated for a four-member family (a man and a woman aged 25-49, a nineyear-old girl and a 13-year-old boy), which are then adjusted using an equivalence scale for other family sizes. MBM thresholds are calculated for 19 specific communities and another 29 community sizes across the 10 20

21 Poverty Trends by Community Poverty Rates and Total Numbers in Poverty for Selected Communities, Province Rate (%) Number (x 1,000) Canada ,938 3,035 3,128 3,008 Total selected CMAs ,076 2,293 2,374 2,292 Vancouver Montréal London Ottawa-Gatineau Winnipeg Toronto Sherbrooke Windsor St. John s Hamilton Edmonton Halifax Calgary Saskatoon Victoria Québec St. Catharines-Niagara Oshawa Kitchener-Cambridge-Waterloo Regina Source: Statistics Canada (2012), Income in Canada, CANSIM Table Persons in low income families, annual. Note: After-tax Low Income Cut-Off; CMA = Census Metropolitan Areas. Municipalities organized by highest rate of poverty in provinces. 23 The MBM is based on disposable income, deducting all direct taxes and other selected non-discretionary expenditures in order to arrive at a definition of disposable income. 24 There has been a good deal of debate in Canada about the desirability of one measure or approach over another. This situation stems in part from the confusion that arises as a result of the use of three different measures of low income all of which predictably produce different rates of poverty, based on different definitions of income. In 2010, for example, the rate of poverty for Canada ranged from 13.5% using the LICO (Income Before-Tax), to 13.0% using the LIM (Income After Tax), to 9.9% using the MBM, to 9.0% using the LICO (Income After Tax). Each of these measures has its advantages and its limitations. Increasingly, the trend is toward using a suite of indicators as any one poverty measure offers, at best, an incomplete picture of poverty. Since single measures tell only part of the story, using several low income measures can be more helpful in determining the extent and character of poverty in a given community or country. Moreover, the use of a range of measures also acts as a check on the sensitivity of individual methods to changing material conditions. 25 It is important to choose a measure of low income that can provide consistent, comparable and reliable information about individuals and families living in low income over time, recognizing that a poverty measure is a key tool needed for developing, implementing and evaluating effective anti-poverty strategies, policies and programs. That said, no measure can ever capture the experience of actually living in poverty, which is a drain on dignity, potential and hope. 21
22 Endnotes 1. Recessions create poverty. In the recession, Canada s poverty rate rose 2.4 percentage points, reaching 14%. In the recession, the poverty rate rose 4.1 percentage points, reaching 14.1%. It then continued to rise, peaking in 1996 and only declining to its pre-recession rate 14 years after the recession ended. See Jean-François Arsenault and Andrew Sharpe (2009), The Economic Crisis through the Lens of Economic Wellbeing. A special report for the Canadian Index of Wellbeing. TheEconomic+Crisis_ReportHighlights.pdf 2. See Chandra Pasma (2010), Bearing the Brunt: How the Recession Created Poverty for Canadian Families, Citizens for Public Justice Statistics Canada tracks low income using three different measures: Low Income Cut-off (LICO), Low Income Measure (LIM), and the Market Basket Measure (MBM) developed by Human Resources and Skills Development Canada. Each tracks low income using a different methodology and definition of income. For the purposes of this report card, we use Statistics Canada s Low Income Cut-off as our main measure of low income, Since single measures tell only part of the story, using several low income measures can be more helpful in determining the extent and character of poverty in a given community or country. (Please see Appendix 1). 4. The increase and decline in poverty rates was more pronounced using the Low Income Measure (LIM) and the Market Basket Measure (MBM) measures. The overall rate of poverty increased from 8.8% in 2007 to 10.5% in 2009 according to the MBM, and from 12.4% to 13.1% over the same period using the LIM. 5. For a discussion of provincial poverty rates, see: Brian Murphy, Xuelin Zhang and Claude Dionne (2012), Low Income in Canada: a Multi-line and Multi-index Perspective, Statistics Canada, Income Research Paper Series, Catalogue no. 75F0002M No The Market Basket Measures (MBM), based on the cost of living in different communities, paints a somewhat different picture. Alberta recorded the lowest rate of poverty in 2010 (8.4%) using the MBM, while the poverty rate was highest in the Atlantic provinces Nova Scotia (12.8%), New Brunswick (12.0%), PEI (11.7%), and Newfoundland and Labrador (11.6%) and British Columbia (12.4%). 7. See: John Myles, Feng Hou, Garnett Picot and Karen Myers (2006), Why Did Employment and Earnings Rise Among Lone Mothers During the 1980s and 1990s? Analytical Studies Branch Research Paper Series, No. 282, Statistics Canada, Catalogue no. 11F0019MIE No See Meyer Burstein (2005), Combating the Social Exclusion of At-Risk Groups, PRI Project: New Approaches for Addressing Poverty and Exclusion. At%20Risk%20Groups.pdf?1 9. See Caryl Arundel and Associates (2009), How are Canadians Really Doing? A Closer Look at Select Groups. Canadian Institute of Wellbeing Sheila Block (2010), Ontario s Growing Gap: The Role of Race and Gender, Canadian Centre for Policy Alternatives publications/reports/docs/the%20role%20of%20race%20ontario%20growing%20gap.pdf 10. Recent immigrants are defined as those who have lived in Canada from 2 to 10 years in the year that they were included in the survey. 11. Research conducted by Statistics Canada researchers and others demonstrated that the earnings gap during the first few years in Canada between immigrants and the Canadian born has been increasing, in spite of rising educational attainment of immigrants. Furthermore, low income among successive groups of new immigrants has been rising, both in absolute terms and relative to the Canadian born. See: Garnett Picot (2008), Immigrant Economic and Social Outcomes in Canada: Research and Data Development at Statistics Canada, Analytical Studies Branch Research Paper Series, Statistics Canada, Catalogue no. 11F0019M, No statcan.gc.ca/pub/11f0019m/11f0019m eng.pdf 12. These figures are taken from Brian Murphy et.al, (2012), Low Income in Canada: a Multi-line and Multi-index Perspective. It should be noted that estimates of poverty for all at-risk groups, especially those based on survey data, are subject to potential bias as a result of underreporting. Low-income people, particularly those from historically marginalized groups, are less likely to participate in surveys than higher income people. The Census is acknowledged as the best source of information on income and poverty trends. 13. See also Picot, Lu and Hou (2009) for a discussion of the factors related to poverty among immigrants. Immigrant low-income rates: The role of market income and government transfers, Perspective on Labour and Income, Statistics Canada, Catalogue no X The Survey on Labour and Income Dynamics is not fielded on Aboriginal reserves. Given the concentration of poverty on reserves, these off-reserve poverty figures understate the extent of Aboriginal poverty in Canada. 15. For example, a family with an income of $15,000 and a low income cut-off of $20,000 would have a low income gap of $5,000. In percentage terms this gap would be 25%. The average gap for a given population, whether expressed in dollar or percentage terms, is the average of these values as calculated for each unit. 22
23 16. Brian Murphy, Xuelin Zhang and Claude Dionne (2012), p Ibid., p It is now increasingly recognized that poverty is a multidimensional concept, encompassing a range of human needs and experiences. While lack of access to resources has been universally recognized as an important contributor to poverty, the question of what it means to be poor can be considered in other, more direct ways. As a result, jurisdictions such as New Zealand and the United Kingdom are supplementing traditional income-based poverty measures with indicators that directly measure deprivation in its various dimensions. Deprivation is generally defined as the lack of socially perceived necessities. Canada does not currently have a federal indicator of deprivation, though the governments of Quebec, Newfoundland and Labrador, and Ontario have explored different options. 19. LICOs (and LIMs) are used to produce low income estimates, based on the Survey of Labour and Income Dynamics (SLID). The SLID is a household survey that covers all individuals in Canada, excluding residents of the Yukon, the Northwest Territories and Nunavut, residents of institutions and persons living on Indian reserves. Estimates of low income are available for northern residents and Aboriginal populations, using income data sources, such as the Census. 20. In that year, it was determined that the average family, regardless of size, spent 43% of its after-tax income on food, shelter and clothing. Families spending more than 63% of household income on these essentials, 20 percentage points higher than average, are deemed low income. 21. Statistics Canada, Income Statistics Division (2011). Low Income Lines, Catalogue No. 75F0002M, No See Michael Hatfield, Wendy Piper and Burton Gustajtis (2010), First Comprehensive Review of the Market Basket Measure of Low Income, Human Resources and Skills Development Canada, SP E. rhdcc-hrsdc/hs eng.pdf 23. Estimates of low income, using the MBM, are not available the northern territories. 24. The definition of disposable income is a significant difference between the MBM and the after-tax Low Income Cut-offs and Low Income Measure, and an important factor in accounting for differences in low income estimates produced using these different measures. 25. See Brian Murphy, et.al.,(2012), Low Income in Canada: a Multi-line and Multi-index Perspective. 23
24
How is poverty measured in Canada?
 How is poverty measured in Canada? Unlike the United States and some other countries, Canada has no official, governmentmandated poverty line. It is generally agreed that poverty refers to the intersection
Bearing the Brunt: How the 2008-2009 Recession Created Poverty for Canadian Families
 Bearing the Brunt: How the 2008-2009 Recession Created Poverty for Canadian Families Citizens for Public Justice #501-309 Cooper Street Ottawa, ON K2P 0G5 T : 1-800-667-8046 F : 613-232-1275 E: cpj@cpj.ca
Saskatchewan Small Business Profile 2012
 Saskatchewan Small Business Profile 2012 October 2013 Economic and Competitive Analysis Branch www.economy.gov.sk.ca Table of Contents INTRODUCTION... 1 KEY FACTS... 3 1. SMALL BUSINESS SECTOR... 4 2.
Low Income in Canada: a Multi-line and Multi-index Perspective
 Catalogue no. 75F0002M No. 001 ISSN 1707-2840 ISBN 978-1-100-19895-8 Research Paper Income Research Paper Series Low Income in Canada: a Multi-line and Multi-index Perspective by Brian Murphy, Xuelin Zhang
DIGITAL ECONOMY ANNUAL REVIEW
 DIGITAL ECONOMY ANNUAL REVIEW LABOUR MARKET DIGITAL ECONOMY TALENT ICT 2 0 1 4 THE INFORMATION AND COMMUNICATIONS TECHNOLOGY COUNCIL (ICTC) RESEARCH BY: THE INFORMATION AND COMMUNICATIONS TECHNOLOGY COUNCIL
Who Is Working For Minimum Wage In Ontario? By Sheila Block
 Who Is Working For Minimum Wage In Ontario? By Sheila Block October, 2013 The Wellesley Institute engages in research, policy and community mobilization to advance population health. Copies of this report
Minimum Wage Rates in Canada: 1965-2015
 Canada Social Report Minimum Wage Rates in Canada: 1965-2015 Ken Battle Copyright 2015 by The Caledon Institute of Social Policy ISBN 1-55382-655-8 Published by: Caledon Institute of Social Policy 1354
Saskatchewan Small Business Profile 2015
 Saskatchewan Small Business Profile 2015 October 2015 Ministry of the Economy Performance and Strategic Initiatives Division economy.gov.sk.ca Table of Contents INTRODUCTION... 1 KEY FACTS... 3 1. SMALL
Looking Into Poverty: Income Sources of Poor People with Disabilities in Canada
 Looking Into Poverty: Income Sources of Poor People with Disabilities in Canada Researched and written by Cameron Crawford Director of Research, IRIS Looking Into Poverty: Income Sources of Poor People
Dimensions of core housing need in Canada
 C O O P E R A T I V E H O U S I N G F E D E R A T I O N O F C A N A D A Dimensions of core housing need in Canada Completed by Will Dunning Inc. for Co-operative Housing Federation of Canada July 2007
Engineers Canada 2012 Membership Survey
 Engineers Canada 2012 Membership Survey June 3, 2013 Contents List of Tables... i List of Figures... ii Descriptions of Membership Categories... iii 1 Introduction... 1 2 Membership Composition... 1 2.1
PreventingandReducingPoverty. AStrategyforEngagement. DiscussionPaper
 PreventingandReducingPoverty inprinceedwardisland: AStrategyforEngagement DiscussionPaper July2011 Table of Contents Foreword... 1 1.0 Introduction: Towards One Island Society... 2 2.0 Definitions and
Article. Economic Well-being. by Cara Williams. December 2010. Component of Statistics Canada Catalogue no. 89-503-X
 Component of Statistics Canada Catalogue no. 89-503-X Women in Canada: A Gender-based Statistical Report Article Economic Well-being by Cara Williams December 2010 How to obtain more information For information
Prince Edward Island Labour Force Survey 2015 Annual Report. Highlights: Labour Force Characteristics P.E.I. 2005-2015
 Prince Edward Island Labour Force Survey 2015 Annual Report Highlights: Employment declined by 1.1 per cent in 2015, averaging 73,200 PEI s unemployment rate averaged 10.4% in 2015, down 0.2 percentage
A Demographic and Socio-Economic Portrait of. AboriginAl PoPulAtions in CAnAdA
 A Demographic and Socio-Economic Portrait of AboriginAl PoPulAtions in CAnAdA table of Contents Aboriginal Population (Total)....1 Registered Indian Population....9 Non-Status Indian Population....17 Métis
4.0 Health Expenditure in the Provinces and Territories
 4.0 Health Expenditure in the Provinces and Territories Health expenditure per capita varies among provinces/territories because of different age distributions. xii Population density and geography also
Welfare in Canada 2013
 Welfare in Canada 2013 by Anne Tweddle, Ken Battle and Sherri Torjman November 2014 Welfare in Canada 2013 by Anne Tweddle, Ken Battle and Sherri Torjman November 2014 Copyright 2014 by The Caledon Institute
A Profile of Community and Social Service Workers. National Occupational Classification (NOC 4212)
") A Profile of Community and Social Service Workers National Occupational Classification (NOC 4212) January 2013 The HR Council takes action on nonprofit labour force issues. As a catalyst, the HR Council
A Profile of Community and Social Service Workers National Occupational Classification (NOC 4212) January 2013 The HR Council takes action on nonprofit labour force issues. As a catalyst, the HR Council
State of Working Britain
 State of Working Britain Aim is to Gives an up to date assessment of the performance of UK labour market, to highlight recent important developments seeks to describe and understand the major long-term
Early retirement trends
 Patrick Kieran IN THE EARLY 197S, one in five Canadians was 5 or older. By 8, one in three will fall into this age group. This reality has led many researchers to focus on the potential consequences of
ON LABOUR AND INCOME. JUNE 2002 Vol. 3, No. 6 HOUSING: AN INCOME ISSUE PENSIONS: IMMIGRANTS AND VISIBLE MINORITIES.
 Catalogue no. 75-001-XIE ON LABOUR AND INCOME JUNE 2002 Vol. 3, No. 6 HOUSING: AN INCOME ISSUE PENSIONS: IMMIGRANTS AND VISIBLE MINORITIES Statistics Canada Statistique Canada Sophie Lefebvre HOUSING IS
PEI Population Demographics and Labour Force Statistics
 PEI Population Demographics and Labour Force Statistics PEI Public Service Commission PEI Population Demographics and Labour Force Statistics Diversity Division PEI Public Service Commission November 2010.
IMPACT OF INCREASES IN ELECTRICITY RATES ON LOW AND NON LOW INCOME HOUSEHOLDS IN MANITOBA
 IMPACT OF INCREASES IN ELECTRICITY RATES ON LOW AND NON LOW INCOME HOUSEHOLDS IN MANITOBA Prepared for the Public Interest Law Centre By Harvey Stevens and Wayne Simpson February 2014 1 TABLE OF CONTENTS
Compensation of Full-Time Employees in Small Charities in Canada (2010)
") Compensation of Full-Time Employees in Small Charities in Canada (2010) January 2013 The HR Council takes action on nonprofit labour force issues. As a catalyst, the HR Council sparks awareness and action
Compensation of Full-Time Employees in Small Charities in Canada (2010) January 2013 The HR Council takes action on nonprofit labour force issues. As a catalyst, the HR Council sparks awareness and action
Aboriginal People and the Labour Market: Estimates from the Labour Force Survey, 2008-2010
 Catalogue no. 71-588-X, no. 3 ISSN 1919-1200 ISBN 978-1-100-19433-2..Research paper... The Aboriginal Labour Force Analysis Series Aboriginal People and the Labour Market: Estimates from the Labour Force
2015 Annual Alberta Labour Market Review. Employment. Unemployment. Economic Regions. Migration. Indigenous People. Industries
 2015 Annual Alberta Labour Market Review Employment. Unemployment. Economic Regions Migration. Indigenous People. Industries Occupations. Education. Demographics Employment Despite the economic downturn,
Article. Gambling 2011. by Katherine Marshall. Component of Statistics Canada Catalogue no. 75-001-X Perspectives on Labour and Income
 Component of Statistics Canada Catalogue no. 75-001-X Perspectives on Labour and Income Article Gambling 2011 by Katherine Marshall September 23, 2011 Statistics Canada Statistique Canada Standard symbols
PROVINCIAL OUTLOOK UPDATE February 6, 2015
 PROVINCIAL OUTLOOK UPDATE February 6, 2015 Real GDP growth 2015 Annual % change CANADA B.C. 2.4 2.7 2.9 3.1 Several developments have occurred since the publication of our most recent Provincial Outlook
POVERTY, INEQUALITY AND SOCIAL EXCLUSION IN QUÉBEC: 2012 Progress Report
 Courtesy translation POVERTY, INEQUALITY AND SOCIAL EXCLUSION IN QUÉBEC: 2012 Progress Report Centre d étude sur la pauvreté et l exclusion ii Statistical compilation, analysis and writing: Guy Fréchet,
Valerie Tarasuk Andy Mitchell Naomi Dachner. PROOF Research to identify policy options to reduce food insecurity
 PROOF Research to identify policy options to reduce food Valerie Tarasuk Andy Mitchell Naomi Dachner HOUSEHOLD FOOD INSECURITY IN CANADA, 2012 Household Food Insecurity in Canada, 2012 Valerie Tarasuk
Aboriginal People in Canada s Labour Market: Work and Unemployment, Today and Tomorrow
 Aboriginal People in Canada s Labour Market: Work and Unemployment, Today and Tomorrow by Michael Mendelson March 2004 Aboriginal People in Canada s Labour Market: Work and Unemployment, Today and Tomorrow
Police-reported crime statistics, 2013 Released at 8:30 a.m. Eastern time in The Daily, Wednesday, July 23, 2014
 Police-reported crime statistics, 2013 Released at 8:30 a.m. Eastern time in The Daily, Wednesday, July 23, 2014 The police-reported Crime Severity Index (CSI), which measures the volume and severity of
Canada Social Report. Welfare in Canada, 2012
 Canada Social Report Welfare in Canada, 2012 Anne Tweddle, Ken Battle and Sherri Torjman December 2013 Copyright 2013 by The Caledon Institute of Social Policy ISBN 1-55382-582-9 Published by: Caledon
Science and Engineering PhDs - A Legitimate Market in Canada
 Catalogue no. 11-621-MIE No. 063 ISSN: 1707-0503 ISBN: 978-0-662-47045-8 Analytical Paper Analysis in Brief Science and Engineering PhDs: A Canadian Portrait by Michael McKenzie Science, Innovation and
Article. Work absences in 2011. by Maria Dabboussy and Sharanjit Uppal
 Component of Statistics Canada Catalogue no. 75-001-X Perspectives on Labour and Income Article Work absences in 2011 by Maria Dabboussy and Sharanjit Uppal April 20, 2012 Statistics Canada Statistique
Policy in Focus SUMMARY. Maytree. Featured Research. Fix Employment Insurance to support the temporarily unemployed. Background and Context...
 The Maytree Foundation Maytree Policy in Focus issue 2 Dec 07 Background and Context...2 Employment Insurance Doesn t Insure Many Canadians Featured Research...4 Towards a New Architecture Canada s Adult
Catching Up to Reality: Building the Case for a New Social Model
 Catching Up to Reality: Building the Case for a New Social Model by Jane Jenson Executive Summary January 2004 Research Report F 35 CPRN Social Architecture Papers, is available at http://www.cprn.org
Saskatchewan Poverty Progress Profile
 Saskatchewan Poverty Progress Profile OVERVIEW Currently, Saskatchewan does not have a provincial poverty strategy in place. Employment is booming, but poverty remains a sore point in the social fabric
Patterns of Job Growth and Decline
 Patterns of Job Growth and Decline www.brandonu.ca/rdi/ July 2014 Highlights In Manitoba, 34% of employment is in non-metro, higher than the 28% share for Canada. Manitoba s non-metro employment has shown
Occupational Therapists in Canada, 2010 National and Jurisdictional Highlights and Profiles
 Occupational Therapists in Canada, 2010 National and Jurisdictional Highlights and Profiles October 2011 Spending and Health Workforce Who We Are Established in 1994, CIHI is an independent, not-for-profit
Fraser Alert. Canadians Celebrate Tax Freedom Day on June 6. June 2009. Main Conclusions. Market solutions to public policy problems
 Fraser Alert Market solutions to public policy problems June 2009 Canadians Celebrate Tax Freedom Day on June 6 Main Conclusions On Tax Freedom Day, the average Canadian family has earned enough money
Pharmacist Workforce, 2012 Provincial/Territorial Highlights
 pic pic Pharmacist Workforce, 2012 Provincial/Territorial Highlights Spending and Health Workforce Our Vision Better data. Better decisions. Healthier Canadians. Our Mandate To lead the development and
AFB2010. Is EI Working for Canada s Unemployed? Analyzing The Great Recession. Rising Unemployment and Access to EI. Introduction
 AFB2010 January 2010 technical paper alternative FEDER AL BUDGET 2010 Is EI Working for Canada s Unemployed? Analyzing The Great Recession Andrew Jackson and Sylvain Schetagne Introduction Rising Unemployment
Table 8.1.1: Comparison of Education Expenditures with Other Government Sectors, 1991/92-1997/98
 8. Cost of Education 8.1 How do educational expenditures compare with expenditures for other major government sectors? The total government expenditure for the year 1995/96, the last year for which actual
Tobacco Use in Canada: Patterns and Trends. 2012 Edition
 Tobacco Use in Canada: Patterns and Trends 212 Edition Tobacco Use in Canada: Patterns and Trends 212 Edition This report was prepared by Jessica Reid, MSc, and David Hammond, PhD. Data analysis was completed
In contrast to other age groups, more Canadians
 Youth volunteering on the rise Frank Jones In contrast to other age groups, more Canadians aged 15 to 24 are becoming volunteers. The volunteer participation rate of most of the population changed little
Annual Income Estimates for Census Families and Individuals (T1 Family File) Family Data. - User's Guide -
 Family Data. - User's Guide -") Annual Income Estimates for Census Families and Individuals (T1 Family File) Family Data - User's Guide - Statistics Canada 13C0016 Income Statistics Division Statistics Canada income@statcan.gc.ca June
Annual Income Estimates for Census Families and Individuals (T1 Family File) Family Data - User's Guide - Statistics Canada 13C0016 Income Statistics Division Statistics Canada income@statcan.gc.ca June
Portrait of Families and Living Arrangements in Canada
 Catalogue no. 98-312-X2011001 Analytical document Portrait of Families and Living Arrangements in Canada Families, households and marital status, 2011 Census of Population How to obtain more information
Control and sale of alcoholic beverages, for the year ending March 31, 2013 Released at 8:30 a.m. Eastern time in The Daily, Thursday, April 10, 2014
 Control and sale of alcoholic beverages, for the year ending March 31, 2013 Released at 8:30 a.m. Eastern time in The Daily, Thursday, April 10, 2014 Beer and liquor stores and agencies sold $21.4 billion
Business Immigrants Self-employed Findings from the Longitudinal Immigration Database (IMDB)
") IMDB 2008 Research Series Economic Class For internal use only IMDB 2008 Immigration Category Profiles Business Immigrants Findings from the Longitudinal Immigration Database (IMDB) March 2012 Economic
IMDB 2008 Research Series Economic Class For internal use only IMDB 2008 Immigration Category Profiles Business Immigrants Findings from the Longitudinal Immigration Database (IMDB) March 2012 Economic
Street Smart: Demographics and Trends in Motor Vehicle Accident Mortality In British Columbia, 1988 to 2000
 Street Smart: Demographics and Trends in Motor Vehicle Accident Mortality In British Columbia, 1988 to 2000 by David Baxter 3-Year Moving Average Age Specific Motor Vehicle Accident Death Rates British
Employment termination and group insurance coverage
 HEALTH & DENTAL / DISABILITY, LIFE AND AD&D 14-11 Employment termination and group insurance coverage This GroupLine is a revised version of GroupLine 07-02. Previous versions also include 05-21, 02-11
Police-reported crime statistics, 2014 Released at 8:30 a.m. Eastern time in The Daily, Wednesday, July 22, 2015
 Police-reported crime statistics, 2014 Released at 8:30 a.m. Eastern time in The Daily, Wednesday, July 22, 2015 The Crime Severity Index (CSI) measures the volume and severity of police-reported crime.
SalarieS of chemists fall
 ACS news SalarieS of chemists fall Unemployment reaches new heights in 2009 as recession hits profession hard The economic recession has taken its toll on chemists. Despite holding up fairly well in previous
Control and sale of alcoholic beverages, for the year ending March 31, 2012 Released at 8:30 a.m. Eastern time in The Daily, Thursday, April 11, 2013
 Control and sale of alcoholic beverages, for the year ending March 31, 2012 Released at 8:30 a.m. Eastern time in The Daily, Thursday, April 11, 2013 Beer and liquor stores and agencies sold $20.9 billion
The Dietitian Workforce in Canada
 The Dietitian Workforce in Canada Meta-Analysis Report MARCH 2011 www.dietitians.ca www.dietetistes.ca Dietitians of Canada 2011. All rights reserved. DIETITIANS OF CANADA 1 Executive Summary The purpose
Competitive Alternatives 2014: Special Report - Focus on Tax
 Competitive Alternatives 2014: Special Report - Focus on Tax Focus on Tax is a supplement to the 2014 Competitive Alternatives report, a global report released in March examining significant business costs
Catalogue no. 85-565-XIE. General Social Survey on Victimization, Cycle 18: An Overview of Findings
 Catalogue no. 85-565-XIE General Social Survey on Victimization, Cycle 18: An Overview of Findings 2004 How to obtain more information Specific inquiries about this product and related statistics or services
Business Immigrants Entrepreneurs Findings from the Longitudinal Immigration Database (IMDB)
") IMDB 2008 Research Series Economic Class For internal use only IMDB 2008 Immigration Category Profiles Business Immigrants Entrepreneurs Findings from the Longitudinal Immigration Database (IMDB) March
IMDB 2008 Research Series Economic Class For internal use only IMDB 2008 Immigration Category Profiles Business Immigrants Entrepreneurs Findings from the Longitudinal Immigration Database (IMDB) March
Updating the Benefits of the GST New Housing Rebate
 Housing Affordability and Choice for Canadians: Building on Success Updating the Benefits of the Introduction: When the Goods and Services Tax (GST) was introduced in 1991, the federal government recognized
Juristat Bulletin Article. Criminal harassment in Canada, 2009. By Shelly Milligan
 Component of Statistics Canada catalogue no. 85-005-X Juristat Bulletin Juristat Bulletin Article Criminal harassment in Canada, 2009 By Shelly Milligan Released: March 3, 2011 Juristat Bulletin Component
Economic Impacts of MLS Home Sales and Purchases in Canada and the Provinces
 Economic Impacts of MLS Home Sales and Purchases in Canada and the Provinces Economic Impacts of MLS Home Sales and Purchases in Canada and the Provinces Prepared for: The Canadian Real Estate Association
December 2009 Vol. 10, No. 12
 Catalogue no. 75-001-X December 2009 Vol. 10, No. 12 Canada s employment downturn Immigrant low-income rates: The role of market income and government transfers Statistics Canada Statistique Canada At
AP Aboriginal Demographics - The Next Census Day
 Catalogue no. 96F0030XIE2001007 2001 Census: analysis series Aboriginal peoples of Canada: A demographic profile This document provides detailed analysis of the 2001 Census of Population data released
Re s e a r c h a n d E v a l u a t i o n
 Portrait of an Integration Process D i f f i c u l t i e s e n c o u n t e r e d a n d r e s o u r c e s r e l i e d o n f o r n e w c o m e r s i n t h e i r f i r s t 4 y e a r s i n C a n a d a E v
FACTS ABOUT ABORIGINAL PERSONS IN CALGARY
 FACTS ABOUT ABORIGINAL PERSONS IN CALGARY Copyright 2010 City of Calgary, Community & Neighbourhood Services, Social Policy & Planning Division INTRODUCTION This fact sheet provides an overview of Aboriginal
2013 CHILD POVERTY REPORT CARD
 BRITISH COLUMBIA NOVEMBER 2013 Produced by First Call: BC Child and Youth Advocacy Coalition with the support of This year s BC Child Poverty Report Card is dedicated with love and gratitude to the memory
INCORPORATING YOUR PROFESSIONAL PRACTICE
 INCORPORATING YOUR PROFESSIONAL PRACTICE REFERENCE GUIDE Most provinces and professional associations in Canada now permit professionals such as doctors, dentists, lawyers, and accountants to carry on
Overview How BC teacher salaries rank among the provinces and territories in 2011
 13 BARGAINING PROPOSAL BRITISH COLUMBIA TEACHERS FEDERATION Document Number: U102 Date: Time: Overview How BC teacher salaries rank among the provinces and territories in 2011 Minimum The minimum salary
Women, Wages and Work A report prepared by the UNC Charlotte Urban Institute for the Women s Summit April 11, 2011
 A report prepared by the UNC Charlotte Urban Institute for the Women s Summit April 11, 2011 A report prepared for the Women s Summit by the UNC Charlotte Urban Institute 1 Table of Contents Table of Contents...
Atlantic Provinces 71 COMMUNITIES
 NATIONAL STUDY OF AUTOMOBILE INSURANCE RATES Third Release Atlantic Provinces 71 COMMUNITIES vs. British Columbia, Alberta Saskatchewan, Manitoba & Ontario 3,985,162 Auto Insurance Rates Compared October
CANADIAN HOUSING OBSERVER
 CANADIAN HOUSING OBSERVER 2 Housing Affordability and Need A Chapter from the Canadian Housing Observer Cover Photo: Henri Masson, Perkins, Quebec, 97, Oil on canvas, 32 x 6, FAC 2, Firestone Collection
Open Government and Information Management. Roy Wiseman Executive Director, MISA/ASIM Canada CIO (Retired), Region of Peel roy.wiseman@outlook.
, Region of Peel roy.wiseman@outlook.") Open Government and Information Management Roy Wiseman Executive Director, MISA/ASIM Canada CIO (Retired), Region of Peel roy.wiseman@outlook.com Open Government Defined Government of Canada defines Open
Open Government and Information Management Roy Wiseman Executive Director, MISA/ASIM Canada CIO (Retired), Region of Peel roy.wiseman@outlook.com Open Government Defined Government of Canada defines Open
Culture, Tourism and the Centre for Education Statistics: Research Papers
 Catalogue no. 81-595-M Culture, Tourism and the Centre for Education Statistics: Research Papers Salaries and SalaryScalesof Full-time Staff at Canadian Universities, 2010/2011: Final Report 2011 How to
Working After Age 65
 ALTERNATIVE FEDERAL BUDGET 2012 TECHNICAL PAPER Working After Age 65 What is at Stake? Angella MacEwen Highlights The OAS and GIS combined today provide one third of the income of all seniors aged over
Impact of the recession
 Regional Trends 43 21/11 Impact of the recession By Cecilia Campos, Alistair Dent, Robert Fry and Alice Reid, Office for National Statistics Abstract This report looks at the impact that the most recent
Discouraged workers - where have they gone?
 Autumn 1992 (Vol. 4, No. 3) Article No. 5 Discouraged workers - where have they gone? Ernest B. Akyeampong One of the interesting but less publicized labour market developments over the past five years
THE ECONOMIC IMPACT OF CORPORATE TAX RATE REDUCTIONS
 THE ECONOMIC IMPACT OF CORPORATE TAX RATE REDUCTIONS Leadership makes the difference January 211 The Economic Impact of Corporate Tax Rate Reductions January 211 Canadian Manufacturers & Exporters Author:
Personal debt ON LABOUR AND INCOME
 ON LABOUR AND INCOME Personal debt Although the economy and population are almost times the size of s, the two countries show several similarities. Both have relatively high per-capita income and living
e-brief Equipping Ourselves in Tough Times: Canada s Improved Business Investment Performance By Colin Busby and William B.P.
 e-brief July 9, 2009 I N D E P E N D E N T R E A S O N E D R E L E V A N T ECONOMIC GROWTH AND INNOVATION Equipping Ourselves in Tough Times: Canada s Improved Business Investment Performance By Colin
ONE INTERESTING DEVELOPMENT in the labour
 Health-related insurance for the self-employed Ernest B. Akyeampong and Deborah Sussman ONE INTERESTING DEVELOPMENT in the labour market in the 199s was the rapid growth of self-employment relative to
The Social Dimensions of the Crisis: The Evidence and its Implications
 The Social Dimensions of the Crisis: The Evidence and its Implications Executive Summary ii Executive Summary iii The economic crash of 2008 has had profound social impacts, exacerbated by the subsequent
Spending on Postsecondary. of Education, Fact Sheet. Education Indicators in Canada. June 2011
 Catalogue no. 81-599-X Issue no. 007 ISSN: 1709-8653 ISBN: 978-1-100-18860-7 Education Indicators in Canada Spending on Postsecondary Education June 2011 Tourism and the Centre for Education Statistics
2. Incidence, prevalence and duration of breastfeeding
 2. Incidence, prevalence and duration of breastfeeding Key Findings Mothers in the UK are breastfeeding their babies for longer with one in three mothers still breastfeeding at six months in 2010 compared
Business Immigrants Investors Findings from the Longitudinal Immigration Database (IMDB)
") IMDB 2008 Research Series Economic Class For internal use only IMDB 2008 Immigration Category Profiles Business Immigrants Investors Findings from the Longitudinal Immigration Database (IMDB) March 2012
IMDB 2008 Research Series Economic Class For internal use only IMDB 2008 Immigration Category Profiles Business Immigrants Investors Findings from the Longitudinal Immigration Database (IMDB) March 2012
Aboriginal Peoples and Postsecondary Education in Canada
 Aboriginal Peoples and Postsecondary Education in Canada by Michael Mendelson July 2006 Aboriginal Peoples and Postsecondary Education in Canada by Michael Mendelson July 2006 The Caledon Institute of
e-brief School Dropouts: Who Are They and What Can Be Done?
 e-brief January 6, 2011 EDUCATION PAPERS School Dropouts: Who Are They and What Can Be Done? I N D E P E N D E N T R E A S O N E D R E L E V A N T By John Richards While Canada has made progress in the
Parents and employers must ensure
 Guide to Child Labour Laws in Canada Parents and employers must ensure that the safety and health at work of employed youths are protected. Where children are employed, employers must make special efforts
Article. First Nations, Métis and WInuit Women. by Vivian O'Donnell and Susan Wallace. July 2011
 Component of Statistics Canada Catalogue no. 89-503-X Women in Canada: A Gender-based Statistical Report Article First Nations, Métis and WInuit Women by Vivian O'Donnell and Susan Wallace July 2011 How
WHAT DO WE KNOW ABOUT THE SETTLEMENT EXPERIENCES OF IMMIGRANTS TO CANADA S WEST?
 1 WHAT DO WE KNOW ABOUT THE SETTLEMENT EXPERIENCES OF IMMIGRANTS TO CANADA S WEST? Lori Wilkinson, Jill Bucklaschuk, Jack (Yi) Shen, Iqbal Ahmed Chowdhury and Tamara Edkins St. John s College Soup and
NATIONAL SURVEY OF HOME EQUITY LOANS
 NATIONAL SURVEY OF HOME EQUITY LOANS Richard T. Curtin Director, Surveys of Consumers Survey Research Center The October 1998 WP51 The 1988, 1994, and 1997 National Surveys of Home Equity Loans were sponsored
Tobacco Use in Canada: Patterns and Trends
 Tobacco Use in Canada: Patterns and Trends 214 EDITION University of Waterloo I Waterloo, Ontario www.tobaccoreport.ca Tobacco Use in Canada: Patterns and Trends 214 Edition This report was prepared by
Article. Volunteering in Canada. by Mireille Vézina and Susan Crompton. Component of Statistics Canada Catalogue no. 11-008-X Canadian Social Trends
 Component of Statistics Canada Catalogue no. 11-008-X Article Volunteering in Canada by Mireille Vézina and Susan Crompton April 16, 2012 Standard symbols for Statistics Canada The following standard symbols
Canadian Consumer Credit Trends. Q3 2015 Prepared by: Equifax Analytical Services
 Canadian Consumer Credit Trends Q3 2015 Prepared by: Equifax Analytical Services About Equifax Inc. Equifax is a global leader in consumer, commercial and workforce information solutions that provide businesses
CPP Enhancement: The Debate Takes Centre Stage
 Enhancement of the Canada Pension Plan (CPP) is expected to be a major issue in the upcoming federal election. This article provides an overview of likely features of a CPP enhancement proposal along with
Business. Small. Banking
 26 Public Accountability Statement CIBC has been an important part of the Keelan family business for more than 50 years. For third-generation business owner Joyce Keelan, pictured with CIBC Branch Manager
The business support services industry,
 Ernest B. Akyeampong The business support services industry, a major component of which is believed to consist of telephone call centres, has been one of the fastest growing industries in Canada over the
Statement of Mandate 2013-2014
 Statement of Mandate 2013-2014 Table of Contents Message from the Minister and Deputy Minister 1.0 Our Mandate... 4 1.1 Our Mission... 4 2.0 Our Priorities... 5 2.1 Make Life More Affordable and Breaking
IMPROVING ACCESS TO AFFORDABLE UNIVERSITY EDUCATION IN SASKATCHEWAN
 IMPROVING ACCESS TO AFFORDABLE UNIVERSITY EDUCATION IN SASKATCHEWAN November 16, 2004 Prepared for the Student Unions at the University of Saskatchewan, University of Regina John B. Conway Canadian Centre
Catalogue no. 75F0010XIE. Labour Market and Income Data Guide
 Catalogue no. 75F0010XIE Labour Market and Income Data Guide Choosing the best data source for your needs Data in many forms Statistics Canada disseminates data in a variety of forms. In addition to publications,