MATLAB Control System Toolbox Root Locus Design GUI
|
|
|
- Ellen Douglas
- 7 years ago
- Views:
Transcription
1 MATLAB Control System Toolbox Root Locus Design GUI MATLAB Control System Toolbox contains two Root Locus design GUI, sisotool and rltool. These are two interactive design tools for the analysis and design of the singleinput single-output (SISO) linear time-invariant (LTI) control systems. sisotool opens the SISO Design Tool with Root Locus View and Bode diagram. rltool opens the SISO Design Tool with only Root Locus view on. These GUI allows you to design compensators by interacting with the root locus, Bode, and Nichols plots of the open-loop system. To load an empty SISO Design Tool at MATLAB prompt type >> sisotool sisotool can also be called with additional arguments. For example, sisotool(gp), or sisotool(gp, Gc). Where Gp is the plant object model and Gc is the compensator object model. You can import SISO LTI model into the Root Locus Design as follows: Load a model from the MATLAB workspace Load a model from a MAT-file Load the model from the SIMULINK diagram Similarly, rltool opens SISO Design Tool with only the Root Locus View. Following examples are used to demonstrate some of the features of the Root Locus Design. Example 1 In the control system showng ( s c ) is a proportional controller, K. R() s G () c s Gp () s = 1 ss ( + 2)( s+ 5) Cs () Using sisotool determine the following: (a) Range of K for system stability. (b) Value of K for the complex dominant-poles damping ration of 0.6. For this value of K obtain the frequency response GM and PM. Also obtain the step response and the time-domain specifications. To make the plant model and start the SISO Design Tool, at the MATLAB prompt type >> Gp = tf(1, [ ]) >> sisotool An empty SISO Design Tool opens as shown. 7B.1

2 The SISO Design Tool by default assumes that the compensator is in the forward path. The FS button toggles between two configurations, placing the compensator in the feedback or forward path as shown above. Select Import Model under the File menu. This opens the Import System Data dialog box, which is shown below. All the available models will appear in the Model Listbox: The Blocks are coded as F (A preamplifier), G (Plant model) H (Sensor), K (Compensator) with default values of 1. Select Gp and click on the arrow button to place it in the G field. 7B.2
, G (Plant model) H (Sensor), K")
3 The Other button toggles between the two configurations. Click OK. The root locus and open-loop Bode diagrams are displayed in the plot regions. The red squares on the loci represents the closed-loop poles corresponding to gain set point (default value C(s) = 1). Also the gain margin and the phase margin for the default gain of C(s) = 1 are listed on the Bode plot. The SISO Design Tool has right-click menus available in the plot regions with many features. Right-Click Menu on the Root Locus plot Right-click Menu on the Bode plot 7B.3
 = 1 are listed on the Bode plot.")
4 You can change the compensator gain by typing a value in the C(s) field. Also, you can change the gain by grabbing the red squares (closed-loop poles) on the root locus plot and moving them along the curve to the desired location. To place the roots accurately in a desired location first, select Zoom XY from the right-click menu; then select a region of the root locus, hold and place a small square in the desired region. This will zoom in the desired region. Alternatively you can use the Mouse Zoom from the Zoom icons on the toolbar. Click on the Mouse Zoom icon (Zoom in XY), and then repeatedly click on the desired location on the root locus for the necessary zoom. Turn off the Mouse Zoom. Drag the closed loop pole to the desired location. (a) To find the value of K for marginal stability drag the closed-loop pole along the locus to the jω -axis intersect. Turn on the Mouse Zoom and drag the mouse to draw a box around the pole. When the mouse is released, root locus will zoom in on the selected region. Drag the pole to this accurate position. The gain for marginal stability is found to be K = 70. A zoom out result is as shown. c 7B.4

5 (b) To find the gain for damping ratio of 0.6, drag the complex pole until the damping ratio displayed in the bottom panel is in the neighborhood of 0.6. Then zoom in and drag the pole until damping ratio is 0.6. The result is as shown. The gain is found to be K 0 = Also one of the complex pole and the natural frequency are displayed in the bottom panel, i.e., s1 = j1.02 and ω n = 1.28 rad/s. In addition the Gain Margin and Phase Margin are displayed in the Bode plot area, i.e., GM = 17.9 db, and PM = From Tools Menu select Loop responses/close-loop Step to obtain the step response. Right-click on the plot, and select Characteristics and then Rise Time and Peak Overshoot. Left click on the blue dots, this will display the time-domain specifications shown in the Figure below. 7B.5

6 Example 2 For the system in Example1 Design a PD compensator Cs ( ) = KP + Ks D for the following time-domain specifications. Dominant poles damping ratio ζ = Dominant poles settling time of t s = 2 seconds t 4τ = 2 τ = 0.5 second s 1 1 ζω = n 2 τ = 0.5 =, and 1 θ = coc (0.707) = 45 Therefore s1 = 2+ j2 To make the plant model and start the SISO Design Tool, at the MATLAB prompt type >> Gp = tf(1, [ ]) >> sisotool An empty SISO Design Tool opens as shown 7B.6
 = 45 Therefore s1 = 2+ j2 To make the plant model and start the SISO Design Tool, at the MATLAB prompt type >> Gp")
7 Select Import Model under the File menu. This opens the Import System Data dialog box. Select Gp and click on the arrow button to place it in the G field. Click OK. The root locus and open-loop Bode diagrams are displayed in the plot regions. 7B.7

8 The SISO Design Tool provides design constraints that can make it easier to meet design specifications. If you want To place a pair of complex poles on your diagram at a damping ratio of 0.707, select Design Constraints and then New from the right-click menu in the root locus. This opens the Design Constraints editor. In the damping ratio field enter This results in a pair of shaded rays at the desired slope. To add a settling time constraint, reopen the New Constraint window and choose settling time from the pull-down menu, set it s filed to 2. In order to have a closed-loop pole at s 1 = 2+ j2, a zero must be added to shift the loci towards the left-half s-plane. To add a zero, turn on the zero Ο on the toolbar and place the zero ο on the real axis just to the left of the pole with the smallest magnitude. Move the closed-loop pole up the loci towards the intersection of ζ and τ constraints. You can turn on the Mouse zoom and place a square in the area containing the controller zero and the closed loop pole s 1. Adjust the zero position on the real axis and at the same time hold the left mouse and drag the closed-loop pole until the pole is placed at the desired location as appears on the bottom panel. 7B.8

9 To save the compensator design, select Export from the File menu. This opens the SISO Tool Export. Select Compensator C in the Component column. To change the export name, double-click in the cell for Compensator C and change the name to say PD. Click on the Export to Workspace button. Typing PD at MATLAB prompt the PD controller is printed. Zero/pole/gain: (s+2.397) Thus the PD controller is approximately s. From Tools Menu select Loop responses/close-loop Step to obtain the step response. Right-click on the plot, and select Characteristics and then Rise Time and Peak Overshoot. Left click on the blue dots, this will display the time-domain specifications shown in the Figure below. Also note that the open-loop Bode plot displays the compensated system gain margin and phase margin. 7B.9

10 Example 3 Kc( s+ z0) For the system in Example 1 Design a phase-lead compensator Cs () = for the ( s+ p0) following time-domain specifications. Dominant poles damping ratio ζ = Dominant poles settling time of t s = 2 seconds t 4τ = 2 τ = 0.5 second s 1 1 ζω n = = = 2, and 1 θ = coc (0.707) = 45 τ 0.5 Therefore s1 = 2+ j2 The graphical root locus is a trail and error procedure. In this procedure we select the controller zero and we use the given constraints too find the location of controller poles and its dc gain. For this example select the zero at To make the plant model and start the SISO Design Tool, at the MATLAB prompt type >> Gp = tf(1, [ ]) 7B.10

11 >> sisotool An empty SISO Design Tool opens. Select Import Model under the File menu. This opens the Import System Data dialog box. Select Gp and click on the arrow button to place it in the G field. Click OK. The root locus and open-loop Bode diagrams are displayed in the plot regions. To place a pair of complex poles on your diagram at a damping ratio of 0.707, select Design Constraints and then New from the right-click menu in the root locus. This opens the Design Constraints editor. In the damping ratio field enter This results in a pair of shaded rays at the desired slope. To add a settling time constraint, reopen the New Constraint window and choose settling time from the pull-down menu set it s filed to 2. Place the curser next to the controller C(s) and click to open its dialog box. In the Edit Compensator C type 1.75 for a Real Zero. Also, add a real pole, turn on the pole on the toolbar and place the pole on the real axis to the right of the pole with the largest magnitude. Move the closed-loop pole up the loci towards the intersection of ζ and τ constraints. You can turn on the Mouse zoom and place a square in the area containing the controller zero, pole and the closed loop pole s 1. Adjust the pole position on the real axis and at the same time hold the left mouse and drag the closed-loop pole until the pole is placed at the desired location as appears on the bottom panel. 7B.11

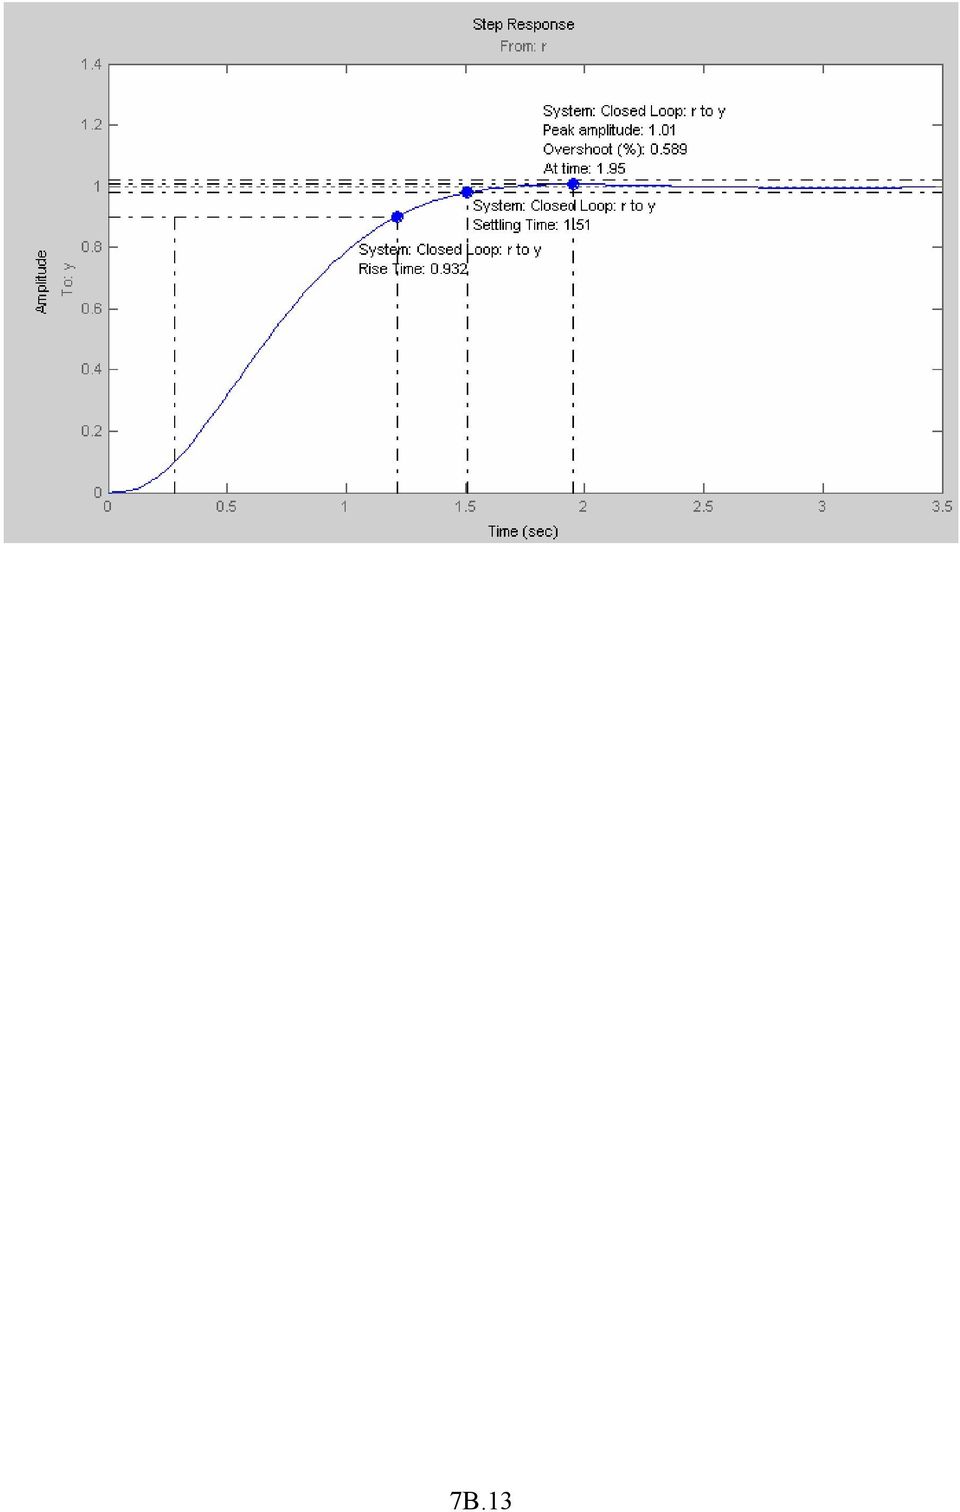
12 To save the compensator design, select Export from the File menu. This opens the SISO Tool Export. Select Compensator C in the Component column. To change the export name, double-click in the cell for Compensator C and change the name to say PhLead. Click on the Export to Workspace button. Typing PhLead at MATLAB prompt the phase lead controller is printed. Zero/pole/gain: (s+1.75) (s+8.023) Thus the phase-lead controller is approximately 64( s ) ( s + 8) From Tools Menu select Loop responses/close-loop Step to obtain the step response. Right-click on the plot, and select Characteristics and then Rise Time and Peak Overshoot. Left click on the blue dots, this will display the time-domain specifications shown in the Figure below. 7B.12
 ( s + 8) From Tools Menu select Loop responses/close-loop Step to obtain the step response. Right-click on the plot, and select Characteristics and then Rise Time and Peak Overshoot.")
13 7B.13
Root Locus. E(s) K. R(s) C(s) 1 s(s+a) Consider the closed loop transfer function:
 K. R(s) C(s) 1 s(s+a) Consider the closed loop transfer function:") Consider the closed loop transfer function: Root Locus R(s) + - E(s) K 1 s(s+a) C(s) How do the poles of the closed-loop system change as a function of the gain K? The closed-loop transfer function is:
Consider the closed loop transfer function: Root Locus R(s) + - E(s) K 1 s(s+a) C(s) How do the poles of the closed-loop system change as a function of the gain K? The closed-loop transfer function is:
EE 402 RECITATION #13 REPORT
 MIDDLE EAST TECHNICAL UNIVERSITY EE 402 RECITATION #13 REPORT LEAD-LAG COMPENSATOR DESIGN F. Kağan İPEK Utku KIRAN Ç. Berkan Şahin 5/16/2013 Contents INTRODUCTION... 3 MODELLING... 3 OBTAINING PTF of OPEN
Understanding Poles and Zeros
 MASSACHUSETTS INSTITUTE OF TECHNOLOGY DEPARTMENT OF MECHANICAL ENGINEERING 2.14 Analysis and Design of Feedback Control Systems Understanding Poles and Zeros 1 System Poles and Zeros The transfer function
Σ _. Feedback Amplifiers: One and Two Pole cases. Negative Feedback:
 Feedback Amplifiers: One and Two Pole cases Negative Feedback: Σ _ a f There must be 180 o phase shift somewhere in the loop. This is often provided by an inverting amplifier or by use of a differential
ECE 3510 Final given: Spring 11
 ECE 50 Final given: Spring This part of the exam is Closed book, Closed notes, No Calculator.. ( pts) For each of the time-domain signals shown, draw the poles of the signal's Laplace transform on the
Working with SQL Server Integration Services
 SQL Server Integration Services (SSIS) is a set of tools that let you transfer data to and from SQL Server 2005. In this lab, you ll work with the SQL Server Business Intelligence Development Studio to
Introduction to Simulink
 Introduction to Simulink MEEN 364 Simulink is a software package for modeling, simulating, and analyzing dynamical systems. It supports linear and nonlinear systems, modeled in continuous time, sampled
UNIVERSITY OF CALIFORNIA AT BERKELEY College of Engineering Department of Electrical Engineering and Computer Sciences. EE105 Lab Experiments
 UNIVERSITY OF CALIFORNIA AT BERKELEY College of Engineering Department of Electrical Engineering and Computer Sciences EE15 Lab Experiments Bode Plot Tutorial Contents 1 Introduction 1 2 Bode Plots Basics
Controller Design in Frequency Domain
 ECSE 4440 Control System Engineering Fall 2001 Project 3 Controller Design in Frequency Domain TA 1. Abstract 2. Introduction 3. Controller design in Frequency domain 4. Experiment 5. Colclusion 1. Abstract
Using Microsoft Excel to Plot and Analyze Kinetic Data
 Entering and Formatting Data Using Microsoft Excel to Plot and Analyze Kinetic Data Open Excel. Set up the spreadsheet page (Sheet 1) so that anyone who reads it will understand the page (Figure 1). Type
Engineering Sciences 22 Systems Summer 2004
 Engineering Sciences 22 Systems Summer 24 BODE PLOTS A Bode plot is a standard format for plotting frequency response of LTI systems. Becoming familiar with this format is useful because: 1. It is a standard
Introduction to LabVIEW for Control Design & Simulation Ricardo Dunia (NI), Eric Dean (NI), and Dr. Thomas Edgar (UT)
, Eric Dean (NI), and Dr. Thomas Edgar (UT)") Introduction to LabVIEW for Control Design & Simulation Ricardo Dunia (NI), Eric Dean (NI), and Dr. Thomas Edgar (UT) Reference Text : Process Dynamics and Control 2 nd edition, by Seborg, Edgar, Mellichamp,
Introduction to LabVIEW for Control Design & Simulation Ricardo Dunia (NI), Eric Dean (NI), and Dr. Thomas Edgar (UT) Reference Text : Process Dynamics and Control 2 nd edition, by Seborg, Edgar, Mellichamp,
Workspaces Creating and Opening Pages Creating Ticker Lists Looking up Ticker Symbols Ticker Sync Groups Market Summary Snap Quote Key Statistics
 Getting Started Workspaces Creating and Opening Pages Creating Ticker Lists Looking up Ticker Symbols Ticker Sync Groups Market Summary Snap Quote Key Statistics Snap Report Price Charts Comparing Price
Navios Quick Reference
 Navios Quick Reference Purpose: The purpose of this Quick Reference is to provide a simple step by step outline of the information needed to perform various tasks on the system. We begin with basic tasks
Summary of important mathematical operations and formulas (from first tutorial):
:") EXCEL Intermediate Tutorial Summary of important mathematical operations and formulas (from first tutorial): Operation Key Addition + Subtraction - Multiplication * Division / Exponential ^ To enter a
EXCEL Intermediate Tutorial Summary of important mathematical operations and formulas (from first tutorial): Operation Key Addition + Subtraction - Multiplication * Division / Exponential ^ To enter a
1.5 MONITOR. Schools Accountancy Team INTRODUCTION
 1.5 MONITOR Schools Accountancy Team INTRODUCTION The Monitor software allows an extract showing the current financial position taken from FMS at any time that the user requires. This extract can be saved
WebSphere Business Monitor V6.2 Business space dashboards
 Copyright IBM Corporation 2009 All rights reserved IBM WEBSPHERE BUSINESS MONITOR 6.2 LAB EXERCISE WebSphere Business Monitor V6.2 What this exercise is about... 2 Lab requirements... 2 What you should
Instructions for Use. CyAn ADP. High-speed Analyzer. Summit 4.3. 0000050G June 2008. Beckman Coulter, Inc. 4300 N. Harbor Blvd. Fullerton, CA 92835
 Instructions for Use CyAn ADP High-speed Analyzer Summit 4.3 0000050G June 2008 Beckman Coulter, Inc. 4300 N. Harbor Blvd. Fullerton, CA 92835 Overview Summit software is a Windows based application that
Control System Definition
 Control System Definition A control system consist of subsytems and processes (or plants) assembled for the purpose of controlling the outputs of the process. For example, a furnace produces heat as a
Creating Database Model Diagrams in Microsoft Visio Jeffery S. Horsburgh
 Creating Database Model Diagrams in Microsoft Visio Jeffery S. Horsburgh Visio is a software tool created by Microsoft that contains tools for creating many different types of diagrams. Visio s drawing
The following is an overview of lessons included in the tutorial.
 Chapter 2 Tutorial Tutorial Introduction This tutorial is designed to introduce you to some of Surfer's basic features. After you have completed the tutorial, you should be able to begin creating your
Tracking Project Progress
 L E S S O N 2 Tracking Project Progress Suggested lesson time 45-55 minutes Lesson objectives To begin tracking an active project, you will: a b c Modify the environment for tracking. You will use the
Working with Excel in Origin
 Working with Excel in Origin Limitations When Working with Excel in Origin To plot your workbook data in Origin, you must have Excel version 7 (Microsoft Office 95) or later installed on your computer
Laboratory 4: Feedback and Compensation
 Laboratory 4: Feedback and Compensation To be performed during Week 9 (Oct. 20-24) and Week 10 (Oct. 27-31) Due Week 11 (Nov. 3-7) 1 Pre-Lab This Pre-Lab should be completed before attending your regular
WEB TRADER USER MANUAL
 WEB TRADER USER MANUAL Web Trader... 2 Getting Started... 4 Logging In... 5 The Workspace... 6 Main menu... 7 File... 7 Instruments... 8 View... 8 Quotes View... 9 Advanced View...11 Accounts View...11
WHAT S NEW IN OBIEE 11.1.1.7
 Enterprise Data Management OBI Author Training, March 2015 WHAT S NEW IN OBIEE 11.1.1.7 NEW PRESENTATION FEATURES VIEWS 1) Recommended Visualizations Feature When you create a new view, OBIEE looks at
X-Trade Brokers Dom Maklerski S.A. XTB Expert Builder. Tutorial. Michał Zabielski 2010-08-05
 X-Trade Brokers Dom Maklerski S.A. XTB Expert Builder Tutorial Michał Zabielski 2010-08-05 Table of Contents Installation...3 Legal notification...7 Initial adjustments / Preferences...8 Language...8 Platform
Lab 3: Introduction to Data Acquisition Cards
 Lab 3: Introduction to Data Acquisition Cards INTRODUCTION: In this lab, you will be building a VI to display the input measured on a channel. However, within your own VI you will use LabVIEW supplied
This activity will show you how to draw graphs of algebraic functions in Excel.
 This activity will show you how to draw graphs of algebraic functions in Excel. Open a new Excel workbook. This is Excel in Office 2007. You may not have used this version before but it is very much the
Enhancing Classical Controls Education via Interactive GUI Design
 C Enhancing Classical Controls Education via Interactive GUI Design Raymond C. Garcia and Bonnie S. Heck lassical control design methods reg- tions is manually; that is. the students plot options available,
Introduction to the TI-Nspire CX
 Introduction to the TI-Nspire CX Activity Overview: In this activity, you will become familiar with the layout of the TI-Nspire CX. Step 1: Locate the Touchpad. The Touchpad is used to navigate the cursor
Building a Simulink model for real-time analysis V1.15.00. Copyright g.tec medical engineering GmbH
 g.tec medical engineering GmbH Sierningstrasse 14, A-4521 Schiedlberg Austria - Europe Tel.: (43)-7251-22240-0 Fax: (43)-7251-22240-39 office@gtec.at, http://www.gtec.at Building a Simulink model for real-time
How to create pop-up menus
 How to create pop-up menus Pop-up menus are menus that are displayed in a browser when a site visitor moves the pointer over or clicks a trigger image. Items in a pop-up menu can have URL links attached
5. Tutorial. Starting FlashCut CNC
 FlashCut CNC Section 5 Tutorial 259 5. Tutorial Starting FlashCut CNC To start FlashCut CNC, click on the Start button, select Programs, select FlashCut CNC 4, then select the FlashCut CNC 4 icon. A dialog
PID Controller Tuning: A Short Tutorial
 PID Controller Tuning: A Short Tutorial Jinghua Zhong Mechanical Engineering, Purdue University Spring, 2006 Outline This tutorial is in PDF format with navigational control. You may press SPACE or, or
Excel Tutorial. Bio 150B Excel Tutorial 1
 Bio 15B Excel Tutorial 1 Excel Tutorial As part of your laboratory write-ups and reports during this semester you will be required to collect and present data in an appropriate format. To organize and
CATIA Basic Concepts TABLE OF CONTENTS
 TABLE OF CONTENTS Introduction...1 Manual Format...2 Log on/off procedures for Windows...3 To log on...3 To logoff...7 Assembly Design Screen...8 Part Design Screen...9 Pull-down Menus...10 Start...10
MicroStrategy Tips and Tricks
 MicroStrategy Tips and Tricks 1. If a prompt is required, it will have a red (Required) note. 2. If a prompt has been answered, it will have a green flag on the left-hand side of the screen. 3. You can
Years after 2000. US Student to Teacher Ratio 0 16.048 1 15.893 2 15.900 3 15.900 4 15.800 5 15.657 6 15.540
 To complete this technology assignment, you should already have created a scatter plot for your data on your calculator and/or in Excel. You could do this with any two columns of data, but for demonstration
1.5 MONITOR FOR FMS 6 USER GUIDE
 1.5 MONITOR FOR FMS 6 USER GUIDE 38 Introduction Monitor for FMS6 V1.2 is an upgrade to the previous version of Monitor. The new software is written for 32-bit operating systems only and can therefore
Plotting: Customizing the Graph
 Plotting: Customizing the Graph Data Plots: General Tips Making a Data Plot Active Within a graph layer, only one data plot can be active. A data plot must be set active before you can use the Data Selector
This Skill Builder demonstrates how to define and place sketched symbols in drawings.
 Sketched Symbols This Skill Builder demonstrates how to define and place sketched symbols in drawings. A sketched symbol is a user-defined symbol. You create sketched symbols in the sketch environment
6. If you want to enter specific formats, click the Format Tab to auto format the information that is entered into the field.
 Adobe Acrobat Professional X Part 3 - Creating Fillable Forms Preparing the Form Create the form in Word, including underlines, images and any other text you would like showing on the form. Convert the
ProjectWise Explorer V8i User Manual for Subconsultants & Team Members
 ProjectWise Explorer V8i User Manual for Subconsultants & Team Members submitted to Michael Baker International Subconsultants & Team Members submitted by Michael Baker International ProjectWise Support
SAS VISUAL ANALYTICS AN OVERVIEW OF POWERFUL DISCOVERY, ANALYSIS AND REPORTING
 SAS VISUAL ANALYTICS AN OVERVIEW OF POWERFUL DISCOVERY, ANALYSIS AND REPORTING WELCOME TO SAS VISUAL ANALYTICS SAS Visual Analytics is a high-performance, in-memory solution for exploring massive amounts
QNET Experiment #06: HVAC Proportional- Integral (PI) Temperature Control Heating, Ventilation, and Air Conditioning Trainer (HVACT)
 Temperature Control Heating, Ventilation, and Air Conditioning Trainer (HVACT)") Quanser NI-ELVIS Trainer (QNET) Series: QNET Experiment #06: HVAC Proportional- Integral (PI) Temperature Control Heating, Ventilation, and Air Conditioning Trainer (HVACT) Student Manual Table of Contents
Quanser NI-ELVIS Trainer (QNET) Series: QNET Experiment #06: HVAC Proportional- Integral (PI) Temperature Control Heating, Ventilation, and Air Conditioning Trainer (HVACT) Student Manual Table of Contents
Using Flow Control with the HEAD Recorder
 03/15 Using with the HEAD Recorder The HEAD Recorder is a data acquisition software program that features an editable Flow Control function. This function allows complex program sequences to be predefined,
Beginner s Matlab Tutorial
 Christopher Lum lum@u.washington.edu Introduction Beginner s Matlab Tutorial This document is designed to act as a tutorial for an individual who has had no prior experience with Matlab. For any questions
WebSphere Business Monitor V7.0 Business space dashboards
 Copyright IBM Corporation 2010 All rights reserved IBM WEBSPHERE BUSINESS MONITOR 7.0 LAB EXERCISE WebSphere Business Monitor V7.0 What this exercise is about... 2 Lab requirements... 2 What you should
LEGENDplex Data Analysis Software
 LEGENDplex Data Analysis Software Version 7.0 User Guide Copyright 2013-2014 VigeneTech. All rights reserved. Contents Introduction... 1 Lesson 1 - The Workspace... 2 Lesson 2 Quantitative Wizard... 3
Project Management with Enterprise Architect
 Project Management with Enterprise Architect Enterprise Architect is an intuitive, flexible and powerful UML analysis and design tool for building robust and maintainable software. This booklet explains
EET 310 Programming Tools
 Introduction EET 310 Programming Tools LabVIEW Part 1 (LabVIEW Environment) LabVIEW (short for Laboratory Virtual Instrumentation Engineering Workbench) is a graphical programming environment from National
Intro to Excel spreadsheets
 Intro to Excel spreadsheets What are the objectives of this document? The objectives of document are: 1. Familiarize you with what a spreadsheet is, how it works, and what its capabilities are; 2. Using
Adobe Acrobat: Creating Interactive Forms
 Adobe Acrobat: Creating Interactive Forms This document provides information regarding creating interactive forms in Adobe Acrobat. Please note that creating forms requires the professional version (not
Using the Cute Rich-Text Editor
 Using the Cute Rich-Text Editor This document is designed to provide users with a basic introduction to using the Cute rich-text editor to format text, create and modify tables, and to place charts and
Create a Poster Using Publisher
 Contents 1. Introduction 1. Starting Publisher 2. Create a Poster Template 5. Aligning your images and text 7. Apply a background 12. Add text to your poster 14. Add pictures to your poster 17. Add graphs
Build Your First Web-based Report Using the SAS 9.2 Business Intelligence Clients
 Technical Paper Build Your First Web-based Report Using the SAS 9.2 Business Intelligence Clients A practical introduction to SAS Information Map Studio and SAS Web Report Studio for new and experienced
Task Force on Technology / EXCEL
 Task Force on Technology EXCEL Basic terminology Spreadsheet A spreadsheet is an electronic document that stores various types of data. There are vertical columns and horizontal rows. A cell is where the
How to use Wireframe in Visio
 Visio Tutorial: How to use Wireframe How to use Wireframe in Visio By Derek Tobler Table of Contents Getting started... 2 To start go to the Start icon and click on it. Then type Visio in the Search programs
Raster to Vector Conversion for Overlay Analysis
 Raster to Vector Conversion for Overlay Analysis In some cases, it may be necessary to perform vector-based analyses on a raster data set, or vice versa. The types of analyses that can be performed on
Ohio University Computer Services Center August, 2002 Crystal Reports Introduction Quick Reference Guide
 Open Crystal Reports From the Windows Start menu choose Programs and then Crystal Reports. Creating a Blank Report Ohio University Computer Services Center August, 2002 Crystal Reports Introduction Quick
Menus and Toolbars: Using and customizing those common to all OpenOffice.org components
 Menus and Toolbars: Using and customizing those common to all OpenOffice.org components Title: Menus and Toolbars: Using and customizing those common to all OpenOffice.org components Version: 1.0 First
Gestation Period as a function of Lifespan
 This document will show a number of tricks that can be done in Minitab to make attractive graphs. We work first with the file X:\SOR\24\M\ANIMALS.MTP. This first picture was obtained through Graph Plot.
Using Spreadsheets, Selection Sets, and COGO Controls
 Using Spreadsheets, Selection Sets, and COGO Controls Contents About this tutorial... 3 Step 1. Open the project... 3 Step 2. View spreadsheets... 4 Step 3. Create a selection set... 10 Step 4. Work with
Completing Baseline s Site Survey Request Form
 Completing Baseline s Site Survey Request Form The first step in successfully implementing a radio network for your irrigation controllers is to identify the proposed locations for each radio. These radios
Produced by Flinders University Centre for Educational ICT. PivotTables Excel 2010
 Produced by Flinders University Centre for Educational ICT PivotTables Excel 2010 CONTENTS Layout... 1 The Ribbon Bar... 2 Minimising the Ribbon Bar... 2 The File Tab... 3 What the Commands and Buttons
Statgraphics Getting started
 Statgraphics Getting started The aim of this exercise is to introduce you to some of the basic features of the Statgraphics software. Starting Statgraphics 1. Log in to your PC, using the usual procedure
Excel 2010: Create your first spreadsheet
 Excel 2010: Create your first spreadsheet Goals: After completing this course you will be able to: Create a new spreadsheet. Add, subtract, multiply, and divide in a spreadsheet. Enter and format column
Absorbance Spectrophotometry: Analysis of FD&C Red Food Dye #40 Calibration Curve Procedure
 Absorbance Spectrophotometry: Analysis of FD&C Red Food Dye #40 Calibration Curve Procedure Note: there is a second document that goes with this one! 2046 - Absorbance Spectrophotometry. Make sure you
Tutorial: Biped Character in 3D Studio Max 7, Easy Animation
 Tutorial: Biped Character in 3D Studio Max 7, Easy Animation Written by: Ricardo Tangali 1. Introduction:... 3 2. Basic control in 3D Studio Max... 3 2.1. Navigating a scene:... 3 2.2. Hide and Unhide
If you know exactly how you want your business forms to look and don t mind
 appendix e Advanced Form Customization If you know exactly how you want your business forms to look and don t mind detail work, you can configure QuickBooks forms however you want. With QuickBooks Layout
Writer Guide. Chapter 15 Using Forms in Writer
 Writer Guide Chapter 15 Using Forms in Writer Copyright This document is Copyright 2005 2008 by its contributors as listed in the section titled Authors. You may distribute it and/or modify it under the
Microsoft Project 2013
 CALIFORNIA STATE UNIVERSITY, LOS ANGELES INFORMATION TECHNOLOGY SERVICES Microsoft Project 2013 Summer 2014, Version 1.0 Table of Contents Introduction...2 Overview of the User Interface...2 Creating a
0 Introduction to Data Analysis Using an Excel Spreadsheet
 Experiment 0 Introduction to Data Analysis Using an Excel Spreadsheet I. Purpose The purpose of this introductory lab is to teach you a few basic things about how to use an EXCEL 2010 spreadsheet to do
One of the following messages will appear in red when DisplayStudio is not properly connected to a media player on the wireless network.
 DisplayStudio Software Failure Connecting to Media Player on Wifi Network February 23, 2015 Introduction This document troubleshoots a failed wireless network connection between Roland DisplayStudio software
To Begin Customize Office
 To Begin Customize Office Each of us needs to set up a work environment that is comfortable and meets our individual needs. As you work with Office 2007, you may choose to modify the options that are available.
PTC Integrity Eclipse and IBM Rational Development Platform Guide
 PTC Integrity Eclipse and IBM Rational Development Platform Guide The PTC Integrity integration with Eclipse Platform and the IBM Rational Software Development Platform series allows you to access Integrity
Hierarchical Clustering Analysis
 Hierarchical Clustering Analysis What is Hierarchical Clustering? Hierarchical clustering is used to group similar objects into clusters. In the beginning, each row and/or column is considered a cluster.
Scientific Graphing in Excel 2010
 Scientific Graphing in Excel 2010 When you start Excel, you will see the screen below. Various parts of the display are labelled in red, with arrows, to define the terms used in the remainder of this overview.
USING WINDOWS MOVIE MAKER TO CREATE THE MOMENT BEHIND THE PHOTO STORY PART 1
 PART 1 Windows Movie Maker lets you assemble a range of video, pictures, and sound elements to create a story. It is an application that comes with most PC computers. This tip sheet was created using Windows
Adobe Digital Signatures in Adobe Acrobat X Pro
 Adobe Digital Signatures in Adobe Acrobat X Pro Setting up a digital signature with Adobe Acrobat X Pro: 1. Open the PDF file you wish to sign digitally. 2. Click on the Tools menu in the upper right corner.
Pro/ENGINEER Wildfire 4.0 Basic Design
 Introduction Datum features are non-solid features used during the construction of other features. The most common datum features include planes, axes, coordinate systems, and curves. Datum features do
If you know exactly how you want your business forms to look and don t mind detail
 Advanced Form Customization APPENDIX E If you know exactly how you want your business forms to look and don t mind detail work, you can customize QuickBooks forms however you want. With QuickBooks Layout
http://school-maths.com Gerrit Stols
 For more info and downloads go to: http://school-maths.com Gerrit Stols Acknowledgements GeoGebra is dynamic mathematics open source (free) software for learning and teaching mathematics in schools. It
Stability of Linear Control System
 Stabilit of Linear Control Sstem Concept of Stabilit Closed-loop feedback sstem is either stable or nstable. This tpe of characterization is referred to as absolte stabilit. Given that the sstem is stable,
Sample Table. Columns. Column 1 Column 2 Column 3 Row 1 Cell 1 Cell 2 Cell 3 Row 2 Cell 4 Cell 5 Cell 6 Row 3 Cell 7 Cell 8 Cell 9.
 Working with Tables in Microsoft Word The purpose of this document is to lead you through the steps of creating, editing and deleting tables and parts of tables. This document follows a tutorial format
Prism 6 Step-by-Step Example Linear Standard Curves Interpolating from a standard curve is a common way of quantifying the concentration of a sample.
 Prism 6 Step-by-Step Example Linear Standard Curves Interpolating from a standard curve is a common way of quantifying the concentration of a sample. Step 1 is to construct a standard curve that defines
Chapter Eight Root Locus Control Design. 8.3 Common Dynamic Controllers
 Chapter Eight Root Locus Control Design 8.3 Common Dynamic Controllers Several common dynamic controllers appear very often in practice. They are known as PD, PI, PID, phase-lag, phase-lead, and phase-lag-lead
CNCTRAIN OVERVIEW CNC Simulation Systems 1995 2008
 CNCTRAIN OVERVIEW CNC Simulation Systems 1995 2008 p2 Table of Contents Getting Started 4 Select a control system 5 Setting the Best Screen Layout 6 Loading Cnc Files 7 Simulation Modes 9 Running the Simulation
GelAnalyzer 2010 User s manual. Contents
 GelAnalyzer 2010 User s manual Contents 1. Starting GelAnalyzer... 2 2. The main window... 2 3. Create a new analysis... 2 4. The image window... 3 5. Lanes... 3 5.1 Detect lanes automatically... 3 5.2
RLC Series Resonance
 RLC Series Resonance 11EM Object: The purpose of this laboratory activity is to study resonance in a resistor-inductor-capacitor (RLC) circuit by examining the current through the circuit as a function
054414 PROCESS CONTROL SYSTEM DESIGN. 054414 Process Control System Design LECTURE 2: FREQUENCY DOMAIN ANALYSIS
 05444 PROCESS CONTROL SYSTEM DESIGN 05444 Process Control System Design LECTURE : FREQUENCY DOMAIN ANALYSIS Daniel R. Lewin Department of Chemical Engineering Technion, Haifa, Israel - Objectives On completing
One-Way ANOVA using SPSS 11.0. SPSS ANOVA procedures found in the Compare Means analyses. Specifically, we demonstrate
 1 One-Way ANOVA using SPSS 11.0 This section covers steps for testing the difference between three or more group means using the SPSS ANOVA procedures found in the Compare Means analyses. Specifically,
Intellect Platform - The Workflow Engine Basic HelpDesk Troubleticket System - A102
 Intellect Platform - The Workflow Engine Basic HelpDesk Troubleticket System - A102 Interneer, Inc. Updated on 2/22/2012 Created by Erika Keresztyen Fahey 2 Workflow - A102 - Basic HelpDesk Ticketing System
Applying a circular load. Immediate and consolidation settlement. Deformed contours. Query points and query lines. Graph query.
 Quick Start Tutorial 1-1 Quick Start Tutorial This quick start tutorial will cover some of the basic features of Settle3D. A circular load is applied to a single soil layer and settlements are examined.
Creating Hyperlinks & Buttons InDesign CS6
 Creating Hyperlinks & Buttons Adobe DPS, InDesign CS6 1 Creating Hyperlinks & Buttons InDesign CS6 Hyperlinks panel overview You can create hyperlinks so that when you export to Adobe PDF or SWF in InDesign,
Model Run Analysis. Technical Documentation Version 6.7. Center for Advanced Decision Support for Water and Environmental Systems
 Technical Documentation Version 6.7 Model Run Analysis CADSWES S Center for Advanced Decision Support for Water and Environmental Systems These documents are copyrighted by the Regents of the University
MARS STUDENT IMAGING PROJECT
 MARS STUDENT IMAGING PROJECT Data Analysis Practice Guide Mars Education Program Arizona State University Data Analysis Practice Guide This set of activities is designed to help you organize data you collect
BD CellQuest Pro Software Analysis Tutorial
 BD CellQuest Pro Analysis Tutorial This tutorial guides you through an analysis example using BD CellQuest Pro software. If you are already familiar with BD CellQuest Pro software on Mac OS 9, refer to
How to connect to VUWiFi
 Wireless Registration Instructions Windows XP How to connect to VUWiFi 1. The first step in setting up your wireless card for VUWiFi is to open your Network Connections window. You can find this by going