Cultural Integration in Germany
|
|
|
- Conrad Shaw
- 7 years ago
- Views:
Transcription
1 D I S C U S S I O N P A P E R S E R I E S IZA DP No Cultural Integration in Germany Amelie F. Constant Olga Nottmeyer Klaus F. Zimmermann December 2009 Forschungsinstitut zur Zukunft der Arbeit Institute for the Study of Labor

2 Cultural Integration in Germany Amelie F. Constant DIW DC, George Washington University and IZA Olga Nottmeyer DIW Berlin and IZA Klaus F. Zimmermann IZA, DIW Berlin and University of Bonn Discussion Paper No December 2009 IZA P.O. Box Bonn Germany Phone: Fax: Any opinions expressed here are those of the author(s) and not those of IZA. Research published in this series may include views on policy, but the institute itself takes no institutional policy positions. The Institute for the Study of Labor (IZA) in Bonn is a local and virtual international research center and a place of communication between science, politics and business. IZA is an independent nonprofit organization supported by Deutsche Post Foundation. The center is associated with the University of Bonn and offers a stimulating research environment through its international network, workshops and conferences, data service, project support, research visits and doctoral program. IZA engages in (i) original and internationally competitive research in all fields of labor economics, (ii) development of policy concepts, and (iii) dissemination of research results and concepts to the interested public. IZA Discussion Papers often represent preliminary work and are circulated to encourage discussion. Citation of such a paper should account for its provisional character. A revised version may be available directly from the author.

3 IZA Discussion Paper No December 2009 ABSTRACT Cultural Integration in Germany * This chapter investigates the integration processes of immigrants in Germany by comparing certain immigrant groups to natives differentiating by gender and immigrant generation. Indicators which are supposed to capture cultural integration of immigrants are differences in marital behavior as well as language abilities, ethnic identification and religious distribution. A special feature of the available data is information about overall life satisfaction, risk aversion and political interest. These indicators are also presented. All of these indicators are depicted in comparison between natives and immigrants differentiated by ethnic origin, gender and generation. This allows visualization of differences by ethnic groups and development over time. Statements about the cultural integration processes of immigrants are thus possible. Furthermore, economic integration in terms of female labor force participation is presented as an additional feature. Empirical findings suggest that differences among immigrants and between immigrants and Germans do exist and differ significantly by ethnic origin, gender and generation. But differences seem to diminish when we consider the second generations. This indicates greater adaptation to German norms and habits, and thus better cultural, socio-economic and political integration of second generation immigrants in Germany. JEL Classification: F22, J15, J61, Z13 Keywords: cultural integration, immigrants, Germany, ethnic origin, gender, generation Corresponding author: Klaus F. Zimmermann IZA P.O. Box 7240 D Bonn Germany Zimmermann@iza.org * Book chapter forthcoming in: A. Bisin, A. Manning and T. Verdier (eds.) Cultural Integration in Europe, CEPR, Oxford University Press, Financial support from the German Research Foundation (Deutsche Forschungsgemeinschaft, DFG) for the project on Ethnic Diversity and Labor Market Success in the DFG-Priority Program Flexibility in Heterogeneous Labor Markets (Flexibilisierungspotenziale bei heterogenen Arbeitsmärkten) is gratefully acknowledged.

4 1 Introduction Immigration to Germany began after the Second World War, when substantial inflows of Germans, refugees and expellees from Eastern European territories immigrated to Western Germany. Immigrant labor was needed to rebuild a dilapidated Germany. In the late 1950 s, under the auspices of the Federal Labor Institute (FLI) and in cooperation with labor unions and local authorities, German employers actively recruited foreign workers without any quota limits imposed by the government. The German immigration system was, therefore, demand-driven and project-tied. Employers, free from any government quota, determined the number and the origin of the immigrant flow so that their industries would easily absorb them. Germans from East Germany were a big chunk of these laborers, but treaties for recruitment were also signed with Italy in 1955 and Spain and Greece in While the inflow of East Germans ended with the erection of the Berlin wall in 1961, the demand for workers did not. A massive shortage in labor supply especially in low qualified sectors and an extraordinary fast economic growth made the need for imported labor imperative. Additional treaties for recruitment were signed with Turkey in 1961, Portugal in 1964, and Yugoslavia in Immigrants from Italy, Greece, Spain, Turkey, Potrugal and Yugoslavia were called guest workers implying that their presence in Germany was only of temporary nature and based on stay-and-return migration in what was called the rotation model. These immigrants prompted the transformation of the southern regions, like Bavaria and Baden Wurttemburg, from mostly agrarian into modernized industrial states. By the late 1960 s, upward economic and occupational mobility of native Germans, as well as sluggish demographic growth, contributed to the tremendous inflow of guest workers (500,000 workers annually) with the subsequent German economy dependence on guest workers. It is worth noting that during this era of the German miracle, West Germany had virtually no unemployment. Not only native Germans were faring very well, but immigrants were faring well also in terms of attachment to employment and wages. On November 22, 1973, with the oil crisis intensifying a beginning recession in Germany, the German government was forced to change its immigration policy and halt active recruitment by firms, thereby controlling the inflow of alien workers. The 1973 ban excluded immigrants from the European Common Market countries. While this new policy was effective in reducing the number of labor migrants, it backfired and increased the actual size of the foreign population, which increased through family reunification and high fertility rates. Specifically, by % of all births in the Federal Republic of Germany were from guest workers (Mehrlander, 1985 [30]), and 2

5 65% of the total gross immigration, after the 1973 ban, was due to family reunification of guestworkers (Velling, 1994 [35]). Therefore, the composition of immigrants shifted from young males to women and children who arrived in Germany to join their husbands and fathers, creating a strong second generation immigrants. The government s efforts to promote return migration did not succeed resulting in an extension of duration of stay in Germany and immigrants turning from guest workers to permanent residents. After the recession labor migrants from Turkey, Yugoslavia, Greece, Italy and Spain were the dominant immigrant groups in Germany working in unskilled menial positions, concentrated in very few sectors and under unfavorable work conditions (Kalter and Granato (2007) [25]). Various geopolitical reasons contributed in a yet changing composition of immigrants to Germany. In the 1980s and early 1990s the immigration inflow was boosted by asylum seekers 1 and ethnic Germans coming to Germany in the aftermath of the fall of the Iron Curtain and due to liberalized travel regulations. Immigration of the latter, the so-called Aussiedler 2 from Poland, Romania and the former Soviet Union, increased until a new more restrictive law was enforced in Most recently, labor migrants from Poland, the (former) Czech Republic and other Eastern European States contribute mainly to the immigration inflow to Germany. By 2000, almost 9% of the German population is immigrants. Despite this long migration history, Germany kept quiet about being a migration nation. Taking a pioneering stance, the German government introduced the Immigration Act (Zuwanderungsgesetz) in 2001, a reduced version of which came into effect on January 1, The Act acknowledges Germany s status as an immigration country and addresses to an increasing degree difficulties accompanied by divergences between natives and immigrants. The question of how to obtain a sufficient degree of economic and social integration is thus one of the pressing topics in the current political debate. Integration as a harmonic coexistence and cooperation between different ethnic groups is fostered in order to mitigate potential conflict while preserving highly precious synergies by the mix of cultures. One of the major concerns of researchers and politicians is how to measure the degree of integration of immigrants. In contrast to economic integration, which is comparatively easy to gauge through widely accepted indicators such as labor market participation, wage growth and immigrant earnings 1 mainly due to civil wars in Yugoslavia, conflicts in Kurdish territories of Turkey and northern Iraq. Iranians as well as Vietnamese and Chinese occupied a large percentage of asylum seekers. 2 Immigrants who proved that they were of German decent were by law German and granted German citizenship almost immediately after arrival 3

6 convergence to those of natives, cultural and social integration is more difficult to define and quantify. The role of ethnic identity surfaces as important determinant of socio-economic integration. A major difficulty that studies try to tackle is potential endogeneity of the processes of economic performance and social and cultural interactions. Akerlof and Kranton (2000) [1] offer a novel theoretical framework of the utility maximization function by incorporating an individual s self-identification as a powerful motivation for behavior. They imply that if individuals achieve their ideal self and are comfortable with their identity then their utility increases, otherwise, their utility decreases. Bénabou and Tirole (2007) [4] model a broad class of beliefs of individuals including their identity, which people value and invest in. They also study endogenously arising self-serving beliefs linked to pride, dignity or wishful thinking. These emerging important contributions can also explain labor market integration and wage differentials. Accordingly, while some individuals have the drive and human capital to integrate and succeed in the labor market they may not reach their goal because of behavioral norms and unfulfilled or confused self-identity images. Following a burgeoning literature on the role of ethnic identity, Constant and Zimmermann created a measurable index of ethnic identity. In 2006, Constant, Gataullina, and Zimmermann were the first to introduce the multidimensional concept of ethnic identity in economics by borrowing literature from social psychology and other social sciences. Following the original work Berry et al. (1989) [5], they developed a framework of ethnic identity and tested it empirically with German data 3. Specifically, they created a twodimensional quantitative index - the ethnosizer - that measures the degree of the ethnic identity of immigrants. Ethnic identity is how individuals perceive themselves within an environment as they categorize and compare themselves to others of the same or different ethnicity. It is the closeness or distance immigrants feel from their own ethnicity or from other ethnicities, as they try to fit into the host society; it can differ among migrants of the same origin, or be comparable among migrants of different ethnic backgrounds. In stark distinction to ethnicity, ethnic identity attempts to measure how people perceive themselves rather than their ancestors. The authors allow for the individuality, personality, distinctiveness and character of a person 3 Constant and Zimmermann (2009a) [9]; Constant and Zimmermann (2009b) [10]; Constant, Gataullina, Zimmermann and Zimmermann (2006) [13]; Zimmermann, Zimmermann and Constant (2007) [15] and [40]; Zimmermann (2007a) [36] and (2007b) [37]; Zimmermann, Gataullina, Constant and Zimmermann (2008) [39]; Zimmermann, Constant and Gataullina (2009) [38]; Constant, Zimmermann and Zimmermann (2009) [16]; Constant, Kahanec and Zimmermann (2009) [14]; Constant, Roberts and Zimmermann (2009) [12]; Constant and Zimmermann (2008) [8] 4
![Akerlof and Kranton (2000) [1] offer a novel theoretical framework of the utility maximization function by incorporating an individual s self-identification as a powerful motivation for behavior.](/docs-images/47/20894778/images/page_6.jpg "They imply that if individuals achieve their ideal self and are comfortable with their identity then their utility increases, otherwise, their utility decreases.")
7 in an ethnic group to prevail, to differ from one person to another, and to alter and evolve in different directions. They define ethnic identity to be the balance between commitment to, affinity to, or self-identification with the culture, norms and society of origin and commitment to or self-identification with the host culture and society. The ethnosizer contains four states or regimes of ethnic identity differentiated by the strength of cultural and social commitments to the home or host country: Assimilation, a pronounced identification with the host culture and society, coupled with a firm conformity to the norms, values and codes of conduct, and a weak identification with the ancestry; Integration, a achieved amalgam of both dedication to and identification with the origin and commitment and conformity to the host society. This is the case of a prefect bi-cultural state; Marginalization, a strong detachment from either the dominant culture or the culture of origin; and Separation, an exclusive commitment to the culture of origin even after years of emigration, paired with weak involvement in the host culture and country realities. The ethnosizer is composed of five essential elements of the ethnic identity: language ability, ethnic self-identification, visible cultural elements, ethnic interaction and future citizenship and locational plans. This chapter focuses on the cultural integration of immigrants in Germany, a powerful player in the EU and the Western world that has the largest immigrant population in EU. The aim of this chapter is to depict the current integration status of immigrants in Germany by comparing educational gaps between partners, marriage and intermarriage rates, age at first marriage, age gaps between spouses, the number of children per women, age at first child birth; political interest, risk attitudes, overall life satisfaction and female labor force participation. Additionally, immigrant groups are compared with respect to self-reported language abilities, ethnic self-identification and their religious believes. Thus, several determinants combined with the ethnosizer are also used in this study to determine the current degree of cultural integration. All indicators are defined as deviations from natives and differentiated by ethnic origin and immigrant generation. Empirical findings are based on panel data from the German Socio-Economic Panel (GSOEP) allowing for statements about development over time. The structure of this chapter is as follows. Data and definitions as well as remarks about the empirical methods used in this study are introduced and discussed in the next sections. Descriptive statistics and corresponding estimation results are presented and interpreted afterwards. The paper concludes with a summary of the findings from the analysis. Graphs are included in the Appendix at the very end of the paper. 5

8 2 Data Source and Definitions The analysis of the cultural integration of immigrants in Germany is based on data from the German Socio Economic Panel (GSOEP). The GSOEP is a nationally representative longitudinal study that in 2007 contained information about roughly 20,000 individuals and 11,000 private households in Germany. This unique data source provides a wealth of information about various social, cultural, political and economic aspects of individuals living in Germany and allows the testing of corresponding social and economic theories. Due to its panel design and an over-sampling of immigrants it opens unique analytical possibilities especially with regards to integration over time based on the behavior of different immigrant generations. The descriptive statistics presented refer to the period 2005 to 2007 or the most recent year for which information is available. The regressions are also estimated on data from this time period in order to exploit the richness of the data. A well acknowledged problem related to immigrant populations and international comparisons is the definition of who is an immigrant. Depending mainly on laws about who is a native and who is an immigrant, different countries have different definitions. For example, in the U.S., the prevailing law is the ius soli that makes all individuals born in the U.S. American citizens by default. Until recently, Germany was recognizing the ius sanguinis or bloodlines as the only law for being a German citizen. With the new developments, Germany now allows under certain exceptions the law of soil to determine citizenship as well. Accordingly, we define an immigrant to be a person either not born in Germany or a person who is born in Germany but either is not a German citizen or whose mother or father is not German born or has non-german nationality. In the case where both parents are not born in Germany but also not born in the same country, the country of origin of the mother outweighs the country of origin of the father assuming that cultural habits and norms are more likely to be transferred from the mother to the child than from the father. 4 Distinctions between first and second generations of immigrants are based on country of birth. By definition, individuals who are not born in Germany belong to the first generation of immigrants regardless of the age at which they immigrated to Germany. Individuals who were born in Germany but 4 This definition of immigrants defines Aussiedler as belonging to the group of immigrants. Aussiedler are not born in Germany but eligible for German citizenship immediately after immigration due to their German bloodlines. Aussiedler are mostly born and raised in Eastern European countries, and will be treated as part of the immigrant population and do not take on an exceptional role in this analysis. 6

9 fulfil at least one of the criteria mentioned above 5 are considered second generation immigrants. It is important to mention that second or even third generation immigrants in Germany may not be German citizens. More emphasis is placed on the country of origin than on nationality. Nationality may change over time and be related to a feeling of belonging and commitment to a specific country. Similar to ethnic identity 6, nationality may be a dynamic feature expressing a certain degree of integration, assimilation, segregation or marginalization. In contrast, country of origin or ethnicity remains unchanged even after naturalization. Ethnicity therefore reflects cultural influences during childhood and throughout a person s adult life. When there is no information available about the country of birth of the immigrant or the parents, nationality is taken a criterion to determine immigrant status. 3 Immigrant Population in Germany According to the definition of immigrants given above, GSOEP data show that percent of Germany s population have an immigration background either personally or induced by their parents (Table 1). Since the GSOEP over-samples the immigrant population in Germany there may be discrepancies between GSOEP statistics and official statistics by the German Statistical Office. Most recently, the German Statistical Office does not only report immigrant status defined by nationality, but introduced a new classification which is supposed to account for migration background. Accordingly, individuals residing in Germany either belong to the group of persons with or without migration background. Previously, individuals holding other than German citizenship were counted as Auslaender ignoring country of birth and family background. Depending on which definition is used, official data state that 8.8 percent of Germany s population is of foreign nationality ( Auslaender ) in contrast to almost 19 percent of people with migration background. Among these persons with migration background, roughly 68 percent belong to the group of people with their own migration experience (comparable to the first generation immigrants) and 32 percent to the group of persons without migration experience (second or later immigrant generation). 7 Also in the GSOEP data, the majority of the immigrants observed, namely percent, are classified 5 hold other than German citizenship, one of the parents is not German born or has a foreign nationality 6 see e.g. Phinney et al. (2001) [33]; Phinney (1992) [34]; Constant, Gataullina and Zimmermann (2009) [11] 7 see Statistisches Bundesamt,

10 as first generation whereas percent are second generation immigrants (Table 2). This bias from official data might be related to the fact that the GSOEP contains information mostly about individuals who are older than 16 years of age. This restriction possibly underestimates the share of younger immigrants on the total population and thus the share of second generation immigrants in the sample. In total, the data used within this study include 11,078 immigrants and 79,863 Germans. 8 Table 1: Immigrant Share on Total Population Freq. Percent German 79, Immigrant 11, Total 90, Source: GSOEP, Further, immigrants in Germany are distinguished by country of origin. We look at immigrants coming from one of the five sending countries during the guest worker period, namely Turkey, the former Yugoslavia, Spain, Greece and Italy. 9 Additionally, we include Polish and Russian immigrants since they are increasingly important ethnic groups in Germany today. Table 3 shows the distribution of these ethnic groups living in Germany between 2005 and Accordingly, Turkish immigrants represent percent of the immigrant population and are therefore the single biggest ethnic group present in Germany. Even though Spanish immigrants made up a major part of the guest worker population coming to Germany during the 1950s and 1960s, immigrants who originate from Spain are an almost negligible part of the immigrant community today and represent only 2.06 percent of the immigrant population. Hence, results regarding this group need to be treated with caution. Findings reported in the tables might not be representative of Spanish immigrants. They are stated, nonetheless, mostly for reasons of completeness. The ethnic group labelled Other refers to the foreign population in Germany that originates from other than the countries explicitly mentioned above. Considering the generational distribution of immigrants, Table 2 shows that within each immigrant group the majority of individuals belong to the first generation. This holds especially true for immigrants from Poland and Russia, who represent the most recent trends of immigration inflows to Germany. The share of first generation immigrants from these countries lies at 8 All numbers presented are not weighted 9 The category Former Yugoslavia includes immigrants from Croatia, Bosnia and Herzegovina, Macedonia, Slovenia and Kosovo-Albania. 8

11 Table 2: Generational Distribution Ethnic Origin 1.Gen 2.Gen Other Turkey Ex-Yugoslavia Greece Italy Spain Poland Russia Total Source: GSOEP, percent for Poles and even percent for Russians. Thus, statements regarding differences between first and second generation of these two ethnic groups must be treated carefully due to the small numbers of observations in the second generation. As a consequence, regressions that account for differences in behavior by generation occasionally do not include Russian second generation immigrants. Table 3: Immigrant Groups Ethnic Origin Freq. Percent Other 3, Turkey 2, Ex-Yugoslavia 1, Greece Italy 1, Spain Poland 1, Russia Total 11, Source: GSOEP, Comparing the ethnic distribution by generation, Table 4 shows that the share of Turkish, Italian, Greek and Spanish immigrants, is greater in the second than in the first generation. First generation Russians (8.58 percent) and Poles (10.76 percent) are also quite dominant ethnic groups, whereas the share of second generation Poles and Russian is relatively small. The share of immigrants from the countries of former Yugoslavia is almost identical in both generations The ethnic distribution by generation does not differ much by gender. Corresponding data disaggregated by sex are not shown but can be added on request. 9

12 Table 4: Ethnic Distribution by Generation Ethnic Origin 1.Gen 2.Gen Other Turkey Ex-Yugoslavia Greece Italy Spain Poland Russia Source: GSOEP, Integration Indicators 4.1 Empirical Model We now turn to the cultural indicators that can provide insights to the integration process of immigrants in Germany. The estimation methods used to measure the effect of ethnic groups and generations on selected indicators are based on simple pooled OLS and Logit techniques run on data during the period 2005 to Explanatory variables used in each model are dichotomous variables accounting for membership to one of the ethnic groups interacted with a dummy variable capturing belonging to the first or second immigrant generation. Additionally, three different birth cohorts are distinguished and included in the regression. The first cohort depicts immigrants born before 1942 who are older than 65 in The second birth group includes immigrants born between 1942 and In 2007 they are thus between 40 and 65. This group is set to be the base category in all estimations. Consequently, the last age group contains immigrants who are younger than 40 in The regression model includes years of schooling as an additional explanatory variable. 12 Native Germans are the ethnic reference group. Finally, each regression is run separately for men and women to account for possible gender peculiarities. The regression results are presented as tables within the text, figures visualizing these results are attached in the Appendix on pages 47 ff. 4.2 Education Table 5 shows the average years of schooling for each ethnic group and additionally differentiated by generation and gender. Accordingly, both male 11 In case there is no information available for 2005 to 2007, the most recent year is considered instead. 12 Except in the regression on the individual gender gap in education 10

13 and female second generation immigrants tend to have higher education than first generation immigrants. 13 The increase in education between generations is especially big (almost two additional years of schooling) for Greek immigrants. But still, even for Greek immigrants, average years of education are lower for immigrants regardless of gender compared to natives and this holds for the second generation as well. Turkish immigrants in particular have very low education levels, usually less than high school. That is, Turkish women have 9.29 years of schooling and men 9.93 years of schooling. In contrast, native women have on average years of education and men years. In general, immigrants from one of the guest worker countries have less education than more recent immigrant groups such as Poles or Russians indicating different patterns in the educational composition of more recent migration inflows. Table 5: Average Years of Schooling Women Men Ethnic Origin 1.Gen 2.Gen 1.Gen 2.Gen Other Germany Turkey Ex-Yugoslavia Greece Italy Spain Poland Russia no obs Source: GSOEP, Gender comparisons further show that in almost every ethnic group first generation men have more education than first generation women. Interestingly, the opposite is true for the econd generation at least for Turks, ex-yugoslavs and Poles. Second generation women from these ethnic groups have more years of schooling than their second generation male counterparts. For natives, gender differences in education can also be observed showing higher levels of education for German men than for German women. Considering, whether differences in education are not only present for ethnic groups in general but also between spouses and thus on an individual level, Table 6 reports the average gap in education between partners differentiated by ethnic group and immigrant generation. Here we consider only individuals who report living with a partner in the same household. The question is whether educational diversity is more common among immigrants than among natives. 13 With exception of Poles and Spaniards, but as mentioned before, these numbers might not be representative due to small sample sizes. 11

14 To that end, we construct a variable of the difference of own years of education minus years of education of the partner. A negative difference, as is usually the case for most first generation women, indicates that on average this gender group has less education than their partner. Consequently, for first generation immigrant men the education differences are mainly positive indicating more education for the husband compared to his wife. 14 Accordingly, first generation Turkish men have on average 0.31 more years of education than their partner; Turkish women who also belong to the first generation have an educational deficit of more than 0.6 years. In contrast, Turkish women who are born in Germany and hence part of the second generation, have even more education than their partners (0.55 years). For their second generation male counterparts the partner difference decreases compared to the parental generation to merely 0.13 more years of education but still remains positive. 15 Table 6: Individual Gap in Education between Spouses Women Men Ethnic Origin 1.Gen 2.Gen 1.Gen 2.Gen Other Germany Turkey Ex-Yugoslavia Greece Italy Spain Poland Russia 0.42 no obs Source: GSOEP, Table 7 shows estimation outcomes for the individual differences between spouses on the explanatory variables mentioned above 16 for men and women separately. Accordingly, the average difference in the education of native women who were born between 1942 and 1965 is negative indicating that women of this generation have less schooling than their partner. The difference decreases for younger birth cohorts ( cohort 3 ) and increases for older generations ( cohort 1 ). For Turkish women who were not born in 14 The numbers presented in Table 6 need not be identically reverse due to mixed marriages and different ethnic classifications for men and women. 15 Please note that there is no information available on the gender gap in education of second generation Russian immigrants. Please also keep in mind that results for Spanish immigrants might be biased due to small observation numbers. 16 Ethnic groups dummies interacted with generation dummies and dichotomous variables accounting for three different birth cohorts, born between 1942 and 1965 being the reference category 12

15 Germany ( turk1st ) the difference is greater and significantly different from native women indicating greater disparities between husband and wife in this ethnic group. In contrast, for second generation Turkish women the difference becomes positive implying better schooling levels for them compared to their partner. Similar patterns hold for female immigrants from ex-yugoslavia. Polish and Russian women are an exception in that they show better educational skills of wives compared to their husbands for the first generation already; at least for immigrants born after For men the picture is slightly different. As expected, German men between 40 and 65 have on average more years of schooling than their partners. While this educational gap is even bigger for older birth cohorts, it decreases and reverses for the youngest age group. Turkish, Greek and Italian men do not significantly differ from German men when it comes to education differences within the partnership, whereas for the remaining immigrant groups the difference in education decreases for both immigrant generations. First generation ex-yugoslavs as well as second generation Russian men are an exception. The decrease in the educational gap is even bigger for second generation individuals indicating more equality among partners in later immigrant generations. Summing up, the educational advantage of men over women is present and even increases for first generation immigrants compared to Germans. However, it vanishes or becomes negative for second generation individuals. These findings indicate that women in the second generation have on average better education in terms of years of schooling compared to their partners than women in their parental generation and hence converge towards more equal education levels within a partnership. 4.3 Marital Behavior Table 8, shows that most first generation immigrants are married and living in the same household as the partner whereas most second generation immigrants are single. This is not so much surprising and can be due to the different age structures in the two generations as can be seen from Table 9. On average, the first generation is slightly older than native Germans whereas the second generation is markedly younger. Turning to the marital behavior of the first generation we see that it differs noticeably from that of the native population. Especially Turkish immigrants show very high marriage rates. For instance, among first generation Turkish men the share of those living with a partner is percent compared to 17 There is no information available for second generation Russian women. 13

16 Table 7: Individual Gap in Education between Spouses Ethnic Origin Women Men other1st (0.0825) (0.0888) other2nd (0.2950) (0.2648) turk1st (0.1074) (0.1026) turk2nd (0.2616) (0.2668) yugos1st (0.1552) (0.1555) yugos2nd (0.3564) (0.4363) greek1st (0.2396) (0.2293) greek2nd (0.4662) (0.5255) italian1st (0.2080) (0.1689) italian2nd (0.2957) (0.3601) spaniard1st (0.4828) (0.3758) spaniard2nd (0.9300) (0.7424) pole1st (0.1467) (0.1640) pole2nd (0.5976) (1.1012) russian1st (0.1712) (0.1790) russian2nd (1.4209) Icohort (0.0453) (0.0415) Icohort (0.0419) (0.0453) cons (0.0241) (0.0243) N r F ll e e+04 OLS Regression, years Standard errors in parentheses p < 0.05, p < 0.01, p <
 pole1st 0.4233-0.3851 (0.1467) (0.1640) pole2nd -0.1262-2.6499 (0.5976) (1.1012) russian1st 0.8640-0.5805 (0.1712) (0.1790) russian2nd 2.5827 (1.4209) Icohort 1-0.6578 0.5761 (0.0453) (0.")
17 Table 8: Marital Behavior Women 1. Gen 2. Gen Ethnic Origin Single Married Single Married Other Turkey Ex-Yugoslavia Greece Italy Spain Poland Russia Germany Men 1. Gen 2. Gen Ethnic Origin Single Married Single Married Other Turkey Ex-Yugoslavia Greece Italy Spain Poland Russia Germany Source: GSOEP, a marriage rate of only percent for German men. First generation women exhibit a similar marital behavior to men of the same ethnic group with marriages rates mostly at or above 60 percent. In contrast, second generation women have marriage rates only around 25 to 35 percent. They are noticeably higher (between 34 and 37 percent) for immigrants from the former guest worker countries. For second generation men marriage rates are somewhat smaller especially for Poles and Russians. Only percent of Turkish men have similar marriage rates to their female counterparts. For natives, there are hardly any differences in the marital behavior of men and women. The share of married Germans is almost 50 percent indicating a higher tendency of natives towards singledom compared to immigrants. These descriptive findings are confirmed in the estimation results presented in Table 10. Regardless of gender, first generation immigrants tend to be more likely to be married than Germans whereas second generation immigrants seem to be less likely to be living with a partner. Polish women and Spanish men are the only groups whose marital behavior does not differ from that of natives irrespective of generation. And also second generation Turks show no significant deviations from Germans with respect to marital behavior. 15

18 Table 9: Average Age Women Men Ethnic Origin 1.Gen 2.Gen 1.Gen 2.Gen Other Germany Turkey Ex-Yugoslavia Greece Italy Spain Poland Russia Source: GSOEP, Intermarriage Analyzing differences in marital behavior even further, Table 11 shows that the type of marriage differs noticeably by immigrant generation and ethnic group. Intermarriage in this course is defined as the living partnership of an immigrant with a native German. Consequently, a marriage between for instance a Greek and a Turkish immigrant is not considered intermarriage. This restrictive definition is based on the assumption that intermarriage is supposed to indicate integration to the German society. An immigrant who is living with a native partner possibly signals greater commitment to Germany than an immigrant who marries another immigrant or even marries within his or her own ethnic community. 18 Among those who are married, intermarriage rates are especially low for first generation Turks ranging between 1.94 percent for first generation women and 5.79 percent for men. In contrast, Italian men show comparably high intermarriage rates of to percent already in the first generation possibly indicating better integration of Italians compared to Turks. But one should note that low intermarriage rates need not automatically indicate low integration ability, but is highly related to the availability of a partner within the own ethnic group. Thus, immigrants who belong to a dominant immigrant group, as do Turks, might simply face a bigger market of potential partners with the same ethnic background which decreases the probability to intermarry. This argument is supported by the intermarriage rates of Germans - as the biggest ethnic group. German men only show intermarriage rates of 4.49 percent and German women even lower (3.89 percent). 18 For further research on intermarriage see e.g. Kalmijn (1998) [24]; Lievens (1998) [28] and (1999) [29]; Kantarevic (2004) [26]; Meng and Gregory (2005) [31]; Meng and Meurs (2006) [32]; Gonzáles-Ferrer (2006) [23]; Chiswick and Houseworth (2008) [19]; Furtado and Theodoropoulos (2008) [22]; Furtado (2009) [21] 16

19 Table 10: Marriage Probability Women Men other1st (d) (0.0119) (0.0107) other2nd (d) (0.0348) (0.0331) turk1st (d) (0.0106) (0.0063) turk2nd (d) (0.0341) (0.0229) yugos1st (d) (0.0217) (0.0173) yugos2nd (d) (0.0453) (0.0503) greek1st (d) (0.0273) (0.0281) greek2nd (d) (0.0617) (0.0627) italian1st (d) (0.0326) (0.0168) italian2nd (d) (0.0391) (0.0409) spaniard1st (d) (0.0746) (0.0551) spaniard2nd (d) (0.1132) (0.0586) pole1st (d) (0.0222) (0.0217) pole2nd (d) (0.0761) (0.1168) russian1st (d) (0.0233) (0.0213) russian2nd (d) (0.2119) Icohort 1 (d) (0.0076) (0.0072) Icohort 3 (d) (0.0068) (0.0067) bilzeit (0.0011) (0.0010) N r2 F ll e e+04 Logit Regression, years Marginal effects; Standard errors in parentheses (d) for discrete change of dummy variable from 0 to 1 p < 0.05, p < 0.01, p <
 pole1st (d) 0.0348 0.0559 (0.0222) (0.0217) pole2nd (d) -0.0733-0.3785 (0.0761) (0.1168) russian1st (d) 0.0745 0.0599 (0.0233) (0.0213) russian2nd (d) -0.2500 (0.2119) Icohort 1 (d) -0.2617 0.")
20 Therefore, it is important to also look at differences by generation and thus behavior over time. Second generation immigrants who were born and thus had the opportunity to socialize with natives all their lives, are expected to be more likely to intermarry than immigrants who migrated to Germany possibly already married to another immigrant. This assumption is actually supported by empirical findings for all immigrant groups. Second generation Greeks and Spaniards show lower intermarriage rates compared to the parental generation. For all remaining ethnic groups, second generation immigrants are more likely to be married to a native than immigrants from their parental generation indicating greater mixing with the native population of the younger generations. Thereby, the increase in intermarriage rates between generations is especially big for Turkish men. In contrast, Greek women are less likely to intermarry even if they belong to the second generation. Table 12 shows estimation results from logistic regressions on the probability to intermarry. When comparing martial behavior by ethnic group and generation with that of natives, immigrant men show a higher probability to intermarry than Germans. With the exception of Turkish and Greek women of either generation, this also holds for immigrant women. The likelihood to intermarry is in general bigger for second generation immigrants than for the first generation. This suggests that immigrants born in the host country show more willingness to integrate in the marriage market than members of their parental generation. The only exception is Turkish women, who behave just like Germans regardless of the generation. 4.5 Age at First Marriage Not only are there differences by immigrant group regarding partner choice, but also with respect to age at first marriage. Table 13 reports the share of people who are older than 25 but were first married before the age of 25. Our results show that first generation immigrants are more likely to be married before the age of 25 regardless of gender than individuals of later generations. Marriage rates at age 25 for that group are at or above 70 percent for most immigrant groups and even higher for Turks. Thus, almost 89 percent of first generation Turkish women were married before the age of 25. In sharp contrast, less than 57 percent of the native women were married before the age of 25. In general, the second generation shows lower shares of individuals who marry prior to their 25 th birthday and a higher tendency towards marriage at later ages. The exception here are Spanish and Italian 18

21 Table 11: Intermarriage Rates Women Ethnic Origin Intermarriage Intra-ethnic no Class. Other 1.Gen Gen Turkey 1.Gen Gen Ex-Yugoslavia 1.Gen Gen Greece 1.Gen Gen Italy 1.Gen Gen Spain 1.Gen Gen Poland 1.Gen Gen Russia 1.Gen Gen Germany Men Ethnic Origin Intermarriage Intra-ethnic no Class. Other 1.Gen Gen Turkey 1.Gen Gen Ex-Yugoslavia 1.Gen Gen Greece 1.Gen Gen Italy 1.Gen Gen Spain 1.Gen Gen Poland 1.Gen Gen Russia 1.Gen Gen Germany Source: GSOEP, , only persons who report a partner 19
22 Table 12: Intermarriage Probability Ethnic Origin Women Men other1st (d) (0.0138) (0.0153) other2nd (d) (0.0341) (0.0327) turk1st (d) (0.0084) (0.0123) turk2nd (d) (0.0189) (0.0319) yugos1st (d) (0.0212) (0.0208) yugos2nd (d) (0.0409) (0.0460) greek1st (d) (0.0287) greek2nd (d) (0.0252) (0.0424) italian1st (d) (0.0319) (0.0316) italian2nd (d) (0.0371) (0.0460) spaniard1st (d) (0.0747) (0.0618) spaniard2nd (d) (0.1094) (0.0883) pole1st (d) (0.0230) (0.0243) pole2nd (d) (0.0833) (0.0862) russian1st (d) (0.0230) (0.0138) russian2nd (d) (0.1929) Icohort 1 (d) (0.0022) (0.0025) Icohort 3 (d) (0.0019) (0.0023) bilzeit (0.0003) (0.0004) N r2 F ll Logit Regression, years Marginal effects; Standard errors in parentheses (d) for discrete change of dummy variable from 0 to 1 p < 0.05, p < 0.01, p <
23 immigrants. 19 Compared to natives, estimates presented in Table 14 and the corresponding Figures show that for women there is no statistically significant difference in the probability to be married before the age of 25 between Germans and second generation immigrants; Turkish women being an exception. In contrast, first generation immigrants seem to be more likely to be married young compared to natives. We find positive and significant effects for Turkish, Greek, Polish and Russian woman as well as for men from Turkey, the former Yugoslavia, Greece and Poland. While this confirms the different marriage behavior of first generation immigrants, there is no difference in marriage behavior between Germans and the second generation. 4.6 Age Gap between Spouses We now turn our attention to age disparities between partners, because partner constellations might be different with respect to age of the spouses. Immigrants living in a partnership were age differences between partners are about the same as for Germans might reflect greater adoption of German norms and marital habits and thus more social integration. Table 15, shows that the age gap between spouses differs moderately by generation and ethnic origin. For Germans, the average age gap between partners is about 2.7 years. For most first generation immigrants from the guest worker countries the difference is slightly bigger with a maximum average difference being 4 years for Greeks. For Poles and Russian the marital age difference is mainly smaller than among natives. For second generation immigrants the difference between partners is smaller except among Italians as well as Spanish and Polish women. Controlling for educational levels and birth cohorts, estimation coefficients presented in Table 16 indicate that among first generation Italian and Greek women the difference in the spouses age widens, whereas it decreases for Spanish, Polish and Russian women. This is partly confirmed by findings for men. Here, the difference increases for first generation Turk, ex-yugoslav, Greek and Italian men but diminishes for first generation Russians. There is hardly any difference between spousal age gaps of natives and second generation individuals, second generation Turkish women being an exception. 19 Please not that there is no information available about the marriage behavior of second generation Polish immigrants. 21
24 Table 13: Married before the Age of 25 Share of Women Ethnic Origin not married before 25 married before 25 Other 1.Gen Gen Turkey 1.Gen Gen Ex-Yugoslavia 1.Gen Gen Greece 1.Gen Gen Italy 1.Gen Gen Spain 1.Gen Gen Poland 1.Gen Gen Russia 1.Gen Gen Germany Share of Men Ethnic Origin not married before 25 married before 25 Other 1.Gen Gen Turkey 1.Gen Gen Ex-Yugoslavia 1.Gen Gen Greece 1.Gen Gen Italy 1.Gen Gen Spain 1.Gen Gen Poland 1.Gen Gen Russia 1.Gen Gen Germany Source: GSOEP, , only persons older 25 22
25 Table 14: Probability of being first married before 25 Women Men other1st (d) (0.0145) (0.0172) other2nd (d) (0.0473) (0.0339) turk1st (d) (0.0156) (0.0190) turk2nd (d) (0.0252) (0.0376) yugos1st (d) (0.0286) (0.0301) yugos2nd (d) (0.0556) (0.0637) greek1st (d) (0.0450) (0.0380) greek2nd (d) (0.0720) (0.0904) italian1st (d) (0.0398) (0.0295) italian2nd (d) (0.0491) (0.0622) spaniard1st (d) (0.0733) (0.0616) spaniard2nd (d) (0.1492) (0.1184) pole1st (d) (0.0244) (0.0316) pole2nd (d) (0.1016) russian1st (d) (0.0262) (0.0328) Icohort 1 (d) (0.0079) (0.0074) Icohort 3 (d) (0.0075) (0.0065) bilzeit (0.0012) (0.0012) N r2 F ll e e+04 Logit Regression, years Marginal effects; Standard errors in parentheses (d) for discrete change of dummy variable from 0 to 1 p < 0.05, p < 0.01, p <
26 Table 15: Average Age Gap between Spouses Women Men Ethnic Origin 1.Gen 2.Gen 1.Gen 2.Gen Other Germany Turkey Ex-Yugoslavia Greece Italy Spain Poland Russia no obs Source: GSOEP, , only persons reporting a partner 4.7 Number of Children In addition, we find that differences exist in the family structure namely with respect to the number of children per women. These differences are not only between natives and immigrants but also among ethnic groups. As documented in Table 17 first generation Turkish women have on average more children than women from any other country and in particular more children than natives. 20 The average number of children for German women is less than 2 whereas for first generation Turkish women is more than 3. The number of children per women in the second generation is in general lower than in the first generation. Interestingly, it is mostly also smaller than for natives. Turkish women are among those who have higher birth rates than natives even among the second generation. For Greek, Italian and ex-yugoslavs the average number of children per women is noticeably smaller in later immigrant cohorts. As it can be seen from estimation results presented in Table 18 differences in the number of children are mainly statistically significant for first generation immigrant women, who have consistently more children than natives. This is especially true for first generation Turkish women who have on average one more child than German women do. For second generation female Turks the effect is not significant. Negative trends can be observed for second generation immigrants from the former Yugoslavian countries. In general, for Spaniards, Greeks and the second generation the number of children does not significantly differ from natives. This indicates that later immigrant generations integrate not only with respect to marriage behavior such as the age gap between spouses, age at marriage and marriage probability but also with regards to family structure such as the number of children. 20 The numbers presented refer to women older than 40 24
27 Table 16: Age Gap between Spouses Women Men other1st (0.1481) (0.1586) other2nd (0.4969) (0.4574) turk1st (0.1989) (0.1853) turk2nd (0.4645) (0.4609) yugos1st (0.2674) (0.2774) yugos2nd (0.6162) (0.7646) greek1st (0.4342) (0.4072) greek2nd (0.8396) (0.9035) italian1st (0.3764) (0.3015) italian2nd (0.5168) (0.6157) spaniard1st (0.8686) (0.6594) spaniard2nd (1.7048) (1.1650) pole1st (0.2627) (0.2962) pole2nd (1.0102) (2.0179) russian1st (0.3007) (0.3212) russian2nd (.) (2.6037) Icohort (0.0832) (0.0748) Icohort (0.0739) (0.0806) bilzeit (0.0122) (0.0112) cons (0.1585) (0.1518) N r F ll e e+04 OLS Regression, years Standard errors in parentheses p < 0.05, p < 0.01, p <
28 Table 17: Average Number of Children per Women Ethnic Origin 1.Gen 2.Gen Other Germany 1.84 Turkey Ex-Yugoslavia Greece Italy Spain Poland 2.01 no obs Russia 2.56 no obs Source: GSOEP, , only women older Age at First Child Apart from marital behavior and family composition, birth behavior might also give insights to the cultural adaptation and integration success. Considering the age at first child as depicted in Table 19, first generation immigrant women seem to be only slightly younger when they give birth to their first child compared to natives, whereas second generation women seem to be a little older. Again, Turkish women stand out with a comparably young age at first child; on average for the first generation. Interestingly, the age at first child is much higher for the second generation Turkish women (27 years of age). In comparison, German women give birth to their first child at the age of 25 on average. Results from a simple regression support the first impression of hardly any differences between immigrants and natives. The difference in age at first child almost vanishes for all second generation immigrants. It differs significantly from natives only for a few immigrants groups such as Spaniards (Table 20). 4.9 Religion Turning now from family matters to religious aspects, Table 21 shows the distribution of religious beliefs within each ethnic group differentiated by gender and generation. It is obvious from this table that no religious differences can be observed between men and women or between first and second generation immigrants within a single ethnic group. That is, regardless of gender or generation the majority of Turkish immigrants who report a religion are Muslims, most Italian, Spanish and Polish immigrants are Catholic and the majority of Russian immigrants are Christian Orthodox. Among Germans, Protestants are a slight majority closely followed by Catholics. 26
29 Table 18: Number of children Ethnic Origin Women older 40 other1st (0.0437) other2nd (0.2115) turk1st (0.0697) turk2nd (0.7114) yugos1st (0.0747) yugos2nd (0.3901) greek1st (0.1198) greek2nd italian1st (0.4660) (0.0963) italian2nd (0.2629) spaniard1st (0.1820) spaniard2nd (0.5033) pole1st (0.0766) pole2nd (.) russian1st (0.0899) russian2nd (.) Icohort (0.0189) Icohort bilzeit cons (0.0877) (0.0034) (0.0437) N r F ll e+04 OLS Regression, years Standard errors in parentheses p < 0.05, p < 0.01, p <
30 Table 19: Age at first Child Ethnic Origin 1.Gen 2.Gen Other Germany Turkey Ex-Yugoslavia Greece Italy Spain Poland Russia Source: GSOEP, , only women older Language Proficiency Language proficiency of the host country has been proven to be of paramount importance for social and economic integration. Using GSOEP s subjective answers on language (both oral and written), we measure linguistic abilities on a scale from 1 to 5, where 1 denotes very good language ability and 5 a very poor one. In general, reported written skills are worse than speaking abilities regardless of ethnic group and immigrant generation. These statistics are presented in Table 22. They refer to 2005 wave, the most recent year with information on language proficiency. It is assumed that second generation immigrants should have better languages skills than first generation immigrants since by definition immigrants who belong to the second generation were born in Germany and therefore mostly attended school and further education in Germany. As expected, their reported language abilities are higher regarding both spoken and written use of German regardless of ethnic group. This shows a positive linguistic integration of second generation immigrants. Linguistic comparisons by ethnic groups show that Turks have the lowest German language proficiency among all ethnic groups. They seem to be the least integrated with respect to language. A possible explanation is related to the fact that language proficiency is self-reported and might impose measurement errors and group specific characteristics. Some immigrant groups might overstate their abilities whereas other groups might continuously understate their skills. This might bias the results. Another explanation relies on the reported information, the low language abilities of Turks might be induced by group size and enclave effects. Since Turks represent the largest single ethnic group in Germany, they are more likely to socialize within their ethnic community and do not need to put much effort into learning the German language in order to manage everyday life situations. Thus, poor language abilities might indeed signal less integration and more ethnic segregation 28
31 Table 20: Age at 1st child (1) Ethnic Origin Women older 40 other1st (0.1713) other2nd (0.8393) turk1st (0.2712) turk2nd (2.6516) yugos1st (0.2938) yugos2nd (1.8760) greek1st (0.4666) greek2nd (2.2979) italian1st (0.3613) italian2nd spaniard1st (1.1492) (0.7372) spaniard2nd (1.8762) pole1st (0.2917) pole2nd (.) russian1st (0.3482) russian2nd (.) Icohort 1 Icohort 3 bilzeit cons (0.0746) (0.3544) (0.0138) (0.1762) N r F ll e+04 OLS Regression, years Standard errors in parentheses p < 0.05, p < 0.01, p <
32 Table 21: Religious Distribution Women Ethnic Origin Catholic Protestant Other Christ. Islam Other Rel. Undenom. Others 1.Gen 32,75 35,81 9,17 3,28 2,18 16,81 2.Gen 33,71 41,57 2,25 3,37 0,00 19,10 Turkey 1.Gen 0,47 0,00 2,37 87,20 1,42 8,53 2.Gen 0,00 1,37 2,74 84,93 1,37 9,59 Ex-Yugoslavia 1.Gen 43,09 4,07 24,39 20,33 0,00 8,13 2.Gen 36,36 4,55 20,45 20,45 0,00 18,18 Greece 1.Gen 0,00 0,00 92,31 5,13 0,00 2,56 2.Gen 8,33 12,50 75,00 0,00 0,00 4,17 Italy 1.Gen 83,08 3,08 6,15 0,00 0,00 7,69 2.Gen 80,70 10,53 8,77 0,00 0,00 0,00 Spain 1.Gen 93,33 6,67 0,00 0,00 0,00 0,00 2.Gen 100,00 0,00 0,00 0,00 0,00 0,00 Poland 1.Gen 81,95 8,27 1,50 0,75 0,00 7,52 2.Gen 50,00 16,67 0,00 5,56 0,00 27,78 Russia 1.Gen 19,23 51,92 17,31 0,00 2,88 8,65 2.Gen 0,00 100,00 0,00 0,00 0,00 0,00 German 28,99 39,40 1,23 0,08 0,05 30,25 Men Catholic Protestant Other Christ. Islam Other Rel. Undenom. Others 1.Gen 28,29 34,45 7,84 5,60 1,96 21,85 2.Gen 38,46 28,57 0,00 4,40 0,00 28,57 Turkey 1.Gen 0,93 0,00 0,93 88,43 1,39 8,33 2.Gen 0,00 0,00 7,14 81,43 4,29 7,14 Ex-Yugoslavia 1.Gen 29,36 1,83 25,69 32,11 0,00 11,01 2.Gen 43,75 9,38 18,75 21,88 0,00 6,25 Greece 1.Gen 0,00 0,00 88,64 4,55 0,00 6,82 2.Gen 4,00 8,00 68,00 4,00 0,00 16,00 Italy 1.Gen 90,24 2,44 2,44 0,00 0,00 4,88 2.Gen 81,25 8,33 4,17 0,00 0,00 6,25 Spain 1.Gen 89,47 0,00 0,00 0,00 0,00 10,53 2.Gen 41,67 25,00 0,00 0,00 0,00 33,33 Poland 1.Gen 75,26 6,19 3,09 0,00 0,00 15,46 2.Gen 53,85 15,38 0,00 7,69 0,00 23,08 Russia 1.Gen 23,33 51,11 10,00 0,00 2,22 13,33 2.Gen 0,00 100,00 0,00 0,00 0,00 0,00 German 27,46 34,86 0,95 0,10 0,15 36,47 Source: GSOEP, , only women older 40 30
33 among Turks. Differences by gender within each ethnic group are straightforward. Namely, first generation women have better German language skills than comparable men of Spanish, Polish and Russian origin in contrast to worse self-reported skills among the other immigrant groups within the first generation. In the second generation, German language abilities seem to be mostly better for women than for men regardless of ethnic group in both spoken and written use of language. Concerning the language of the country of origin the opposite results are true. Here it is the first generation immigrants that reports better language abilities. This can be explained through the greater attachment of this generation to their home country, the fact that they were raised with this language and the possibility that even if some of them were illiterate, they still know how to speak the origin language but it would be much more difficult to learn a foreign language. 21 Table 22: Language Proficiency German Language Language of Country of Origin Women Men Women Men Ethnic Origin 1.Gen 2.Gen 1.Gen 2.Gen 1.Gen 2.Gen 1.Gen 2.Gen Speaking Speaking Other Turkey Ex-Yugoslavia Greece Italy Spain Poland 1.68 no obs 1.88 no obs 1.74 no obs 1.75 no obs Russia 1.89 no obs no obs Writing Writing Other Turkey Ex-Yugoslavia Greece Italy Spain Poland 1.91 no obs 2.20 no obs 2.10 no obs 2.19 no obs Russia 2.21 no obs no obs Scale from 1 (very good) to 5 (none at all) Source: GSOEP, For further research on the impact of language on earnings see e.g. Chiswick and Miller (1995) [17]; Chiswick and Miller (1998) [18]; Dustmann and van Soest (2002) [20] 31
34 4.11 Political Interest The degree of political interest of a country s population can be extremely informative when we look at integration processes. Table 23 depicts immigrants and Germans political interest in It is measured on a scale from 0 to 4, where 1 refers to very interested and 4 to completely disinterested. Most immigrants show less interest in politics than natives. Turks in particular, show a comparably low interest in politics regardless of immigrant generation, whereas Poles seem to be the most interested in politics. Comparisons across generations show that the second generation tends to be more politically interested than the first one indicating again a greater commitment to Germany of later generations. Table 23: Political Interest Women Men Ethnic Origin 1.Gen 2.Gen 1.Gen 2.Gen Other Germany Turkey Ex-Yugoslavia Greece Italy Spain Poland Russia Scale from 1 (very interested) to 4 (not at all interested) Source: GSOEP, 2005 Running a simple regression on the degree of political interest (Table 24) confirms the descriptive statistics picture. Accordingly, the index increases for almost all immigrant groups regardless of gender implying lower political interest for most immigrant groups compared to natives. But since the increase is stronger for the first compared to the second generation within each ethnic group the assumption that second generation immigrants are more interested in politics is supported by these results. Indeed, later generations exhibit greater concern in political and social processes in Germany and thus better political integration among those immigrants born in Germany Self-Identification with Germany That the second generation is more integrated becomes also visible from Tables 25 and 26 that report self-identification with Germany and with the country of origin. Identification is measured on a scale from 1 to 5, where 1 refers to complete identification with either Germany or the country of ancestry and 5 refers to no identification with the respective country. 32
35 Table 24: Political interest Ethnic Origin Women Men other1st (0.0200) (0.0244) other2nd (0.0482) (0.0493) turk1st (0.0293) (0.0302) turk2nd (0.0555) (0.0592) yugos1st (0.0368) (0.0428) yugos2nd (0.0654) (0.0796) greek1st (0.0623) (0.0655) greek2nd (0.0867) (0.0946) italian1st (0.0514) (0.0480) italian2nd (0.0577) (0.0676) spaniard1st (0.1030) (0.0953) spaniard2nd (0.1636) (0.1366) pole1st (0.0357) (0.0455) pole2nd (0.1174) (0.1412) russian1st (0.0415) (0.0482) russian2nd (.) (0.2918) Icohort (0.0105) (0.0118) Icohort (0.0095) (0.0108) bilzeit (0.0016) (0.0017) cons (0.0211) (0.0227) N r F ll e e+04 OLS Regression, year 2005 Standard errors in parentheses p < 0.05, p < 0.01, p <
36 As depicted in these two tables the second generation has a clear tendency toward more identification with Germany and less identification with the country of the parents origin. This tendency is noticeable for all immigrant groups. Looking within ethnic groups one can see that especially Poles and Russians show a great commitment to Germany whereas Turks and Greeks still feel closely bound to their country of origin. Table 25: Identification with Germany Women Men Ethnic Origin 1.Gen 2.Gen 1.Gen 2.Gen Other Turkey Ex-Yugoslavia Greece Italy Spain Poland 2.03 no obs 1.93 no obs Russia 1.65 no obs 1.60 no obs Scale from 1 (complete identification) to 5 (no identification) Source: GSOEP, 1999 Table 26: Identification with Country of Origin Women Men Ethnic Origin 1.Gen 2.Gen 1.Gen 2.Gen Other Turkey Ex-Yugoslavia Greece Italy Spain Poland 3.15 no obs 3.22 no obs Russia 3.16 no obs 3.53 no obs Scale from 1 (complete identification) to 5 (no identification) Source: GSOEP, Risk Behavior Turning now to more general differences in characteristics between immigrants and Germans, Table 27 shows self-reported information about their risk attitudes. Studies have shown that adaptation to the attitudes of the majority population closes the immigrant-native gap in risk proclivity, while stronger commitment to the home country preserves it (Bonin et al., 2006 [6] and Bonin (2006) [6]). As risk attitudes are behaviorally relevant, and vary by ethnic origin, these findings could help explain differences in the socioeconomic assimilation of immigrants. The risk loving tendencies of people are 34
37 measured on a scale from 0 to 10 where 0 refers to completely risk averse and 10 to completely risk loving. We find that second generation immigrants seem to be more risk loving than their first generation counterparts. This generation difference is especially pronounced for female Turks. The average risk level of first generation Turks is 2.57 and thus on the lower level of the scale whereas the average value for second generation Turkish women is 4.15 and therefore very close to the average value of native women (4.07). In general first generation immigrants seem to be more risk averse than Germans whereas second generation immigrants tend to be as risk loving as natives or even more. Table 27: Risk Attitude Women Men Ethnic Origin 1.Gen 2.Gen 1.Gen 2.Gen Other Germany Turkey Ex-Yugoslavia Greece Italy Spain Poland Russia Scale from 0 (completely risk averse) to 10 (completely risk loving) Source: GSOEP, 2005 These raw statistics are supported by estimation results as shown in Table 28. The risk index is smaller for most first generation women - except Spaniards - compared to natives indicating more risk aversion. Among second generation women, only Turkish, Polish and ex-yugoslav women differ from natives. For men, the picture is slightly different. Second generation men seem not to differ at all from natives, whereas first generation Turks, Greeks, ex-yugoslavs and Russians tend to be more risk averse than German men. Especially men and women who belong to the first generation Turks, Greeks and Russians show high levels of risk aversion compared to natives. These results may clash with what was previously believed or to what intuition would predict but are in line with previous studies. Bonin et al. (2009) [7] confirm that first-generation migrants have lower risk attitudes than natives, which only equalize in the second generation. One explanation could be related to the first generation s insecurities in their social and economic situation in Germany. Yes, first generation immigrants may have been more risk takers than their co-ethnics who never left the home county, but this risk could subside once they arrived in the host country. 35
38 Table 28: Risk Attitude Ethnic Origin Women Men other1st (0.0658) (0.0741) other2nd (0.1558) (0.1454) turk1st (0.0936) (0.0893) turk2nd (0.1816) (0.1849) yugos1st (0.1177) (0.1267) yugos2nd (0.2124) (0.2417) greek1st (0.1955) (0.1946) greek2nd (0.2730) (0.2847) italian1st (0.1635) (0.1425) italian2nd (0.1915) (0.2072) spaniard1st (0.3204) (0.2800) spaniard2nd (0.5173) (0.4052) pole1st (0.1154) (0.1367) pole2nd (0.3885) (0.4440) russian1st (0.1371) (0.1498) russian2nd (.) (0.9911) Icohort (0.0340) (0.0355) Icohort (0.0315) (0.0334) bilzeit (0.0053) (0.0051) cons (0.0691) (0.0693) N r F ll e e+04 OLS Regression, year 2005, Scale 0 to 10 Standard errors in parentheses p < 0.05, p < 0.01, p <
39 4.14 Overall Life Satisfaction With respect to overall life satisfaction Table 29 shows that there is not much difference between immigrants and natives. Life satisfaction is also measured on a scale from 0 to 10 where 0 denotes complete dissatisfaction and 10 complete satisfaction. Second generation immigrants score, on average, greater values on that index (at or even above 7). Evidently, they tend to be more satisfied in life than their parents who were born abroad. The life satisfaction values of natives lie somewhere in between the values of first and second generation immigrants. Table 29: Overall Life Satisfaction Women Men Ethnic Origin 1.Gen 2.Gen 1.Gen 2.Gen Other Germany Turkey Ex-Yugoslavia Greece Italy Spain Poland Russia Scale from 0 (completely dissatisfied) to 10 (completely satisfied) Source: GSOEP, Estimation outputs in Table 30 show hardly any significant deviation between immigrants and natives. It is only for some groups such as the first generation Turks and first generation ex-yugoslav men that the index decreases indicating a lower life satisfaction for these immigrants than for Germans. The deviation from natives is especially big for first generation Turks of either gender. In contrast, immigrants such as second generation Italian women and first generation Russians seem to be more satisfied than natives. Overall, we find that immigrants integrate perfectly in terms of self-reported life satisfaction Female Labor Force Participation Finally, we consider the economic integration of the German population. Table 31 reports the female labor force participation by ethnic group and generation. The variable used equals one if the individual is working fullor part-time and zero if that individual is unemployed or irregularly working. Schooling and no information are coded as missing. The underlying sample is restricted to women older than 20 and under 65. The share of women working full-or part-time differs noticeably by immigrant group and 37
40 Table 30: Overall Life Satisfaction Ethnic Origin Women Men other1st (0.0502) (0.0559) other2nd (0.1208) (0.1126) turk1st (0.0735) (0.0690) turk2nd (0.1393) (0.1355) yugos1st (0.0923) (0.0979) yugos2nd (0.1642) (0.1823) greek1st (0.1569) (0.1495) greek2nd (0.2191) (0.2166) italian1st (0.1293) (0.1100) italian2nd (0.1442) (0.1548) spaniard1st (0.2584) (0.2181) spaniard2nd (0.4104) (0.3128) pole1st (0.0894) (0.1044) pole2nd (0.2945) (0.3233) russian1st (0.1042) (0.1106) russian2nd (.) (0.6680) Icohort (0.0264) (0.0270) Icohort (0.0239) (0.0247) bilzeit (0.0041) (0.0039) cons (0.0529) (0.0520) N r F ll e e+04 OLS Regression, years , Scale 0 to 10 Standard errors in parentheses p < 0.05, p < 0.01, p <
41 generation. Only percent of first generation Turkish women work fullor part-time, whereas in later generations the share is 10 percentage points higher, namely percent. Similar differences can be observed for ex- Yugoslav women. Here the difference between first and second generation also amounts to about 10 percentage points; it is and percent respectively. Clearly, labor market participation is higher for second generation immigrants from these groups. However, it is still much lower than the labor force participation rate of native women (about 50 percent). The exception is Greek women who have higher labor market participation rates than German women in both generations. It is interesting that first generation Greek women have higher labor market participation rates than later generations. Similarly, first generation Italian women show very high participation rates of over 50 percent. Table 31: Female Labor Force Participation Ethnic Origin Full- or Part-time Unempl. or Irreg. Empl. Schooling or no Info Other 1.Gen Gen Turkey 1.Gen Gen Ex-Yugoslavia 1.Gen Gen Greece 1.Gen Gen Italy 1.Gen Gen Spain 1.Gen Gen Poland 1.Gen Gen Russia 1.Gen Gen Germany Source: GSOEP, , women between 20 and 65 Estimation results presented in Table 32 corroborate these raw statistics. Accordingly, first generation Italian, Greek and Polish women are more likely to work than natives. Turkish women are less likely to work compared to Germans regardless of generation. This indicates lower economic integration by some immigrant groups but also very good labor market integration by others. In general, there are hardly any differences between second generation immigrants and natives with respect to full- or part-time work for those who are not in school and for whom information about labor market status is available. 39
42 Table 32: Female labor force participation Ethnic Origin Women between 20 and 65 other1st (d) (0.0160) other2nd (d) (0.0384) turk1st (d) (0.0229) turk2nd (d) (0.0430) yugos1st (d) (0.0282) yugos2nd (d) (0.0479) greek1st (d) (0.0397) greek2nd (d) italian1st (d) (0.0650) (0.0372) italian2nd (d) (0.0421) spaniard1st (d) (0.0851) spaniard2nd (d) (0.1318) pole1st (d) (0.0265) pole2nd (d) (0.0894) russian1st (d) (0.0335) Icohort 1 (d) Icohort 3 (d) bilzeit (0.0105) (0.0070) (0.0014) N r2 F ll e+04 Logit Regression, years Marginal effects; Standard errors in parentheses (d) for discrete change of dummy variable from 0 to 1 p < 0.05, p < 0.01, p <
43 5 Conclusion This chapter studies the cultural integration of immigrants in Germany. To gauge integration, we use natives as the gold standard and refer to them every time we look at the cultural and general socio-economic and political progress of immigrants. We cover various social and economic aspects of the life of immigrants in Germany using data from the German Socio Economic Panel (GSOEP) for the period 2005 to Specifically, we study marital behavior, family structure, soft skills such as risk attitudes and overall life satisfaction, German language proficiency and self-identification as well as economic characteristics such as female labor force participation. In order to capture trends and developments over time we analyze and study these indicators of socio-cultural and economic aspects for first and second immigrant generations. Additionally, emphasis was put on differences between certain immigrant groups, in particular immigrants who originate from the former guest worker countries as well as immigrants from Poland and Russia who represent more recent influences in immigrant inflows to Germany. We examined and presented both raw statistics and estimation results on the above mentioned indicators. Considering marriage patterns is crucial in the integration process of immigrants 22 since marriage and partner choice express individual commitment and attachment to the members of a host country s society at a very intimate level. Convergence between immigrants and natives with respect to family behavior signals to what extend immigrants adapt to German specific norms and embrace German habits. Empirical results imply trends towards more singledom among native Germans. This trend seems to be adopted by the second generation. Similar findings are observed regarding age at first marriage and the age and education gap between spouses. Accordingly, first generation immigrants tend to be married more often and at younger ages than natives and the second generation. Clearly, they seem to cling to different role allocations and traditions than Germans and their offspring generation. 23 Age gaps and educational differences between partners are greater for older generations and mostly not different from natives for younger cohorts. Intermarriage rates depict a deep entanglement between immigrants and the native population. This can be seen as a special integration measure fostering economic integration. In general, the bigger the single ethnic group the less likely their 22 For further research on the effect of marriage on economic success see e.g. Korenmann and Neumark (1991) [27]; Angrist (2002) [2] 23 see e.g. Backer and Benjamin (1997) [3] for differences in the human capital accumulation of immigrants. 41
44 members are to intermarry. This holds especially for Turks and members of the native population who show the lowest rate of intermarriage among all ethnic groups. Furthermore, fertility rates, age at first child and female labor force participation differ significantly between natives and first generation immigrants indicating different conceptions of gender roles and work allocation within the family between these groups. Differences vanish or at least diminish for later immigrant generations implying greater adoption of German norms and perceptions for immigrants born in Germany. Comparing language and identification indexes among different ethnic groups, we observe noticeable discrepancies between generations. Thus, second generation immigrants report higher levels of language proficiency than members of their parental generation indicating better linguistic integration. Additionally, self-reported identification with Germany is stronger for immigrants born in Germany expressing greater commitment to Germany and its society. All these findings fit the assumption that the second generation immigrants can enjoy a successful integration. Finally, the underlying data provide information about soft characteristics such as risk aversion, overall life satisfaction and political interest opening unique opportunities to compare immigrants and natives also in the field of behavioral economics. Accordingly, immigrants and natives do not differ much with respect to life satisfaction. They do differ regarding risk attitudes. Immigrants seem to be slightly less risk loving than natives, but differences mainly disappear for later immigrant cohorts, indicating that also from that perspective, younger immigrants converge towards native attitudes. Regarding political involvement, immigrants are in general less politically concerned than natives, but again the second generation political interests are more in line with natives expressing better integration also in this dimension. As a final remark, and referring to Turks as one immigrant group with pronounced differences, this analysis shows that comparison by generation is crucial when making statements about the integration process of ethnic groups in Germany. Turks differ in various ways from natives and also from other immigrant groups. They are more likely to be married in general, more often married at young ages and often have more children than the average German person. Their language abilities are worse compared to other immigrants, they report a lower identification with Germany and more commitment to their home country than others, and their religious believes are diverse from that of natives and co-immigrants. They report the lowest level of political interest and lower levels of life satisfaction than other immigrant groups. And finally, their labor force participation rates are comparably low. All these findings indicate that Turks are the least integrated immigrant 42
45 group with respect to the integration indicators considered in this study. But when studying Turkish immigrants by generation, it is clear that the second generation shows a tendency towards parity with native Germans. Second generation Turks show higher intermarriage rates, similar behavior as natives in terms of age at first marriage, age at first child and number of children. They report better German language proficiency both regarding speaking and writing skills as well as greater identification with Germany and thus less commitment to the country of ancestry. So, even if this group of immigrants seems to be unintegratable, trends over time need to be honored and fostered. References [1] G. A. Akerlof, R. E. Kranton: Economics and Identity, Quarterly Journal of Economics, 115, , 2000 [2] J. Angrist: How do Sex rations Affect Marriage and Labor Markets? Evidence from America s Second Generation, Quarterly Journal of Economics, 117(3): , 2002 [3] M. Backer, D. Benjamin: The Role of Family in Immigrant s Labor Market Activity: An Evaluation of Alternative Explanations, American Economic Association, 1997 [4] R. Bénabou, J. Tirole: Identity, Dignity and Taboos: Beliefs as Assets, IZA Discussion Paper No. 2583, 2007 [5] J. Berry, U. Kim, S. Power, M. Young, M. Bujaki: Acculturation Attitudes in Plural Societies, Applied Psychology: An International Review, 38, , 1989 [6] H. Bonin, A. Constant, K. Tatsiramos, K. F. Zimmermann: Ethnic Persistence, Assimilation and Risk Proclivity, IZA DP No. 2537, 2006 [7] H. Bonin, A. Constant, K. Tatsiramos, K. F. Zimmermann: Nativemigrant Differences in Risk Attitudes, Applied Economics Letters, 16, , 2009 [8] A. F. Constant, K. F. Zimmermann: Measuring Ethnic Identity and Its Impact on Economic Behavior, Journal of European Economic Association, 6(2-3), ,
46 [9] A. F. Constant, K. F. Zimmermann: Work and Money: Payoffs by Ethnic Identity and Gender, Research in Labor Economics, 29, 3-30, 2009a [10] A. Constant, K. F. Zimmermann: Migration, Ethnicity and Economic Integration, IZA DP No. 4620, 2009b [11] A. F. Constant, L. Gataullina, K. F. Zimmermann: Ethnosizing Immigrants, Journal of Economic Behavior and Organization, 69(3), , 2009 [12] A. F. Constant, R. Roberts, K. F. Zimmermann: Ethnic Identity and Immigrant Homeownership, Urban Studies, 46(9), , 2009 [13] A. F. Constant, L. Gataullina, L. Zimmermann, K. F. Zimmermann: The Clash of Cultures: Muslims and Christians in the Ethnosizing Process, IZA DP No. 2350, 2006 [14] A. Constant, M. Kahanec, K. F. Zimmermann: Attitudes towards Immigrants, other Integration Barriers and their Veracity, International Journal of Manpower, 30(1/2), 5-14, 2009 [15] L. Zimmermann, K. F. Zimmermann, A. F. Constant: Ethnic Self- Identification of First-Generation Immigrants, Labor Economics, 2007 [16] A. Constant, L. Zimmermann, K. F. Zimmermann: The Myth of Clash of Cultures: Muslims and Christians in the Ethnosizing Process, Mimeo, forthcoming, 2009 [17] B. R. Chiswick, P. W. Miller: The Endogeneity between Language and Earnings: International Analysis, Journal of Labor Economics, 13(2), 1995 [18] B. R. Chiswick, P. W. Miller: English Language Fluency among Immigrants in the United States, Research in Labor Economics, 17, 1998 [19] B.R. Chiswick, C. A. Houseworth: Ethnic Intermarriage among Immigrants: Human Capital and Assortative Mating, IZA DP No [20] C. Dustmann, A. van Soest: Language and Earnings of Immigrants, Industrial and Labor Relations Review, 55(3), 2002 [21] D. Furtado: Human Capital and Interethnic Marriage Decision, IZA DP No. 1989,
47 [22] D. Furtado, N. Theodoropoulos: Interethnic Marriage: A Choice between Ethnic and Educational Similarities, IZA DP No. 3448, 2008 [23] A. Gonzáles-Ferrer: Who do Immigrants Marry? Partner Choice Among Single Immigrants in Germany, European Sociological Review, 22(2), 2006 [24] M Kalmijn: Intermarriage and Homogamy: Causes, Patterns and Trends, Annual Review of Sociology, 24, 1998 [25] F. Kalter, N. Granto: Educational Hurdles on the Way to Stuctural Assimilation in Germany, Proceedings of the British Academy, 137, 2007 [26] J. Kantarevic: Interethnic Marriages and Economic Assimilation of Immigrants, IZA DP No. 1142, 2004 [27] S. Korenmann, D. Neumark: Does Marriage Really Make Men More Productive?, The Journal of Human Resources, 26(2), 1991 [28] J. Lievens: Interethnic Marriage: Bringing in the Context through Multilevel Modeling, European Journal of Population, 14, 1998 [29] J. Lievens: Family-Forming Migration from Turkey and Morocco to Belgium: The demand for Marriage Partners from the Countries of Origin, The International Migration Review, 33(3), 1999 [30] U. Mehrlander: Second-Generation Migrants In the Federal Republic of Germany. In Guests Come to Stay, Rogers, Rosemary (editor). Boulder: West View Press, 1985 [31] X. Meng, R.G. Gregory: Intermarriage and the Economic Assimilation of Immigrants, Journal of Labor Economics, 23(1), 2005 [32] X. Meng, D. Meurs: Intermarriage, Language and Economic Assimilation Process. A Case Study of France IZA DP No. 2461, 2006 [33] J. S. Phinney, G. Horenczyk, K. Liebkind, P. Vedder: Ethnic Identity, Immigration and Well-being: An international perspective, Journal of Social Issues, 57, 2001 [34] J. S. Phinney: The Multigroup Ethnic Identity Measure: A New Scale for Use with Diverse Groups. Journal of Adolescent Research, 7, ,
48 [35] J. Velling: The Determinants of Family Reunification among German Guest-Workers. In Vierteljahrsheft 1/2. Burkhauser, Richard V., and Wagner, Gert G. (editors). Berlin: Deutsches Institute fur Wirtschftforschung, 1994: [36] K. F. Zimmermann: The Economics of Migrant Ethnicity, Journal of Population Economics, 20(3), , 2007a [37] K. F. Zimmermann: Migrant Ethnic Identity: Concept and Policy Implications, Ekonomia, 10(1), 1-17, 2007b [38] K. F. Zimmermann, A. F. Constant, L. Gataullina: Naturalization Proclivities, Ethnicity and Integration, International Journal of Manpower, 30(1-2), 70-82, 2009 [39] L. Zimmermann, L. Gataullina, A. Constant, K. F. Zimmermann: Human Capital and Ethnic Self-identification of Migrants, Economics Letters, 98(3), , 2008 [40] L. Zimmermann, K. F. Zimmermann, A. Constant: Ethnic Selfidentification of First-generation Immigrants, International Migration Review, 41(3), ,

49 6 Appendix - Graphs 47
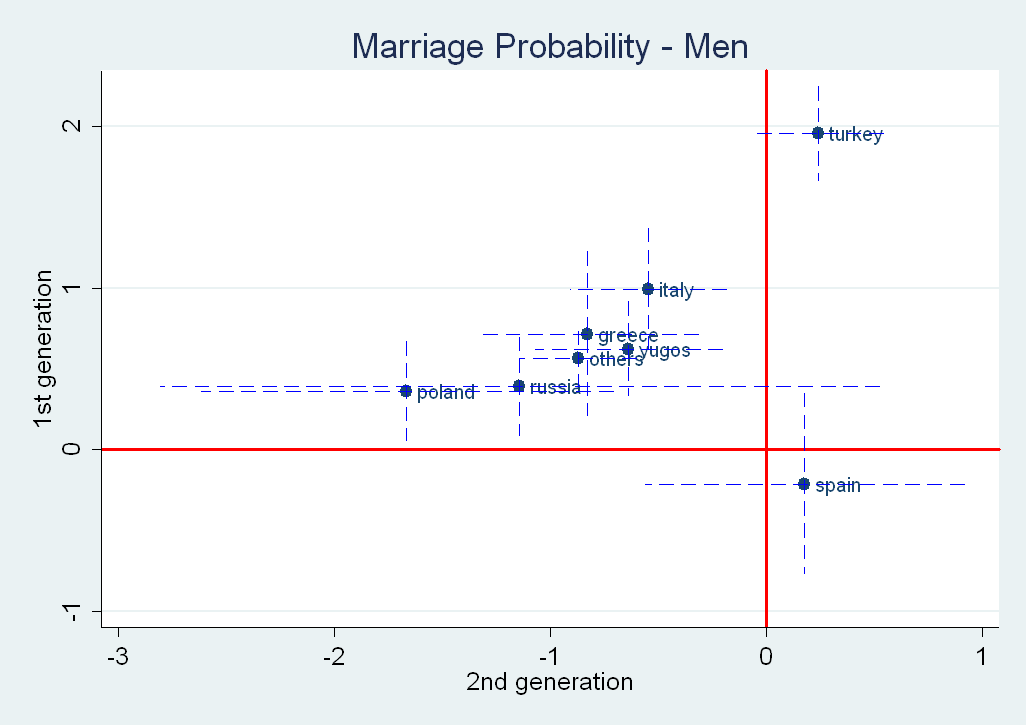
50 48

51 49

52 50
53 51

54 52

55 53

56 54

57 55
Human Capital and Ethnic Self-Identification of Migrants
 DISCUSSION PAPER SERIES IZA DP No. 2300 Human Capital and Ethnic Self-Identification of Migrants Laura Zimmermann Liliya Gataullina Amelie Constant Klaus F. Zimmermann September 2006 Forschungsinstitut
Freie Universität Berlin. Intermarriages and Their Impact on Germany s Society
 Freie Universität Berlin Fachbereich Wirtschaftswissenschaft Intermarriages and Their Impact on Germany s Society Inaugural-Dissertation zur Erlangung des akademischen Grades einer Doktorin der Wirtschaftswissenschaft
Immigrant fertility in West Germany: Socialization effect in transitions to second and third births?
 Immigrant fertility in West Germany: Socialization effect in transitions to second and third births? Nadja Milewski Institut national d études démographiques (INED), Paris Conference on Effects of Migration
Is Temporary Agency Employment a Stepping Stone for Immigrants?
 D I S C U S S I O N P A P E R S E R I E S IZA DP No. 6405 Is Temporary Agency Employment a Stepping Stone for Immigrants? Elke Jahn Michael Rosholm March 2012 Forschungsinstitut zur Zukunft der Arbeit
Economic and Social Council
 United Nations Economic and Social Council Distr.: General 27 February 2014 ECE/CES/2014/43 Original: English Economic Commission for Europe Conference of European Statisticians Sixty-second plenary session
CONTENTS: bul BULGARIAN LABOUR MIGRATION, DESK RESEARCH, 2015
 215 2 CONTENTS: 1. METHODOLOGY... 3 a. Survey characteristics... 3 b. Purpose of the study... 3 c. Methodological notes... 3 2. DESK RESEARCH... 4 A. Bulgarian emigration tendencies and destinations...
Why More West than East German Firms Export
 DISCUSSION PAPER SERIES IZA DP No. 2656 Why More West than East German Firms Export Joachim Wagner March 2007 Forschungsinstitut zur Zukunft der Arbeit Institute for the Study of Labor Why More West than
IMMIGRATION TO AND EMIGRATION FROM GERMANY IN THE LAST FEW YEARS
 IMMIGRATION TO AND EMIGRATION FROM GERMANY IN THE LAST FEW YEARS Bernd Geiss* Germany, Destination for Migrants Germany is in the middle of Europe and has common borders with nine countries. Therefore,
CULTURAL INTEGRATION IN EUROPE: THE ITALIAN CONTEXT. Alberto Bisin* and Eleonora Patacchini**
 CULTURAL INTEGRATION IN EUROPE: THE ITALIAN CONTEXT Alberto Bisin* and Eleonora Patacchini** Abstract We explore economic and cultural integration patterns for different immigrant groups in Italy, from
Leaving the parental home in Poland Kamil Sienkiewicz
 Leaving the parental home in Poland Kamil Sienkiewicz Short abstract This study compares trends in the process of leaving parental home before and after the breakdown of the Communist regime in Poland.
Revealing Taste-Based Discrimination in Hiring: A Correspondence Testing Experiment with Geographic Variation
 D I S C U S S I O N P A P E R S E R I E S IZA DP No. 6153 Revealing Taste-Based Discrimination in Hiring: A Correspondence Testing Experiment with Geographic Variation Magnus Carlsson Dan-Olof Rooth November
The Wage Return to Education: What Hides Behind the Least Squares Bias?
 DISCUSSION PAPER SERIES IZA DP No. 8855 The Wage Return to Education: What Hides Behind the Least Squares Bias? Corrado Andini February 2015 Forschungsinstitut zur Zukunft der Arbeit Institute for the
Ethnicity and Second Generation Immigrants
 Ethnicity and Second Generation Immigrants Christian Dustmann, Tommaso Frattini, Nikolaos Theodoropoulos Key findings: Ethnic minority individuals constitute a large and growing share of the UK population:
East-West Migration and Gender: Is there a Double Disadvantage vis-à-vis Stayers?
 EastWest Migration and Gender: Is there a Double Disadvantage visàvis Stayers? Anzelika Zaiceva University of Bologna and IZA anzelika.zaiceva@unibo.it Higher School of Economics, Moscow December 13, 2007
Is Economics a Good Major for Future Lawyers? Evidence from Earnings Data
 DISCUSSION PAPER SERIES IZA DP No. 9416 Is Economics a Good Major for Future Lawyers? Evidence from Earnings Data John V. Winters October 2015 Forschungsinstitut zur Zukunft der Arbeit Institute for the
Risk Aversion and Sorting into Public Sector Employment
 DISCUSSION PAPER SERIES IZA DP No. 3503 Risk Aversion and Sorting into Public Sector Employment Christian Pfeifer May 2008 Forschungsinstitut zur Zukunft der Arbeit Institute for the Study of Labor Risk
Revisiting Inter-Industry Wage Differentials and the Gender Wage Gap: An Identification Problem
 DISCUSSION PAPER SERIES IZA DP No. 2427 Revisiting Inter-Industry Wage Differentials and the Gender Wage Gap: An Identification Problem Myeong-Su Yun November 2006 Forschungsinstitut zur Zukunft der Arbeit
Immigration policies: Sweden and the United Kingdom
 Immigration policies: Sweden and the United Kingdom Abstract Europe has a declining population. However, the movement of labor is a politically charged policy area in a way that cross-border movements
Australia: The Miracle Economy
 DISCUSSION PAPER SERIES IZA DP No. 7505 : The Miracle Economy P.N. (Raja) Junankar July 2013 Forschungsinstitut zur Zukunft der Arbeit Institute for the Study of Labor : The Miracle Economy P.N. (Raja)
Evaluation of migration patterns in Turkey, according to the 2000-2011 Censuses Results
 Distr.: General 4 September 2014 English Working paper 3 Economic Commission for Europe Conference of European Statisticians Work Session on Migration Statistics Chisinau, Republic of Moldova 10-12 September
Copayments in the German Health System: Does It Work?
 DISCUSSION PAPER SERIES IZA DP No. 2290 Copayments in the German Health System: Does It Work? Boris Augurzky Thomas K. Bauer Sandra Schaffner September 2006 Forschungsinstitut zur Zukunft der Arbeit Institute
Leadership at School: Does the Gender of Siblings Matter?
 DISCUSSION PAPER SERIES IZA DP No. 6976 Leadership at School: Does the Gender of Siblings Matter? Giorgio Brunello Maria De Paola October 2012 Forschungsinstitut zur Zukunft der Arbeit Institute for the
Prospective immigration to Israel through 2030: methodological issues and challenges
 WP 21 23 April 2010 UNITED NATIONS STATISTICAL COMMISSION and ECONOMIC COMMISSION FOR EUROPE STATISTICAL OFFICE OF THE EUROPEAN UNION (EUROSTAT) CONFERENCE OF EUROPEAN STATISTICIANS Joint Eurostat/UNECE
Agency in Health-Care: Are Medical Care-Givers Perfect Agents?
 DISCUSSION PAPER SERIES IZA DP No. 2727 Agency in Health-Care: Are Medical Care-Givers Perfect Agents? Einat Neuman Shoshana Neuman April 2007 Forschungsinstitut zur Zukunft der Arbeit Institute for the
Measuring Ethnic Identity and Its Impact on Economic Behavior
 DISCUSSION PAPER SERIES IZA DP No. 3063 Measuring Ethnic Identity and Its Impact on Economic Behavior Amelie Constant Klaus F. Zimmermann September 2007 Forschungsinstitut zur Zukunft der Arbeit Institute
Population Aging in Developed Countries: Emerging Trends and Dynamics Wan He, Ph.D. Population Division U.S. Census Bureau
 Population Aging in Developed Countries: Emerging Trends and Dynamics Wan He, Ph.D. Population Division U.S. Census Bureau This presentation is released to inform interested parties of population aging
Replacement Migration
 Population Division Department of Economic and Social Affairs United Nations Secretariat Replacement Migration United Nations ST/ESA/SER.A/206 Population Division Department of Economic and Social Affairs
CIVIL SERVICE NATIONALITY RULES GUIDANCE ON CHECKING ELIGIBILITY
 CIVIL SERVICE NATIONALITY RULES GUIDANCE ON CHECKING ELIGIBILITY Employment Practice Division Civil Service Capability Group Cabinet Office November 2007 1 CIVIL SERVICE NATIONALITY RULES GUIDANCE ON CHECKING
Population Figures at 1 January 2014 Migration Statistics 2013 Provisional data
 30 June 2014 Population Figures at 1 January 2014 Migration Statistics 2013 Provisional data Main results The population of Spain decreases by 220,130 persons in 2013, standing at 46,507,760 inhabitants
YOUTH AND MIGRATION HIGHLIGHTS
 YOUTH AND MIGRATION HIGHLIGHTS In 2010, there were 27 million international migrants aged 15 to 24 in the world, accounting for 12.4 per cent of the 214 million international migrants worldwide 1. In 2010,
Social Security Eligibility and the Labor Supply of Elderly Immigrants. George J. Borjas Harvard University and National Bureau of Economic Research
 Social Security Eligibility and the Labor Supply of Elderly Immigrants George J. Borjas Harvard University and National Bureau of Economic Research Updated for the 9th Annual Joint Conference of the Retirement
Economic Integration of Intermarried Labour Migrants, Refugees and Family Migrants to Sweden: Premium or Selection?
 DISCUSSION PAPER SERIES IZA DP No. 8065 Economic Integration of Intermarried Labour Migrants, Refugees and Family Migrants to Sweden: Premium or Selection? Nahikari Irastorza Pieter Bevelander March 2014
The EU Enlargement, and Immigration from Eastern Europe
 The EU Enlargement, and Immigration from Eastern Europe Olivier Blanchard October 2001 Let me start by sketching a toy model of immigration. Think of all the capital as being in the West (Western Europe).
IMMIGRANTS IDENTITY, ECONOMIC OUTCOMES AND THE TRANSMISSION OF IDENTITY ACROSS GENERATIONS
 The Economic Journal, 120 (February), F31 F51. doi: 10.1111/j.1468-0297.2009.02336.x. Ó The Author(s). Journal compilation Ó Royal Economic Society 2010. Published by Blackwell Publishing, 9600 Garsington
Association Between Variables
 Contents 11 Association Between Variables 767 11.1 Introduction............................ 767 11.1.1 Measure of Association................. 768 11.1.2 Chapter Summary.................... 769 11.2 Chi
INTEGRATION IN DENMARK
 INTEGRATION IN DENMARK 3 INTEGRATION TODAY As of January 2012, the total population of Denmark was 5,580,516 including a total of 580,461 migrants and descendants (10,4 % of the total population). The
INTERNATIONAL COMPARISONS OF PART-TIME WORK
 OECD Economic Studies No. 29, 1997/II INTERNATIONAL COMPARISONS OF PART-TIME WORK Georges Lemaitre, Pascal Marianna and Alois van Bastelaer TABLE OF CONTENTS Introduction... 140 International definitions
Econ 102 Economic Growth Solutions. 2. Discuss how and why each of the following might affect US per capita GDP growth:
 Econ 102 Economic Growth Solutions 2. Discuss how and why each of the following might affect US per capita GDP growth: a) An increase of foreign direct investment into the US from Europe is caused by a
2.2. Total fertility rate 1.8 1.6 1.4 1.2. Cons
 Ayako Kondo Yokohama National University, Japan, and IZA, Germany The effects of recessions on family formation Fertility and marriage rates are pro-cyclical in many countries, but the longer-term consequences
Marriage and divorce: patterns by gender, race, and educational attainment
 ARTICLE OCTOBER 2013 Marriage and divorce: patterns by gender, race, and educational attainment Using data from the National Longitudinal Survey of Youth 1979 (NLSY79), this article examines s and divorces
The performance of immigrants in the Norwegian labor market
 J Popul Econ (1998) 11:293 303 Springer-Verlag 1998 The performance of immigrants in the Norwegian labor market John E. Hayfron Department of Economics, University of Bergen, Fosswinckelsgt. 6, N-5007
Does Upward or Downward Mobility Matter? An Explanation of Fertility among Foreign Wives in Korea
 Does Upward or Downward Mobility Matter? An Explanation of Fertility among Foreign Wives in Korea JungKyun Ryu Department of Sociology Seongdong-gu Seoul, 133-791 Korea Doo-Sub Kim Department of Sociology
European Citizens Initiative on Unconditional Basic Income ANNEX
 European Citizens Initiative on Unconditional Basic Income ANNEX Initiators of the ECI The persons presenting the proposal for our ECI are citizens out of 15 EU Member States (Austria, Belgium, Denmark,
SLOUGH DEMOGRAPHICS. AN ANALYSYS BY Slough Race Equality Council
 SLOUGH DEMOGRAPHICS AN ANALYSYS BY Slough Race Equality Council Demographics Overview and Trends Slough has an extremely diverse population with BME communities making up a large proportion. Its diversity
Does the Calculation Hold? The Fiscal Balance of Migration to Denmark and Germany
 IZA Policy Paper No. 87 P O L I C Y P A P E R S E R I E S Does the Calculation Hold? The Fiscal Balance of Migration to Denmark and Germany Holger Hinte Klaus F. Zimmermann July 2014 Forschungsinstitut
SF2.2: Ideal and actual number of children
 Definitions and methodology SF.: Ideal and actual number of children Childbearing preferences are difficult to measure since they depend on different factors, including social norms, personal circumstances,
Seemingly Irrelevant Events Affect Economic Perceptions and Expectations: The FIFA World Cup 2006 as a Natural Experiment
 DISCUSSION PAPER SERIES IZA DP No. 2275 Seemingly Irrelevant Events Affect Economic Perceptions and Expectations: The FIFA World Cup 2006 as a Natural Experiment Thomas Dohmen Armin Falk David Huffman
Welfare and Social Insurance Participation by 1 Korean Immigrants to the United States *
 Volume 22, Number 2, December 1997 Welfare and Social Insurance Participation by 1 Korean Immigrants to the United States * Paul S. Davies **2 II This paper examines welfare and social insurance participation
Sweden s recent experience of international migration - issues and studies
 Session 2: Social coàhesion, diversity and inequality Björn Gustafsson October 2001 Sweden s recent experience of international migration - issues and studies Abstract When Sweden entered the new millennium
ECONOMIC MIGRATIONS OF THE POLES. Report by Work Service S.A.
 ECONOMIC MIGRATIONS OF THE POLES Report by Work Service S.A. TABLE OF CONTENTS INTRODUCTION 3 THE REPORT IN NUMBERS 4 PREFERRED COUNTRIES OF EMIGRATION 5 THOSE CONSIDERING ECONOMIC EMIGRATION 6 REASONS
How To Choose Between A Married Immigrant And Non Immigrant Spouse
 European Sociological Review VOLUME 22 NUMBER 2 APRIL 2006 171 185 171 DOI:10.1093/esr/jci050, available online at www.esr.oxfordjournals.org Online publication 20 January 2006 Who Do Immigrants Marry?
User language preferences online. Analytical report
 Flash Eurobarometer 313 The Gallup Organization Flash Eurobarometer European Commission User language preferences online Analytical report Fieldwork: January 2011 Publication: May 2011 This survey was
Intergenerational Mobility of Immigrants in Germany: Moving with Natives or Stuck in their Neighborhoods?
 DISCUSSION PAPER SERIES IZA DP No. 4677 Intergenerational Mobility of Immigrants in Germany: Moving with Natives or Stuck in their Neighborhoods? Mutlu Yuksel December 2009 Forschungsinstitut zur Zukunft
Pan-European opinion poll on occupational safety and health
 PRESS KIT Pan-European opinion poll on occupational safety and health Results across 36 European countries Press kit Conducted by Ipsos MORI Social Research Institute at the request of the European Agency
SF3.1: Marriage and divorce rates
 Marriage rates Definitions and methodology SF3.1: Marriage and divorce rates The crude marriage rate is the number of marriages formed each year as a ratio to 1 000 people. This measure disregards other
The Impact on Inequality of Raising the Social Security Retirement Age
 The Impact on Inequality of Raising the Social Security Retirement Age David Rosnick and Dean Baker April 2012 Center for Economic and Policy Research 1611 Connecticut Avenue, NW, Suite 400 Washington,
The Baby Boom and World War II: A Macroeconomic Analysis
 The Baby Boom and World War II: A Macroeconomic Analysis Matthias Doepke, Moshe Hazan, and Yishay Maoz The baby boom started right after World War II. Is there a relation between the two? The Total Fertility
Performance Related Pay and Labor Productivity
 DISCUSSION PAPER SERIES IZA DP No. 2211 Performance Related Pay and Labor Productivity Anne C. Gielen Marcel J.M. Kerkhofs Jan C. van Ours July 2006 Forschungsinstitut zur Zukunft der Arbeit Institute
Family Law. Analytical Report
 Flash Eurobarometer European Commission Family Law Analytical Report Fieldwork: June 2006 Report: October 2006 Flash Eurobarometer 188 The Gallup Organization This survey was requested by Directorate-General
Follow your family using census records
 Census records are one of the best ways to discover details about your family and how that family changed every 10 years. You ll discover names, addresses, what people did for a living, even which ancestor
World War II, Missing Men, And Out-Of-Wedlock Childbearing
 World War II, Missing Men, And Out-Of-Wedlock Childbearing Michael Kvasnicka (HU) Dirk Bethmann (Korea University) SFB Klausurtagung Motzen 2007 1 Introduction Why study sex ratios (as an economist)? Sex
Are Women Opting Out? Debunking the Myth
 BRIEFING PAPER November 2005 Are Women Opting Out? Debunking the Myth BY HEATHER BOUSHEY Executive Summary A front page article in the New York Times (Story 2005) recently reported that women at Yale University
Who are the Other ethnic groups?
 Article Who are the Other ethnic groups? Social and Welfare David Gardener Helen Connolly October 2005 Crown copyright Office for National Statistics 1 Drummond Gate London SW1V 2QQ Tel: 020 7533 9233
Poverty Among Migrants in Europe
 EUROPEAN CENTRE EUROPÄISCHES ZENTRUM CENTRE EUROPÉEN Orsolya Lelkes is Economic Policy Analyst at the European Centre for Social Welfare Policy and Research, http://www.euro.centre.org/lelkes Poverty Among
Immigration policies: The United States and Canada
 Immigration policies: The United States and Canada Abstract In attracting talented people from around the world, the United States and Canada are exceptional, but for somewhat different reasons. The U.S.
Interethnic Marriage: A Choice between Ethnic and Educational Similarities
 DISCUSSION PAPER SERIES IZA DP No. 3448 Interethnic Marriage: A Choice between Ethnic and Educational Similarities Delia Furtado Nikolaos Theodoropoulos April 2008 Forschungsinstitut zur Zukunft der Arbeit
4 Distribution of Income, Earnings and Wealth
 4 Distribution of Income, Earnings and Wealth Indicator 4.1 Indicator 4.2a Indicator 4.2b Indicator 4.3a Indicator 4.3b Indicator 4.4 Indicator 4.5a Indicator 4.5b Indicator 4.6 Indicator 4.7 Income per
Basics of the United States Immigration System
 November 4, 2010 Basics of the United States Immigration System U.S. immigration law is very complex, and there is much confusion as to how it works. The Immigration and Naturalization Act (INA), the body
Gender Differences in Employed Job Search Lindsey Bowen and Jennifer Doyle, Furman University
 Gender Differences in Employed Job Search Lindsey Bowen and Jennifer Doyle, Furman University Issues in Political Economy, Vol. 13, August 2004 Early labor force participation patterns can have a significant
Education and Wage Differential by Race: Convergence or Divergence? *
 Education and Wage Differential by Race: Convergence or Divergence? * Tian Luo Thesis Advisor: Professor Andrea Weber University of California, Berkeley Department of Economics April 2009 Abstract This
REMITTANCE TRANSFERS TO ARMENIA: PRELIMINARY SURVEY DATA ANALYSIS
 REMITTANCE TRANSFERS TO ARMENIA: PRELIMINARY SURVEY DATA ANALYSIS microreport# 117 SEPTEMBER 2008 This publication was produced for review by the United States Agency for International Development. It
Social Media Study in European Police Forces: First Results on Usage and Acceptance
 Social Media Study in European Police Forces: First Results on Usage and Acceptance P. Saskia Bayerl, Ph.D., Erasmus University Rotterdam, the Netherlands September 29 th, 2012 Table of Contents Main Findings...
Long-term impact of childhood bereavement
 Long-term impact of childhood bereavement Preliminary analysis of the 1970 British Cohort Study (BCS70) Samantha Parsons CWRC WORKING PAPER September 2011 Long-Term Impact of Childhood Bereavement Preliminary
Immigration, Integration and Return Migration:
 LUND UNIVERSITY Department of Economic History SWEDEN Immigration, Integration and Return Migration: The Swedish Experience. Martin Klinthäll, Lund University The importance of return migration Return
Student Aid, Repayment Obligations and Enrolment into Higher Education in Germany Evidence from a Natural Experiment
 Student Aid, Repayment Obligations and Enrolment into Higher Education in Germany Evidence from a Natural Experiment Hans J. Baumgartner *) Viktor Steiner **) *) DIW Berlin **) Free University of Berlin,
Immigrant artists in the Finnish support system for the arts
 Immigrant artists in the Finnish support system for the arts Summary Research objectives and material This research on the position of immigrant artists as applicants and recipients of grants is based
NET INTERNATIONAL MIGRATION
 II. NET INTERNATIONAL MIGRATION A. GLOBAL TRENDS During the period 195-21, the developed regions experienced population gains from positive net international migration while the developing regions were
UK immigration policy outside the EU
 European Union: MW 371 Summary 1. This paper outlines a possible immigration system in the event of a British exit from the European Union. Some have claimed that a British exit would not affect net migration,
The Future European Constitution
 Flash Eurobarometer European Commission The Future European Constitution Fieldwork : January 2004 Publication : February 2004 Flash Eurobarometer 159 - TNS Sofres / EOS Gallup Europe This survey was requested
DEPARTMENT OF ECONOMICS DISCUSSION PAPER SERIES
 ISSN 1471-0498 DEPARTMENT OF ECONOMICS DISCUSSION PAPER SERIES DOES CULTURE AFFECT DIVORCE DECISIONS? EVIDENCE FROM EUROPEAN IMMIGRANTS IN THE US Delia Furtado, Miriam Marcen and Almudena Sevilla-Sanz
Small Scale Study ll. Managed Migration and the Labour Market the Health Sector
 1 Small Scale Study ll Managed Migration and the Labour Market the Health Sector Swedish NCP 2 1. Executive summary...3 2. Introduction to the healthcare sector in Sweden...4 2.1 County councils' main
Return Migration: Theory and Empirical Evidence from the UK
 British Journal of Industrial Relations 45:2 June 2007 0007 1080 pp. 236 256 Return Migration: Theory and Empirical Evidence from the UK Christian Dustmann and Yoram Weiss Abstract In this article, we
Summer 2015. Mind the gap. Income protection gap study Western Europe
 Summer 2015 Mind the gap Income protection gap study Western Europe Foreword There is growing awareness of the pension gap, but most people underestimate an even greater risk to their standard of living:
International Women's Day PwC Women in Work Index
 www.pwc.co.uk International Women's Day Women in Work Index Women in Work Index UK rises four places to 14 th position within the OECD, returning to its position in 2000. The third annual update of the
Population Aging Research Center. University of Pennsylvania. Mexican Migration to the US and Access to Health Care
 Population Aging Research Center University of Pennsylvania Mexican Migration to the US and Access to Health Care Sara Ross, José Pagán, and Daniel Polsky PARC Working Paper Series WPS 05-12 "The authors
A Comparative Analysis of Income Statistics for the District of Columbia
 Occasional Studies A Comparative Analysis of Income Statistics for the District of Columbia ACS Income Estimates vs. DC Individual Income Tax Data Jayron Lashgari Office of Revenue Analysis Office of the
ECONOMIC FACTORS AFFECTING COMPENSATION
 Unit 4: Total Rewards 41 ECONOMIC FACTORS AFFECTING COMPENSATION Inflation Inflation has a substantial impact on compensation practices. Managing a compensation program is especially difficult during periods
Hispanic DÁVILAEthnicity, AND MORA English-Skill Investments, and Earnings
 Hispanic DÁVILAEthnicity, AND MORA English-Skill Investments, and Earnings Hispanic Ethnicity, English-Skill Investments, and Earnings ALBERTO DÁVILA and MARIE T. MORA* Analyzing synthetic cohorts in the
MUNDUS GRADUATE IMPACT SURVEY
 NOVEMBER 2015 ERASMUS MUNDUS Graduate Impact Survey 1 / 29 REPORTED BY: DR. THOMAS KRÜGER AND KONRAD KLEIN, UZBONN 2 / 29 TABLE OF CONTENTS I INTRODUCTION 5 II METHODOLOGY 5 III RESULTS OF THE GRADUATE
BILINGUALISM AND LANGUAGE ATTITUDES IN NORTHERN SAMI SPEECH COMMUNITIES IN FINLAND PhD thesis Summary
 Duray Zsuzsa BILINGUALISM AND LANGUAGE ATTITUDES IN NORTHERN SAMI SPEECH COMMUNITIES IN FINLAND PhD thesis Summary Thesis supervisor: Dr Bakró-Nagy Marianne, University Professor PhD School of Linguistics,
Working Paper Immigration and outsourcing: a general equilibrium analysis
 econstor www.econstor.eu Der Open-Access-Publikationsserver der ZBW Leibniz-Informationszentrum Wirtschaft The Open Access Publication Server of the ZBW Leibniz Information Centre for Economics Bandyopadhyay,
Research Briefing. The Best and the Brightest EU students at UK universities and as highly skilled graduate workers in the UK
 Research Briefing The Best and the Brightest EU students at UK universities and as highly skilled graduate workers in the UK Academic performance and labour market outcomes of EU domiciled students in
Ukraine: Trends and Regional Dynamics in Population, Health, and Migration
 : Trends and Regional Dynamics in Population, Health, and Migration PONARS Eurasia Policy Memo No. 344 September 2014 Judy Twigg Virginia Commonwealth University Today s conflict in hinges on perceptions
Ageing OECD Societies
 ISBN 978-92-64-04661-0 Trends Shaping Education OECD 2008 Chapter 1 Ageing OECD Societies FEWER CHILDREN LIVING LONGER CHANGING AGE STRUCTURES The notion of ageing societies covers a major set of trends
Earnings, Disposable Income, and Consumption of Allowed and Rejected Disability Insurance Applicants
 DISCUSSION PAPER SERIES IZA DP No. 8893 Earnings, Disposable Income, and Consumption of and Rejected Disability Insurance Applicants Andreas Ravndal Kostøl Magne Mogstad February 2015 Forschungsinstitut
Regional characteristics of foreignborn people living in the United Kingdom
 Regional characteristics of foreignborn people living in the United Kingdom By Alice Reid and Caroline Miller, Office for National Statistics Abstract This article examines the characteristics of foreign-born
WORLD POPULATION IN 2300
 E c o n o m i c & DRAFT S o c i a l A f f a i r s WORLD POPULATION IN 2300 Highlights United Nations ESA/P/WP.187 9 December 2003 DRAFT Department of Economic and Social Affairs Population Division WORLD
THE DEMOGRAPHY OF POPULATION AGEING
 THE DEMOGRAPHY OF POPULATION AGEING Barry Mirkin and Mary Beth Weinberger* An inevitable consequence of the demographic transition and the shift to lower fertility and mortality has been the evolution
EUROPEAN. Geographic Trend Report for GMAT Examinees
 2011 EUROPEAN Geographic Trend Report for GMAT Examinees EUROPEAN Geographic Trend Report for GMAT Examinees The European Geographic Trend Report for GMAT Examinees identifies mobility trends among GMAT
The trend of Vietnamese household size in recent years
 2011 International Conference on Humanities, Society and Culture IPEDR Vol.20 (2011) (2011) IACSIT Press, Singapore The trend of Vietnamese household size in recent years Nguyen, Thanh Binh 1 Free University