STRESS CONCENTRATION FACTORS FOR SIMPLE TUBULAR JOINTS. Assessment of Existing and Development of New Parametric Formulae
|
|
|
- Clement Shaw
- 7 years ago
- Views:
Transcription
1

2 OTH 354 STRESS CONCENTRATION FACTORS FOR SIMPLE TUBULAR JOINTS Assessment of Existing and Development of New Parametric Formulae Prepared by Lloyd s Register of Shipping 71 Fenchurch Street London EC3M 4BS HSE BOOKS Health and Safety Executive - Offshore Technology Report

3 Crown copyright 1997 Applications for reproduction should be made in writing to: Copyright Unit, Her Majesty's Stationery Office, St Clements House, 2-16 Colegate, Norwich NR3 1BQ First published 1997 ISBN All rights reserved. No part of this publication may be reproduced, stored in a retrieval system, or transmitted in any form or by any means (electronic, mechanical, photocopying, recording, or otherwise) without the prior written permission of the copyright owner. This report is published by the Health and Safety Executive as part of a series of reports of work which has been supported by funds provided by the Executive. Neither the Executive, or the contractors concerned assume any liability for the report nor do they necessarily reflect the views or policy of the Executive. Results, including detailed evaluation and, where relevant, recommendations stemming from their research projects are published in the OTH/OTI series of reports.

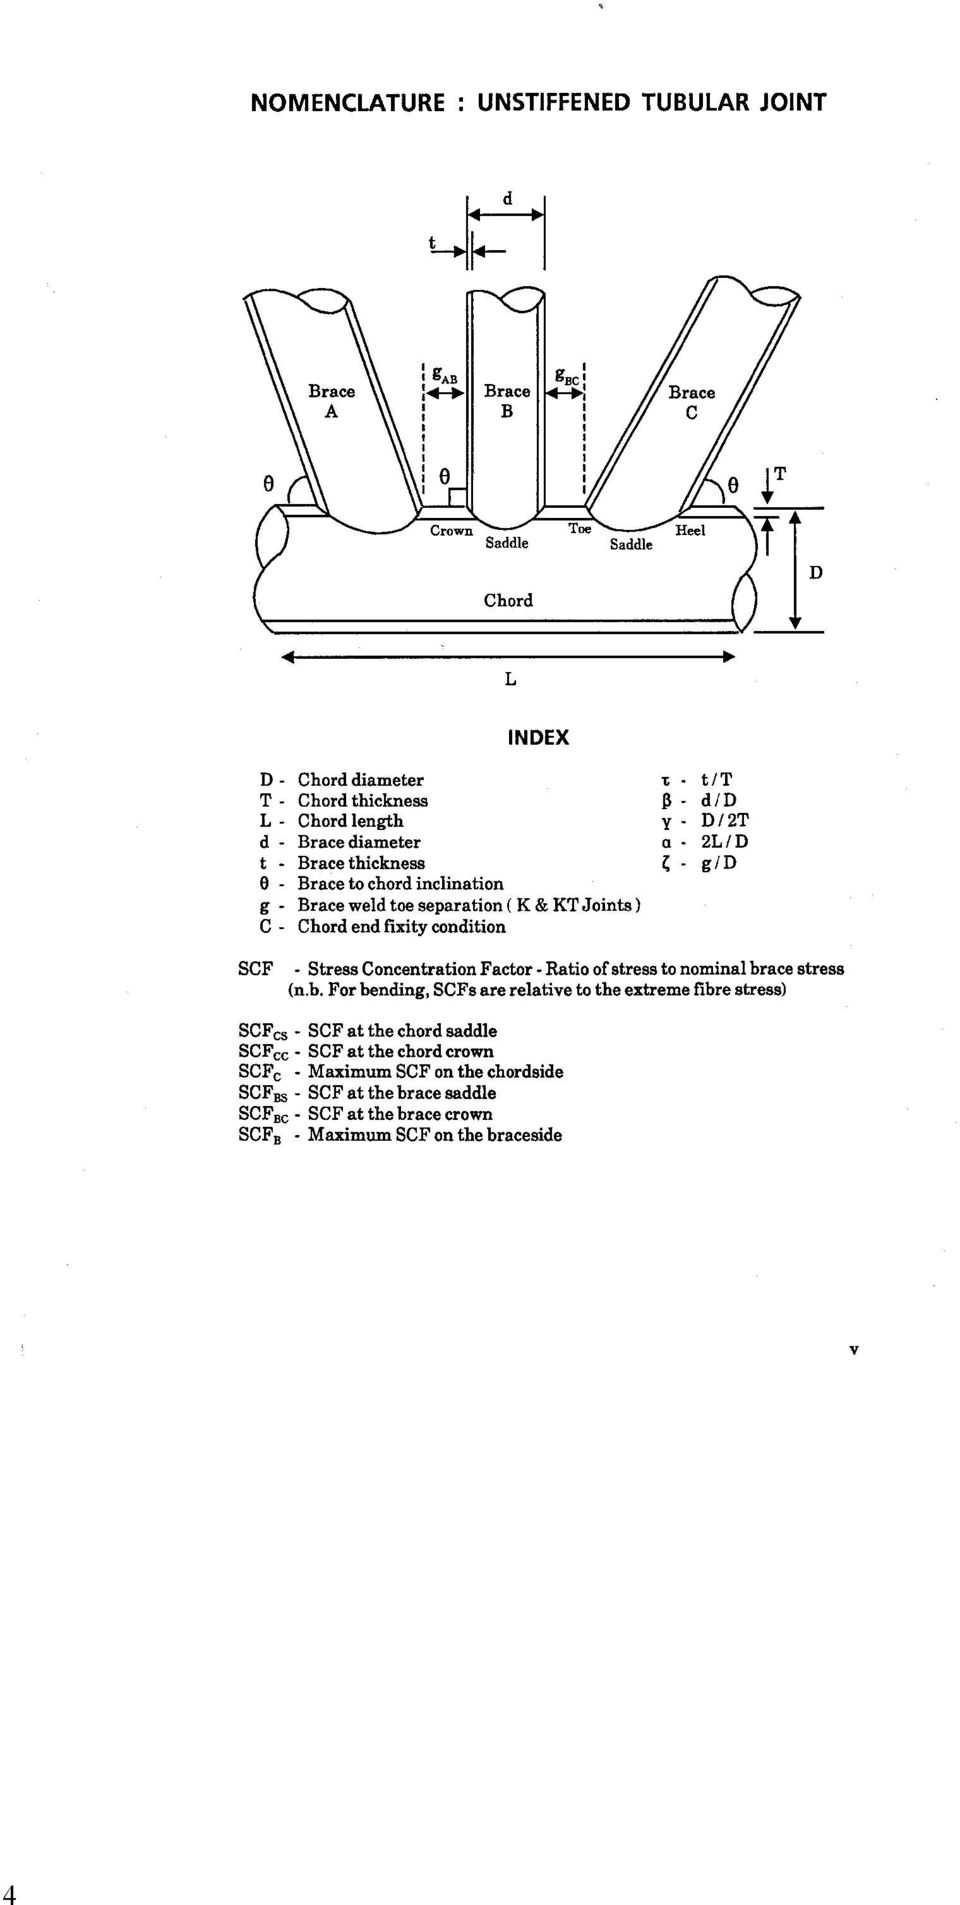
4 CONTENTS PAGE EXECUTIVE SUMMARY NOMENCLATURE iv v INTRODUCTION REVIEW OF EXPERIMENTAL TECHNIQUES 2.1 Methods of modelling tubular joints 2.2 Strain gauge locations and stress sampling positions 2.3 Measurement of stress and strains 2.4 Extrapolation procedure 2.5 The influence of a weld fillet The inclusion of a weld fillet Weld cut-back at the saddle locations on ß = 1 joints Weld fillet profile 2.6 Chord length and chord end effects Supported chord effects at the crown under axial load Short chord effects at the saddle DATABASE 3.1 Criteria for the acceptance of SCF data 3.2 Factors applied to the SCF database SIMPLE JOINT SCF EQUATIONS 4.1 Kuang equations (1975 and 1977) 4.2 Wordsworth/Smedley equations (1978 and 1981) 4.3 UEG equations (1985) 4.4 Efthymiou/Durkin equations (1985 and 1998) 4.5 Hellier, Connolly and Dover equations (1990) 4.6 Lloyd s Register equations (1991) ASSESSMENT OF SIMPLE JOINT SCF EQUATIONS 5.1 Assessment database 5.2 Criteria for assessment of parametic equations 5.3 Assessment of parametric equations 5.4 Assessment of parametric equations 5.5 Data used in SCF assessment 5.6 Beta = 1.0 joints CONCLUSIONS ACKNOWLEDGEMENTS REFERENCES TABLES
 4.2 Wordsworth/Smedley equations (1978 and 1981) 4.")
5 APPENDIX A APPENDIX B APPENDIX C Parametric equations used in this study Simple joint SCF assessment database Extrapolation procedures

6 EXECUTIVE SUMMARY This report covers the development of a new set of SCF parametric formulae for simple tubular joints, ie the Lloyd s Register equations, the work being largely funded by the HSE. Additionally, the report covers as assessment of the commonly used SCF equations for simple tubular joints including the new LR equations. This latter work was carried out under the auspices of the HSE Review Panel for Fatigue Guidance (RPFG). In the development of the LR equations, a comprehensive database of measured SCFs for full-scale steel joints and acrylic models was created. The joint acceptance criteria for this database was agreed with representatives from the Industry. From this database the new LR equations, which are given in Appendix A, were developed. For the assessment of SCF parametric formulae for simple tubular joints the database above was refined. The finalised database, which is given in Appendix B, was used to assess the existing commonly used parametric formulae and the new LR equations. The assessment criteria which was agreed with the RPFG is given in Section 5.2 and the equations assessed are given in Appendix A. 1 1 See footnote to Section 1.0 Introduction 3

7 4
8 1. INTRODUCTION In the 1970s with the increasing development of the hot-spot stress S-N approach to nodal joint fatigue life estimation, it became clear that the determination of reliable stress concentration factors (SCFs) for tubular joints was fundamental to this concept. The first parametric SCF equations covering simple tubular joints were derived by Toprac and Beale in 1967 (1) using a limited steel joint database. The prohibitive cost of testing scaled steel models led Reber (2), Visser (3) and Kuang et al (4,5) to use finite element (FE) analyses based on analytical models of cylindrical shells. Subsequent equations by Wordsworth and Smedley (6,7) using acrylic model specimens and by Efthymiou and Durkin (8,9) employing 3-D shell FE analyses, have made considerable advances both in the accuracy of parametric equations and in the range of joints covered. Over this period, differences arose between the experimental procedures used to derive stress concentration factors for simple tubular joints. These differences led to inconsistencies both in the measured SCFs themselves, and also in the SCF parametric formulae based on these measured SCF values. These inconsistencies in SCF derivation are reflected in the hot-spot S-N curves used to estimate fatigue lives for simple tubular joints. In the Lloyd s Register (LR) group-sponsored project SCFs for tubular complex joints, parametric expressions have been derived to calculate the relief obtained by adding ring-stiffeners into a simple unstiffened tubular joint. Similar expressions also exist which give the relief obtained by grouting tubular joints. In both cases a relief factor is applied to the unreinforced joint SCF, further highlighting the need for accurate simple joint SCF equations. In the UKOSRP II project, reported in 1987 (10), a limited programme of work investigated anomalies between the existing simple joint parametric SCF equations. However, many of the anomalies highlighted in the UKOSRP II project remain unresolved. A test programme on unstiffened tubular joints performed by Lloyd s Register (11), has further emphasised inconsistencies between test results and the more commonly used parametric equations. Despite considerable differences that exist between parametric SCF formulae, the current offshore installations guidance document (12), accepts the use of parametric equations to determine hot-spot stresses in tubular joints. While current guidance merely states that the appropriate SCF should be used, it is the intention of future guidance (13) to give more specific directions on which parametric SCFs may be employed in fatigue design, and the procedures that should be considered prior to performing either experimental tests, FE analysis, or in deriving parametric equations. In this report, 2 studies, largely funded by the HSE, are presented. In the first study a comprehensive database of steel and acrylic simple joint SCFs was created, titled the LR SCF derivation database and described in Section 3. The acceptance criteria for this database was agreed with representatives of the Industry. From this database a new set of SCF formulae for simple joints (ie the LR equations) has been derived. These new equations are given in Appendix A. In the second study the database above was refined under the auspices of the Review Panel for Fatigue Guidance. The finalised database, titled the SCF assessment database and given in Appendix B, was 5
, Visser (3) and Kuang et al (4,5) to use finite element (FE) analyses based on analytical models of cylindrical shells.")
9 used to assess existing simple joint SCF parametric formulae including the new LR equations. The equations assessed are given in Appendix A and the assessment criteria in Section In the SCF assessment, 5 sets of parametric equations were considered. However, in the new HSE fatigue guidance only 2 sets are considered for recommendation. Therefore, only these 2 sets, ie the new LR and Eftymiou equations, are given in Appendix A. 6

10 2. REVIEW OF EXPERIMENTAL TECHNIQUES The HSE fatigue guidance background document (14), highlights 5 factors that influence the development of fatigue failure in welded tubular joints, and hence determine the joint fatigue life. The first of these factors describes the overall geometry of the tubular joint and the detailed geometry of its welds. For this factor, the hot-spot is described as the region where fatigue cracking is likely to initiate due to a stress concentration. The definition of the hot-spot stress varies considerably from a very general philosophy to a detailed description of its formulation, depending upon the source quoted. During early UKOSRP studies the HSE sought a clarification in the definition of the hot-spot stress and its calculation, thus enabling the derivation of the T S-N curve. In this project the HSE definition of hot-spot stress and design guidance has been adopted, although alternative approaches are discussed and assessed. The definition of hot-spot stress (14), as the region where fatigue cracking is most likely to initiate due to a stress concentration, proposed linear extrapolation of the maximum principal stresses, outside the region of weld toe influence, to the weld toe. However, differences in the definition of hot-spot stress and between the type of experimental technique employed has led to considerable variation in measured stresses between nominally identical joints. For most simple joint geometries and loadings the hot-spot will be located at either the saddle or crown. However, studies of the measured stress around the brace/chord periphery indicate that under IPB and axial load the hot-spot stress may be located at an interim position for some geometrics. 2.1 METHODS OF MODELLING TUBULAR JOINTS In the UKOSRP I project an assessment of the performance of different modelling techniques was performed (15). This assessment concluded that differences observed between SCFs measured on steel models, acrylic models and photoelastic models or derived using a finite element analysis method, gave very similar results once differences in the local joint geometry and the experimental procedure were taken into account. In previous studies, acrylic models and FE results have been utilised to develop parametric formulae which are verified against results from steel models. In this study the limited range of geometrics for steel joints led to the consideration of alternative methods into the database against which parametric methods would be benchmarked. This decision is discussed in detail in Section STRAIN GAUGE LOCATIONS AND STRESS SAMPLING POSITIONS Due to the rapid increase and variation in stress around the region of the weld toe resulting from the local weld geometry, it is recommended that strain gauges should be located outside this notch region. The maximum extent of this local notch region is defined as 0.2ª rt (and not less than 4 mm), where r and t are the brace outside radius and thickness respectively. The dependence upon ªrt has been derived from 7

11 studies of the bending stress in tubes (16), and this parameter has been empirically modified following detailed analyses of large scale tubular joint intersections in the UKOSRP and ECSC projects. The ECSC recommendations for the extent of the notch region to 0.2ª rt have been adopted by the HSE as the suggested location for the gauges nearest to the weld toe or brace/chord intersection. However more recent work on photoelastic joints (17) suggests that for some K joint configurations this notch region extends beyond 0.2ªrt, giving a maximum error in the order of 10% - 12%. A second set of gauges, enabling linear extrapolation to the weld toe, are located according to the location around the brace/chord intersection: chord saddle chord crown braceside = = = 5 arc ª(rtRT) 0.65ª(rt) (It should be noted that this definition does not give guidance as to the gauge location on the chordside between the saddle and the crown locations). Where non-linear extrapolation is required a third gauge set is placed equidistant from the second gauge set (eg braceside = 1.10ªrt). An alternative approach developed by Gurney (18), recommended a minimum strain gauge distance of 0.4T, from the weld toe, where T is the chord thickness. Gurney s recommendation results from FE analyses of simple fillet welded joints in plates, which indicate that the region of the notch stress is a function of the thickness of the plate upon which stresses are being measured. In comparing the variation in SCF between the ECSC and the Gurney recommended gauge locations, Swensson et al (19) tested 3 X joints (ß = 0.35, 0.67 and 1.00). These tests showed that on average the SCF derived by the Gurney method exceeds the ECSC method by 7.6%, with the least difference between the methods occurring when ß = This result corresponds with the findings of another analysis by Wardenier (20), which states that the hot-spot stress will be nearly the same for joints with ß = 0.6 irrespective of the method used, although for joints with pronounced 3-dimensional effects, eg ß = 1.0, Gurney s method describes the notch region better than the ECSC method. 8

12 2.3 MEASUREMENT OF STRESSES AND STRAINS Strains are measured on physical models using either strain gauge rosettes or via sets of single strain gauges placed perpendicular and parallel to the joint intersection or weld toe. The methodology for determining maximum principal stresses from measured strains is shown below: Maximum principal stress = max Maximum principal stress = min max min = E 2 ( a + c) 1 v! ª2 (1 + v) ª( b a ) 2 + ( b c ) 2 Where E = Young s modules of the material = Poisson s ratio of the material For angle of maximum principal stress ( ) tan 2 = 2 b a c e c a It has been suggested by Lalaini (21), that for vertical braces the angle of the maximum principal stress ( ) tends to lie almost perpendicular to the joint intersection (ie = 0 ). Consequently the difference between the SCF obtained from principal stresses and from strain concentration factors (SNCFs) is minimised. As the angle of the maximum principal stress increases, possibly due to the brace angle decreasing, the difference between SCF and SNCF will tend to increase). Three ways of utilising the strain gauge results to calculate the SCF or SNCF were assessed by Lloyd s Register in this study: a) Extrapolation of the maximum principal stresses. b) Extrapolation of the strains perpendicular to the weld toe. c) Conversion of the strain concentration factor calculated in method (b) to a biaxial stress using: SCF = SNCF +.SNCF 90 (1 2 ) 9
 ª( b a ) 2 + ( b c ) 2 Where E = Young s modules of the material = Poisson s ratio of the material For angle of maximum principal stress ( ) tan 2 = 2 b a c e c a It has been suggested by")
13 [where is the Poisson s ratio of the model material ( = 0.30 steel, = 0.36 acrylic) and SNCF 90 is the strain concentration factor from the nearest parallel gauge to the weld toe or joint intersection]. In this study, it was found that for 90 joints, the maximum principal stress (method (a)) was approximately 20% - 25% larger than the perpendicular strain (method (b)) for acrylic models, while for steel models the difference was nearer to 15%. This can be accounted for by the different Poisson s ratio for the 2 materials. Furthermore, for both steel and acrylic 90 joint specimens, it was confirmed that the angle of the maximum principal stress varied by less than 10% from the perpendicular to the joint intersection. These results correspond well with the UEG design guide (22) which recommends an overall factor of 1.20, while examination of a K joint by Lalani (21) suggest a lower factor of For both steel and acrylic joints with inclined braces, the angle of the maximum principal stress increased as the brace angle decreased. However, far more significant differences occur between the maximum principal stress and the perpendicular strain on steel joints (30% - 50%) than on similar acrylic model specimens (23% - 30%) despite the aforementioned difference in the Poisson s ratio. This inconsistency between the limited number of steel and acrylic joint specimens reviewed requires investigation in future testing programmes. For all joint configurations, the SCF derived from maximum principal stress (method (a)) is consistently 2% - 3% larger than the SCF derived from biaxial stress (method (c)). 2.4 EXTRAPOLATION PROCEDURE The HSE recommendations regarding extrapolation technique requires linear extrapolation to be adopted for 90 T and X joints (ß<1), while for inclined Y and K joints it is stated that in some cases there may be a non-linear geometric stress distribution. However, the hot-spot stress S-N approach for simple tubular joints is currently based on linear extrapolation, irrespective of the joint configuration. The HSE does not give a method for extrapolating stresses, however, the extrapolation procedures adopted by Lloyd s Register in conjunction with acrylic model testing are given in Appendix C. Lloyd s Register have reviewed 67 simple acrylic T/Y, X and K joints that employed both linear and non-linear extrapolation of maximum principal stresses to the brace/chord intersection (23). Linear extrapolation was performed through the 2 rosettes nearest to the brace/chord junction, while non-linear extrapolation, employing a quadratic fit or Lagrange polynomial, utilised these 2 rosettes and a third rosette positioned on equal distance from the second rosette. It was concluded that non-linear extrapolation exceeds linear extrapolation on the chordside for all loadcases by less than 5% irrespective of brace angle. On the braceside, particularly at the brace crown under IPB, larger differences of around 10% can be found, although the degree of brace inclination does not appear to be a significant factor, see Table 2.1. However, it should be noted that to give a realistic 10

14 assessment of the differences between linear and non-linear extrapolation, joints where ß = 1 or where the measured SCF was less than 1.5 were excluded. For ß = 1 joints (particularly ß = 1 X joints) where the stresses tend to be relatively small, SCFs using non-linear extrapolation could be twice those using linear extrapolation (eg SCF = 0.41 linear, and SCF = 0.76 non-linear). Table 2.1 Increase in SCF using non-linear extrapolation Joint config T Y X K No of joints Chord Saddle 4% 4% 3% 4% Axial Load Chord Brace Crown Saddle 0% 6% - -1% 5% 6% -1% 1% Brace Crown 6% - 6% 8% OPB Chord Brace Saddle Saddle 2% 5% 2% -2% 3% 6% 2% 0% IPB Chord Brace Crown Crown 4% 10% - - 5% 12% 3% 7% 2.5 THE INFLUENCE OF A WELD FILLET model tests and some FE analyses do not include a weld fillet on the tubular joint intersection, and therefore require some modification to their measured hot-spot stress if they are to be compared to steel joint test results. The addition of a weld fillet to a tubular connection results in a reduced SCF which is measured at the weld toe rather than at the joint intersection. It is important to note that the extrapolation of stresses on a model with no weld fillet should not be foreshortened to where the weld toe would be in an attempt to reflect the influence of the weld The inclusion of a weld fillet Employing acrylic model T and 90 X joints, Smedley (24) produced a weld fillet correction factor based on the chordside weld fillet leg length. SCF Weld toe = SCF No weld X T (where x is the weld fillet leg length on the chordside) While being specifically designed for the chordside stress on 90 joints, Smedley also considered this expression to be acceptable for 90 joints on the braceside. However, for inclined braces it was considered that this factor was not applicable. Alternatively, Marshall (25) proposed a design equation, based on FE analysis of K joints. SCF Brace weld toe = [SCF Brace mid surface 1.0] x exp 0.5T+t rt This equation, applied to the braceside mid-section stress, uses an exponential decay function to approximate the SCF at the braceside weld toe, and is generally used in conjunction with the Kuang parametric equations (5). 11

15 A more recent approach (26), suggested that for a specimen with no weld fillet, the extrapolation to the brace/chord intersection should be foreshortened by half the standard fillet leg length to simulate the inclusion of a weld fillet, see Figure 2.2. Further work by Lloyd s Register using this approach on joints with ß<1, showed a consistent stress reduction factor of 0.95 on the chordside and 0.88 on the braceside, when a weld fillet leg length = t/2 on the chordside and = t on the braceside was described in accordance with API recommendations for controlled weld profiles (27). It should be noted that for many of the steel test specimens, particularly those of small scale, the weld leg length on the braceside exceeded the brace thickness (t). 12
.")
16 13

17 Table 2.2 FE analysis of a joint with and without a weld fillet (linear extrapolation) Loading No weld SCF Axial OPB IPB 6.63 Mean reduction factor Chordside Inc weld SCF No weld inc weld No weld SCF Braceside Inc weld SCF No weld Inc weld (Joint parameters: ß = 0.5, = 1.0, = 28.6 and = 5.0) It can be seen in Table 2.3, that for the joint geometry modelled by Efthymiou, the Wordsworth weld reduction factor gives the closest agreement to the measured weld fillet reduction factor. Table 2.3 Reduction in SCF due to the inclusion of a weld fillet Chordside Braceside Measured factor Smedley factor Marshall factor Wordsworth factor Weld cut-back at the saddle location on ß = 1 joints Following a series of steel joint tests on ß = 1 T joints under OPB, Wylde (29) described the variation in measured SCFs between tubular members of different diameter. On the chordside, the SCFs on 168 mm diameter joints were more than twice the SCF values on 457 mm diameter joints. Wylde felt that the difference between the 2 types of joint was most likely due to the differences in the weld profiles rather than the joint size. It was concluded that caution should be applied to ß = 1 joints since no parametric equation takes into account the weld profile. It was noted by Wordsworth (26) and confirmed in this project, that the largest differences between measured SCFs and predicted SCFs occur when the brace diameter approaches the chord diameter. Some of these inconsistencies in measured SCF values may be attributed to the varying degrees of weld cut-back used in the test specimens, see Figure 2.3. At the saddle location, the SCF decreases rapidly as ß approaches 1. For example, using the Wordsworth/Smedley equation (6) on a T joint, the SCF increases by 38% under axial load and by 50% under out-of-plane bending by altering ß from ß = 1.0 to ß = For ß = 1 joints with extreme weld cut-back, the separation between the weld toes at the saddle locations may be considerably less than the chord/brace diameter. It was suggested by Wordsworth that for joints with equal chord and 14

18 brace diameters, ß should be defined as the weld toe separation relative to the chord diameter (ie d /D). However, it was noted that the weld toe separation d is neither easily calculated nor measured, see Figure 2.4. Following a detailed analysis of the parameter ß = d /D, Lloyd s Register found that ß may be reasonably estimated by: = 1 - ( y t X sin 0.65 ( o )) Where is the degree of weld cut-back (If is not defined, a default value of = 20 is suggested). This expression has been included in the new Lloyd s Register parametric equations for simple tubular joints. By employing this expression for ß = 1 joints, SCFs may be derived to a greater accuracy for these complex joint configurations, and consequently more accurate fatigue lives may be estimated Weld fillet profile The profile of the weld fillet was examined in an FE analysis of X joints by Lieurade (30). This study compared concave, straight and convex weld profiles and concluded that outside the notch region the weld profile was not a highly significant 15
) Where is the degree of weld cut-back (If is not defined, a default value of = 20 is suggested).")
19 factor, although a concave weld will always give the lowest stress. Since most joints are generally modelled to a concave weld profile there will be negligible influence on the hot-spot stress due to marginal differences in weld profile. 2.6 CHORD LENGTH AND CHORD END EFFECTS Most test specimens are constrained by their physical size to an (= 2L/D) value in the range = 5 to = 15, although Wordsworth/Smedley (6) performed tests on acrylic models with values up to = 40. In practice over 60% of nodes have a values in excess of = 20, see Figure 2.5 and 35% of nodes exceed the ( = 40) upper bound for recommended by most of the parametric SCF equations. In the literature study performed at the beginning of this project, it was frequently found that there was very little if any information given about the chord length, chord end fixity or the test rig structure. Therefore all joints in this project were assumed to be pinned at the chord ends when assessed against the parametric equations. Furthermore, confusion often arises over the somewhat ambiguous definition of the chord length and parameters in both test specimens and in structural nodes. The problem is further complicated in the test rig by variations in the clamping of the chord (ie pinning or fixing the chord ends), and the inclusion of rigid diaphragms which act in a similar manner to ring-stiffeners. 16

20 2.6.1 Supported chord effects at the crown under axial load The SCF at the crown location under axial load in T/Y joints is composed of a local shell deformation effect and an overall chord in-plane bending effect that is linear in. This fact is not recognised by the Kuang (5) and HCD (31) equations which will eventually lead to underprediction in the crown SCFs as increases. The chord in-plane bending term (B0) has been derived from the brace axial force applied to a simply supported centrally located brace where: B0 = C ( /2y)) (a/2 / sin ) sin (1 3/(2Y)) l C (a/2) sin While B0 gives a good estimate of the bending stresses in a test specimen, the stresses in the chord wall in an offshore structure are not simply related to the brace axial force. Consequently, it is almost certain that a poor SCF result will be obtained. In this assessment of the T/Y joint SCF equations, it was found that there were considerably more SCF underpredictions for the crown under axial load than for other loadcases/locations. An analysis of these results concluded that the predicted SCFs were underestimating the measured SCFs due to an incorrect interpretation of in the chord in-plane bending term. In some cases the quoted value of is based on the physical chord length, whereas for the chord in-plane bending at the chord crown should be based on the separation of the pinned supports. For some steel joints with relatively short chord lengths the quoted value of increased by around 30% once the pinned supports were also considered. Since the overall structural FE analysis readily gives the chord in-plane bending and axial stresses, then a simpler and better analysis would result from utilising these known FE values rather than estimating these effects from simply supported joint approximations. In the Lloyd s Register fatigue analysis using the PALS software package, it was found that this approach could lead to significant differences in the overall hot-spot stress for some joint configurations when compared to the approximation described above Short chord effects at the saddle Unlike the crown where the chord length influences the degree of bending in the chord, any chord length effects at the saddle will be due to the restriction on chord ovalisation imposed by the chord end diaphragms. Therefore at the saddle, the quoted value should be based on the separation of the chord end diaphragms (ie the physical length of the chord specimen). Wordsworth/Smedley tested joints with varied from = 13.5 to = 40.0, and concluded that chord length was not a significant factor at the saddle. However Efthymiou and Durkin (8) found that joints with short chord lengths ( <12) exhibit a significant reduction in the SCF at the saddle, due to the restrictions on chord ovalisation caused by the locality of the chord end supports. Chord end diaphragms used to support the test specimen, act in a similar manner to ring-stiffeners and restrict the degree of chord ovalisation. Consequently, Efthymiou and Durkin proposed correction factors to be able at the saddle location on joints with short chord lengths. These correction factors were found to depend not only on 17

21 , but also on ß and. So that for a T joint under axial load with a relatively thin chord wall and = 5, the short chord correction factor can halve the saddle SCF compared to a similar node with = 10. Most steel joint test specimens are constrained to having values in the range = 5 to = 10, with the larger diameter joints tending to have the smaller values. Therefore, nearly all the SCFs derived from steel joint test results are influenced by the locality of the end restraint, and as a consequence the SCFs measured on test specimens may be significantly less than those observed on more realistic joints. It should be emphasised that this is a chord end ovalisation effect rather than a chord support effect. Therefore, for most X joints where the joint is supported by the brace ends and no chord end diaphragms are fitted, chord length effects are far less pronounced. As steel joint test specimens are used as a benchmark for testing the validity of parametric equations, it is important that end effects are taken into account prior to any assessment. In future, it is recommended that consideration should be given to short chord effects before any physical model or FE analyses are performed, whether for static strength, SCF or fatigue endurance. 3. DATABASE This section describes the Lloyd s Register SCF derivation database. This database of steel and acrylic joint SCFs was created for the development of a new set of parametric equations for simple tubular joints. The work was largely funded by the HSE. At the outset of the project lengthy discussion took place with both the HSE and with many representatives from the oil industry regarding the composition of this database. It was felt that steel data alone was insufficient to enable a new set of parametric equations for simple joints to be developed, particularly for X, K and KT joints. It was considered that acrylic models gave a good representation of the stress distribution observed in equivalent steel joints, and that acrylic joints should be included in the database provided allowance was made for differences in experimental techniques. This conclusion was supported by assessments of experimental techniques performed in the UKOSRP I project (15). With regard to FE results, it was felt that published data was of variable quality and often the analysis methodology was insufficiently documented. Therefore, it was decided to exclude SCFs derived by FE analysis from the database, while accepting that FE analysis, particularly using 3-D shell elements, generally gives good correlation to similar steel joint configurations. The database of photoelastic model tests was considered too small to be validated independently. 3.1 CRITERIA FOR THE ACCEPTANCE OF SCF DATA The initial objective of this project was to gather measured SCF data relating to simple tubular joints. To meet this objective, a literature search was undertaken to locate experimental data relevant to this project. In association with SCF results from work performed in-house, this literature search has provided a substantial database for this project. 18
22 (i) The following data items are included: a) Source of the SCF data - title of paper, authors, where the data has been located, the date of publication and any confidentiality restrictions. b) Experimental details - specimen material, extrapolation type, location of the nearest gauge, stress/strain measurement, weld fillet inclusion and chord end fixity. c) Number and configuration of the joints tested. d) Geometric and parametric details of the joint - (D, T, L, d, t,,,,, ). e) Applied loadcases - (axial, OPB, IPB - single, balanced, unbalanced). f) The measured SCFs and their location on the joint - (chordside or braceside - saddle, crown or an interim location). g) Repetitions - where several configurations were tested with the same joint parameters, the results of each test were included. However, the danger of bias in the analysis was noted. h) Several saddle results - where 2 or 4 individual SCFs are quoted for one joint, the maximum SCF result was taken. i) Tension/compression - where a joint is axially loaded in both tension and compression, the average of the 2 results was taken. Verifying the accuracy of the data involved locating the source paper or experimental reports where possible and comparing the given results to a second publication. This exercise was time consuming and not always feasible, however the necessity of this cross-checking procedure was proved with several inconsistencies in SCF results occurring between published papers. (i) Single-plane, non-overlapped, unstiffened and ungrouted tubular joints, with a chord diameter m150 mm and the strain gauge nearest to the brace/chord intersection being outside the notch region, were recorded on the database. The chord length quoted in most papers was the physical length of the test specimen, and this was the value recorded in the database. However, it would have been desirable to record 2 chord length values if these had been quoted. The separation between the chord end diaphragms is required to derive ovalisation effects, and the separation between the chord end supports is required to calculate the degree of chord bending in the test specimen. Only joints with parameters typical of those noted in practice were included, and the following subset of data was felt to be typical of offshore platforms: [1.05, [40, SCFsm1.5, [1.0 (only = 1 joints at the saddle where the degree of weld cut-back is recorded). 19
23 (ii) The initial analysis of the SCF data involves the standardisation of the measured SCFs to conform with the HSE recommended method, this has been achieved by the use of a number of correction factors covering differences in the experimental derivation of the hot-spot stress, see section FACTORS APPLIED TO THE SCF DATABASE Strain gauge locations: the nearest strain gauge to the weld toe or to the brace/chord intersection must be in excess of a distance of 0.18 rt from the weld toe or the brace/chord intersection. This is based on a 10% reduction in the recommended value of 0.2 rt, since some papers appear to round strain gauge location to the nearest mm. This small allowance did not result in a significant increase in the extrapolated SCF value. Maximum principal stress or biaxial stress derived from strain concentration factors: it is considered that no factor is required to differentiate between SCFs derived from either biaxial stress or maximum principal stress. Stress and strain measurement: the recommended factors for converting perpendicular strain (SNCFs) to maximum principal stress (SCFs) are: SCF = SNCF X 1.15 for T joints (steel joints). SCF = SNCF X 1.23 for T joints (acrylic joints). For inclined braces larger differences between SNCFs and SCFs would be expected, however there is insufficient data on strain concentration factors from inclined braces to derive an estimate of this difference. These factors were applied to all braces despite these limitations. Extrapolation procedure: the recommended factor for converting non-linear SCFs to linear SCFs is: Linear = non-linear X 0.95 (including = 1 joints). This factor is less than the 10% difference proposed by UEG (22), but would appear to give a better estimate of the difference between linear and non-linear stress since this value is based on a database of 57 joints analysed in the LR project (23). The absence of a weld fillet: weld fillet correction factors of 0.95 on the chordside and of 0.86 on the braceside have been adopted, these values are based on the only measured weld fillet comparison available (ie the KSEPL joint) (28). Weld cut-back at the saddle location on = 1 joints: following a detailed analysis of the parameter = d D, Lloyd s Register found that may be reasonably estimated by: = 1 ( X sin 0.65 ( o )) Where is the degree of weld cut-back (If is not defined, a default value of = 20 is suggested). 20
24 This expression has been included in the new Lloyd s Register parametric equations for simple tubular joints, listed in Appendix A. It should be noted that many steel joints in particular, have values based on the separation of pinned end supports rather than chord end diaphragm separation. This gives a more accurate assessment of the SCF at the crown which is dependent upon the level of bending in the chord, while the reduction in SCF due to the restriction on chord ovalisation noted at the saddle on joints with short chord lengths tended to be underestimated. Chord length effects due to the restriction of ovalisation caused by the diaphragms at the chord ends leads to considerable reduction in SCFs at the saddle for short chord lengths. This problem is described by Efthymiou (8) who published short chord correction factors to be used in accordance with the Efthymiou SCF equations when (=2L/D) <12. A substantial number of steel T joints were tested with values in the range = 4.3 to To eliminate these joints from the database would have had a substantial effect on the number of steel joints that could be considered. 4. SIMPLE JOINT SCF EQUATIONS The parametric equation gives the designer the most convenient way of estimating the hot-spot stress in simple tubular joints, however at the present time no equations are recommended by the HSE. Even between the more commonly used parametric equations, there are significant differences in the way the hot-spot stress is defined, calculated, and in their recommended ranges of applicability. It should be noted that some of the comments made here are based on the assessment covered in Section KUANG EQUATIONS (1975 AND 1977) The Kuang equations (5), cover T/Y, K and KT joint configurations and utilise a modified thin-shell finite element program specifically designed to analyse tubular connections. The tubular connections were modelled without a weld fillet, and stresses were measured at the mid-section of the member wall. Therefore the stresses calculated using the Kuang finite element models are considerably different from the HSE definition of hot-spot stress. The Kuang equations are based on a mean fit to the database of FE joints examined, and do not indicate the location of the hot-spot around the periphery, but are merely expressed as chordside or braceside. With regard to the Kuang equations, the following points were noted: (i) Of the equations reviewed, the Kuang equations have the most restricted validity range, and consequently cover the fewest joints in the database. The Kuang equations were not designed to cover joints with >0.8 and do not cover X joints or the unbalanced OPB loadcase for K and KT joint configurations. (ii) For T/Y joints under axial load, no account is given to the beam bending effect, and consequently underpredictions at the crown for high values may be anticipated. 21
25 (iii) No account is given to chord length effects at the saddle, due to the chord end restraints. Therefore, given that the database of FE joints utilised by Kuang had generally short chord lengths, there is a possibility of underestimation of SCFs for more realistic chord length ( ) values. (iv) The performance of the Kuang equations for T/Y joints for values above 0.5 is generally poor, although there can be considerable variation in the degree of underprediction depending upon the loadcase considered. For example, the Kuang equation gives a very poor fit to chordside SCFs under OPB underpredicting 70% of joints in this database, yet gives a reasonably good fit to the braceside SCFs under OPB. (v) For K joints, the Kuang equations are generally conservative for all values of. Non-symmetric K joint configurations exhibit the largest difference between the measured SCFs and the predicted SCFs, since the Kuang K joint equations were specifically designed for joints with symmetric braces. (vi) For KT joints under balanced axial load, the Kuang equations show good agreement with the measured SCF values on the chordside. However, on the braceside, the Kuang KT joint SCF equations differs considerably from the corresponding equation for a K joint, with the predicted SCFs for the KT joints in this database up to 4 times larger than the measured SCF values. The Kuang equations are still widely used in the fatigue design of offshore tubular joints. 4.2 WORDSWORTH/SMEDLEY EQUATIONS (1978 AND 1981) The Wordsworth/Smedley (W/S) equations were derived using acrylic model test results on tubular joints modelled without a weld fillet. The equations covering T/Y and X joint configurations were published by Wordsworth/Smedley in 1978 (6), and the K and KT joint configurations were covered by Wordsworth in 1981 (7). Generally, the HSE recommendations for the derivation of the hot-spot stress were followed, using maximum principal stresses from outside the (0.2 rt) notch zone. However, some areas of uncertainty do exist. The first surrounds the extrapolation technique adopted, which appears to be generally linear except where the stress distribution was found to be particularly non-linear and therefore open to error. The second concerns the number of sets of strain gauges adopted around the brace/chord intersection. The Wordsworth parametric equations specifically cover the saddle and crown, but it is unclear whether interim sets of gauges were adopted, particularly under IPB where for some configurations the hot-spot stress occurs between the saddle and crown. For the W/S and Wordsworth equations, the following points were noted: (i) On the braceside, for all loadcases and measuring locations, the W/S and Wordsworth equations estimate the SCF using a simple factor applied to the chordside SCF. Consequently, the predicted SCFs on the braceside tend to be rather conservative relative to the measured braceside 22
26 SCFs. However, it should be noted that the braceside SCF on a simple tubular joint rarely exceeds the chordside SCF. The Wordsworth equations generally give a good estimate of the measured chordside SCFs. (ii) For joint configurations with equal chord and brace diameters (ie = 1 joints), a value of = 0.98 was taken at the saddle location as recommended by Wordsworth to simulate the weld cut-back found at the saddle in typical steel = joints. (iii) The Wordsworth equations for K and KT joints utilise carry-over functions applied to the T joint expressions. Therefore the influence of adding further braces to a simple T joint can clearly be determined. (iv) Under axial loading and OPB at the saddle location, the Wordsworth equations tend to underpredict measured SCFs on joints with = 0.8 and high, and joints with = 1.0 where there is a significant degree of weld cut-back. (v) The W/S and Wordsworth equations are only valid for chord radius to thickness ratios R/Tm12. A significant number of tubular joints are designed with relatively thick chords, to avoid the use of ring-stiffeners. Consequently, R/T ratios in the range 8 [R/T< 12 are not uncommon in practice, and by using the W/S and Wordsworth equations a conservative assumption of R/T = 12 must be made in determining the SCF. 4.3 UEG EQUATIONS (1985) The UEG equations proposed in 1985 (22), are based on the W/S and Wordsworth equations with a modification factor applied to configurations with high ( >0.6) or high ( >20) values. The following points may be made with regard to the UEG equations: (i) All the comments for the W/S equations hold true for the UEG equations except for the weld-cut back simulation at = 1, which is accounted for in the Q term. (ii) The factors Q and Q are both applied under axial load and OPB while only Q is applied under IPB where: Q = 1.0 Q = 0.3/ ( ) Q = 1.0 Q = 480/ ( ) for [0.6 for >0.6 for <20 for m20 These modification factors based on comparisons of predicted and measured results from both static and fatigue studies, apply to all joint configurations and are designed to give a characteristic set of equations (ie underpredicting 5% of the measured data). 23
27 4.4 EFTHYMIOU/DURKIN EQUATIONS (1985 AND 1988) In 1985, Efthymiou and Durkin (8) published a series of parametric equations covering T/Y and gap/overlap K joints. Over 150 configurations were analysed via the PMBSHELL finite element program using 3-dimensional shell elements, and the results were checked against the SATE finite element program for one T joint and 2 K joint configurations. The hot-spot SCFs were based on maximum principal stresses linearly extrapolated to the modelled weld toe, in accordance with the HSE recommendations, with some consideration being given to boundary conditions (ie short chords and chord end fixity). In 1988, Efthymiou (9) published a comprehensive set of simple joint parametric equations covering T/Y, X, K and KT simple joint configurations. These equations were designed using influence functions to describe K, KT and multi-planar joints in terms of simple T braces with carry-over effects from the additional loaded braces. With respect to the Efthymiou/Durkin equations, the following points may be noted: (i) It has been shown by Efthymiou that the saddle SCF is reduced in joints with short chord lengths, due to the restriction in chord ovalisation caused by either the presence of chord end diaphragms or by the rigidity of the chord end fixing onto the test rig. Therefore, the measured saddle SCFs on joints with short chords may be less than for the equivalent joint with a more realistic chord length. Factors have been included in the Efthymiou parametric equations to cover short chords. (ii) The T/Y joint equation for the saddle under axial load includes a short chord correction factor for either fixed or pinned ends. The short chord effect at the saddle is due to the presence of chord end diaphragms, therefore, it is unclear why the chord end fixity should be a factor. The equation for X joints at the brace crown under axial load does not equal the corresponding T/Y joint equation excluding chord bending terms, as would be expected. (iii) The Efthymiou equations give a comprehensive coverage of all the parametric variations and are designed to be mean fit equations. Due to the greater correlation with steel models by the Efthymiou FE models, and the fewer conservative assumptions made, these equations tend to be nearest to a mean fit and consequently more underpredictions are frequently observed. (iv) Under unbalanced OPB, the Efthymiou equations give a good fit to symmetric K joints or the outer braces in KT joints, but consistently appear to underestimate the SCF in the branch with max in non-symmetric K joints. 4.5 HELLIER, CONNOLLY AND DOVER EQUATIONS (1990) The Hellier, Connolly and Dover (HCD) equations (31) were published in 1990 and were primarily developed to improve fracture mechanics estimates of remaining life for a joint rather than for tubular joint design. Consequently, the overall programme included not only hot-spot stress estimates, but modelling of the stress distribution around the brace/chord intersection and the proportions of bending to axial stress through the member thickness. The SCF equations themselves cover T/Y joint configurations alone, and have a range of applicability for the parameter limited to 24
28 [ 0.8. Therefore, these expressions are currently limited in their application, however, further work is intended for = 1 joints and for X and K joint configurations. A thin-shell finite element method was developed using the PAFEC package, and in a similar manner to the work by Kuang weld fillets were not modelled. It has been noted in previous numerical modelling of tubular joints using the PAFEC semi-loof FE package (32) that poor results were obtained for large brace relative to chord diameters, and hence an upper recommended limit of = 0.8 was proposed. In this study for values near to = 0.8, the HCD and Kuang equations often gave similar predictions, which differed from the other equations reviewed. Therefore, further correlation studies between the PAFEC FE package and physical specimens would be beneficial for large ratios. In a similar manner to the Kuang equations, the HCD equations were initially derived using the simple form: SCF = a 1 a 2 a 3 a 4 a 5 a 6 where variables a 1 to a 6 are determined using a regression analysis method. The expressions were then refined by the addition of further terms. With regard to the HCD equations, the following points were noted: (i) For T/Y joints, at the chord crown under axial load, the linear overall beam bending effect has not been accounted for in the expressions. The chord length ( ) effect was deemed to have little effect for values greater than 13.1, consequently this upper bound test parameter was removed, so that these expressions are applicable for all values exceeding = Furthermore, the majority of specimens modelled were influenced by chord end constraints, but again no account of this effect was taken. The failure to consider chord length effects must have an influence on the estimation of SCFs for joints with more realistic chord lengths. (ii) With the exception of the range, these expressions give comprehensive coverage of realistic geometries observed on offshore structures, and it is particularly worth noting that the chord radius to thickness ratio ( ) was studied to as low as = 7.6 (iii) The derived expressions estimate the SCF at both the saddle and crown locations and also the maximum SCF around the brace/chord intersection. In addition, these expressions give the angle around the brace/chord intersection of the maximum SCF. These expressions give a comprehensive description of the stress distribution around the periphery, for all loadcases, on both the chordside and braceside. However, some anomalies are associated with these expressions. The position of the hot-spot stress may be identified as being at the saddle or crown, but the hot-spot SCF equation (eg chordside) may not give the same result as the saddle/crown equations. Cases were observed, where the hot-spot SCF (at the saddle) exceeds the saddle equation SCF by up to 20%, and in other cases the saddle equation SCF was larger than the hot-spot (saddle) SCF. 25
Structural Integrity Analysis
 Structural Integrity Analysis 1. STRESS CONCENTRATION Igor Kokcharov 1.1 STRESSES AND CONCENTRATORS 1.1.1 Stress An applied external force F causes inner forces in the carrying structure. Inner forces
IMPELLER FATIGUE ASSESSMENT USING AN S-N APPROACH
 ENGINEERING PAPER 5244-08 IMPELLER FATIGUE ASSESSMENT USING AN S-N APPROACH Samuel Orr Engineering Analysis Manager Howden Technology AMCA International Engineering Conference Las Vegas, NV, USA 2 4 March
Finite Element Formulation for Plates - Handout 3 -
 Finite Element Formulation for Plates - Handout 3 - Dr Fehmi Cirak (fc286@) Completed Version Definitions A plate is a three dimensional solid body with one of the plate dimensions much smaller than the
The elements used in commercial codes can be classified in two basic categories:
 CHAPTER 3 Truss Element 3.1 Introduction The single most important concept in understanding FEA, is the basic understanding of various finite elements that we employ in an analysis. Elements are used for
AN EXPLANATION OF JOINT DIAGRAMS
 AN EXPLANATION OF JOINT DIAGRAMS When bolted joints are subjected to external tensile loads, what forces and elastic deformation really exist? The majority of engineers in both the fastener manufacturing
CH 6: Fatigue Failure Resulting from Variable Loading
 CH 6: Fatigue Failure Resulting from Variable Loading Some machine elements are subjected to static loads and for such elements static failure theories are used to predict failure (yielding or fracture).
Objectives. Experimentally determine the yield strength, tensile strength, and modules of elasticity and ductility of given materials.
 Lab 3 Tension Test Objectives Concepts Background Experimental Procedure Report Requirements Discussion Objectives Experimentally determine the yield strength, tensile strength, and modules of elasticity
Bearing strength of stainless steel bolted plates in tension
 NSCC29 Bearing strength of stainless steel bolted plates in tension G. KIYMAZ 1 1 Department of Civil Engineering, Istanbul Kultur University, Ataköy Campus, Bakırköy, Istanbul, Turkey ABSTRACT: A study
NOTCHES AND THEIR EFFECTS. Ali Fatemi - University of Toledo All Rights Reserved Chapter 7 Notches and Their Effects 1
 NOTCHES AND THEIR EFFECTS Ali Fatemi - University of Toledo All Rights Reserved Chapter 7 Notches and Their Effects 1 CHAPTER OUTLINE Background Stress/Strain Concentrations S-N Approach for Notched Members
Force measurement. Forces VECTORIAL ISSUES ACTION ET RÉACTION ISOSTATISM
 Force measurement Forces VECTORIAL ISSUES In classical mechanics, a force is defined as "an action capable of modifying the quantity of movement of a material point". Therefore, a force has the attributes
Figure 1: Typical S-N Curves
 Stress-Life Diagram (S-N Diagram) The basis of the Stress-Life method is the Wohler S-N diagram, shown schematically for two materials in Figure 1. The S-N diagram plots nominal stress amplitude S versus
Lap Fillet Weld Calculations and FEA Techniques
 Lap Fillet Weld Calculations and FEA Techniques By: MS.ME Ahmad A. Abbas Sr. Analysis Engineer Ahmad.Abbas@AdvancedCAE.com www.advancedcae.com Sunday, July 11, 2010 Advanced CAE All contents Copyright
Back to Elements - Tetrahedra vs. Hexahedra
 Back to Elements - Tetrahedra vs. Hexahedra Erke Wang, Thomas Nelson, Rainer Rauch CAD-FEM GmbH, Munich, Germany Abstract This paper presents some analytical results and some test results for different
Numerical Analysis of Independent Wire Strand Core (IWSC) Wire Rope
 Wire Rope") Numerical Analysis of Independent Wire Strand Core (IWSC) Wire Rope Rakesh Sidharthan 1 Gnanavel B K 2 Assistant professor Mechanical, Department Professor, Mechanical Department, Gojan engineering college,
Numerical Analysis of Independent Wire Strand Core (IWSC) Wire Rope Rakesh Sidharthan 1 Gnanavel B K 2 Assistant professor Mechanical, Department Professor, Mechanical Department, Gojan engineering college,
Burst Pressure Prediction of Pressure Vessel using FEA
 Burst Pressure Prediction of Pressure Vessel using FEA Nidhi Dwivedi, Research Scholar (G.E.C, Jabalpur, M.P), Veerendra Kumar Principal (G.E.C, Jabalpur, M.P) Abstract The main objective of this paper
Structural Axial, Shear and Bending Moments
 Structural Axial, Shear and Bending Moments Positive Internal Forces Acting Recall from mechanics of materials that the internal forces P (generic axial), V (shear) and M (moment) represent resultants
An Overview of the Finite Element Analysis
 CHAPTER 1 An Overview of the Finite Element Analysis 1.1 Introduction Finite element analysis (FEA) involves solution of engineering problems using computers. Engineering structures that have complex geometry
Reflection and Refraction
 Equipment Reflection and Refraction Acrylic block set, plane-concave-convex universal mirror, cork board, cork board stand, pins, flashlight, protractor, ruler, mirror worksheet, rectangular block worksheet,
Finite Element Formulation for Beams - Handout 2 -
 Finite Element Formulation for Beams - Handout 2 - Dr Fehmi Cirak (fc286@) Completed Version Review of Euler-Bernoulli Beam Physical beam model midline Beam domain in three-dimensions Midline, also called
ANALYTICAL AND EXPERIMENTAL EVALUATION OF SPRING BACK EFFECTS IN A TYPICAL COLD ROLLED SHEET
 International Journal of Mechanical Engineering and Technology (IJMET) Volume 7, Issue 1, Jan-Feb 2016, pp. 119-130, Article ID: IJMET_07_01_013 Available online at http://www.iaeme.com/ijmet/issues.asp?jtype=ijmet&vtype=7&itype=1
Effect of Burr Grinding on the Fatigue Strength of Angled Welded Connections
 Lloyd s Register Technical Papers Effect of Burr Grinding on the Fatigue Strength of Angled Welded Connections by S. E. Rutherford and H. Polezhayeva The authors of this paper retain the right of subsequent
COMPUTATIONAL ENGINEERING OF FINITE ELEMENT MODELLING FOR AUTOMOTIVE APPLICATION USING ABAQUS
 International Journal of Advanced Research in Engineering and Technology (IJARET) Volume 7, Issue 2, March-April 2016, pp. 30 52, Article ID: IJARET_07_02_004 Available online at http://www.iaeme.com/ijaret/issues.asp?jtype=ijaret&vtype=7&itype=2
Measurement of Residual Stress in Plastics
 Measurement of Residual Stress in Plastics An evaluation has been made of the effectiveness of the chemical probe and hole drilling techniques to measure the residual stresses present in thermoplastic
Optimum proportions for the design of suspension bridge
 Journal of Civil Engineering (IEB), 34 (1) (26) 1-14 Optimum proportions for the design of suspension bridge Tanvir Manzur and Alamgir Habib Department of Civil Engineering Bangladesh University of Engineering
INJECTION MOLDING COOLING TIME REDUCTION AND THERMAL STRESS ANALYSIS
 INJECTION MOLDING COOLING TIME REDUCTION AND THERMAL STRESS ANALYSIS Tom Kimerling University of Massachusetts, Amherst MIE 605 Finite Element Analysis Spring 2002 ABSTRACT A FEA transient thermal structural
Frequency domain application of the Hot-Spot method for the fatigue assessment of the weld seams
 Frequency domain application of the Hot-Spot method for the fatigue assessment of the weld seams Dr. Ing. Sauro Vannicola 1 sauro.vannicola@ch.abb.com Dr. Ing. Luigi De Mercato 2 luigi.de-mercato@ch.abb.com
Efficient Curve Fitting Techniques
 15/11/11 Life Conference and Exhibition 11 Stuart Carroll, Christopher Hursey Efficient Curve Fitting Techniques - November 1 The Actuarial Profession www.actuaries.org.uk Agenda Background Outline of
THE COMPOSITE DISC - A NEW JOINT FOR HIGH POWER DRIVESHAFTS
 THE COMPOSITE DISC - A NEW JOINT FOR HIGH POWER DRIVESHAFTS Dr Andrew Pollard Principal Engineer GKN Technology UK INTRODUCTION There is a wide choice of flexible couplings for power transmission applications,
Fatigue Assessment of Weld Terminations in Welded Cover-Plate Details; a Comparison of Local Approaches
 Nordic Steel Construction Conference 2012 Hotel Bristol, Oslo, Norway 5-7 September 2012 Fatigue Assessment of Weld Terminations in Welded Cover-Plate Details; a Comparison of Local Approaches Mohsen Heshmati
Finite Element Method (ENGC 6321) Syllabus. Second Semester 2013-2014
 Syllabus. Second Semester 2013-2014") Finite Element Method Finite Element Method (ENGC 6321) Syllabus Second Semester 2013-2014 Objectives Understand the basic theory of the FEM Know the behaviour and usage of each type of elements covered
Finite Element Method Finite Element Method (ENGC 6321) Syllabus Second Semester 2013-2014 Objectives Understand the basic theory of the FEM Know the behaviour and usage of each type of elements covered
CRITERIA FOR PRELOADED BOLTS
 National Aeronautics and Space Administration Lyndon B. Johnson Space Center Houston, Texas 77058 REVISION A JULY 6, 1998 REPLACES BASELINE SPACE SHUTTLE CRITERIA FOR PRELOADED BOLTS CONTENTS 1.0 INTRODUCTION..............................................
Design of Steel Structures Prof. S.R.Satish Kumar and Prof. A.R.Santha Kumar. Fig. 7.21 some of the trusses that are used in steel bridges
 7.7 Truss bridges Fig. 7.21 some of the trusses that are used in steel bridges Truss Girders, lattice girders or open web girders are efficient and economical structural systems, since the members experience
BEHAVIOR OF WELDED T-STUBS SUBJECTED TO TENSILE LOADS
 BEHAVIOR OF WELDED T-STUBS SUBJECTED TO TENSILE LOADS R.A. Herrera 1, G. Desjouis 2, G. Gomez 2, M. Sarrazin 3 1 Assistant Professor, Dept. of Civil Engineering, University of Chile, Santiago, Chile 2
Stack Contents. Pressure Vessels: 1. A Vertical Cut Plane. Pressure Filled Cylinder
 Pressure Vessels: 1 Stack Contents Longitudinal Stress in Cylinders Hoop Stress in Cylinders Hoop Stress in Spheres Vanishingly Small Element Radial Stress End Conditions 1 2 Pressure Filled Cylinder A
Stresses in Beam (Basic Topics)
") Chapter 5 Stresses in Beam (Basic Topics) 5.1 Introduction Beam : loads acting transversely to the longitudinal axis the loads create shear forces and bending moments, stresses and strains due to V and
Chapter 5 Stresses in Beam (Basic Topics) 5.1 Introduction Beam : loads acting transversely to the longitudinal axis the loads create shear forces and bending moments, stresses and strains due to V and
Objective To conduct Charpy V-notch impact test and determine the ductile-brittle transition temperature of steels.
 IMPACT TESTING Objective To conduct Charpy V-notch impact test and determine the ductile-brittle transition temperature of steels. Equipment Coolants Standard Charpy V-Notched Test specimens Impact tester
2001/069. Decks, stairways,gangways and their associated handrails OFFSHORE TECHNOLOGY REPORT HSE
 HSE Health & Safety Executive Decks, stairways,gangways and their associated handrails Prepared by Bomel Ltd for the Health and Safety Executive OFFSHORE TECHNOLOGY REPORT 2001/069 HSE Health & Safety
Introduction to Solid Modeling Using SolidWorks 2012 SolidWorks Simulation Tutorial Page 1
 Introduction to Solid Modeling Using SolidWorks 2012 SolidWorks Simulation Tutorial Page 1 In this tutorial, we will use the SolidWorks Simulation finite element analysis (FEA) program to analyze the response
The Bending Strength of Pasta
 The Bending Strength of Pasta 1.105 Lab #1 Louis L. Bucciarelli 9 September, 2003 Lab Partners: [Name1] [Name2] Data File: Tgroup3.txt On the cover page, include your name, the names of your lab partners,
DESIGN OF SLABS. 3) Based on support or boundary condition: Simply supported, Cantilever slab,
 Based on support or boundary condition: Simply supported, Cantilever slab,") DESIGN OF SLABS Dr. G. P. Chandradhara Professor of Civil Engineering S. J. College of Engineering Mysore 1. GENERAL A slab is a flat two dimensional planar structural element having thickness small compared
DESIGN OF SLABS Dr. G. P. Chandradhara Professor of Civil Engineering S. J. College of Engineering Mysore 1. GENERAL A slab is a flat two dimensional planar structural element having thickness small compared
Optimising plate girder design
 Optimising plate girder design NSCC29 R. Abspoel 1 1 Division of structural engineering, Delft University of Technology, Delft, The Netherlands ABSTRACT: In the design of steel plate girders a high degree
ANALYSIS OF A LAP JOINT FRICTION CONNECTION USING HIGH STRENGTH BOLTS
 Nordic Steel Construction Conference 212 Hotel Bristol, Oslo, Norway 5-7 September 212 ANALYSIS OF A LAP JOINT FRICTION CONNECTION USING HIGH STRENGTH BOLTS Marouene Limam a, Christine Heistermann a and
Finite Elements for 2 D Problems
 Finite Elements for 2 D Problems General Formula for the Stiffness Matrix Displacements (u, v) in a plane element are interpolated from nodal displacements (ui, vi) using shape functions Ni as follows,
Buckling of Spherical Shells
 31 Buckling of Spherical Shells 31.1 INTRODUCTION By spherical shell, we mean complete spherical configurations, hemispherical heads (such as pressure vessel heads), and shallow spherical caps. In analyses,
CRASH ANALYSIS OF AN IMPACT ATTENUATOR FOR RACING CAR IN SANDWICH MATERIAL
 F2008-SC-016 CRASH ANALYSIS OF AN IMPACT ATTENUATOR FOR RACING CAR IN SANDWICH MATERIAL Boria, Simonetta *, Forasassi, Giuseppe Department of Mechanical, Nuclear and Production Engineering, University
CHAPTER 4 4 NUMERICAL ANALYSIS
 41 CHAPTER 4 4 NUMERICAL ANALYSIS Simulation is a powerful tool that engineers use to predict the result of a phenomenon or to simulate the working situation in which a part or machine will perform in
III. Compression Members. Design of Steel Structures. Introduction. Compression Members (cont.)
") ENCE 455 Design of Steel Structures III. Compression Members C. C. Fu, Ph.D., P.E. Civil and Environmental Engineering Department University it of Maryland Compression Members Following subjects are covered:
ENCE 455 Design of Steel Structures III. Compression Members C. C. Fu, Ph.D., P.E. Civil and Environmental Engineering Department University it of Maryland Compression Members Following subjects are covered:
Solid Mechanics. Stress. What you ll learn: Motivation
 Solid Mechanics Stress What you ll learn: What is stress? Why stress is important? What are normal and shear stresses? What is strain? Hooke s law (relationship between stress and strain) Stress strain
Tensile fracture analysis of blunt notched PMMA specimens by means of the Strain Energy Density
 Engineering Solid Mechanics 3 (2015) 35-42 Contents lists available at GrowingScience Engineering Solid Mechanics homepage: www.growingscience.com/esm Tensile fracture analysis of blunt notched PMMA specimens
Shell Elements in ABAQUS/Explicit
 ABAQUS/Explicit: Advanced Topics Appendix 2 Shell Elements in ABAQUS/Explicit ABAQUS/Explicit: Advanced Topics A2.2 Overview ABAQUS/Explicit: Advanced Topics ABAQUS/Explicit: Advanced Topics A2.4 Triangular
FATIGUE ANALYSIS OF A PRESSURE VESSEL WELDED JOINT USING THE STRESS INTEGRATION METHOD OUTLINED IN THE ASME BOILER & PRESSURE VESSEL CODE VIII
 FATIGUE ANALYSIS OF A PRESSURE VESSEL WELDED JOINT USING THE STRESS INTEGRATION METHOD OUTLINED IN THE ASME BOILER & PRESSURE VESSEL CODE VIII A. Halfpenny 1, R. Plaskitt 2, J. Mentley 3, N.Mann 4 A design
A Strategy for Teaching Finite Element Analysis to Undergraduate Students
 A Strategy for Teaching Finite Element Analysis to Undergraduate Students Gordon Smyrell, School of Computing and Mathematics, University of Teesside The analytical power and design flexibility offered
EXPERIMENTAL AND NUMERICAL ANALYSIS OF THE COLLAR PRODUCTION ON THE PIERCED FLAT SHEET METAL USING LASER FORMING PROCESS
 JOURNAL OF CURRENT RESEARCH IN SCIENCE (ISSN 2322-5009) CODEN (USA): JCRSDJ 2014, Vol. 2, No. 2, pp:277-284 Available at www.jcrs010.com ORIGINAL ARTICLE EXPERIMENTAL AND NUMERICAL ANALYSIS OF THE COLLAR
FOOTING DESIGN EXAMPLE
 County: Any Design: BRG Date: 10/007 Hwy: Any Ck Dsn: BRG Date: 10/007 FOOTING DESIGN EXAMPLE Design: Based on AASHTO LRFD 007 Specifications, TxDOT LRFD Bridge Design Manual, and TxDOT Project 0-4371
Technical Report Example (1) Chartered (CEng) Membership
 Chartered (CEng) Membership") Technical Report Example (1) Chartered (CEng) Membership A TECHNICAL REPORT IN SUPPORT OF APPLICATION FOR CHARTERED MEMBERSHIP OF IGEM DESIGN OF 600 (103 BAR) 820MM SELF SEALING REPAIR CLAMP AND VERIFICATION
Technical Report Example (1) Chartered (CEng) Membership A TECHNICAL REPORT IN SUPPORT OF APPLICATION FOR CHARTERED MEMBERSHIP OF IGEM DESIGN OF 600 (103 BAR) 820MM SELF SEALING REPAIR CLAMP AND VERIFICATION
Introduction to Mechanical Behavior of Biological Materials
 Introduction to Mechanical Behavior of Biological Materials Ozkaya and Nordin Chapter 7, pages 127-151 Chapter 8, pages 173-194 Outline Modes of loading Internal forces and moments Stiffness of a structure
B.TECH. (AEROSPACE ENGINEERING) PROGRAMME (BTAE) Term-End Examination December, 2011 BAS-010 : MACHINE DESIGN
 PROGRAMME (BTAE) Term-End Examination December, 2011 BAS-010 : MACHINE DESIGN") No. of Printed Pages : 7 BAS-01.0 B.TECH. (AEROSPACE ENGINEERING) PROGRAMME (BTAE) CV CA CV C:) O Term-End Examination December, 2011 BAS-010 : MACHINE DESIGN Time : 3 hours Maximum Marks : 70 Note : (1)
No. of Printed Pages : 7 BAS-01.0 B.TECH. (AEROSPACE ENGINEERING) PROGRAMME (BTAE) CV CA CV C:) O Term-End Examination December, 2011 BAS-010 : MACHINE DESIGN Time : 3 hours Maximum Marks : 70 Note : (1)
MODEL-SIZED AND FULL-SCALE DYNAMIC PENETRATION TESTS ON DAMPING CONCRETE
 MODEL-SIZED AND FULL-SCALE DYNAMIC PENETRATION TESTS ON DAMPING CONCRETE Robert Scheidemann, Eva-Maria Kasparek, Karsten Müller, Bernhard Droste, Holger Völzke BAM Federal Institute for Materials Research
ANALYSIS OF GASKETED FLANGES WITH ORDINARY ELEMENTS USING APDL CONTROL
 ANALYSIS OF GASKETED FLANGES WITH ORDINARY ELEMENTS USING AP... Page 1 of 19 ANALYSIS OF GASKETED FLANGES WITH ORDINARY ELEMENTS USING APDL CONTROL Yasumasa Shoji, Satoshi Nagata, Toyo Engineering Corporation,
CHARACTERISATION OF A RESONANT BENDING FATIGUE TEST SETUP FOR PIPES
 CHARACTERISATION OF A RESONANT BENDING FATIGUE TEST SETUP FOR PIPES J. Claeys 1, J. Van Wittenberghe 2, P. De Baets 2 and W. De Waele 2 2 1 Ghent University, Belgium Ghent University, laboratory Soete,
In-situ Load Testing to Evaluate New Repair Techniques
 In-situ Load Testing to Evaluate New Repair Techniques W.J. Gold 1 and A. Nanni 2 1 Assistant Research Engineer, Univ. of Missouri Rolla, Dept. of Civil Engineering 2 V&M Jones Professor, Univ. of Missouri
7.3 Fit selection. Inner ring: Rotating. Outer ring: Stationary. Inner ring: Stationary. Outer ring: Rotating. Inner ring: Stationary
 7. Bearing Fits 7. Fitting For rolling s, inner and outer rings are fixed on the or in the housing so that relative movement does not occur between fitting surfaces during operation or under. This relative
INTRODUCTION TO BEAMS
 CHAPTER Structural Steel Design LRFD Method INTRODUCTION TO BEAMS Third Edition A. J. Clark School of Engineering Department of Civil and Environmental Engineering Part II Structural Steel Design and Analysis
CLASSIFICATION BOUNDARIES FOR STIFFNESS OF BEAM-TO- COLUMN JOINTS AND COLUMN BASES
 Nordic Steel Construction Conference 2012 Hotel Bristol, Oslo, Norway 5-7 September 2012 CLASSIFICATION BOUNDARIES FOR STIFFNESS OF BEAM-TO- COLUMN JOINTS AND COLUMN BASES Ina Birkeland a,*, Arne Aalberg
EFFECTS ON NUMBER OF CABLES FOR MODAL ANALYSIS OF CABLE-STAYED BRIDGES
 EFFECTS ON NUMBER OF CABLES FOR MODAL ANALYSIS OF CABLE-STAYED BRIDGES Yang-Cheng Wang Associate Professor & Chairman Department of Civil Engineering Chinese Military Academy Feng-Shan 83000,Taiwan Republic
Geometry and dimensional tolerances of engine bearings
 Geometry and dimensional tolerances of engine bearings Dr. Dmitri Kopeliovich (Research & Development Manager.) 1. Hydrodynamic lubrication Engine bearings operate mostly in the hydrodynamic regime of
New approaches in Eurocode 3 efficient global structural design
 New approaches in Eurocode 3 efficient global structural design Part 1: 3D model based analysis using general beam-column FEM Ferenc Papp* and József Szalai ** * Associate Professor, Department of Structural
Use of Strain Gauge Rosette to Investigate Stress concentration in Isotropic and Orthotropic Plate with Circular Hole
 Use of Strain Gauge Rosette to Investigate Stress concentration in Isotropic and Orthotropic Plate with Circular Hole Mr.V.G.Aradhye 1, Prof.S.S.Kulkarni 2 1 PG Scholar, Mechanical department, SKN Sinhgad
Ultrasonic Technique and Device for Residual Stress Measurement
 Ultrasonic Technique and Device for Residual Stress Measurement Y. Kudryavtsev, J. Kleiman Integrity Testing Laboratory Inc. 80 Esna Park Drive, Units 7-9, Markham, Ontario, L3R 2R7 Canada ykudryavtsev@itlinc.com
Section. Tolerances. Aluminum Extrusion Manual. 4th Edition
 Section 8 Tolerances Aluminum Extrusion Manual 4th Edition Section 8 How straight is straight enough? How flat is flat enough? How uniform must a wall thickness be in order to be acceptable? These are
ANNEX 2: Assessment of the 7 points agreed by WATCH as meriting attention (cover paper, paragraph 9, bullet points) by Andy Darnton, HSE
 by Andy Darnton, HSE") ANNEX 2: Assessment of the 7 points agreed by WATCH as meriting attention (cover paper, paragraph 9, bullet points) by Andy Darnton, HSE The 7 issues to be addressed outlined in paragraph 9 of the cover
ANNEX 2: Assessment of the 7 points agreed by WATCH as meriting attention (cover paper, paragraph 9, bullet points) by Andy Darnton, HSE The 7 issues to be addressed outlined in paragraph 9 of the cover
Using LS-OPT for Parameter Identification and MAT_FABRIC with FORM=-14
 Using LS-OPT for Parameter Identification and MAT_FABRIC with FORM=-14 David Dubois, Ph. D Autoliv Avenue de l Europe 76220 Gournay en Bray France Jimmy Forsberg, Ph. D DYNAmore Nordic AB Brigadgatan 14
Strip Flatness Prediction in a 4 High Tandem Mill Using a Dynamic Model.
 Strip Flatness Prediction in a 4 High Tandem Mill Using a Dynamic Model. M. A. Bello-Gomez 1, M. P. Guerrero-Mata 1, L. A. Leduc Lezama 1, T. P. Berber- Solano 1, L. Nieves 2, F. Gonzalez 2, H. R. Siller
Current Standard: Mathematical Concepts and Applications Shape, Space, and Measurement- Primary
 Shape, Space, and Measurement- Primary A student shall apply concepts of shape, space, and measurement to solve problems involving two- and three-dimensional shapes by demonstrating an understanding of:
The Suitability of CRA Lined Pipes for Flowlines Susceptible to Lateral Buckling SUT Global Pipeline Buckling Symposium, 23 24 February 2011
 The Suitability of CRA Lined Pipes for Flowlines Susceptible to Lateral Buckling SUT Global Pipeline Buckling Symposium, 23 24 February 2011 Duncan Wilmot, Technical Manager, Cladtek International, Australia
Screw Thread Design. Rev. 3-4-09
 Screw Thread Design Screw Thread Fundamentals A screw thread is defined as a ridge of uniform section in the form of a helix on either the external or internal surface of a cylinder. Internal threads refer
Specification for Rotary Drill Stem Elements
 Addendum 1 March 2007 Effective Date: September 1, 2007 Specification for Rotary Drill Stem Elements ANSI/API SPECIFICATION 7-1 FIRST EDITION, MARCH 2006 EFFECTIVE DATE: SEPTEMBER 2006 ISO 10424-1:2004
Weld Cracking. An Excerpt from The Fabricators' and Erectors' Guide to Welded Steel Construction. The James F. Lincoln Arc Welding Foundation
 Weld Cracking An Excerpt from The Fabricators' and Erectors' Guide to Welded Steel Construction The James F. Lincoln Arc Welding Foundation Weld Cracking Several types of discontinuities may occur in welds
MODULE VII LARGE BODY WAVE DIFFRACTION
 MODULE VII LARGE BODY WAVE DIFFRACTION 1.0 INTRODUCTION In the wave-structure interaction problems, it is classical to divide into two major classification: slender body interaction and large body interaction.
Plates and Shells: Theory and Computation - 4D9 - Dr Fehmi Cirak (fc286@) Office: Inglis building mezzanine level (INO 31)
 Office: Inglis building mezzanine level (INO 31)") Plates and Shells: Theory and Computation - 4D9 - Dr Fehmi Cirak (fc286@) Office: Inglis building mezzanine level (INO 31) Outline -1-! This part of the module consists of seven lectures and will focus
Plates and Shells: Theory and Computation - 4D9 - Dr Fehmi Cirak (fc286@) Office: Inglis building mezzanine level (INO 31) Outline -1-! This part of the module consists of seven lectures and will focus
Geometric Optics Converging Lenses and Mirrors Physics Lab IV
 Objective Geometric Optics Converging Lenses and Mirrors Physics Lab IV In this set of lab exercises, the basic properties geometric optics concerning converging lenses and mirrors will be explored. The
9. TIME DEPENDENT BEHAVIOUR: CYCLIC FATIGUE
 9. TIME DEPENDENT BEHAVIOUR: CYCLIC FATIGUE A machine part or structure will, if improperly designed and subjected to a repeated reversal or removal of an applied load, fail at a stress much lower than
RP-C203: Fatigue design of offshore steel structures
 RECOMMENDED PRCTICE DNVGL-RP-0005:04-06 RP-C03: Fatigue design of offshore steel structures The electronic pdf version of this document found through http://www.dnvgl.com is the officially binding version.
THE DEVELOPMENT OF DESIGN METHODS FOR REINFORCED AND UNREINFORCED MASONRY BASEMENT WALLS J.J. ROBERTS
 THE DEVELOPMENT OF DESIGN METHODS FOR REINFORCED AND UNREINFORCED MASONRY BASEMENT WALLS J.J. ROBERTS Technical Innovation Consultancy Emeritus Professor of Civil Engineering Kingston University, London.
DRAFTING MANUAL. Gears (Bevel and Hypoid) Drafting Practice
 Drafting Practice") Page 1 1.0 General This section provides the basis for uniformity in engineering gears drawings and their technical data for gears with intersecting axes (bevel gears), and nonparallel, nonintersecting
Page 1 1.0 General This section provides the basis for uniformity in engineering gears drawings and their technical data for gears with intersecting axes (bevel gears), and nonparallel, nonintersecting
ETABS. Integrated Building Design Software. Concrete Shear Wall Design Manual. Computers and Structures, Inc. Berkeley, California, USA
 ETABS Integrated Building Design Software Concrete Shear Wall Design Manual Computers and Structures, Inc. Berkeley, California, USA Version 8 January 2002 Copyright The computer program ETABS and all
4 SENSORS. Example. A force of 1 N is exerted on a PZT5A disc of diameter 10 mm and thickness 1 mm. The resulting mechanical stress is:
 4 SENSORS The modern technical world demands the availability of sensors to measure and convert a variety of physical quantities into electrical signals. These signals can then be fed into data processing
Loads Tools Checks Reports
 Loads Tools Checks Reports SDC Verifier or the Structural Design Code Verifier is a powerful postprocessor program with an advanced calculation core which works seamlessly with Siemens multi-solver, FEA
The Effects of Start Prices on the Performance of the Certainty Equivalent Pricing Policy
 BMI Paper The Effects of Start Prices on the Performance of the Certainty Equivalent Pricing Policy Faculty of Sciences VU University Amsterdam De Boelelaan 1081 1081 HV Amsterdam Netherlands Author: R.D.R.
SLAB DESIGN. Introduction ACI318 Code provides two design procedures for slab systems:
 Reading Assignment SLAB DESIGN Chapter 9 of Text and, Chapter 13 of ACI318-02 Introduction ACI318 Code provides two design procedures for slab systems: 13.6.1 Direct Design Method (DDM) For slab systems
Customer Training Material. Lecture 4. Meshing in Mechanical. Mechanical. ANSYS, Inc. Proprietary 2010 ANSYS, Inc. All rights reserved.
 Lecture 4 Meshing in Mechanical Introduction to ANSYS Mechanical L4-1 Chapter Overview In this chapter controlling meshing operations is described. Topics: A. Global Meshing Controls B. Local Meshing Controls
Validation of Cable Bolt Support Design in Weak Rock Using SMART Instruments and Phase 2
 Validation of Cable Bolt Support Design in Weak Rock Using SMART Instruments and Phase 2 W.F. Bawden, Chair Lassonde Mineral Engineering Program, U. of Toronto, Canada J.D. Tod, Senior Engineer, Mine Design
Support Vector Machines Explained
 March 1, 2009 Support Vector Machines Explained Tristan Fletcher www.cs.ucl.ac.uk/staff/t.fletcher/ Introduction This document has been written in an attempt to make the Support Vector Machines (SVM),
GUIDELINE FOR HAND HELD SHEAR VANE TEST
 GUIDELINE FOR HAND HELD SHEAR VANE TEST NZ GEOTECHNICAL SOCIETY INC August 2001 CONTENTS Page 1.0 Introduction 2 2.0 Background 2 3.0 Recommended Practice 3 4.0 Undrained Shear Strength 3 5.0 Particular
CE591 Fall 2013 Lecture 26: Moment Connections
 CE591 Fall 2013 Lecture 26: Moment Connections Explain basic design procedure for moment (FR) connections Explain considerations for connections in momentresisting frames for seismic demands Describe problems
Cylinder Head Gasket Contact Pressure Simulation for a Hermetic Compressor
 Purdue University Purdue e-pubs International Compressor Engineering Conference School of Mechanical Engineering 2006 Cylinder Head Gasket Contact Pressure Simulation for a Hermetic Compressor Pavan P.
EDEXCEL NATIONAL CERTIFICATE/DIPLOMA MECHANICAL PRINCIPLES AND APPLICATIONS NQF LEVEL 3 OUTCOME 1 - LOADING SYSTEMS TUTORIAL 3 LOADED COMPONENTS
 EDEXCEL NATIONAL CERTIICATE/DIPLOMA MECHANICAL PRINCIPLES AND APPLICATIONS NQ LEVEL 3 OUTCOME 1 - LOADING SYSTEMS TUTORIAL 3 LOADED COMPONENTS 1. Be able to determine the effects of loading in static engineering
Exergy Analysis of a Water Heat Storage Tank
 Exergy Analysis of a Water Heat Storage Tank F. Dammel *1, J. Winterling 1, K.-J. Langeheinecke 3, and P. Stephan 1,2 1 Institute of Technical Thermodynamics, Technische Universität Darmstadt, 2 Center
Tower Cross Arm Numerical Analysis
 Chapter 7 Tower Cross Arm Numerical Analysis In this section the structural analysis of the test tower cross arm is done in Prokon and compared to a full finite element analysis using Ansys. This is done
Camber, The unkind Curve
 Camber, The unkind Curve Understand how Camber can be handled in a typical Tube Mill: By W.B. Bud Graham, Contributing Writer Ok, were going to talk about curves. Not the one seen in a ball game but the