Out of School & Off Track: The Overuse of Suspensions in American Middle and High Schools
|
|
|
- Baldric Hoover
- 7 years ago
- Views:
Transcription
1 Getting Back On Track Syracuse Report on Student Discipline Practices Out of School & Off Track: The Overuse of Suspensions in American Middle and High Schools By Daniel J. Losen, Independent Consultant By Daniel J. Losen & Tia Elena Martinez June 06, 2014 A P R I L 8, T H E C E N T E R FOR CIVIL RIGHTS REMEDIES 1

2 Introduction: Why Syracuse? Why Discipline? In April, 2013 the Center for Civil Rights Remedies released a report on middle school suspension rates, including data on many districts suspension use that the public found shocking. Many of these districts superintendents and school boards acknowledged that their suspension rates were unacceptably high. Superintendent Contreras was among them. That same April, the Superintendent inquired about possible assistance in addressing the issue. The evidence suggests that suspension levels have been extraordinarily high in Syracuse for many years, at least since 2000 and may have contributed to a legacy of poor educational outcomes in the past. 1 This report is focused on the most recent data, and is a more detailed follow-up to the independent work and presentation provided to Syracuse City School District on September 30, 2013 to the district s School Board and greater school community. 1 It is important to put the new efforts in Syracuse in the national context. Concerned with new research findings by the Council of State Governments Justice Center in 2011, the Obama administration launched a national initiative called the Supportive School Discipline Initiative. As part of the SSDI, the U.S. Departments of Justice and Education put together guidance for schools about the civil rights implications of school discipline disparities, which they released on January 8, In this joint DOJ/OCR guidance they outline how school districts are obligated to review their school discipline policies and practices for unnecessary reliance on school exclusion and the possibility that their disciplinary policies and practices could have an unlawful disparate impact by race, gender, disability status or English learner status. The official legal guidance was issued in the form of a Dear Colleague letter, and was accompanied by a wealth of resources including a set of guiding principles for schools and districts contemplating reforms and a set of resources to draw from. This report builds on data analysis completed in September, and is intended to provide a deeper description of the use of suspensions in Syracuse. The empirical analysis in this report and recommendations that follow are presented with the new OCR/DOJ guidance, principles, federal recommendations and resources for school districts in mind. Further, the analysis of the districts discipline data is presented in the context of what the latest research says about the frequent use of out-of-school suspensions. (Skiba, 2014). It 1 For the years 2000 and 2006 there are Syracuse data disaggregated for K-12 by race/ethnicity on the U.S. Department of Education s website here: ms%26tbsearchschool%3dsyracuse%26tbsearchcity%3dsyracuse%26ddlsearchs tate%3dny%26btnsearchparams%3dsearch%26cblyears_0%3d1%26cblyears_1 %3D1%26cblYears_2%3D1. These data show that in 2000 Syracuse suspended percent of all Black students enrolled and 8.8% of all White students enrolled. These older numbers did not include the short-term suspensions of students with disabilities which are usually much higher than students without disabilities and therefore the high rates and large disparities described using more recent data are similar to the observed rates and disparities as far back as

3 should be noted that the research cited in this report reflects the findings and recent publications of the Disparities in Discipline Research Collaborative. I am a member of this national collaborative and one of the lead authors of the brief regarding discipline policy. 3 Further, although this report was prepared independently from my work as Director of the Center for Civil Rights Remedies at UCLA s Civil Rights Project, the analysis and findings draws repeatedly on the empirical and legal research I have conducted as CCRR s Director. Context of change in Syracuse: In the time between this final report and my presentation of the data last September, the Superintendent of Schools, Sharon L. Contreras has taken several important steps to address the frequency and disparity with which the district suspends students out of school including, but not limited to: setting forth the review and revision of the district s code of conduct; retaining professional student advocates for students who are involved in the superintendent hearing process; implementing a central student registration process that manages the process for student entry and withdrawal such that there are no student transfers allowed for student behavior that are inconsistent with N.Y. Education Law 3214; providing administrators with training opportunities with district legal counsel on N.Y. Education Law 3214, Title VI of the Civil Rights Act of 1964, and the Individuals with Disabilities Education Act (IDEA); providing wrap-around services to students In addition to these steps, the District has committed to the implementation of the recommendations of this report with regard to additional changes to policies and practices and use of resources to address the issue. Moreover, the ongoing cooperation with investigation of the State Attorney General s office with regard to the need to address discipline disparities is also an important activity toward improvements. Therefore, the purpose of this report is to further assist the process of change that is already underway and to help the members of the school community to improve the conditions of learning in the Syracuse Public Schools such that achievement, attendance, and graduation rate improvements coincide with the reductions in exclusionary discipline. Ultimately, that goal will entail administrators, teachers, parents and students all working together to agree upon new methods to achieving these goals. As a background matter, it is important to recognize that academically, the Syracuse Public Schools, according to the New York State report cards, are performing below the state average. 4 Syracuse Public Schools are currently struggling to turn around low achievement, low attendance, and low graduation rates. What many do not realize is that Syracuse is also among the nation s districts that suspend far more students out of school than most others. In fact, the suspension rate for all students in elementary school, at nearly one in 8 students each year, (12.6%) places Syracuse Schools as among the top 100 school districts in the nation out of nearly 5,800 school districts analyzed. 5 This means that while the district is looking for ways to boost achievement, Syracuse students are losing 3

4 valuable instructional time for poor behavior. At the same time, it should be noted that as the district suspends misbehaving students with a high frequency, and has done so for many years, school environments appear no less disruptive in response. Consistent with well-established research findings, the frequent use of suspension in Syracuse appears to not to have the desired impact of improving learning conditions and reducing inappropriate behavior. It is essential to keep in mind that the challenges with regard to school discipline are rooted in concern about the academic and life outcomes shared by all members of the school community. Some members feel that the schools are too tolerant of student misbehavior, and blame the poor learning environment and low academic performance on lax discipline and the failure to utilize suspension and expulsion more often. This observation is based on documentation through news reports and corresponding comments expressed on-line. Some of these comments were expressed by union leadership. Further, it has been brought to my attention that since my report to the community in September of 2013, that one or more groups have formed within the Syracuse Community to advocate against reductions in the use of exclusionary disciplinary practices. Some hold fast to a belief that far more students should be excluded from the mainstream on disciplinary grounds even though the national data finds the Syracuse City School District on the extreme high end of the spectrum when it comes to disciplinary exclusion. Based on research that demonstrates that a highly punitive approach is counterproductive, it is far more likely that the current harsh disciplinary methods and practices are undermining rather than helping to achieve the shared behavioral and academic goals. With the intent of helping the Syracuse City School District get back on track toward meeting the important outcomes that all stakeholders value, this report presents data and research pertaining to school discipline in 3 parts. Part I sets the national context, both the growing research-based consensus and the empirical trends. As mentioned suspension rates in Syracuse are far higher than the national averages, but these national averages are regarded as highly problematic in and of themselves. Part I briefly reviews the current use of suspension and references the growing concerns among educators that nationally, we need to resort back to a more common sense and conservative approach to the use of suspensions. Part II is primarily descriptive and digs deep into the data from Syracuse Public Schools that were presented in September. School level data are presented to illustrate how the broad district disparities appear at the school level. Part II also suggests some possible contributing factors based on research. Part III sets forth research-based policy recommendations for the district moving forward. Some of the recommendations reflect some of the data patterns found in Syracuse. Others reflect the latest research on what works. The recommendations in this report are entirely consistent with the set of principles for policymakers, district officials, school leaders and stakeholders that the U.S. Department of Education has set forth which as follows: 4

5 (1) Create positive climates and focus on prevention (2) Develop clear, appropriate and consistent expectations and consequences to address disruptive student behaviors; and (3) Ensure fairness, equity and continuous improvement. 6 Part I: The National Context: There is a consensus among educators, researchers, policymakers and child advocates that all schools must be safe places for all members of the learning community. Schools have the right and the responsibility to develop safe school climates. Yet the national data indicate that it is relatively rare for students to pose a serious danger to themselves or others. In states like Texas, serious safety concerns trigger a non-discretionary mandatory removal, but these represent less than 5% of all disciplinary removals from school. 7 While exclusion on safety grounds is infrequent, students are routinely removed from school for minor offenses like tardiness, truancy, using foul language, disruption, and violation of the dress code. As this report will show, Syracuse data are consistent with these national findings. Of course public school educators are also responsible for ensuring the integrity of the learning environment and must respond to a wide range of misbehavior that does not raise safety concerns. There is no question that there are circumstances where removing a student from a classroom is helpful to de-escalate a conflict, or to pursue an intervention outside the classroom with the support of an administrator, a counselor, parent(s) or community members. However, like the national data, the use of suspensions in Syracuse indicates that the district has moved away from reserving school exclusion for only the most serious offenses, and as a measure of last resort. Researchers find that schools that reduce their suspension rates can simultaneously improve academic outcomes: One oft-repeated justification for frequent suspensions is that schools must be able to remove the bad students so that good students can learn. The comments to articles about suspensions in Syracuse suggest that this sentiment is shared by at least some members of the larger school community. 8 There are obvious immediate benefits to minimizing disruption by keeping out persistently disruptive youth. However there is a substantial difference between removing a disruptive student from class, as an immediate response, and suspending a student out of school for several days. While there are certainly ways to minimize the likelihood that students will disrupt a class, short-term temporary removals are not the same as removing students from school altogether. There is no research to support the popular theory when it is taken to mean exclusion from school. One problem with this theory about needing to remove the bad kids is that it implies that public schools can pick and choose who may attend. Further, the theory fails to acknowledge that the ways schools are run affects the degree to which students misbehave. Often, student misbehavior is attributed exclusively to students themselves, but researchers know the same student can behave very differently in different classrooms. Disruptions tend to increase or decrease with the skill of the teacher in 5

6 providing engaging instruction and in managing the classroom areas many teachers say they would like help improving. For example, in a national survey of pre-k through 12 th grade teachers, respondents identified their greatest needs as help with classroom management and instructional skills. 9 Researchers also find a strong connection between effective classroom management and improved educational outcomes. And these skills can be learned and developed. 10 According to the American Psychological Association: When applied correctly, effective classroom management principles can work across all subject areas and all developmental levels. They can be expected to promote students self-regulation, reduce the incidence of misbehavior, and increase student productivity. 11 The Academy of American Pediatrics (2013) recent statement put it bluntly when they concluded, out-ofschool suspension and expulsion are counterproductive to the intended goals, rarely if ever are necessary, and should not be considered as appropriate discipline in any but the most extreme and dangerous circumstances, as determined on an individual basis rather than as a blanket policy. 12 Research also suggests an inverse relationship between student misbehavior and a teacher s ability to engage students. 13 As engagement goes up, misbehavior and suspensions tend to go down. Equally important is that the theory behind removing the bad apples to safeguard the learning environment has no support in research on public schools. When public schools serving similar populations were compared across the state of Indiana, and poverty was controlled for, those schools with relatively low suspension rates had higher, not lower test scores (Skiba, 2006). This Indiana study found that the approach and the attitude of the principal mattered more than demographics for predicting suspension rates as well as racial disproportionality in the use of suspension (Skiba, 2013). 14 Similarly, a larger study, called Breaking Schools Rules (Fabelo, 2011) tracked every middle school student in Texas and controlled for over 80 variables, including student misbehavior, and found that the higher-suspending schools tended to have higher grade retention and lower graduation rates, while producing no benefits in terms of test scores. Moreover, several large school districts that have lowered suspension rates recently have made academic gains. Two recent examples are Baltimore City, where decreases in suspensions preceded improvements in graduation rates in subsequent years, 15 and in Denver, Colorado, where steady and consistent achievement gains coincided with large reductions in suspensions attributed to restorative practices. 16 Although it is understandable why frustrated members of the school community might embrace school exclusion, the most obvious flaw is that this approach fails to recognize the combined detrimental effect of missing valuable instructional time while gaining no guarantee that the behavioral issues will be addressed. Researchers have suggested that out-of-school suspensions likely reinforce the very behavior they are meant to eliminate (Tobin, Sugai & Colvin, 1996). Frequent use of suspensions can damage school climate and the conditions for learning: In addition to preserving instructional time, low-suspending schools tend to have better academic performance by establishing positive school climates and cultures that increase student productivity. Schools with high suspension rates have lower levels of student engagement and trust. 17 Strong teacher-student and teacher-parent relationships are important to academic achievement as well as safety. 18 It is critically important, 6

7 therefore, that policymakers understand the negative social and academic implications of relying on suspensions to manage behavior. Frequent suspensions increase dropout risks and juvenile justice involvement, and severely impair our economy: The potential impact from being suspended, even once, can be devastating. For example, a Johns Hopkins study tracking all ninth graders throughout high school and post-graduation in Florida found that being suspended just one time in grade 9 was associated with an increased risk for dropping out from 16% to 32% (Balfanz, 2013). In Texas, the aforementioned study that tracked middle school students for six years found that being removed on disciplinary grounds for a discretionary violation increased by nearly three times the likelihood of being in contact with the juvenile justice system the following year (Fabelo, 2011). Excessive discipline is also associated with higher economic costs to the schools and communities in the short- and long-term. For example research has found suspension to be associated with increased risk for grade retention, which literally means that taxpayers must pay for an additional year of schooling. The juvenile justice system costs escalate with its use, and taxpayers foot the bill for the costs associated with increases in crime and welfare costs associated with school dropout. 19 Although this report did not include a comprehensive review of juvenile delinquency, or associated costs specific to Syracuse, there is no question that suspension rates are high in Syracuse, which means that the associated costs are likely higher here than they need to be. It is worth mentioning that one national longitudinal study (Shollenberger, 2013) suggests that for most delinquent youth, and especially Black and Latino boys, suspensions usually preceded indicators of serious delinquent behavior. Simply put, schools that frequently resort to suspension and expulsion of youth may inadvertently be increasing crime in the community. In fact, this is one reason that the national crime prevention group, Fight Crime: Invest in Kids, representing over 5,000 law enforcement agents from across the nation has consistently sought to reduce the reliance on exclusion from school, especially for minor offenses For these and related reasons, the national teachers unions, the NEA and the AFT have supported a reduction in the use of out-of-school suspensions and expulsions in favor of alternatives such as restorative practices and social emotional learning. 22 Nationally, divergent stakeholders, including law enforcement, school administrators, researchers and civil rights advocates are embracing the call to reduce suspensions and to replace them with a wide range of more effective approaches. Ideally, stakeholder consensus can be built in Syracuse as well. Methods: This report uses the same basic risk calculation for most of the analysis presented. The risk analysis is a straightforward calculation that tells you what percentage of the enrollment of a racial group was found in a certain category. For example, if 10 Black students were suspended out of school at least once in a given year and the school enrolled 100 Black students in all, the risk for a Black student being suspended would be 10 percent of their enrollment. In several places the risks of suspension or rate of student suspension for one group are compared to others in terms of 7
.")
8 the risk difference or gap. That is based on simple subtraction. If the risk for Blacks was 10% and for Whites it was 5% then the risk gap or difference would be 5 percentage points. These simple calculations are not only informative, but anyone can do the calculations if they have the relevant enrollment data and the numbers of students in the given category. These calculations can be based on the enrollment at the level of the district, individual school or grade, or by type of school across the district. Later in the report the number of suspensions per 100 students is also presented. The key difference is that the risk for suspension is based on counts of students who were suspended at least once. For this reason the phrase student suspension rate is also used. Conversely, suspensions per 100 students enrolled, sometimes called the rate of suspensions, counts the actual suspensions meted out, not the unduplicated number of students. Another way to keep the two measures clear is that he risk for suspension emphasizes how many students were punished. The rate of suspensions per 100 tells us how often suspensions are used. Additional metrics besides these two are used, but will be explained in the context of the analysis. The following empirical analysis begins with the most straightforward data review of the national discipline data and the risk for suspension. Disparities have widened dramatically: Across the nation, in just one year nearly one out of every four Black students in middle and high school was suspended at least one time. Current rates reflect a steady rise since the early 1970s when the number of students suspended was about half of what it is today. 19 The percentage of students who received at least one suspension (also called the risk for suspension) has increased most dramatically for historically disadvantaged subgroups, resulting in a widening of the discipline gap. 20 The figure below, based on data collected by the U.S. Department of Education, provides the historical perspective at the level of secondary schools (middle and high schools) where the rise in the use of suspensions has been most pronounced. (Losen & Martinez, 2013). 8


9 National Elementary and Secondary Rates Many communities don't know just how often students are removed from school: Most parents, school board members, and policymakers do not realize just how often our public schools suspend students, because most states do not publish this information on an annual basis as they do test scores and graduation rates. 14 While approximately 5% of students are suspended during a given year, longitudinal research indicates that between one-third and one-half of students experience at least one suspension at some point between kindergarten and twelfth grade, with the aforementioned study of Texas students reporting 60% removal rates during middle and high school. 15 The risk for suspension is usually much larger during the secondary school years (middle and high school). The graph that follows shows the breakdown by race at the elementary versus the secondary levels. Keep in mind that this is just snapshot from one year ( ) and doesn t capture the cumulative risk for being suspended. 9

.")
10 Nationally, students with disabilities are supposed to receive special education, which includes individualized supports and services, including behavioral supports if needed, to help them succeed in school. Yet, nationally their out-of-school suspension rates for grades K-12 are at least twice as high as their nondisabled peers. (Losen & Gillespie, 2012). Across this grade span in the rates are much higher for students with disabilities who are Black and male, with one out of every five having been suspended at least once. Table 1: National (K-12) suspension risk by race, disability and gender U.S. American Asian Native Black/ Latino White Indian/ Alaskan Native Hawaiian/ Other Pacific Islander African American Male 13% 3% 7% 20% 9% 6% Female 7% 1% 3% 12% 4% 2% (Source: Tables 1-A. and 1-B. U.S. Department of Education Office for Civil Rights Data Collection: Data Snapshot (School Discipline) March 2014). When we look at the intersection of race, disability, and the gender at the secondary level, we find that 24% of Black secondary students, 31% of Black secondary school students with disabilities, and 36% of Black secondary school males with disabilities were suspended from school in (Losen & Martinez, 2013). 10
 suspension risk by race, disability and gender 2011-12. U.S.")

11 11


12 Part II: The Use of Suspensions in Syracuse The profile of Syracuse City Schools was originally published in the report, Out of School and Off Track. The Syracuse profile was not featured in the report itself but was one of twenty profiled districts included in the appendix of the report. Although it is clear that these rates are higher than the national average, the report did not provide a detailed comparison. In fact, the suspension rates depicted in the table below shows that Syracuse is well above the national averages for every subgroup. 12

13 As mentioned in the introduction, Syracuse City was among the highest suspending districts in the nation. One may regard these rates as extraordinarily high because out of 5,675 school districts that had elementary schools, the overall suspension rates in Syracuse places the district among the top 100. Rankings are purely relative and are presented in this report to put the Syracuse numbers in perspective and to raise doubts in the minds of those who think that any reduction will make Syracuse schools far too lenient. To make the comparison of Syracuse more meaningful, data for nearly 7,000 school districts from the school year were digested to select 32 districts with similar numbers of Black students and where Black students made up a similar proportion of the total enrollment. Among these 32 demographically similar districts I found that Syracuse s suspension rates ranked as follows: 8 th highest for Black and Asian students. 4 th highest for White students 6 th highest for students with disabilities 3 rd highest for Latino students 5 th highest overall To illustrate the comparison to similar districts graphically the following example was presented in September. The graph below compares suspension rates in Syracuse to those in Yonkers, New York. Yonkers was chosen because of the 32 used above it had a similar demographic make-up to Syracuse and is subject to the same State laws and regulations. Syracuse VS. Yonkers Secondary Schools Yonkers All Black White Latino Asian American ELL All Black White Latino Asian American ELL Student with Disabilities Student without Disabilities Syracuse All Black White Latino Asian American Student with Disabilities ELL All Black White Latino Asian American Student without Disabilities ELL 13

.")
14 It is worth noting that both districts suspended students at high rates, and both districts suspended far higher numbers of students with disabilities within the same racial group (except for Asian American students). Two striking differences are that: 1) Syracuse suspended substantially higher rates of nearly every subgroup, often as much as 10 percentage points higher; and 2) English learners with disabilities were suspended at such high rates. These comparisons to demographically similar districts suggest that barring obstacles to reform that are unique to Syracuse, reducing suspension rates in Syracuse is likely an achievable goal. Toward achieving that goal, it is more important to understand the suspension use patterns within the school district. Often overlooked in state and national reports is the analysis of certain race/gender combinations. These tend to reveal that the most profound differences in suspension rates are found in the cross sections of race and gender. The presentation of race/gender data begins with females because the high frequency with which we suspend girls in some racial groups sometimes gets overlooked when we focus on the highest suspended group. Notice, for example that one out of every three Black females at the secondary level were suspended at least once, making them the 3 rd highest subgroup in terms of their risk for suspension, with only Black and Latino males at the secondary level having higher rates. 14


15 15
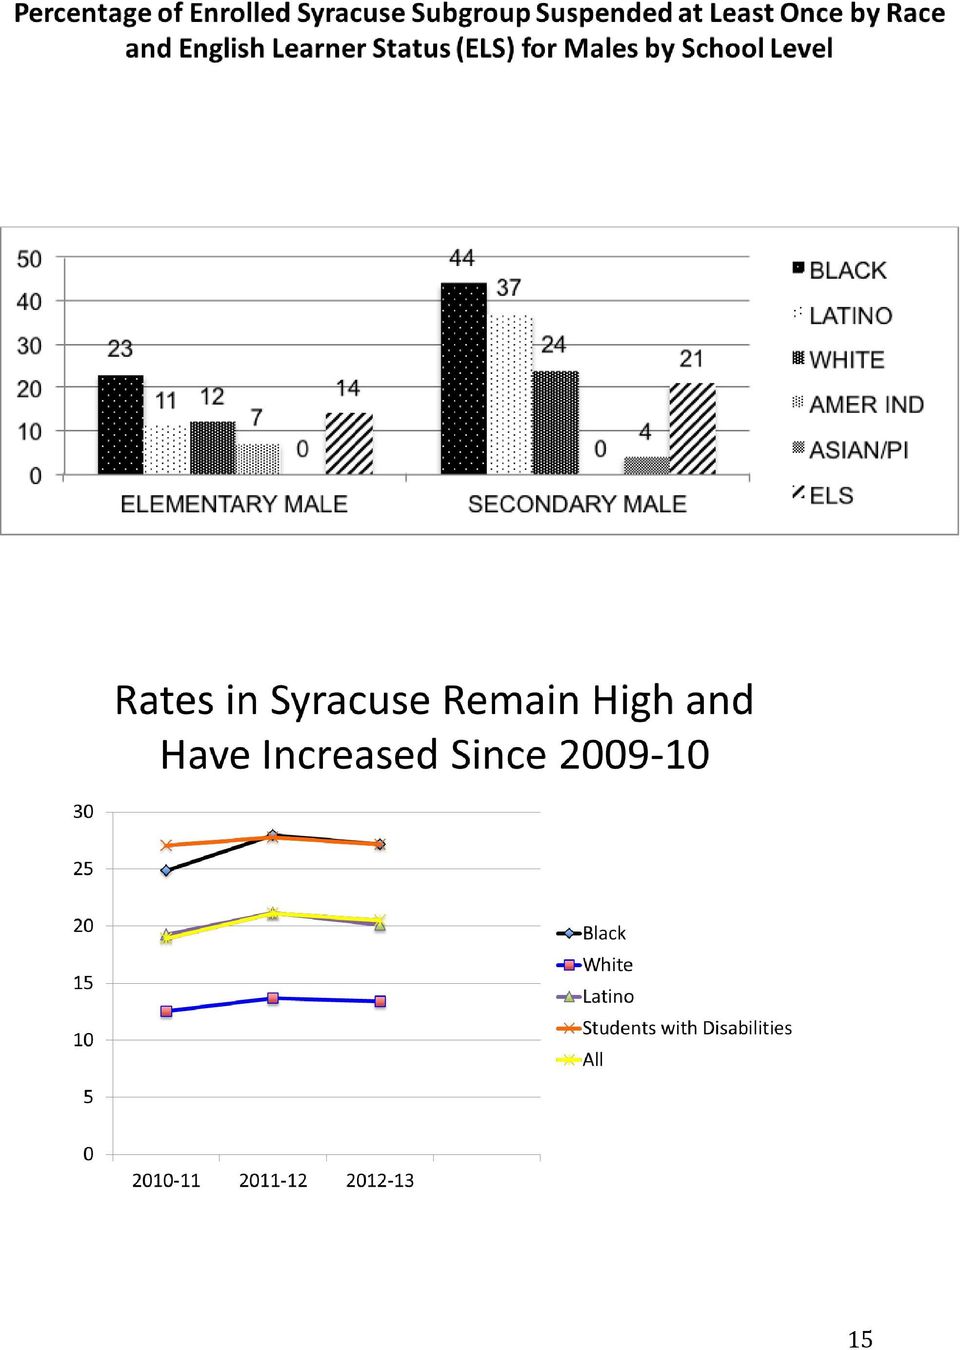
16 Up until this point this report has relied on analysis of data from academic year. With the assistance of Syracuse City Schools personnel, a more current and detailed review of data disparities was made possible. To begin with, the most current data indicate that suspension rates have been rising slightly since Although not represented in the figure above, the rates in were all within one percentage point of the rates for This important background information indicates that despite Superintendent Contreras efforts, little has changed with regard to the use of suspensions in Syracuse City Schools over the last 4 consecutive years. This stable data picture also presents a fairly reliable benchmark against which the district s future efforts to reduce suspensions and disparities can be measured. The stability is also found with regard to the size of the racial disparities and the suspension rates at the elementary, middle and high school levels. The next graph presents these disparities using the most recent data from and like the overall trends, indicates that very little has changed. All the descriptions from this point are based on the school year. 16


17 These district averages provide a limited snapshot. To better understand the use of suspensions in Syracuse this report looked at individual school level data; data on the reasons for suspensions and calculations of the days of lost instruction; and, data that enable the analysis to control for differences in student level poverty. The kind of deeper analysis that follows will be important to replicate in the future to gain a complete understanding of the use of suspensions in Syracuse, the disparate impact, for identifying areas of greatest need for reform, as well as to document success. As a side note, many large districts have tremendous variation in the use of suspensions. In Los Angeles, for example, we found both the greatest number of high-suspending middle schools, where 25% or more of at least one subgroup was suspended - but also the greatest number of low-suspending secondary schools, where the suspension rates were less than 10% for all subgroups. (Losen & Martinez, 2013). These variations sometimes result from dramatically different approaches to school discipline within the same district. The analysis of school level data in Syracuse did find important variations; however, there were no schools that could be fairly characterized as low-suspending. In fact, nearly all the schools in Syracuse would be considered high-suspending if these same national comparison benchmarks for secondary school were used. Specifically, in , I found the following: 17

18 In 10 Syracuse schools, 25% or more of all the enrolled secondary students were suspended at least once. 15 of the 17 Syracuse City School serving secondary students suspended at least 25% of one major subgroup (race, gender, disability) Of these 4 secondary schools suspended at least one subgroup at a rate of 50% or more. Syracuse had 6 schools serving elementary students where the rate of suspension was below 10% for every major subgroup. However, that 10% threshold was exceeded by every school in Syracuse when the subgroups were further disaggregated to look at the rates by the cross-section of race with disability In Syracuse it s simply a myth that just a few kids are disruptive and so the solution cannot be to focus on a small subset of students. If getting tough on misbehavior means doling out harsh consequences and frequently removing rule breakers from school, then Syracuse is among the most consistent and toughest districts in the nation, especially for elementary school children. More than one in seven elementary and nearly 4 out of every 10 middle school kids were suspended out of school at least one time. Given that some research suggests that suspending non-delinquent children from elementary school might promote delinquency (Shollenberger, 2014), Syracuse should focus on reducing the use of suspensions in elementary schools. This will be discussed further in the recommendations section. The volume of suspensions also matters: The facts analyzed thus far don t actually capture the full magnitude of suspension use in Syracuse because we have only analyzed the numbers of students suspended at least once. We have not counted the number of suspensions. Counting suspensions, and their length, is a stronger indicator of the impact of suspensions. If we know the number of suspensions and their length we can better assess the direct impact. Days of Lost Instruction: In the first part of this report a reference was made to the fact that out-of-school suspensions often have hidden costs. One obvious cost is that suspended students lose days of instruction. The cumulative loss in Syracuse, for example, was 23, 555 days in alone. With the district s data and assistance we were able to further specify the racially disparate impact of days of lost instruction. Here are the numbers for average days of lost instruction per enrolled student: All: 1.2 White: 0.76 Latino: 1.08 Black: 1.64 Asian/PI: 1.08 Amer. Ind

19 Over the course of a K-12 education, the average Black student enrolled in Syracuse will lose days of instruction. That is a per-pupil average. These average per-student days of lost instruction are not to be confused with the how much time each suspended student loses. Many students are never suspended and lose no instruction. Therefore the average loss of instruction per student actually suspended would be far higher. Suspensions per 100 Students Enrolled: Often readers assume that the discussion of suspension rates did not account for the fact that a few unruly students can wind up getting suspended multiple times and drive up the rates. This is a common misconception by readers who are shocked by the data. The rates below are higher than those examined thus far because up until this point the analysis was of students who received one or more suspensions. Below are the far higher counts of suspensions per 100 students. In Syracuse suspensions per 100 are typically three to four times higher than the student suspension rates. In Syracuse, in the academic year, the district meted out 47 suspensions for every 100 students without disabilities enrolled, K-12. This number nearly doubled to 84 per 100 suspensions meted out to students with disabilities. At this point, it is worth reiterating that the American Psychological Association, Academy of American Pediatrics, the National Association of School Psychologists, and the National School Boards Association, all say we need to return to using suspensions as measures of last resort. 19

20 With so many suspensions meted out each year, could suspensions in Syracuse only reflect measures of last resort? Most do not argue about the use of disciplinary removal in response to weapons and drugs possession and to serious violent offenses. Many in the general public believe that schools only resort to suspension from school in response to serious offenses. Although there is insufficient national data, extensive data from large states including California and Texas suggest that serious offenses are relatively rare and that out-of-school suspensions are meted out in response to minor offenses with higher frequency than any other category. Syracuse certainly follows that pattern. Critically important to both understanding the issue in Syracuse and to designing a remedy is that the disparities by race and disability status are largest (in absolute terms) in the least serious offense categories and smallest in the most serious categories. One likely reason for greater disparities in the least serious categories is that most involve perception and subjectivity. For example, suspension for defiance, disruption or disobedience can be triggered by misunderstanding and miscommunication. Subjectivity means that what one teacher may label serious disrespect or a gang sign, another may dismiss as a harmless joke or gesture. On the other hand the most serious offenses can usually be determined using objective criteria such as actual possession of a weapon or violence that resulted in a serious injury requiring treatment. The two images that follow compare the suspensions per 100 students for these two ends of the offense spectrum. The first set of columns covers weapon and drug possession and violence leading to serious injury. The second set of columns is restricted to suspensions for minor altercations, and all other minor offenses. 20

21 This graph answers two questions about the use of suspensions in Syracuse. First, most suspensions, regardless of race are not for serious more objective offense categories. The suspensions per 100 students is not very high for the most serious offenses for White or Black students. Second, the racial gap is almost non-existent for the serious offenses and nearly 25 times larger for the subjective minor offenses. When race and disability status are viewed together, the gaps become larger for both the serious and non-serious offense categories but remain very small for the most serious offense categories and very large for the minor offenses. The evidence thus far suggests that Syracuse is not reserving suspensions as measures of last resort. If so, part of the remedy may lie in restricting the use of suspension to only serious offenses, or at least ruling out suspensions for a subset of the most minor offenses that currently may be grounds for an out-of-school suspension. Some may find it unfair to assume that suspensions are not reserved as a last resort. One additional indicator would provide evidence that other alternatives were tried first, or at least were being used on a regular basis. One such indicator might be in-school suspensions. Of course a school that is very punitive in its approach to discipline may have very high numbers of both in- and out-of-school suspensions and use both as frequent responses to minor offenses. No single indicator can tell the whole story and a close review of individual student files may be more helpful. This report did not analyze any student files to determine whether most suspended students were first given support and non-punitive responses. Of course individual file reviews are extremely costly in terms of time. There may be justification for conducting occasional file reviews as part of 21
22 a monitoring system, but they would not be a very viable form of routine quarterly or even annual review for every school. Referrals to Law Enforcement May be Rising: One area of discipline disparity that may seem acceptable concerns the percentage of students referred to law enforcement. Clearly, if police were called in to prevent or stop violence, referrals to law enforcement, and the disparities that result would be justified. Unfortunately, the data do not come with the reasons. In the context of very high-suspending schools, however, high rates of referral to law enforcement, and disparities in their use may also suggest an area of concern not covered in my initial presentation. We know from the data from the U.S. Department of Education for that 437 students were referred to law enforcement and that there were zero school based arrests. Two years earlier in , the numbers were 105 and 25, respectively. Assuming the numbers are all accurate, the more recent data represent more than a fourfold increase in law enforcement involvement in school discipline. In the referral rate did not exceed 1% for any subgroup of students. Along with this huge increase, in students with disabilities were over twice as likely as their non-disabled peers to be referred. 3.1% of all students with disabilities were referred, compared with 1.4% of students without disabilities. Further disaggregated by race we see that 3.8 percent of Blacks with disabilities compared to 2.2% of Whites with disabilities were referred to law enforcement. While it is true that the absolute size of the disability and racial gaps, all below 2 points, are small compared with suspensions, the consequence, which is often arrest and detention is of a much higher magnitude and can be devastating. Closer analysis of these data and information on the use of law enforcement in the public schools is needed as Syracuse moves forward. School level analysis: Up to this point, this report has focused on analysis of data at the district level. A school level analysis is needed to fully understand how discipline is meted out in Syracuse. Individual school level data can help identify different approaches to school discipline, including schools that may be more effective than others. Such a variance is common and means that within the district there are leaders and teachers that have the experience needed to help others in the district reduce suspensions while improving the learning environment. With these dual goals in mind, for this report, I developed a way to review the data on inschool suspensions in direct comparison to out-of-school suspensions using the current school-level data collection already in place in Syracuse. In my September presentation to the school board I called it an alternative or second chance indicator, although it is more accurately a ratio of the use of in-school-suspensions (ISS) to out-of-school suspensions (OSS). One cannot be certain that every ISS is meted out as an alternative to an OSS although that may often be the case. It should be noted that this indicator helps identify schools that are using in-school suspension much more than out-of-school suspensions, but is not good at detecting whether a school is high or low suspending in terms of either ISS or OSS because the ratio is a relative measure. Therefore, it is most useful to look at this ratio together with the actual OSS risk levels. 22
23 The Alternative ISS/OSS Ratio: To apply this indicator, for each subgroup of students the number of in-school suspensions (ISS) was divided by the number of out-of-school suspensions (OSS) at the school level. A ratio of 1.0 means that equal numbers of students received an ISS as received an OSS. District wide, in , there was almost no difference for Black and White students with regard to this ratio. Blacks scored 1.14 and Whites scored This suggests that across the district, students who misbehaved were nearly as likely to receive an OSS as they were an ISS. At first blush one might think that this suggests that alternatives are used often and that OSS is often NOT meted out the first time a student violates a school rule. However, a school that sought to address misbehavior within the school, and reserved an OSS as a last resort would be expected to have a much higher ratio. Further, the school level breakdown of the ratio shows a much wider variety. Specifically, most of the elementary schools had a high ratio of 2.0 or greater. Most of the high schools and middle schools had a ratio of 0.75 or lower. 23 The ISS/OSS Alternatives Ratio and racial disparities in discipline: Additional analysis revealed some important patterns. All the schools that had an ISS/OSS (Alternatives) ratio over 2.0 were also relatively low suspending in terms of OSS for Black students and none were secondary schools. In contrast, all that had an Alternatives Ratio at 0.75 or lower suspended 25% or more of their Black students except Expeditionary Learning Middle School (20%). When combined with the district wide analysis comparing the OSS use for serious versus non-serious offenses, the Alternatives ratio I developed for Syracuse suggests not only that high suspending (OSS) schools are not using ISS often enough, but that the tendency to rely on OSS and not utilize ISS may also be contributing to the substantially higher rates of OSS for Black students. Even though Syracuse has some of the nation s highest suspension rates for elementary schools, the secondary schools are much higher in absolute terms. Therefore, within the district there may be some approaches used at the elementary level, such as using OSS less often than ISS that the secondary schools may find useful. An important caveat is that in-school suspensions, which remove students from class, can also have a negative impact. Studies like the famous Breaking School Rules study in Texas (Fabelo, 2011) found that suspensions from classrooms, both in and out of school, were highly correlated with negative academic outcomes and risks for dropping out and involvement in the juvenile justice system (Fabelo, 2011). Unless in-school suspensions are places where students are actively engaged in improving academically and behaviorally, they may not be the best intervention. On the other hand, research on interventions in Cleveland, Ohio (Osher, 2013) suggest that when disciplined students were sent to learning centers where they received academic and behavioral supports as one part of a systemic effort to teach social and emotional learning and improve school climate and safety, such in-school suspensions could provide more benefits than out-ofschool suspensions. Is the K-8 Model More Conducive to Developing a Positive School Climate? The school level analysis prompted further exploration of school differences by school type. 23
24 There are three types of general education configured schools in Syracuse, elementary, middle, high and K-8. To explore the school level differences the elementary school analysis entailed separating out the elementary grade level data and the secondary level data from K-8 schools in Syracuse. The two graphs that follow revert back to the straightforward analysis of the student risk for out-of-school suspension, also called the student suspension rate, used in the first part of this report. In other words these graphs did not count the number of suspensions, but the number of students who were suspended one or more times and that were used to calculate the percentage of enrolled students suspended. The first graph compares the suspension the risk for suspension by racial group for middle school students by type of school. The middle school equivalent student suspension risk of those attending K-8 schools was calculated by looking at only enrollment and the suspended students of students from grades 6-8. These findings are represented in the columns on the left. What is striking is that district-wide the sixth, seventh and eighth grade students attending K-8 schools have substantially lower risk for OSS and this pattern held true for each racial group. The Black/White gap for students in grades 6-8 was 15 percentage points in K-8 schools and 26 percentage points in traditional middle schools. However the Latino/White gap was constant across both school types at only 1 percentage point. The data presented cover just the school year but the analysis was conducted, and the same pattern was found, for three consecutive years. Syracuse Suspension Risk in Grades 6-8 for Middle Schools versus in K-8 60 Grades 6-8 Disparities in in K8 Middle School Black White Latino 24
25 It is important to note that the district-wide analysis does not mean that each school fits the pattern. While transforming middle schools to K-8 institutions may be worth considering in Syracuse, one cannot assume that doing so will automatically lower suspension rates and racial disparities. As the next graph demonstrates, not all K-8 schools were among the lower-suspending schools. Like the graph above, the rates in the two graphs that follow examined the OSS rates by rates for students in grades 6-8 in each type of school Not All K-8* Schools Were Lower- Suspending Ed Smith Frazer Hughes Huntington H.W. Smith Roberts Black White Latino
26 Not All Middle Schools Were High- Suspending Black White Latino 0 Clary Danforth Ex. Learning Grant Lincoln Westside Ac. 32 These descriptive data raise important questions, but should not be confused with fullscale research findings on the benefits of K-8 grade configurations in Syracuse. While switching to a K-8 configuration does not guarantee a reduction in suspensions, Syracuse should not ignore the baseline observation, that the K-8 grade configuration in Syracuse appears to be related to a lower risk for suspension, especially for Black students. The 30% risk for OSS for Blacks in grades 6-8 attending K-8 schools is also still quite high, but it is a substantial improvement over the 55% Black student suspension risk in Syracuse s traditional middle schools. Questions about remedies: The school level analysis was conducted in part to learn more about what is working well already in Syracuse. The individual school analysis revealed two outlier schools in terms of suspension rates and raise the question about whether Expeditionary Learning and Roberts K-8 doing differently? Keep in mind that the patterns represented were consistent for three consecutive years although just one year is represented. Further, analysis (not presented here) was conducted to examine whether these individual school results would hold after controlling for poverty. This analysis revealed that both of these schools had lower OSS rates for each racial group when further disaggregated by the poor and non-poor students. In other words, the fact that these two schools have somewhat lower percentage of students receiving free and reduced lunch did not alter the finding that they had substantially lower suspension rates. 26
The Disparate Impact of Disciplinary Exclusion From School in America
 Opportunities Suspended: The Disparate Impact of Disciplinary Exclusion from School By Daniel J. Losen 1 and Jonathan Gillespie 2 EXECUTIVE SUMMARY Does anybody know how many students were suspended from
Keeping California s Kids in School: Fewer Students of Color Missing School for Minor Misbehavior
 Keeping California s Kids in School: Fewer Students of Color Missing School for Minor Misbehavior By Daniel J. Losen, Tia E. Martinez and Valerie Okelola Recently the California Department of Education
Case 4:74-cv-00090-DCB Document 1688 Filed 10/01/14 Page 57 of 136. Life Skills Alternative to Suspension Program (LSASP)
") Case 4:74-cv-00090-DCB Document 1688 Filed 10/01/14 Page 57 of 136 Life Skills Alternative to Suspension Program (LSASP) General Description The Life Skills Alternative to Suspension Program (LSASP) provides
Case 4:74-cv-00090-DCB Document 1688 Filed 10/01/14 Page 57 of 136 Life Skills Alternative to Suspension Program (LSASP) General Description The Life Skills Alternative to Suspension Program (LSASP) provides
HOW THE LOCAL CONTROL FUNDING FORMULA (LCFF) CAN FIX SCHOOL DISCIPLINE
 CAN FIX SCHOOL DISCIPLINE") HOW THE LOCAL CONTROL FUNDING FORMULA (LCFF) CAN FIX SCHOOL DISCIPLINE Summary: We need more solutions to help students struggling with behavior in California, not suspensions. Two decades of research
HOW THE LOCAL CONTROL FUNDING FORMULA (LCFF) CAN FIX SCHOOL DISCIPLINE Summary: We need more solutions to help students struggling with behavior in California, not suspensions. Two decades of research
STOPPING OUT-OF-SCHOOL SUSPENSIONS
 STOPPING OUT-OF-SCHOOL SUSPENSIONS DECEMBER 2012 www.otlcampaign.org www.stopsuspensions.org OPPORTUNITY ACTION Promoting quality public education for all www.opportunityaction.org Contents STOPPING OUT-OF-SCHOOL
Out- of- School Suspension in Maryland Public Schools, 2008-2014
 Out- of- School Suspension in Maryland Public Schools, 2008-2014 Matthew Henry November 2015 Exclusionary discipline, or the practice of removing students from the classroom in response to disruptive behavior,
THINKING ABOUT CRIMINAL JUSTICE REFORM By Daniel T. Satterberg
 K I N G C O U N T Y P R O S E C U T I N G A T T O R N E Y S O F F I C E JUSTICE DANIEL T. SATTERBERG PROSECUTING ATTORNEY COMPASSION PROFESSIONALISM INTEGRITY THINKING ABOUT CRIMINAL JUSTICE REFORM By
The MetLife Survey of
 The MetLife Survey of Preparing Students for College and Careers Part 2: Teaching Diverse Learners The MetLife Survey of the American Teacher: Preparing Students for College and Careers The MetLife Survey
AN EFFECTIVE STRATEGY TO REDUCE DISPROPORTIONATE DISCIPLINE, SUSPENSIONS AND IMPROVE ACADEMIC OUTCOMES.
 RESTORATIVE JUSTICE IN OAKLAND SCHOOLS IMPLEMENTATION AND IMPACTS 2014 AN EFFECTIVE STRATEGY TO REDUCE DISPROPORTIONATE DISCIPLINE, SUSPENSIONS AND IMPROVE ACADEMIC OUTCOMES. EXECUTIVE SUMMARY Need for
García - 2013 School Discipline Policy and School Climate Bill of Rights
 García - 2013 School Discipline Policy and School Climate Bill of Rights Whereas, The Los Angeles Unified School District (LAUSD) understands that student achievement begins with keeping students in a
Chicago School-to-Prison Pipeline Fact Sheet
 Chicago School-to-Prison Pipeline Fact Sheet (September 2013 by Project NIA) Chicago Public School Arrest Data (Source: Policing Chicago Public Schools Vol. 2 http://cpdincps.com/) Overall youth school-based
Ed Tucker, JD, PhD, LCSW Assistant Professor School of Social Work Barry University Miami Shores, Florida
 Ed Tucker, JD, PhD, LCSW Assistant Professor School of Social Work Barry University Miami Shores, Florida Zero Tolerance Predetermined consequences for noncompliance with mandatory behavior. Removes discretionary
How Harsh School Discipline Fuels the School to Prison Pipeline. Sarah Biehl Policy Director Children s Defense Fund-Ohio
 How Harsh School Discipline Fuels the School to Prison Pipeline Sarah Biehl Policy Director Children s Defense Fund-Ohio I believe that education is the civil rights issue of our generation. And if you
Public Housing and Public Schools: How Do Students Living in NYC Public Housing Fare in School?
 Furman Center for real estate & urban policy New York University school of law wagner school of public service november 2008 Policy Brief Public Housing and Public Schools: How Do Students Living in NYC
February 10, 2015. School Discipline Reform/School Climate and H.R. 5, the Student Success Act
 February 10, 2015 Chairman John Kline Committee on Education and the Workforce U.S. House of Representatives 2181 Rayburn House Office Building Washington, D.C. 20515 Ranking Member Robert Bobby Scott
Schools, Disability, Discipline & Arrest. Robert D. Fleischner Center for Public Representation Northampton, Massachusetts
 Schools, Disability, Discipline & Arrest Robert D. Fleischner Center for Public Representation Northampton, Massachusetts Problematic Disciplinary Outcomes for Students with Disabilities Removal from regular
Jacksonville Full Service School Evaluation Report. National Center for School Engagement
 Jacksonville Full Service School Evaluation Report National Center for School Engagement February, 2012 An initiative of The Partnership for Families & Children 450 Lincoln Avenue, Suite 100 Denver, CO
Chronic Elementary Absenteeism: A Problem Hidden in Plain Sight A Research Brief from Attendance Works and Child & Family Policy Center
 Chronic Elementary Absenteeism: A Problem Hidden in Plain Sight A Research Brief from Attendance Works and Child & Family Policy Center Charles Bruner, Anne Discher and Hedy Chang November 2011 Summary
DISCIPLINE POLICIES, SUCCESSFUL SCHOOLS,
 DISCIPLINE POLICIES, SUCCESSFUL SCHOOLS, AND RACIAL JUSTICE Daniel J. Losen The Civil Rights Project/Proyecto Derechos Civiles at UCLA October 2011 National Education Policy Center School of Education,
More than 100 parents, students, police, and school and juvenile
 broward Broward County Public Schools More than 100 parents, students, police, and school and juvenile court officials filled the Mizell Center in Fort Lauderdale on October 18, 2005 to raise concerns
School- to- Prison Pipeline: A Comparison in Discipline Policy Between Maryland and Texas Public Schools
 School- to- Prison Pipeline: A Comparison in Discipline Policy Between Maryland and Texas Public Schools Meredith Bouchein August 2015 America s public schools have a responsibility to educate America
Kristen DeSalvatore, Coordinator of Federal Reporting. School Year. Important: Due Date is August 7, 2015.
 THE STATE EDUCATION DEPARTMENT / THE UNIVERSITY OF THE STATE OF NEW YORK / ALBANY, NY 12234 OFFICE OF P-12 (SPECIAL EDUCATION) INFORMATION AND REPORTING SERVICES (IRS) 89 WASHINGTON AVENUE RM 881 EBA ALBANY,
The Murphy Roadmap: Criminal Justice Reform
 The Murphy Roadmap: Criminal Justice Reform Paid for by Friends of Patrick Murphy. PAGE 2 THE MURPHY ROADMAP: CRIMINAL JUSTICE REFORM The Murphy Roadmap: Criminal Justice Reform We need to restore balance
PROMOTING THE EDUCATIONAL SUCCESS OF YOUTH AND LIMITING EXCLUSIONARY DISCIPLINE FOR OUR YOUNGEST ELEMENTARY SCHOOL STUDENTS IN DALLAS ISD
 June 8, 2016 Delivered via email The Honorable Lew Blackburn, President District 5 lblackburn@dallasisd.org The Honorable Miguel Solis, First Vice President District 8 miguelsolis@dallasisd.org The Honorable
Data Housed at the North Carolina Education Research Data Center
 Data Housed at the North Carolina Education Research Data Center District-level data Community Index Data, Year 2004 Each file has one record per Local Education Agency with the percent of students (a)
Improving School Climate and Student Behavior Through Positive Behavior Supports. Doug Maraffa
 Improving School Climate and Student Behavior Through Positive Behavior Supports Doug Maraffa Expectations What type of Climate do I need to create a Culture that is conducive to learning? What type of
College Enrollment, Persistence, and Graduation: Statewide Results
 College Enrollment, Persistence, and Graduation: Statewide Results 72 Percent of Public High School Graduates Enroll in College 46 Percent Graduate in Six Years Summary Among students in the public high
Solutions Not Suspensions Ending the Discipline Gap in Minnesota Public Schools
 SEPTEMBER 2013 Minnesota Minority Education Partnership POLICY BRIEF Solutions Not Suspensions Ending the Discipline Gap in Minnesota Public Schools A Recommendation from the Equity and Excellence Commission
PROFESSIONAL BACKGROUND
 Statement of Benjamin S. Fernandez, MSEd, Lead School Psychologist Loudon County Public Schools, Virginia NASP Briefing: Effective Discipline Policies and Practices Thursday, April 18, 2013 My name is
Methods for Assessing Racial/Ethnic Disproportionality in Special Education A Technical Assistance Guide (Revised)
") Methods for Assessing Racial/Ethnic Disproportionality in Special Education A Technical Assistance Guide (Revised) Julie M. Bollmer James W. Bethel Tom E. Munk Amy R. Bitterman May 2014 ideadata.org The
Methods for Assessing Racial/Ethnic Disproportionality in Special Education A Technical Assistance Guide (Revised) Julie M. Bollmer James W. Bethel Tom E. Munk Amy R. Bitterman May 2014 ideadata.org The
RIGHTS OF YOUTH IN MASSACHUSETTS PUBLIC SCHOOLS REGARDING SCHOOL DISCIPLINE. Prepared by the Mental Health Legal Advisors Committee * March 2015
 RIGHTS OF YOUTH IN MASSACHUSETTS PUBLIC SCHOOLS REGARDING SCHOOL DISCIPLINE Prepared by the Mental Health Legal Advisors Committee * March 2015 This pamphlet describes the rights of youth attending public
Dignity in Schools Campaign. Using State-wide Report Cards to Fight Pushout and Criminalization
 Dignity in Schools Campaign Using State-wide Report Cards to Fight Pushout and Criminalization Agenda for Today s Webinar Brief Overview of DSC Presentations on State-wide Report Cards o Padres y Jóvenes
Running Head: Student and Teacher Perceptions of Discipline STUDENT AND TEACHER PERCEPTIONS OF DISCIPLINE AT THE MIDDLE SCHOOL LEVEL
 Running Head: Student and Teacher Perceptions of Discipline STUDENT AND TEACHER PERCEPTIONS OF DISCIPLINE AT THE MIDDLE SCHOOL LEVEL By Christine McMasters A Research Paper Submitted in Partial Fulfillment
California Youth Crime Declines: The Untold Story
 CENTER ON JUVENILE AND CRIMINAL JUSTICE California Youth Crime Declines: The Untold Story Introduction Public perceptions about youth crime tend to imagine high incidents of violent crime and property
IDEA 2004 Close Up: Disciplining Students With Disabilities
 IDEA 2004 Close Up: Disciplining Students With Disabilities If your child has an IEP, you should understand the legal provisions for disciplining him at school. By Candace Cortiella, The Advocacy Institute
CIVIL RIGHTS DATA COLLECTION
 U.S. Department of Education Office for Civil Rights CIVIL RIGHTS DATA COLLECTION Data Snapshot: School Discipline Issue Brief No. 1 (March 2014) For other data snapshots in the series, visit the CRDC
Associated Industries of Florida. Getting Smart on Juvenile Crime in Florida: Taking It to The Next Level
 Associated Industries of Florida Getting Smart on Juvenile Crime in Florida: Taking It to The Next Level Reducing Juvenile Arrests by 40% Barney T. Bishop III Chairman Wansley Walters, Director Miami-Dade
Learners with Emotional or Behavioral Disorders
 Learners with Emotional or Behavioral Disorders S H A N A M. H A T Z O P O U L O S G E O R G E W A S H I N G T O N U N I V E R S I T Y S P E D 2 0 1 S U M M E R 2 0 1 0 Overview of Emotional and Behavioral
DATE. Mary Vixie Sandy, Executive Director California Commission on Teacher Credentialing 1900 Capitol Avenue Sacramento, CA 95811-4213
 DATE Mary Vixie Sandy, Executive Director California Commission on Teacher Credentialing 1900 Capitol Avenue Sacramento, CA 95811-4213 Dear Executive Director Sandy: By means of this letter, I wish to
Suspending Chicago s Students
 RESEARCH REPORT SEPTEMBER 2015 Suspending Chicago s Students Differences in Discipline Practices across Schools Lauren Sartain, Elaine M. Allensworth, and Shanette Porter with Rachel Levenstein, David
TEXAS SAFE SCHOOLS ACT
 TEXAS SAFE SCHOOLS ACT Your Rights and Responsibilities 2007-2009 UPDATE Texas AFT www.texasaft.org July 2009 Dear Colleague, Seventeen years ago, Texas AFT launched its campaign for a Safe Schools Act
Middle Grades Action Kit How To Use the Survey Tools!
 How To Use the Survey Tools Get the most out of the surveys We have prepared two surveys one for principals and one for teachers that can support your district- or school-level conversations about improving
Education Policy Brief
 Education Policy Brief DISCIPLINE, DISABILITY, AND RACE: DISPROPORTIONALITY IN INDIANA SCHOOLS M. Karega Rausch & Russell Skiba VOLUME 4, NUMBER 1, FALL 26 INTRODUCTION The Individuals with Disabilities
This report provides the executive summary for Indicators of School Crime and Safety: 2014.
 1 Liability Report Number: LB-10-66 Release Date: August 6, 2015 Section Title: General Information Abstract School violence not only has a direct impact on students, but also on educators, parents, and
Bryan Middle School. Bryan Middle School. Not Actual School Data. 100 Central Dr Anywhere, DE 19900 (555) 555-5555. Administration.
 555-5555. Administration.") O Hare School District Emma Haviland 100 Central Dr Anywhere, DE 19900 (555) 555-5555 Administration Principal Assistant Principal Assistant Principal Emma Haviland Stan Westfield Barbara Powell Accountability
O Hare School District Emma Haviland 100 Central Dr Anywhere, DE 19900 (555) 555-5555 Administration Principal Assistant Principal Assistant Principal Emma Haviland Stan Westfield Barbara Powell Accountability
DISCIPLINE OF THE 504 STUDENT
 DISCIPLINE OF THE 504 STUDENT Change of Placement Rule: A 504 child s removal from the normal placement for more than ten (10) days constitutes a change in placement, which generally is defined as a material
Dr. LaVonne Chenault-Goslin
 Dr. LaVonne Chenault-Goslin Educational doctorate in Teaching & Learning 30 years working in tribal community Mental health, social work, foster care, child abuse & neglect, youth services, community wellness
Characteristics of Colorado s Online Students
 Characteristics of Colorado s Online Students By: Amanda Heiney, Dianne Lefly and Amy Anderson October 2012 Office of Online & Blended Learning 201 E. Colfax Ave., Denver, CO 80203 Phone: 303-866-6897
Disciplining Students With Disabilities
 Disciplining Students With Disabilities From National Association of School Psychologists (NASP) by Kevin P. Dwyer, NCSP - Assistant Executive Director, NASP A child runs, out-of-control, down the busy
ARE WE CLOSING THE SCHOOL DISCIPLINE GAP?
 ARE WE CLOSING THE SCHOOL DISCIPLINE GAP? THE CENTER FOR CIVIL RIGHTS REMEDIES F E B R U A R Y, 2 0 1 5 By Daniel Losen, Cheri Hodson, Michael A. Keith II, Katrina Morrison, and Shakti Belway Acknowledgements
Using a Comprehensive Framework: Assisting Schools to Plan Using this Framework. The Safe & Responsive Schools Project
 What Works in and Violence? Reece L Peterson & Courtney K Miller University of Nebraska-Lincoln Russell J Skiba Indiana University International Council for Exceptional Children 2003 Annual Convention
For Immediate Release: Thursday, July 19, 2012 Contact: Jim Polites 860.713.6525
 For Immediate Release: Thursday, July 19, 2012 Contact: Jim Polites 860.713.6525 2012 CMT, CAPT RESULTS SHOW SOME INCREASES, WHILE GAPS IN ACHIEVEMENT PERSIST The Connecticut State Department of Education
Florida Department of Education Bureau of Exceptional Education and Student Services. 2016 LEA Profile. Introduction
 Bureau of Exceptional Education and Student Services Pam Stewart Commissioner 2016 LEA Profile Introduction : Enrollment Group: PK-12 Population: Percent Disabled: Alachua 20,000 to 40,000 29,320 13% The
Disturbing Inequities: Exploring the relationship between racial disparities in special. education identification and discipline
 Disturbing Inequities: Exploring the relationship between racial disparities in special education identification and discipline Daniel J. Losen, Cheri Hodson, Jongyeon Ee, and Tia E. Martinez University
Reducing Out-of-School Suspensions and Expulsions in District of Columbia Public and Public Charter Schools
 Reducing Out-of-School Suspensions and Expulsions in District of Columbia Public and Public Charter Schools Office of the State Superintendent of Education Reducing Out-of-School Suspensions and Expulsions
New York State Profile
 New York State Profile Jennifer Guinn EDUC 547 FALL 2008 According to 2006 U.S. Census estimates, with a total population of over 19 million people, 20 percent of New York State s population were foreign-born
CALIFORNIA S NEW EDUCATION FUNDING FORMULA:
 CALIFORNIA S NEW EDUCATION FUNDING FORMULA: What is it? Who benefits? What does it mean for students? How can I get involved? In July 2013, California dramatically reformed the way we fund our schools.
A New Measure of Educational Success in Texas. Tracking the Success of 8th Graders into and through College
 A New Measure of Educational Success in Texas Tracking the Success of 8th Graders into and through College National Center for Management Systems (NCHEMS) Contents Introduction 1 The Challenge 2 Purpose
State of New Jersey 2014-15
 Page 1 of 22 OVERVIEW COUNTY VOCATIONAL GRADE SPAN 0912 1.00 313995050 WAYNE, NJ 074702210 The New Jersey Department of Education (NJDOE) is pleased to present these annual reports of Performance. These
Special Education Audit: Organizational, Program, and Service Delivery Review. Yonkers Public Schools. A Report of the External Core Team July 2008
 Special Education Audit: Organizational, Program, and Service Delivery Review Yonkers Public Schools A Report of the External Core Team July 2008 The Collaborative Founded in 1994 Sponsored by the Education
Florida s Plan to Ensure Equitable Access to Excellent Educators. heralded Florida for being number two in the nation for AP participation, a dramatic
 Florida s Plan to Ensure Equitable Access to Excellent Educators Introduction Florida s record on educational excellence and equity over the last fifteen years speaks for itself. In the 10 th Annual AP
Classroom Management that Works. Researched-Based Strategies for Every Teacher adapted from Robert Marzano Sharon M. Cournoyer
 Classroom Management that Works Researched-Based Strategies for Every Teacher adapted from Robert Marzano Sharon M. Cournoyer Learning Targets: Session Objectives I can identify the key components of successful
Published annually by the California Department of Justice California Justice Information Services Division Bureau of Criminal Information and
 Published annually by the California Department of Justice California Justice Information Services Division Bureau of Criminal Information and Analysis Criminal Justice Statistics Center 2011 Juvenile
Introduction: Online school report cards are not new in North Carolina. The North Carolina Department of Public Instruction (NCDPI) has been
 has been") Introduction: Online school report cards are not new in North Carolina. The North Carolina Department of Public Instruction (NCDPI) has been reporting ABCs results since 1996-97. In 2001, the state General
Introduction: Online school report cards are not new in North Carolina. The North Carolina Department of Public Instruction (NCDPI) has been reporting ABCs results since 1996-97. In 2001, the state General
CHARTER SCHOOL PERFORMANCE IN INDIANA. credo.stanford.edu
 CHARTER SCHOOL PERFORMANCE IN INDIANA credo.stanford.edu March 2011 TABLE OF CONTENTS INTRODUCTION... 3 CHARTER SCHOOL IMPACT BY STUDENTS YEARS OF ENROLLMENT AND AGE OF SCHOOL... 6 DISTRIBUTION OF CHARTER
SWITZERLAND COUNTY School Corporation Policy Anti-Bullying Policy
 SWITZERLAND COUNTY School Corporation Policy Anti-Bullying Policy SCSC POLICY 6.72 The following policy has been established by the school board of Switzerland County School Corporation regarding anti-bullying.
Position Statement. Corporal Punishment. NASP Position Statement: Corporal Punishment 1
 Position Statement Corporal Punishment The National Association of School Psychologists (NASP) opposes the use of corporal punishment in schools and supports ending its use in all schools. Further, NASP
Get Us To College Proven strategies for helping NYC students navigate the college process
 Get Us To College Proven strategies for helping NYC students navigate the college process A white paper researched by the Founded in 2004, the Urban Youth Collaborative (UYC) is a coalition of youth organizing
PREVENTION V. PUNISHMENT:
 PREVENTION V. PUNISHMENT: Threat Assessment, School Suspensions, and Racial Disparities JustChildren A Program of the Legal Aid Justice Center Dr. Dewey Cornell University of Virginia Curry School of Education
UNH Graduate Education Department. Quarterly Assessment Report
 First Quarter Assessment Report UNH Graduate Education Department Quarterly Assessment Report First Quarter i First Quarter Assessment Report Table of Contents Introduction... Section - Purpose of the
This year, for the first time, every state is required
 What New AYP Information Tells Us About Schools, States, and Public Education By Daria Hall, Ross Wiener, and Kevin Carey The Education Trust This year, for the first time, every state is required to identify
Crime Rates and Youth Incarceration in Texas and California Compared: Public Safety or Public Waste?
 CENTER ON JUVENILE AND CRIMINAL JUSTICE JUNE 2007 www.cjcj.org Crime Rates and Youth Incarceration in Texas and California Compared: Public Safety or Public Waste? By Mike Males PhD, Christina Stahlkopf
Reduce the high school dropout rate
 Reduce the high school dropout rate Because of the strong connection between high school completion and life success, it is critical for the Commonwealth to reduce the high school dropout rate. Recommendations
DATA COACHING WORKSHOP DAY 1 PRESENTED BY SARITA SIQUEIROS THORNBURG, JILL PATNODE & KRISSY SOLTMAN
 DATA COACHING WORKSHOP DAY 1 PRESENTED BY SARITA SIQUEIROS THORNBURG, JILL PATNODE & KRISSY SOLTMAN January 28, 2014 Success for Each Child and Eliminate the Opportunity Gap Welcome and Introductions Overview
NOT MEASURING UP: THE STATE OF SCHOOL DISCIPLINE IN MASSACHUSETTS
 NOT MEASURING UP: THE STATE OF SCHOOL DISCIPLINE IN MASSACHUSETTS ACKNOWLEDGEMENTS First and foremost, the Lawyers Committee wishes to thank those involved in the passage of Massachusetts new school discipline
WHEN MY CHILD IS DISCIPLINED AT SCHOOL
 I will not misbehave in class. I will not misbehave in class. I will not misbehave in class. I will not misbehave in class. I will not misbehave in class. I will not misbehave in class. I will not misbehave
Richard Wright PCS for Journalism and Media Arts
 24-5 Equity Report What is an Equity Report? Equity in education refers to all students receiving the same caliber of education regardless of their race, ethnicity, economic status, special education status
ADDRESSING THE OUT-OF-SCHOOL SUSPENSION CRISIS: A Policy Guide for School Board Members
 ADDRESSING THE OUT-OF-SCHOOL SUSPENSION CRISIS: APRIL 2013 www.otlcampaign.org www.stopsuspensions.org OPPORTUNITY ACTION Demanding equity & excellence in public education www.opportunityaction.org www.nsba.org
RESULTS FROM HIGH SCHOOL EXIT SURVEYS 5/6/2015 SYSTEM PLANNING AND PERFORMANCE PORTLAND PUBLIC SCHOOLS HIGHLIGHTS
 RESULTS FROM HIGH SCHOOL EXIT SURVEYS 5/6/2015 HIGHLIGHTS The majority of PPS high school seniors plan to graduate and to enroll in some type of higher education. Historically underserved racial groups
POLICIES AND PROCEDURES FOR ALTERNATIVE LEARNING PROGRAMS AND SCHOOLS GRADES K-12
 POLICIES AND PROCEDURES FOR ALTERNATIVE LEARNING PROGRAMS AND SCHOOLS GRADES K-12 Adopted September 2003 Updated August 2014 North Carolina Department of Public Instruction Safe & Healthy Schools Support
STUDENTS BP 5131.6 ALCOHOL AND OTHER DRUGS
 SECTION 5000 BOARD POLICY STUDENTS BP 5131.6 ALCOHOL AND OTHER DRUGS The Board of Trustees recognizes that the use of alcohol and other drugs adversely affects the students' ability to achieve academic
GUIDELINES FOR DEALING WITH DISRUPTIVE BEHAVIOR IN THE CLASSROOM
 GUIDELINES FOR DEALING WITH DISRUPTIVE BEHAVIOR IN THE CLASSROOM Tallahassee Community College Division of Student Affairs Department of Campus Life Student Judicial Affairs Office Student Union, Room
MODULE 1.3 WHAT IS MENTAL HEALTH?
 MODULE 1.3 WHAT IS MENTAL HEALTH? Why improve mental health in secondary school? The importance of mental health in all our lives Mental health is a positive and productive state of mind that allows an
The economic crisis has demonstrated how critical informed and effective decision-making is for
 April 2014 RESEARCH BRIEF: Financial Education and Account Access Among Elementary Students Prepared by Corporation for Enterprise Development (CFED) for U.S. Department Treasury Are classroom education
MORAL REMEDIATION, MULTI-SYSTEMIC THERAPY AND EFFECTIVE INTERVENTIONS FOR SERIOUS JUVENILE OFFENDERS.
 MORAL REMEDIATION, MULTI-SYSTEMIC THERAPY AND EFFECTIVE INTERVENTIONS FOR SERIOUS JUVENILE OFFENDERS. By Dr. David P. Sortino 1 ABSTRACT Our juvenile hall population is at an all time high, 2.2 million
Public Act No. 15-168
 Public Act No. 15-168 AN ACT CONCERNING COLLABORATION BETWEEN BOARDS OF EDUCATION AND SCHOOL RESOURCE OFFICERS AND THE COLLECTION AND REPORTING OF DATA ON SCHOOL-BASED ARRESTS. Be it enacted by the Senate
2014 Demographics PROFILE OF THE MILITARY COMMUNITY
 Demographics PROFILE OF THE MILITARY COMMUNITY ACKNOWLEDGEMENTS This report is published by the Office of the Deputy Assistant Secretary of Defense (Military Community and Family Policy), under contract
CHARTER SCHOOL PERFORMANCE IN PENNSYLVANIA. credo.stanford.edu
 CHARTER SCHOOL PERFORMANCE IN PENNSYLVANIA credo.stanford.edu April 2011 TABLE OF CONTENTS INTRODUCTION... 3 DISTRIBUTION OF CHARTER SCHOOL PERFORMANCE IN PENNSYLVANIA... 7 CHARTER SCHOOL IMPACT BY DELIVERY
Child Protection. UNICEF/Julie Pudlowski. for children unite for children
 Child Protection UNICEF/Julie Pudlowski for children unite for children UNICEF/Hiroki Gomi UNICEF/Hiroki Gomi Fast facts Sexual violence experienced in childhood 28% girls 13% boys Physical violence experienced
EDUCATION POST 2015 Parent Attitudes Survey
 EDUCATION POST 2015 Parent Attitudes Survey About the Survey The following analysis contains the results of the 2015 Parent Attitudes Survey, conducted on behalf of Education Post, via an online survey
Growing Fairness HOST A SCREENING! the SCREENING GUIDE
 the Growing Fairness HOST A SCREENING! Growing Fairness is a short documentary film about growing restorative justice in city schools. Often, passionate educators lead these cultural shifts in schools.
PBIS and the Responsive Classroom Approach
 PBIS and the Responsive Classroom Approach Positive Behavioral Interventions and Supports (PBIS), an evidence-based framework for developing positive behavior, is used in schools nationwide to create a
Data Housed at the North Carolina Education Research Data Center
 Data Housed at the North Carolina Education Research Data Center District-level data Community Index Data, Year 2004 Each file has one record per Local Education Agency with the percent of students (a)
Research on School Suspension
 Research on School Suspension Anne-Marie Iselin This document was prepared in conjunction with the 2010 NC Family Impact Seminar, School Suspension: Research and Policy Options, held April 27, 2010, at
Allen Elementary School
 Allen Elementary School April 4, 216 Dear Parents and Community Members: We are pleased to present you with the (AER), which provides key information on the 214-15 educational progress for the. The AER
STRATEGIC SCHOOL PROFILE 2010-11. Middle and Junior High School Edition. Great Oak School. Oxford School District
 108-51 STRATEGIC SCHOOL PROFILE 2010-11 Middle and Junior High School Edition Great Oak School Oxford School District BRIAN P. MURPHY, Principal Telephone: (203) 888-5418 Website: www.oxfordpublicschools.org/greatoak/index.htm
Connecting America s Youth to Nature
 Connecting America s Youth to Nature Funders: The Nature Conservancy, Toyota USA Foundation & Foundation for Youth Investment Polling Teams: Fairbank, Maslin, Maullin, Metz & Associates and Public Opinion
Delray Beach CSAP - Kindergarten Readiness
 Delray Beach CSAP - Kindergarten Readiness Assurance #1 School Readiness has improved over the past four (4) years and stands at 78% in 2011 with 75% of our students attending a State Voluntary Pre-Kindergarten
Overall, 67.8% of the 404,638 state
 U.S. Department of Justice Office of Justice Programs Bureau of Justice Statistics Special Report April 2014 ncj 244205 Recidivism of Prisoners Released in 30 States in 2005: Patterns from 2005 to 2010
THE EDUCATIONAL PROGRESS OF BLACK STUDENTS
 NATIONAL CENTER FOR EDUCATION STATISTICS Findings from THE CONDITION OF EDUCATION 1994 NO. 2 THE EDUCATIONAL PROGRESS OF BLACK STUDENTS U.S. Department of Education Office of Educational Research and Improvement