Census Data with Tableau Public
|
|
|
- Paula Ilene Daniel
- 7 years ago
- Views:
Transcription
1 Census Data with Tableau Public Before you begin, download the template at Get your data together 1. Gather your data. You ll need: a and 2000 census data for place (with population > 2000) b. Annexation data by place, from a state agency c. Lat/ long of the census district 2. Make sure your data is in the right format a. Your workbook should have two sheets: one with the data, the second with lat/long b. For each sheet, header row is row 1. It doesn t matter if you have all of the same columns, but you at least need city, latitude and longitude, and a few fields of Census data. c. No blank rows or columns 3. Connect to the census data and bring it into Tableau: a. Open Tableau Public and Click Open Data. b. Choose Excel & find your file c. Select Single Table and find the sheet with your data d. Select My data has a header row and click OK e. You know you ve done it right when all your fields show up in the Data Window on the left hand side of Tableau. f. Make sure your latitude and longitude fields are correctly geocoded. (They must be numbers to do this.) To make sure your latitude field is geocoded: i. Right click on field in the data window Change data type to Number ii. Right click on the field again Geographic role = Latitude iii. Repeat for Longitude


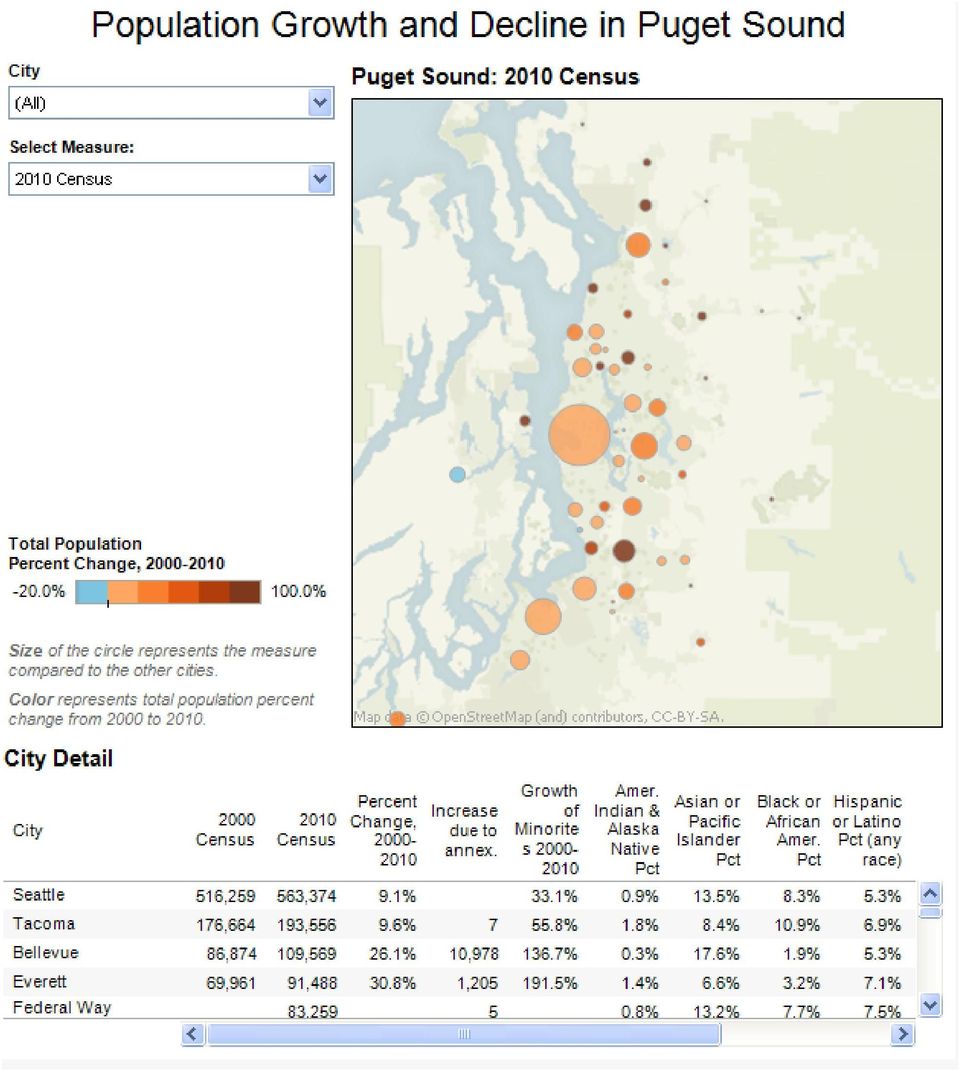
2 Create map view for Major metro area. o In the Data Window, ctrl-click on latitude, longitude and city and click Show Me o Drag the 2010 census population from the Data Window to the Size Shelf o Right-click on the point in the middle of the ocean and choose Exclude. This point has no lat/ long data and you need to either add it to the spreadsheet or exclude it. o Create a calculated field on % change from last census to this Right-click on 2010 Census Create Calculated Field Enter this formula. The formula language is similar to SQL or Excel. When you are done, the %Change field should show up in the Data Window. o Decide whether you will show absolute change or % change on color. Here we show % change. Drag % Change from the Data Window to the Color Shelf: o Format the colors. On the color legend, click Edit Colors and select Advanced button. Choose orange-blue diverging color scheme Center at the 0 Set min to near your min value and max to (in this case 100%) after inspecting your data so that there is a good color range in the middle of your data. On the Color Shelf, add a grey border and 80% transparency. This will help your marks show up better when they overlap. o Drag % Change from the Data Window to the Label shelf. Open the label drop-down and select Selected. This means the label will show up only when the mark is selected.


3 o Rename this sheet Metro. o Click the Zoom icon on the toolbar and select the area in your major metro. Your sheet should look like this:


4 Create detail view o Create a new sheet. o Add Measure Names to Columns City to Rows Measures Values to the Text Shelf o You should have a text chart. Remove from the Measure Value shelf any values you don t want and reorder them as you wish. o All your percentages will show up as 0. Click each in the Data Window Field Properties Format Text and choose Percentage. o Rename this sheet Detail. o It should look like this:


5 Create the dashboard 1. Create a new dashboard 2. Size it to your page size: click : Edit in the size section in the lower-left of the dashboard. This will help you avoid scrollbars and make sure the viz looks good in your page. 3. Add the map and detail views by dragging them onto the dashboard, or just double-clicking them 4. Arrange and lay out the views by dragging them 5. Change and edit titles by right-clicking on the title and choosing Edit 6. Add any explanatory text by selecting Text from objects and dragging onto the screen 7. Add a Quick Filter on City a. Click on the top right corner of any view > Quick Filters City b. Make it a compact list c. Make it global 8. Add a highlight action: highlight on the toolbar, select City 9. Edit your tooltips for each view. a. Select the sheet b. On the main menu, select Edit Tooltips. c. Repeat for the other sheet


6 Test the interaction 1. Click around and see how it works 2. Fix the size legend so that cities keep their sizes as you change from one to another Your dashboard should look like this: Then take it to your graphics dept. discuss the colors, layout and information presentation with them.

7 Save to the web & publish 1. Save to the web a. Main menu: File Tableau Public Save to web b. Follow the prompts c. Do not select show sheets as tabs. 2. Publish a. Click Share in the lower left b. Copy the embed code and paste into your web page Ambitious step On your map view: 1. Drag Measure names to filter a. Show Quick filter make it a compact list b. Customize the filter don t allow all 2. Drag Measure values to label and to size shelves Now your users can select which measure is shown on the map. On the dashboard, - Remove your size legend - Make sure the measure names quick filter is showing. Your dashboard will look like this:


8
NICAR Hands-On: Census Data with Tableau Public
 NICAR Hands-On: Census Data with Tableau Public Get your data together 1. Gather your data. You ll need: a. 2010 and 2000 census data for place (with population > 2000) b. Annexation data by place, from
DATA VISUALIZATION WITH TABLEAU PUBLIC. (Data for this tutorial at www.peteraldhous.com/data)
") DATA VISUALIZATION WITH TABLEAU PUBLIC (Data for this tutorial at www.peteraldhous.com/data) Tableau Public allows you to create a wide variety of interactive graphs, maps and tables and organize them
DATA VISUALIZATION WITH TABLEAU PUBLIC (Data for this tutorial at www.peteraldhous.com/data) Tableau Public allows you to create a wide variety of interactive graphs, maps and tables and organize them
Creating a Tableau Data Visualization on Cincinnati Crime By Jeffrey A. Shaffer
 Creating a Tableau Data Visualization on Cincinnati Crime By Jeffrey A. Shaffer Step 1 Gather and Compile the Data: This data was compiled using weekly files provided by the Cincinnati Police. Each file
Basic Pivot Tables. To begin your pivot table, choose Data, Pivot Table and Pivot Chart Report. 1 of 18
 Basic Pivot Tables Pivot tables summarize data in a quick and easy way. In your job, you could use pivot tables to summarize actual expenses by fund type by object or total amounts. Make sure you do not
Produced by Flinders University Centre for Educational ICT. PivotTables Excel 2010
 Produced by Flinders University Centre for Educational ICT PivotTables Excel 2010 CONTENTS Layout... 1 The Ribbon Bar... 2 Minimising the Ribbon Bar... 2 The File Tab... 3 What the Commands and Buttons
Building Better Dashboards PART 1: BASIC DASHBOARDS
 Building Better Dashboards PART 1: BASIC DASHBOARDS For Questions or Feedback Alexandria Skrivanich or Michael Carpenter askrivanich@tableausoftware.com mcarpenter@tableausoftware.com 1 CREATING & LABELING
How To Create A Powerpoint Intelligence Report In A Pivot Table In A Powerpoints.Com
 Sage 500 ERP Intelligence Reporting Getting Started Guide 27.11.2012 Table of Contents 1.0 Getting started 3 2.0 Managing your reports 10 3.0 Defining report properties 18 4.0 Creating a simple PivotTable
Monthly Payroll to Finance Reconciliation Report: Access and Instructions
 Monthly Payroll to Finance Reconciliation Report: Access and Instructions VCU Reporting Center... 2 Log in... 2 Open Folder... 3 Other Useful Information: Copying Sheets... 5 Creating Subtotals... 5 Outlining
Converting Dimensions to Measures & Changing Data Types
 1 Converting Dimensions to Measures & Changing Data Types When connecting to a data source, Tableau takes a best guess at the type of data contained in each column of your database. Tableau will assign
Search help. More on Office.com: images templates. Here are some basic tasks that you can do in Microsoft Excel 2010.
 Page 1 of 8 Excel 2010 Home > Excel 2010 Help and How-to > Getting started with Excel Search help More on Office.com: images templates Basic tasks in Excel 2010 Here are some basic tasks that you can do
Completing Baseline s Site Survey Request Form
 Completing Baseline s Site Survey Request Form The first step in successfully implementing a radio network for your irrigation controllers is to identify the proposed locations for each radio. These radios
Getting Started Guide
 Getting Started Guide Introduction... 3 What is Pastel Partner (BIC)?... 3 System Requirements... 4 Getting Started Guide... 6 Standard Reports Available... 6 Accessing the Pastel Partner (BIC) Reports...
Computer Training Centre University College Cork. Excel 2013 Pivot Tables
 Computer Training Centre University College Cork Excel 2013 Pivot Tables Table of Contents Pivot Tables... 1 Changing the Value Field Settings... 2 Refreshing the Data... 3 Refresh Data when opening a
Excel 2007 Basic knowledge
 Ribbon menu The Ribbon menu system with tabs for various Excel commands. This Ribbon system replaces the traditional menus used with Excel 2003. Above the Ribbon in the upper-left corner is the Microsoft
TIBCO Spotfire Business Author Essentials Quick Reference Guide. Table of contents:
 Table of contents: Access Data for Analysis Data file types Format assumptions Data from Excel Information links Add multiple data tables Create & Interpret Visualizations Table Pie Chart Cross Table Treemap
Working together with Word, Excel and PowerPoint
 Working together with Word, Excel and PowerPoint Have you ever wanted your Word document to include data from an Excel spreadsheet, or diagrams you ve created in PowerPoint? This note shows you how to
Creating a Website with Google Sites
 Creating a Website with Google Sites This document provides instructions for creating and publishing a website with Google Sites. At no charge, Google Sites allows you to create a website for various uses,
How to make a line graph using Excel 2007
 How to make a line graph using Excel 2007 Format your data sheet Make sure you have a title and each column of data has a title. If you are entering data by hand, use time or the independent variable in
To launch the Microsoft Excel program, locate the Microsoft Excel icon, and double click.
 EDIT202 Spreadsheet Lab Assignment Guidelines Getting Started 1. For this lab you will modify a sample spreadsheet file named Starter- Spreadsheet.xls which is available for download from the Spreadsheet
Pastel Evolution BIC. Getting Started Guide
 Pastel Evolution BIC Getting Started Guide Table of Contents System Requirements... 4 How it Works... 5 Getting Started Guide... 6 Standard Reports Available... 6 Accessing the Pastel Evolution (BIC) Reports...
Working with Excel in Origin
 Working with Excel in Origin Limitations When Working with Excel in Origin To plot your workbook data in Origin, you must have Excel version 7 (Microsoft Office 95) or later installed on your computer
Cal Answers Analysis Training Part III. Advanced OBIEE - Dashboard Reports
 Cal Answers Analysis Training Part III Advanced OBIEE - Dashboard Reports University of California, Berkeley March 2012 Table of Contents Table of Contents... 1 Overview... 2 Remember How to Create a Query?...
To reuse a template that you ve recently used, click Recent Templates, click the template that you want, and then click Create.
 What is Excel? Applies to: Excel 2010 Excel is a spreadsheet program in the Microsoft Office system. You can use Excel to create and format workbooks (a collection of spreadsheets) in order to analyze
Excel 2003: Ringtones Task
 Excel 2003: Ringtones Task 1. Open up a blank spreadsheet 2. Save the spreadsheet to your area and call it Ringtones.xls 3. Add the data as shown here, making sure you keep to the cells as shown Make sure
Migrating to Excel 2010 from Excel 2003 - Excel - Microsoft Office 1 of 1
 Migrating to Excel 2010 - Excel - Microsoft Office 1 of 1 In This Guide Microsoft Excel 2010 looks very different, so we created this guide to help you minimize the learning curve. Read on to learn key
Using FileMaker Pro with Microsoft Office
 Hands-on Guide Using FileMaker Pro with Microsoft Office Making FileMaker Pro Your Office Companion page 1 Table of Contents Introduction... 3 Before You Get Started... 4 Sharing Data between FileMaker
Microsoft Excel 2013 Tutorial
 Microsoft Excel 2013 Tutorial TABLE OF CONTENTS 1. Getting Started Pg. 3 2. Creating A New Document Pg. 3 3. Saving Your Document Pg. 4 4. Toolbars Pg. 4 5. Formatting Pg. 6 Working With Cells Pg. 6 Changing
Business Objects 4.1 Quick User Guide
 Business Objects 4.1 Quick User Guide Log into SCEIS Business Objects (BOBJ) 1. https://sceisreporting.sc.gov 2. Choose Windows AD for Authentication. 3. Enter your SCEIS User Name and Password: Home Screen
Using Microsoft Excel to Plot and Analyze Kinetic Data
 Entering and Formatting Data Using Microsoft Excel to Plot and Analyze Kinetic Data Open Excel. Set up the spreadsheet page (Sheet 1) so that anyone who reads it will understand the page (Figure 1). Type
Excel Project Creating a Stock Portfolio Simulation
 Background Vocabulary Excel Project Creating a Stock Portfolio Simulation 1. What is a stock? A stock is a share in the ownership of a corporation, a large business organization. A stock, also, represents
I. Create the base view with the data you want to measure
 Developing Key Performance Indicators (KPIs) in Tableau The following tutorial will show you how to create KPIs in Tableau 9. To get started, you will need the following: Tableau version 9 Data: Sample
Excel 2003 Tutorial I
 This tutorial was adapted from a tutorial by see its complete version at http://www.fgcu.edu/support/office2000/excel/index.html Excel 2003 Tutorial I Spreadsheet Basics Screen Layout Title bar Menu bar
Creating and Formatting Charts in Microsoft Excel
 Creating and Formatting Charts in Microsoft Excel This document provides instructions for creating and formatting charts in Microsoft Excel, which makes creating professional-looking charts easy. The chart
MS Excel Template Building and Mapping for Neat 5
 MS Excel Template Building and Mapping for Neat 5 Neat 5 provides the opportunity to export data directly from the Neat 5 program to an Excel template, entering in column information using receipts saved
Excel 2010: Create your first spreadsheet
 Excel 2010: Create your first spreadsheet Goals: After completing this course you will be able to: Create a new spreadsheet. Add, subtract, multiply, and divide in a spreadsheet. Enter and format column
Excel Dashboard. Scott Witteveen support@manersolutions.com (517) 323 7500
 323 7500") Excel Dashboard with Dynamics GP Excel Reports Scott Witteveen support@manersolutions.com (517) 323 7500 Creating an Excel Dashboard with Dynamics GP Excel Reports Step 1 Set up a new workbook Open Excel,
Excel Dashboard with Dynamics GP Excel Reports Scott Witteveen support@manersolutions.com (517) 323 7500 Creating an Excel Dashboard with Dynamics GP Excel Reports Step 1 Set up a new workbook Open Excel,
Lesson 3 - Processing a Multi-Layer Yield History. Exercise 3-4
 Lesson 3 - Processing a Multi-Layer Yield History Exercise 3-4 Objective: Develop yield-based management zones. 1. File-Open Project_3-3.map. 2. Double click the Average Yield surface component in the
Analyzing Excel Data Using Pivot Tables
 NDUS Training and Documentation Analyzing Excel Data Using Pivot Tables Pivot Tables are interactive worksheet tables you can use to quickly and easily summarize, organize, analyze, and compare large amounts
WHAT S NEW IN OBIEE 11.1.1.7
 Enterprise Data Management OBI Author Training, March 2015 WHAT S NEW IN OBIEE 11.1.1.7 NEW PRESENTATION FEATURES VIEWS 1) Recommended Visualizations Feature When you create a new view, OBIEE looks at
Creating an Excel Spreadsheet for Mail Merge. Excel Spreadsheet Mail Merge. 1 of 9 Design & Print Offline: Mail Merge
 Creating an Excel Spreadsheet for Mail Merge Excel Spreadsheet Mail Merge 1 of 9 Creating an Excel Database for a Mail Merge 1. To create a database for a mail merge you will first need to open Microsoft
Excel Unit 4. Data files needed to complete these exercises will be found on the S: drive>410>student>computer Technology>Excel>Unit 4
 Excel Unit 4 Data files needed to complete these exercises will be found on the S: drive>410>student>computer Technology>Excel>Unit 4 Step by Step 4.1 Creating and Positioning Charts GET READY. Before
A database is a collection of data organised in a manner that allows access, retrieval, and use of that data.
 Microsoft Access A database is a collection of data organised in a manner that allows access, retrieval, and use of that data. A Database Management System (DBMS) allows users to create a database; add,
Market Pricing Override
 Market Pricing Override MARKET PRICING OVERRIDE Market Pricing: Copy Override Market price overrides can be copied from one match year to another Market Price Override can be accessed from the Job Matches
Microsoft Access 2010 handout
 Microsoft Access 2010 handout Access 2010 is a relational database program you can use to create and manage large quantities of data. You can use Access to manage anything from a home inventory to a giant
Advanced Microsoft Excel 2010
 Advanced Microsoft Excel 2010 Table of Contents THE PASTE SPECIAL FUNCTION... 2 Paste Special Options... 2 Using the Paste Special Function... 3 ORGANIZING DATA... 4 Multiple-Level Sorting... 4 Subtotaling
EXCEL FINANCIAL USES
 EXCEL FINANCIAL USES Table of Contents Page LESSON 1: FINANCIAL DOCUMENTS...1 Worksheet Design...1 Selecting a Template...2 Adding Data to a Template...3 Modifying Templates...3 Saving a New Workbook as
Microsoft Excel 2010 Part 3: Advanced Excel
 CALIFORNIA STATE UNIVERSITY, LOS ANGELES INFORMATION TECHNOLOGY SERVICES Microsoft Excel 2010 Part 3: Advanced Excel Winter 2015, Version 1.0 Table of Contents Introduction...2 Sorting Data...2 Sorting
Importing TSM Data into Microsoft Excel using Microsoft Query
 Importing TSM Data into Microsoft Excel using Microsoft Query An alternate way to report on TSM information is to use Microsoft Excel s import facilities using Microsoft Query to selectively import the
Mail Merge Creating Mailing Labels 3/23/2011
 Creating Mailing Labels in Microsoft Word Address data in a Microsoft Excel file can be turned into mailing labels in Microsoft Word through a mail merge process. First, obtain or create an Excel spreadsheet
Lab 11: Budgeting with Excel
 Lab 11: Budgeting with Excel This lab exercise will have you track credit card bills over a period of three months. You will determine those months in which a budget was met for various categories. You
MAIL MERGE MADE EASY A STEP-BY-STEP GUIDE FOR LABELS OR EMAIL MERGES
 MAIL MERGE MADE EASY A STEP-BY-STEP GUIDE FOR LABELS OR EMAIL MERGES WHY MAIL MERGE? Labels: Mail merge in Office lets you convert your contact list data into a sheet of mailing labels, with complete control
In this example, Mrs. Smith is looking to create graphs that represent the ethnic diversity of the 24 students in her 4 th grade class.
 Creating a Pie Graph Step-by-step directions In this example, Mrs. Smith is looking to create graphs that represent the ethnic diversity of the 24 students in her 4 th grade class. 1. Enter Data A. Open
MicroStrategy Desktop
 MicroStrategy Desktop Quick Start Guide MicroStrategy Desktop is designed to enable business professionals like you to explore data, simply and without needing direct support from IT. 1 Import data from
Task Force on Technology / EXCEL
 Task Force on Technology EXCEL Basic terminology Spreadsheet A spreadsheet is an electronic document that stores various types of data. There are vertical columns and horizontal rows. A cell is where the
ORACLE BUSINESS INTELLIGENCE WORKSHOP
 ORACLE BUSINESS INTELLIGENCE WORKSHOP Creating Interactive Dashboards and Using Oracle Business Intelligence Answers Purpose This tutorial shows you how to build, format, and customize Oracle Business
Excel 2007 - Using Pivot Tables
 Overview A PivotTable report is an interactive table that allows you to quickly group and summarise information from a data source. You can rearrange (or pivot) the table to display different perspectives
How Do I Upload Multiple Trucks?
 How Do I Upload Multiple Trucks? 1. Log into account. Please see the How Do I Log into My Account? document (DOC-0125) for additional assistance with logging into PrePass.com. 2. On the Admin Home tab,
Microsoft Access Rollup Procedure for Microsoft Office 2007. 2. Click on Blank Database and name it something appropriate.
 Microsoft Access Rollup Procedure for Microsoft Office 2007 Note: You will need tax form information in an existing Excel spreadsheet prior to beginning this tutorial. 1. Start Microsoft access 2007. 2.
Getting Started Guide SAGE ACCPAC INTELLIGENCE
 Getting Started Guide SAGE ACCPAC INTELLIGENCE Table of Contents Introduction... 1 What is Sage Accpac Intelligence?... 1 What are the benefits of using Sage Accpac Intelligence?... 1 System Requirements...
SQL Server 2005: Report Builder
 SQL Server 2005: Report Builder Table of Contents SQL Server 2005: Report Builder...3 Lab Setup...4 Exercise 1 Report Model Projects...5 Exercise 2 Create a Report using Report Builder...9 SQL Server 2005:
MS Excel. Handout: Level 2. elearning Department. Copyright 2016 CMS e-learning Department. All Rights Reserved. Page 1 of 11
 MS Excel Handout: Level 2 elearning Department 2016 Page 1 of 11 Contents Excel Environment:... 3 To create a new blank workbook:...3 To insert text:...4 Cell addresses:...4 To save the workbook:... 5
Google Sites: Creating, editing, and sharing a site
 Google Sites: Creating, editing, and sharing a site Google Sites is an application that makes building a website for your organization as easy as editing a document. With Google Sites, teams can quickly
Visualization with Excel Tools and Microsoft Azure
 Visualization with Excel Tools and Microsoft Azure Introduction Power Query and Power Map are add-ins that are available as free downloads from Microsoft to enhance the data access and data visualization
Create an Excel BI report and share on SharePoint 2013
 2013 Create an Excel BI report and share on SharePoint 2013 Hands-On Lab Lab Manual This document is provided as-is. Information and views expressed in this document, including URL and other Internet Web
Introduction... 1 Welcome Screen... 2 Map View... 3. Generating a map... 3. Map View... 4. Basic Map Features... 4
 Quick Start Guide Contents Introduction... 1 Welcome Screen... 2 Map View... 3 Generating a map... 3 Map View... 4 Basic Map Features... 4 Adding a Secondary Indicator... 5 Adding a Secondary Indicator...
INTERMEDIATE Excel 2013
 INTERMEDIATE Excel 2013 Information Technology September 1, 2014 1 P a g e Managing Workbooks Excel uses the term workbook for a file. The term worksheet refers to an individual spreadsheet within a workbook.
Scientific Graphing in Excel 2010
 Scientific Graphing in Excel 2010 When you start Excel, you will see the screen below. Various parts of the display are labelled in red, with arrows, to define the terms used in the remainder of this overview.
Getting Started with Access 2007
 Getting Started with Access 2007 1 A database is an organized collection of information about a subject. Examples of databases include an address book, the telephone book, or a filing cabinet full of documents
Creating and Using Forms in SharePoint
 Creating and Using Forms in SharePoint Getting started with custom lists... 1 Creating a custom list... 1 Creating a user-friendly list name... 1 Other options for creating custom lists... 2 Building a
ArcGIS Tutorial: Adding Attribute Data
 ArcGIS Tutorial: Adding Attribute Data Introduction A common need in GIS is to map characteristics, or attributes, of different geographic areas. These maps are called thematic maps. Examples of thematic
Advanced Presentation Features and Animation
 There are three features that you should remember as you work within PowerPoint 2007: the Microsoft Office Button, the Quick Access Toolbar, and the Ribbon. The function of these features will be more
Creating an Excel Database for a Mail Merge on a PC. Excel Spreadsheet Mail Merge. 0 of 8 Mail merge (PC)
") Creating an Excel Database for a Mail Merge on a PC Excel Spreadsheet Mail Merge 0 of 8 Creating an Excel Database for a Mail Merge on a PC 1. To create a database for a mail merge you will first need
Creating an Excel Database for a Mail Merge on a PC Excel Spreadsheet Mail Merge 0 of 8 Creating an Excel Database for a Mail Merge on a PC 1. To create a database for a mail merge you will first need
Getting Started with Crystal Reports Session Description:
 Session Description: If you would like to create customized reports look no further. This session will introduce you to the tools needed to write basic reports using the Report Wizard and Blank Report
Catalog Creator by On-site Custom Software
 Catalog Creator by On-site Custom Software Thank you for purchasing or evaluating this software. If you are only evaluating Catalog Creator, the Free Trial you downloaded is fully-functional and all the
Basic Microsoft Excel 2007
 Basic Microsoft Excel 2007 The biggest difference between Excel 2007 and its predecessors is the new layout. All of the old functions are still there (with some new additions), but they are now located
Pivot Tables & Pivot Charts
 Pivot Tables & Pivot Charts Pivot tables... 2 Creating pivot table using the wizard...2 The pivot table toolbar...5 Analysing data in a pivot table...5 Pivot Charts... 6 Creating a pivot chart using the
A Beginning Guide to the Excel 2007 Pivot Table
 A Beginning Guide to the Excel 2007 Pivot Table Paula Ecklund Summer 2008 Page 1 Contents I. What is a Pivot Table?...1 II. Basic Excel 2007 Pivot Table Creation Source data requirements...2 Pivot Table
Learn About Analysis, Interactive Reports, and Dashboards
 Learn About Analysis, Interactive Reports, and Dashboards This document supports Pentaho Business Analytics Suite 5.0 GA and Pentaho Data Integration 5.0 GA, documentation revision February 3, 2014, copyright
Quick and Easy Web Maps with Google Fusion Tables. SCO Technical Paper
 Quick and Easy Web Maps with Google Fusion Tables SCO Technical Paper Version History Version Date Notes Author/Contact 1.0 July, 2011 Initial document created. Howard Veregin 1.1 Dec., 2011 Updated to
SPSS INSTRUCTION CHAPTER 1
 SPSS INSTRUCTION CHAPTER 1 Performing the data manipulations described in Section 1.4 of the chapter require minimal computations, easily handled with a pencil, sheet of paper, and a calculator. However,
Microsoft Excel 2007 Consolidate Data & Analyze with Pivot Table Windows XP
 Microsoft Excel 2007 Consolidate Data & Analyze with Pivot Table Windows XP Consolidate Data in Multiple Worksheets Example data is saved under Consolidation.xlsx workbook under ProductA through ProductD
Getting Started With Mortgage MarketSmart
 Getting Started With Mortgage MarketSmart We are excited that you are using Mortgage MarketSmart and hope that you will enjoy being one of its first users. This Getting Started guide is a work in progress,
a. First Drag Position from Measures to Dimensions b. Drag Position into Rows c. Drag Candidate into Columns
 Text Analytics using Tableau The following tutorial will show you how to perform text analysis in Tableau 8.2. To get started, you will need the following: Tableau version 8.2 Data: Political Speeches.xlsx
2. Building Cross-Tabs in Your Reports Create a Cross-Tab Create a Specified Group Order Filter Cross-Tab by Group Keep Groups Together
 Crystal Reports Level 2 Computer Training Solutions Course Outline 1. Creating Running Totals Create a Running Total Field Modify a Running Total Field Create a Manual Running Total on Either Detail Data
Microsoft Excel 2007 Level 2
 Information Technology Services Kennesaw State University Microsoft Excel 2007 Level 2 Copyright 2008 KSU Dept. of Information Technology Services This document may be downloaded, printed or copied for
Acrobat PDF Forms - Part 2
 Acrobat PDF Forms - Part 2 PDF Form Fields In this lesson, you will be given a file named Information Request Form that can be used in either Word 2003 or Word 2007. This lesson will guide you through
Getting Started with Excel 2008. Table of Contents
 Table of Contents Elements of An Excel Document... 2 Resizing and Hiding Columns and Rows... 3 Using Panes to Create Spreadsheet Headers... 3 Using the AutoFill Command... 4 Using AutoFill for Sequences...
Decreases the magnification of your chart. Changes the magnification of the displayed chart.
 OrgPlus Guide 1) Logging In 2) Icon Key 3) Views a. Org Chart b. Salary Org Chart c. Head Count/Span of Control 4) Viewing Profile/Explore/Bookmarks Panels a. Creating Bookmarks 5) Searching a. From the
Avery Wizard: Using the wizard with Microsoft Word. This is a simple step-by-step guide showing how to use the Avery wizard in word
 Avery Wizard: Using the wizard with Microsoft Word This is a simple step-by-step guide showing how to use the Avery wizard in word Open up a blank document in Microsoft Word and click the Avery Tab at
Introduction to Microsoft Excel 2007/2010
 to Microsoft Excel 2007/2010 Abstract: Microsoft Excel is one of the most powerful and widely used spreadsheet applications available today. Excel's functionality and popularity have made it an essential
Click on various options: Publications by Wizard Publications by Design Blank Publication
 Click on various options: Publications by Wizard Publications by Design Blank Publication Select the Blank Publications Tab: Choose a blank full page Click on Create New Page Insert > Page Select the number
Introduction to Microsoft Excel 2010
 Introduction to Microsoft Excel 2010 Screen Elements Quick Access Toolbar The Ribbon Formula Bar Expand Formula Bar Button File Menu Vertical Scroll Worksheet Navigation Tabs Horizontal Scroll Bar Zoom
Step Sheet: Creating a Data Table and Charts
 Step Sheet: Creating a Data Table and Charts Using Microsoft Excel Spreadsheets with Data This step sheet will help you build a data table and convert the data into histograms and circle graphs for your
Excel 2013 - Using Pivot Tables
 Overview A PivotTable report is an interactive table that allows you to quickly group and summarise information from a data source. You can rearrange (or pivot) the table to display different perspectives
Excel 2007: Basics Learning Guide
 Excel 2007: Basics Learning Guide Exploring Excel At first glance, the new Excel 2007 interface may seem a bit unsettling, with fat bands called Ribbons replacing cascading text menus and task bars. This
Chapter 4 Displaying and Describing Categorical Data
 Chapter 4 Displaying and Describing Categorical Data Chapter Goals Learning Objectives This chapter presents three basic techniques for summarizing categorical data. After completing this chapter you should
BID2WIN Workshop. Advanced Report Writing
 BID2WIN Workshop Advanced Report Writing Please Note: Please feel free to take this workbook home with you! Electronic copies of all lab documentation are available for download at http://www.bid2win.com/userconf/2011/labs/
Excel Pivot Tables. Blue Pecan Computer Training Ltd - Onsite Training Provider www.bluepecantraining.com :: 0800 6124105 :: info@bluepecan.co.
 Excel Pivot Tables 1 Table of Contents Pivot Tables... 3 Preparing Data for a Pivot Table... 3 Creating a Dynamic Range for a Pivot Table... 3 Creating a Pivot Table... 4 Removing a Field... 5 Change the
Online Quotes Our 6 Top Tips
 Online Quotes Our 6 Top Tips While we hope you ll find our online quotes system simple and easy to use, to help you along the way, we ve gathered the 6 most common queries users have, with the answers!
Advanced Excel 10/20/2011 1
 Advanced Excel Data Validation Excel has a feature called Data Validation, which will allow you to control what kind of information is typed into cells. 1. Select the cell(s) you wish to control. 2. Click