Design of a Supplier Performance Measurement & Evaluation System for DSM s Petrochemical & Energy Group
|
|
|
- Julian Sanders
- 8 years ago
- Views:
Transcription
1 2012 Design of a Supplier Performance Measurement & Evaluation System for DSM s Petrochemical & Energy Group Acc. to.s University of Twente Industrial Engineering and Management 2/27/2012

2 Measurement is the first step that leads to control and eventually to improvement. If you can t measure something, you can t understand it. If you can t understand it, you can t control it. If you can t control it, you can t improve it H. James Harrington Design of a Supplier Performance Measurement & Evaluation System for DSM s Petrochemical & Energy Group Twente University Faculty of Technology and Management Industrial Engineering & Management Author T.A. Beijer s Tutor University Dr. Ir. F. Schotanus Prof. Dr. J. Telgen Tutor DSM L. van de Walle Category Manager Leiden, February 2012 II

3 PREFACE This report is the result of my graduation project for the study Industrial Engineering & Management that was conducted at the DSM Sourcing department Petrochemical & Energy in Sittard in the Netherlands. This report is written for DSM s corporate management and for DSM s Sourcing department. The environment in which my research was conducted was quite turbulent. My research began in October 2008 at the start of the world economical crises, which brought along many problems for my research. Within three months, my tutor and his successor left the department. This left me with a passive tutor only reachable by , which delayed my research progress quite a lot. Also, my initial objective was to only develop a Supplier Performance Measurement & Evaluation System for DSM s Petrochemical & Energy group as agreed upon from the start of my research. DSM management however requested me to also include the development of a SAP environment in which the new Supplier Performance Measurement & Evaluation System can operate. This additional objective required a broader research study and resulted in the development of a new IT-system network between business groups. Because I now had to research two research subjects, my research scope became unintended quite large. Despite all initial difficulties and the expanded research scope, the research itself proofed to be very interesting. My research would not have been possible without the help of others. I want to thank Dr. Ir. F. Schotanus and Prof. Dr. J. Telgen for their support during this difficult period. Also, I want to thank my family and friends for their support. Finally, I want to thank DSM for the opportunity to execute my graduation project and in particular my colleagues at the sourcing department. They were always willing to answer my questions and help me find the right information. I want to thank them for the interest in my research. Thank you! Leiden, February 2012 Tim Beijer III

4 EXECUTIVE SUMMARY Research problem definition and research question For DSM s Sourcing Petrochemicals & Energy department, there are only a limited number of suppliers big and capable enough to supply DSM. Therefore, DSM s current sourcing strategy is focused on the development of long term strategic relationships with so called strategic suppliers. DSM s main objective is to achieve a continuous improvement of DSM s supplier business processes, reduce DSM s cost and develop and maintain a higher degree of Sustainability" and Innovation. Sustainability and Innovation are part of DSM s core values and are increasingly part of DSM s key business growth drivers. DSM s willingness to develop a long term commitment with suppliers can be acknowledged by the fact that DSM is willing to share in-house information, train suppliers and share financial benefits with strategic suppliers. To support this strategy, DSM is using performance measurement as a quality improvement mechanism to measure the progress of suppliers over time and to use this information to develop shortterm and long-term goals and objectives. The main research focus of this thesis is related to the use of performance measurement by DSM s Petrochemical and Energy group which comprises six business groups. The main research problem of this thesis is related to the gathering, analysis and interpretation of gathered performance data from the six business groups. Currently, each business group has its own Supplier Performance Measurement & Evaluation System in place, which includes business group specific critical success factors and key performance indicators. Also, the data analysis performed by the business groups differs. Some business groups use traditional methods such as supplier rating with the use of scorecards or Microsoft Excel, while other business groups use a more modern approach that includes the use of advanced SAP supplier measurement & evaluation modules. The use of SAP is less time consuming and enables the user to generate a complete supplier evaluation report. This is one of the reasons DSM management prefers SAP over the traditional methods that are still in use. Therefore, the second objective of this research is to develop a SAP environment in which the new Supplier Performance Measurement & Evaluation System can operate. Currently, DSM is not satisfied by the way performance data is gathered, analysed and processed. DSM prefers one standardised Supplier Performance Measurement & Evaluation System for all business groups, that includes an alignment of critical success factors and key performance indicators and allows an easier and faster supplier performance evaluation. This is required to support DSM s current sourcing objective that includes the continuous improvement of supplier capabilities. IV

5 Therefore, the research question of this thesis can be formulated as follows: How should a standardized Supplier Performance Measurement & Evaluation System for DSM be set up and implemented, in order to enable continuous monitoring, evaluation, and improvement of supplier performance, with the use of SAP? The question was studied using a literature study, an internal analysis, and an external analysis. Research findings A literature study revealed that there are many different opinions about the design of a good performance measurement system. Authors differ among other things in the use of individual performance measures and their connection with other measures within the system or with the environment. There is consensus however, about one subject in literature, i.e. a company has the opportunity to create competitive advantage, when it can measure itself at different levels against a corporate direction (mission and vision). An important outcome of the literature review is that performance measurement criteria can be divided into strategic, tactical and or operational based criteria. Also, a balanced set of so called soft and hard criteria is one of the characteristics of a good Supplier Performance Measurement & Evaluation System. According to the literature review, the commonly used critical success factors on which a supplier is evaluated are Cost, Delivery, Responsiveness, Service and Flexibility. An internal analysis revealed that the six business groups have a Supplier Performance Measurement & Evaluation System in place but do not fully benefit from it. Not all business groups understand which performance criteria (strategic, tactical or operational orientated) are relevant during the different steps within a purchasing process. Also some business groups found it difficult to measure DSM s strategic performance criteria Innovation and Sustainability. Another finding was that DSM s Supplier Evaluation Tool (SET), which became a mandatory supplier evaluation tool for all business groups since its introduction in 2008, was not clear and fully understood. The SET comprises a list of critical success factors and some key performance indicators, which were often used intertwined, without all the required key performance indicators described, or without a clear understanding of how to measure them in practice. Also, some business groups find it difficult to measure soft criteria such as strategic commitment or strategic fit. Although the SET was mandatory, not all business groups were using the tool, mostly because they were more familiar with their own Supplier Performance Measurement & Evaluation System already incorporated. Business groups that were using the SET, often used only subjective evaluation of suppliers. This was not only for soft criteria but also for performance criteria that were quantitative and easier to measure. The reason for this was that there was little time to collect quantitative data and business groups wanted to speed up the evaluation process. V

6 Remarkable is that some business groups have a SAP module in place to measure & evaluate suppliers, but still rather use traditional methods. The viewpoint of some business groups is that SAP does not include enough possibilities to reflect the business group requirements. This however has never been researched within DSM. One of the most remarkable findings was that the performance criterion Cost was not included in DSM s Supplier Performance Measurement & Evaluation System, while Total Cost of Ownership (TCO) is an important selection criterion for DSM. TCO concept is not often used within DSM due to time and cost required to gather all data to establish TCO. Conclusions and recommendations The new Supplier Performance Measurement & Evaluation System set-up must include a balanced set of strategic, tactical, and operational performance criteria. DSM prefers to use SAP to evaluate suppliers and wants to use existing supplier performance data stored in the system. The new set-up must also be clear and should reflect DSM s corporate strategy and objective. DSM s performance criteria that are used in the selection process should reflect DSM s criteria for supplier evaluation. My first recommendation is to use the following new standardised set of performance criteria which are strategic, tactical, and operational based. For strategic performance criteria: Sustainability and Innovation are recommended, because they reflect DSM s corporate strategy and objective. For tactical performance criteria: Cost, Flexibility, Service and Information sharing are recommended. To monitor the operational performance of suppliers, the performance criteria Quality and Delivery are recommended, because these performance criteria can be used to both monitor and analyze suppliers. Operational performance criteria use real-time data which can be collected directly from the various warehouse locations of DSM. Strategic performance criteria Innovation and Sustainability are registered by the use of an online SRM web-based questionnaire that incorporates questions related to a scoring method with individual weighing factors for each performance criterion. SAP can automatically calculate a questionnaire from each of the six business groups to get an overall score. It is possible to create an individual questionnaire for each criterion. I have contributed in the development of the Innovation and Sustainability questionnaire, which both have been tested and approved by DSM. The tactical performance criteria: Cost, Flexibility, Service, and Information sharing are also registered by a SRM web based questionnaire. The operational performance criteria Quality and Delivery can be automatically retrieved from DSM s SAP- MM module. DSM s SAP-QM 8d notification report can be used to register and manage customer and supplier complaints regarding poor quality, which are required for certain performance criteria. When these systems are implemented, DSM will have an elaborated supplier performance measurement and evaluation system that minimizes manual handling, speeds up the supplier evaluation process and allows performance data to be shared and analyzed between business groups. VI

7 Table of Content List of Figures... X List of Tables... XI List of Abbriviations... XII 1. Company Introduction Company Introduction DSM s strategy Vision Organizational Layout Competitive Landscape DSM Sourcing DSM cross functional team work Research design Introduction Problem Formulation and Research Objective Research Questions Research Scope and Deliverables Research Approach Research Model Data collection Relevant Stakeholders Academic Value Conclusion Literature Review Introduction of Purchasing and Supply Management Definition of Purchasing and Supply Management Strategic Supply Management Processes Introduction of Performance Measurement Definition of Supplier Performance Measurement Systems (SPMS) Critical Success Factors (CSF s) & Key Performance Indicators (KPI s) Why measure and evaluate performance? The design of a SPMS Characteristics of a good SPMS What to measure? Most often used supplier selection and assessment performance criteria Supplier Performance Management (SPM) Process - Continuous improvement cycle Common problems with SPMS Evaluation approaches The use of Information Technology (IT) for supplier evaluation Conclusion External analysis Royal Dutch Shell (RD) Philips Sun Micro Systems (SMS) DAF Conclusion Internal Analysis Introduction Analysis of DSM s strategy Corporate Strategy VII

8 5.2.2 Purchasing Strategy Conclusion Analysis of DSM s Supplier Development Program SDP objectives SDP elements SDP competitive advantage Conclusion Analysis of DSM s Supplier Performance Management Supplier Segmentation Supplier Performance Measurement Supplier Performance Evaluation & Ranking Non-performance & Complaint Processing Conclusion Using Technology for Supplier Evaluation DSM s Apollo organization DSM s IT-Landscape Conclusion Analysis of DSM s measurement practices DSM s BG s measurement practices Conclusion DSM s New Design Elements Design of DSM S new SPMES Introduction Developing DSM s set of performance criteria Literature derived performance criteria External company analysis performance criteria Internal analysis performance criteria DSM s new set of performance criteria Strategic Performance Criteria Sustainability Innovation Conclusion Tactical Performance Criteria Cost Flexibility Service Information sharing Conclusion Operational Performance Criteria Quality Delivery Accuracy (DA) Conclusion Final Evaluation Method: Combined performance criteria DSM s new SPMES Design Functional Requirements DSM s Complaint Management System Reporting of Results Implementation aspects Introduction Advantages and disadvantages of using SAP for supplier evaluation Changes within DSM s purchasing process Supplier Selection Supplier Contracting Goods receipt Invoice verification VIII

9 7.4 Internal and external stakeholder communication Recognition and rewarding suppliers Implementation plan Research Conclusions & Recommendations Research Conclusions and Recommendations Analysis aspects Design aspects Implementation aspects Current versus new SPMES overview Set-up requirements for DSM s new SPMES Further research required References IX

10 LIST OF FIGURES Figure 1.1: Figure 1.2: Figure 2.1: Figure 3.1: Figure 3.2: Figure 5.1: Figure 5.2: Figure 5.3: Figure 5.4: Figure 5.5: Figure 5.6: Figure 6.1: Figure 6.2: Figure 6.3: Figure 6.4: Figure 6.5: Figure 6.6: Figure 7.1: Figure 7.2: DSM s Organizational chart DSM s Hybrid organization Research model Strategic purchasing and supply management processes (Monczka) Elements of a Supplier Performance Measurement process Elements of DSM s Supplier Development Program. Kraljic (1982) Matrix DSM s mirrored approach DSM s Supplier Evaluation Tool (SET) within the purchasing process Results of SET with graphic representation and follow-up. DSM s IT-landscape related to supplier evaluation The continuous improvement of supplier s capabilities reduces TCO DSM s new performance criteria set-up for supplier selection and assessment. DSM s sustainability program DSM s sustainability scoring methodology DSM s new and improved SPMES design SAP-BW reporting ability DSM s purchasing process and required points of attention DSM s supplier feed-back process flow X

11 LIST OF TABLES Table 1.1: Table 3.1: Table 3.2: Table 3.3: Table 5.1: Table 5.2: Table 5.3: Table 5.4: Table 6.1: Table 6.2: Table 6.3: Table 6.4: Table 6.5: Table 6.6: Table 7.1: Table 7.2: Table 7.3: DSM company facts The characteristics of a good Performance Measurement System. Performance measure record sheet The most often used CSF s and KPI s for supplier assessment. DSM s Supplier Evaluation Tool (SET) DSM s SET compared to characteristics of a good Performance Measurement System Apollo s umbrella and IT-research focus SAP R/3 functionally compared to needs of the BG s The recommended new set of strategic performance for DSM s SPMES The recommended new set of tactical performance criteria for DSM s SPMES. The recommended new set of operational performance for DSM s SPMES The recommended strategic performance criteria: Sustainability & Innovation The recommended tactical performance criteria: Cost, Flexibility, Service, Information sharing. The recommended operational performance criteria: Quality & Delivery. Most often used selection criteria Tools to evaluate, recognize and motivate suppliers DSM s implementation plan for the new SPMES. XI

12 LIST OF ABBRIVIATIONS BG BI CMS CRM CSF DA DSM ERP ISO KPI MM OTIF PMS RQ SCM SET SDP SPM SPMES SRQ TCO SQA QC QM Business Group Business Intelligence Complaint Management System Customer Relationship Management Critical Success Factor Delivery Accuracy Dutch State Mines Enterprise Research Planning International Organization for Standardization Key Performance Indicator Material Management On Time In Full Performance Measurement System Research Question Supply Chain Management Supplier Evaluation Tool Supplier Development Program Supplier Performance Management Supplier Performance Measurement & Evaluation System Research Sub Question Total Cost of Ownership Supplier Quality Assurance Quality Control Quality Management XII

13 1. COMPANY INTRODUCTION This chapter begins with a company introduction of DSM. Next DSM s strategy, organizational layout, competitive landscape and DSM s purchasing department are described. 1.1 Company Introduction DSM was established in 1902 as a state coal mining company 'The Dutch State Mines'. The mining operation grew very fast and so did the coal processing operation. A by-product of this process is coke oven gas. This was converted into a profitable commodity, ammonia, an ingredient in nitrogenous fertilizers. In the post-war era, chemical products became more important. DSM started to produce industrial chemicals and raw materials for synthetic fibers and yarns. Because by the 1960's oil and natural gas were much more profitable and coal was more polluting, the worldwide use of coal began to decline. In 1975, the Dutch Prime Minister officially closed the country's last mine. After 1975 DSM focused on fertilizers, high-quality plastics and fine chemicals. In 1989 DSM was privatized, and started its first sale of the company's common shares to public investors. Today DSM is worldwide active in nutritional and pharma ingredients, performance materials and industrial chemicals. Products of DSM are used in a wide range of end markets and applications such as human and animal nutrition and health, cosmetics, pharmaceuticals, automotive and transport, coatings, housing and electrics & electronics. DSM ranks among the global leaders in many of these fields. Table 1.1 gives a summary of DSM s key figures. Headquarters Netherlands Annual Sales (2008) EUR 8.8 billion Nr. Of employees (2008) International presence Locations on Five Continents Table 1.1: DSM Company Facts Mission: DSM s mission that is stated on the website ( To create innovative products and services supporting a healthier, more sustainable and enjoyable way of life. 1.2 DSM s strategy Vision 2010 DSM s Strategy is named Vision 2010 Building on strengths and is stated on the website ( Enhance quality of our businesses through innovative growth of our specialties portfolio, building upon our leading position in sustainability with increased presence in emerging economies and continued implementation of operational excellence. 1

14 DSM will also accelerate the group s shift from a chemical and material based company towards a Specialty Life Science and Materials Science Company. DSM aims to deliver faster growth, higher margins and improved earnings quality. 1.3 Organizational Layout DSM has a decentralized organizational structure (Figure 1.1). There are seventeen Corporate Departments built around twelve Business Groups (BG s) that are divided into five clusters: Nutrition, Pharma, Performance Materials, Polymer Intermediates, Base Chemicals and Materials. This structure enables a flexible, efficient and fast response to market changes. Joint Venture DSM / EXXON DEX Plastomers DSM Managing Board 17 Corporate departments Nutrition Pharma Performance Materials Polymer Intermediates Base Chemicals and Materials DSM Nutritional Products Human Nutrition and Health Animal Nutrition and Health DSM Pharmaceutical Products DSM Anti-Infectives DSM Engineering Plastics DSM Dyneema DSM Fibre Intermediates DSM Agro DSM Elastomers DSM Food Specialties DSM Resins DSM Melamine DSM Energy Figure 1.1: DSM s Organizational chart Furthermore there are a number of staff departments that support the managing board of directors and Business Groups. The European Sourcing Department, also called DSM Sourcing (DS) is located in Sittard in the Netherlands. For my research the following DSM Business groups are included: DEX Plastomers (DEX), Engineering Plastics (DEP), Fibre Intermediate (DFI), Elastomers (DEE) and Resins (DR). 1.4 Competitive Landscape DSM is the world biggest supplier of vitamins, caretonoieden, other biochemical products and fine chemicals for Nutritional products. DSM is also the leading independent supplier to pharmaceutical companies. Around 40% of all the world medicines contain elements that are produced by DSM. DSM is 2

15 market leader in technical plastics with a focus on high quality materials and specialities performance materials. The world strongest fibre called Dyneema is also developed by DSM. DSM belongs also to the top producers of EPDM rubber, caprolactam, acrylonitril and melamine. The principal competitors of DSM are e.g.: BASF AF; Bayer AG; Akzo Nobel, Dow Chemicals, E.I. du Pont de Nemours and Company. 1.5 DSM Sourcing DSM Purchasing is a global organization that consists of a central DSM sourcing structure and a BG sourcing structure that form a hybrid organization structure (Figure 1.2). The BG sourcing structure is set up for BG-specific spend and multi-bg categories for which the BG acts as lead buyer aligned with the DSM Sourcing structure There are category Teams divided in three spend groups: Direct Spend I (Bio)- chemicals, Direct Spend II Petrochemicals & Energy and Indirect Spend Goods & Services. Regional Sourcing Directors Asia Pacific Americas Chief Purchasing Officer Global Staff BG Director BG Purchasing Director BG Director BG Purchasing Director BG Director BG Purchasing Director Functional network led by Spend Area Director (Bio)Chemicals Functional network led by Spend Area Director Petchem & Energy Functional network led by Spend Area Director Indirect Spend Area Director (Bio) Chemicals Senior Category Manager Category Manager Contract Manager Sourcing Analyst BG (Lead) Buyer Contract Manager BG (Lead) Buyer Contract Manager BG (Lead) Buyer Contract Manager Functional line Hierarchical line Spend Area Director Petchem & Energy Senior Category Manager Business Intelligence Manager Category Manager Contract Manager Market Analyst / Sourcing Analyst BG (Lead) Buyer Contract Manager BG (Lead) Buyer Contract Manager BG (Lead) Buyer Contract Manager Spend Area Director Indirect Senior Category Manager Category Manager Contract Manager Sourcing Analyst BG Buyer Contract Manager BG Buyer Contract Manager BG Buyer Contract Manager Purchasing Assistants Figure 1.2: DSM s hybrid organization DSM Sourcing has regional representation in Europe, America and Asia-Pacific. The total sourcing spend is around EUR 6 billion (2007) divided in a regional split in for Europe EUR 3.7 billion, USA 1.4 billion and Asia 0.9 billion. 3
.")
16 1.6 DSM cross functional team work DSM uses and a hybrid organizational structure in order to To bundle our efforts towards the supply market in alignment with DSM business requirements To optimize DSM s buying power and knowledge sharing With the purpose to: Increase purchasing efficiency and effectiveness, Maximized synergies and knowledge sharing. Increased transparency in spend data and market structures Within the hybrid organizational structure every category team is responsible the project and for measuring the performance of suppliers. The Business Groups (BG s) are accountable for the total end project. 4

17 2. RESEARCH DESIGN This chapter begins with the problem introduction. Next the problem formulation, research objective, research questions, scientific value, scope, deliverables and research approach are described. 2.1 Introduction DSM launched in 2006 a Supplier Development Program (SDP). One of the goals of SDP is to involve suppliers to collaborate with DSM to improve working conditions, safety, health and environmental performance throughout the supply chain. Next to that the focus of the program is to reduce costs by developing joint cost reductions programs, new business development and joint innovation programs. With the launch of SDP, DSM s supplier development efforts shifted from a short term focus towards a more long term focus. In the short-term DSM focus is on the improvement of operational performance such as quality and delivery performance. In the long DSM focus is on the continuous improvement of the capabilities of so called strategic suppliers by sharing in-house capabilities with the suppliers and work together towards continuous improvement. 2.2 Problem Formulation and Research Objective For DSM s Sourcing Petrochemicals & Energy department (also referred to as DSII), there are only a limited number of suppliers big and capable enough to supply DSM. Therefore, DSM s current sourcing strategy focused on the development of long term strategic relationships with strategic suppliers. DSM s main purchasing objective is to achieve a continuous improvement of DSM s and supplier business processes, reduce DSM s cost and develop and maintain a higher degree of Sustainability" and Innovation. Sustainability and Innovation are part of DSM s core values and also increasingly part of DSM s key business growth drivers. This is the third consecutive year that DSM has held a top position in the worldwide Dow Jones sustainability index 1. DSM has several innovation programs in place to focus on helping to create a sustainable future. DSII purchases a wide range of petrochemicals which are delivered by various means such as pipeline, ship/barge, rail and road. The main research focus of this thesis is related to the use of performance measurement by DSM s Petrochemical and Energy group which comprises the following six business groups: DEX Plastomers, Engineering Plastics, Fibre Intermediate, Elastomers, Resins and DSM s sourcing department. DSM s Sourcing department is set up to act as a lead buyer for the business groups in order to leverage DSM's purchasing expenses, resources, capabilities and best practices. The sourcing department works in close collaboration with the business groups individual purchasing teams. 1 The Dow Jones Sustainability World Index includes over 300 companies from 34 countries that rank among the top 10% in their industries in terms of corporate sustainability. The Dow Jones Sustainability Indexes track the performance of the leading sustainability-driven companies worldwide through a thorough assessment of companies economic, environmental and social performance and accounts for more than 50 general as well as industry-specific criteria in each sector. 5

18 The business groups themselves are responsible for the use of performance measurement on suppliers and the gathering of performance data from key performance indicators such as: on time delivery, right quantity, quality and other valuable performance indicators. In order to evaluate the overall performance of a strategic supplier, it is required to gather and analyze the performance data from all six business groups. The main research problem of this thesis is related to the gathering, analysis and interpretation of gathered performance data from the six business groups. Currently, each business group has its own Supplier Performance Measurement & Evaluation System in place, which includes business group specific critical success factors and key performance indicators. This is because these business groups were all autonomous companies before acquired by DSM. Also, the data analysis performed by the business groups differs. Some business groups use traditional methods such as supplier rating with the use of scorecards or Microsoft Excel, while other business groups use a more modern approach that includes the use of advanced SAP supplier measurement & evaluation modules. The use of SAP is less time consuming and enables the user to generate a complete supplier evaluation report. This is one of the reasons DSM management prefers SAP over the traditional methods that are still in use. Therefore the second objective of this research is to develop a SAP environment in which the new Supplier Performance Measurement & Evaluation System can operate. Currently, DSM is not satisfied by the way performance data is gathered, analysed and processed. DSM prefers one standardised Supplier Performance Measurement & Evaluation System for all business groups, that includes an alignment of critical success factors and key performance indicators and allows an easier and faster supplier performance evaluation. This is required to support DSM s current sourcing objective that includes the continuous improvement of supplier capabilities. The main research objectives can be formulated as: 1. Develop a standardized Supplier Performance Measurement & Evaluation System that includes an optimization of existing Critical Success Factors (CSF s), Key Performance Indicators (KPI s) derived from literature study, external analysis and business group s best practices. 2. To develop a SAP environment in which the new Supplier Performance Measurement & Evaluation System can operate. To clarify the research objective the objective is separated into the following sub objectives: Identify the best practices of performance measurement using a theoretical and empirical research approach that includes: literature research, internal analysis, external analysis and business group s best practices. Gather most often used CSF s and KPI s. Analyze and compare the best practices with the current DSII supplier performance measurement and evaluation systems that are currently in place at the business groups. 6

19 Analyze and optimize CSF s, KPI s. Develop a supplier performance measurement and evaluation system Develop a SAP environment in which it can operate Summarize the conclusions and recommendations and develop an implementation plan. Implement the new improved supplier performance measurement and evaluation system at one of the following BG s, only when time permits. 2.3 Research Questions The following main research question must be answered in order to fulfill the research objective: How should a standardized Supplier Performance Measurement & Evaluation System for DSM be set up and implemented, in order to enable continuous monitoring, evaluation, and improvement of supplier performance, with the use of SAP? The above main research question (RQ) is divided into three main research questions (RQ s) and seventeen sub research questions (SRQ). The first step in the research method used is the analysis phase, which includes finding the best practice of supplier performance measurement in literature, so called theoretical research approach. The data from the literature study is than compared with that of the internal and external analysis. The internal analysis includes a thorough analysis of DSM business groups and best practices while the external analysis (also referred to as case study analysis), other companies within the Petrochemical & Energy sector and other market sectors are researched. The different steps in which this research was conducted is visualized in research model figure 2.1. The following RQ s and SRQ s must be answered to fulfill the above described main research question. RQ 1: What is the best practice of Supplier Performance Measurement and Evaluation used in Literature, Internal and external analysis? Theoretical research questions from literature research: o Paragraph 3.4, 3.5, and answer SRQ: 1.1, 1.2, and 1.3.What is good performance measurement? o Paragraph answers SRQ: 1.4. What are the most commonly used CSF s and KPI s for supplier selection and supplier evaluation? o Paragraph 3.11 answers SRQ: 1.5. How can Information Technology be used to improve supplier evaluation? Empirical research questions from external analysis: o Paragraph answers SRQ: 1.8, 1.9, and How are other petrochemical and non-petrochemical related companies measuring supplier performance? 7

20 Empirical research questions from internal analysis: o Paragraph 5.4 answers SRQ: 1.6: How is DSII measuring and evaluating supplier performance? o Paragraph 5.6 answers SRQ: 1.7: How are the following BG s: DEX, DEP, DFI, DEE, DR measuring and evaluating supplier performance? RQ 2: How should the current SPMES be modified and optimized according to the theoretical and empirical research results of the best practices and current corporate and purchasing strategy? o Paragraph 5.2 to 5.4 answers SRQ 2.1 to 2.3: How do the current DSM strategy and supplier development and performance programs contribute to the continuous improvement of suppliers? o Paragraph 5.5 answers SRQ 2.4: How can DSM s IT-Systems contribute to supplier evaluation? o Paragraph 5.6 answers SRQ 2.5: How is the current Supplier Evaluation Tool (SET) applied within the Supplier Performance Measurement & Evaluation Systems of the six Business Groups? o Paragraph 6.2 answers SRQ 2.6: Which set of supplier assessment performance criteria are important for DSM based on criteria from literature, external company analysis, internal BG best practices? o Paragraph 6.3 to 6.5 answer SRQ 2.7 to 2.9: What are the most important related KPI s for CSF s and how can these criteria be used with SAP for supplier evaluation? o Paragraph 6.6 answers SRQ 2.10: Which IT-Systems and functional requirements are important for an effective SAP supplier evaluation, based on the decision set of performance criteria? RQ 3: How should a Performance Measurement System be set up and implemented with the use of SAP? o Paragraph 7.2 answers SRQ 3.1: What are the advantages and disadvantages of using SAP for supplier evaluation? o Paragraph 7.3 answers SRQ 3.2: Which changes within DSM s purchasing process are important for a successful implementation of DSM s new SPMES? o Paragraph 7.4 answers SRQ 3.3: How should DSM communicate with internal and external stakeholders? o Paragraph 7.5 answers SRQ 3.4: How important is recognition and reward for the continuous improvement of supplier? o Paragraph 7.6 answers SRQ 3.5 Which elements should be included for the implementation of the new SPMES? 8

21 2.4 Research Scope and Deliverables The scope of this research is bounded by the following: The research is restricted to the development of a suppler performance measurement and evaluation system for business groups: DEP, DFI, DEE, DEX, DR and DSII. For this research the following is delivered: Develop a standardized Supplier Performance Measurement & Evaluation System that includes an optimization of existing Critical Success Factors (CSF s), Key Performance Indicators (KPI s) derived from literature study, case studies and business group s best practices. Develop a SAP environment in which the new Supplier Performance Measurement & Evaluation System can operate. Develop conclusions, recommendations and an implementation plan for the improved SPMES. Implement this Supplier Performance Measurement & Evaluation System at the business groups, only when time permits. 2.5 Research Approach This paragraph describes a detailed research methodology that is used for this research, which includes a research model, step-by-step data collection and the research structure Research Model The research model (Figure 2.1) acts as a guideline for this research and uses a step-by step approach that is required to get an answer on the main research question and fulfilment of the research objective. The research model is developed using a backward method approach that starts with the end objective then working backwards to find the necessary tools and actions that are required to realize this objective (Verschuren & Doorewaard, 1995). The model is divided in eleven steps through the following four phases: orientation, analyze and compare, design and implementation. In each phase different steps are performed that will answer all the RQ s and SRQ s. For this research both unstructured and semistructured interviews were used. The research model starts with the orientation phase that includes DSM s company introduction and research design. The analysis and compare phase can be divided into a theoretical and empirical research approach. The theoretic approach includes the literature review and an analysis of the current SPMES. The results of the literature review are used as input for the empirical research approach. For the empirical research approach other external company analysis are performed to review how other companies measure supplier performance. The theoretical and empirical research approaches are compared and analyzed in order to find possible optimizations in the DSII current performance 9
22 measurement system. In the design phase a new improved SPMES is designed using optimized CSF s, KPI s, methods and procedures. The implementation phase is the last step of the research and includes a well defined implementation plan and a description of the effects of the new improved SPMES on the current methods and procedures. The step-by step data collection is now described in more detail Data collection This research uses different kinds of data collection methods such as: extensive literature review, desk research, unstructured and structured interviews and group meetings. In this paragraph the different research steps and phases are linked to different data collection methods and described in more detail. Orientation Phase Step 1 and 2 of the research are the company description and the research design. For both research steps unstructured interviews are used for understanding DSM s culture, methods and procedures and problem formulation. Interviews are conducted with both supervisors. Orientation Phase Step 1 DSM Introduction CH1 Step 2 Research Design CH2 Analyse and Compare Phase *Step 3 Literature Review CH3 **Step 4 BG s SPMES analysis CH5 **Step 5 External Case study analysis CH4 **Step 6 DSII SPMES analysis CH5 Design Phase Step 7 Optimize CSF s & KPI s CH6 Step 8 Research the use of Information Technology for supplier evaluation CH6 Implementation Phase Step 9 Effect of Optimization for Current SPMES CH7 Step 10 Implementation Plan CH7 Step 11 Conclusions & Recommendation CH8 * Theoretical Research approach ** Empirical Research approach Implementation Step 1, 2: Step 4: Benchmark Interviews Step 5: Semi-Structured interviews (SSI) Step 7, 8: SSI Unstructured Interviews (UI) Answers the following RQ s & SRQ s: Step 3: RQ1_SRQ: Step 4: RQ1_SRQ: 1.7 Step 5: RQ1_SRQ Step 6: RQ1_SRQ RQ2_SRQ Step 7: RQ2_SRQ: 2.6 -, 2.9 Step 8: RQ2_SRQ: 2.10 Step 9: RQ3_SRQ: 3.1, 3.2 Step 10: RQ3_SRQ: Figure 2.1: Research Model 10
23 For the interviews open-ended questions are used in order to keep an open mind and focus on the response of personal experience and knowledge of the interviewees. In order to require the necessary information for the introduction chapter the following data sources are used: company documents; intranet and the corporate website (desk research). For the research design multiple unstructured interviews are performed and brief meetings are planned with the supervisors to verify each of the following elements of the research design: research objective, research problem, research question, research scope and deliverables and research approach. The two research steps will form the basis for the semi-structured interviews used in the analysis and compare phase. Analyze and Compare Phase Step 3 is part of the Theoretical Research Approach. This step will answer RQ1_SRQ: This step uses scientific and professional publications from online search engines, university libraries and online knowledge portals such as: and The search phrases that are used for the research are: Performance Management Performance Measurement Performance Measurement System Supply Performance Measurement System Supplier Performance Measurement & Evaluation Systems Supplier Relationship Management Supplier Evaluation Next to research papers five academic books are used that are all written by well known authors that have a lot of expertise in the field of purchasing of performance measurement. For the different topics within the literature research the opinions of the different authors are reviewed: The theoretical literature review provides information that is used for developing the interview questions for the Empirical Research Approach in step 4, 5 and 6. Step 6 describes the current Supplier Performance Measurement & Evaluation System (SPMES). The current SPMES is developed as part of DSM s Supplier Development Program and includes a list of CSF s and related general and operational example KPI s with weighing factors. The CSF s and example KPI s are developed and approved by the DSM s management board in 2005 and belong to the first draft (space for improvements). The current SPMES does not describe how the KPI s are measured, but only indicates which CFS s and related examples KPI s are important. The BG s are obligated to use at least the list of CSF s, but they can choose their set of performance measures and evaluation approach. Step 4, 5, 6 are part of the Empirical Research Approach. Step 4 answers RQ1_SRQ: 1.7 Step 5 answers RQ1_SRQ Step 6 answers RQ1_SRQ RQ2_SRQ
24 The interviews include the analysis of the SPMES s of five BG s and four external companies: DEX Plastomers (DEX), Engineering Plastics (DEP), Fibre Intermediate (DFI), Elastomers (DEE) and Resins (DR). Case study analysis: four companies: Shell, DAF, Sun Mircro Systems and Philips. For both BG s and external analysis semi-structured interviews are performed, which enables a structured but also flexible way to get answers on specific questions and the possibility to explore different topics (Appendix B). Design Phase Step 7 & 8 are part of the Design process. Step 7 answer RQ2_SRQ: 2.6 -, 2.9 and step 8 answer RQ2_SRQ: After analyzing and comparing the best practices with the current SPMES possible improvement or optimizations will be highlighted. By using the best practice and actual proven methods and procedures the current system can be improved. Also adding, replacing, merging of CSF s and KPI s with those of the best practices can improve the current SPMES. Implementation Phase Step 9, 10, 11 are part of the Implementation Phase. Step 9 answers RQ3_SRQ: 3.1, 3.2 Step 10 answers RQ3_SRQ: Step 9 describes the effects that the improvements or optimizations have on the current SPMES and on suppliers. This step describes the changes that have to be made in the current methods and processes to implement the new improved SPMES accordingly. Step 10 describes the implementation plan and the role key (target) users have in the new SPMES. Also all the ERP-like SAP possibilities have been analysed and will be used for the implementation to create a standardized method for all BG s. The relevant stakeholders are further described in Paragraph Relevant Stakeholders Stakeholders are individuals or groups who have an interest in or an influence on the company business (Webster collegiate dictionary). One of the goals of DSM management board and for DSM s sourcing department is to improve the Supplier Performance Management. Therefore they are both the problem owners. The internal stakeholders are the category, contract managers from DSM Sourcing & Business Groups (BG s) working with Supplier Performance Measurement and DSM shareholders. The external stakeholders are the Suppliers, Customers and the Government (with regulations for chemicals). 12
25 2.7 Academic Value In literature there is little or no research that describes the development of a standardised SPMES for different autonomous BG s with a wide range of different products but with the same suppliers to evaluate. This research aims to partly close this gap. The research also adds value by clearly describing the benefits and drawbacks of strategic long-term relationships linked with supplier performance measurement for Petrochemical & Energy related companies. This research will be based on a thorough literature review, internal and external analysis that make the conducted research more reliable. 2.8 Conclusion This chapter gives a brief overview of the problem definition and research objective and the research approach used for conducting the actual research. The next chapter will start with a literature review that relates to the different aspect of supplier performance measurement and evaluation. 13
26 3. LITERATURE REVIEW This chapter answers the following sub research questions (SRQ s): Paragraph 3.4 answers SRQ: 1.1.What is performance measurement? Paragraph 3.5 answers SRQ: 1.2. What are SPMS s? Paragraph answers SRQ: 1.3. What are the characteristics of a good SPMS? Paragraph answers SRQ: 1.4. What are the most commonly used CSF s and KPI s for supplier selection and supplier evaluation? Paragraph 3.11 answers SRQ: 1.5. How can technology be used to improve a SPMS? 3.1 Introduction of Purchasing and Supply Management During the last decade, the business environments all over the world have undergone and experienced significant change (Ellram & Liu 2002). Increasing competition, higher customer requirements and rapid changing technological developments forced companies to improve their overall performance. To improve performance, companies shifted away from vertical integration towards smaller and leaner management principles. Many focused on their core competencies, outsourced non-core activities and attempted to achieve competitive advantage by leveraging suppliers capabilities and technologies (Prahalad and Hamel, 1990). These changes were often positive, allowing companies to focus and reduce costs and increase quality and or flexibility. Additionally, recently much of the traditional in-house development activities have been pushed onto suppliers (Tully 1995). As a consequence, companies are re-examining their supply base and their supply strategy. Purchasing is now regarded as a strategic tool, with the ability to create collaborative relationships and exploit supplier s capabilities for improvements in product quality, quicker integration of technological breakthroughs, and shorter new product development lead times (Ragatz et al. 1997). Also suppliers are now more involved in product design at an earlier stage, which is more cost efficient, due to the mutual involvement in the development of alternative solutions, the sharing of technologies or in design evaluation (Monczka et al. 1994; Burt and Soukup 1985). Jahns, (2005b) describes that purchasing cannot be seen anymore as just a clerical function cost center, but that role of purchasing has shifted away from an operative to a strategic and from a clerical to a management function. Many authors in literature describe this process as the evolvement of purchasing towards strategic supply management, where it now becomes responsible for the planning, controlling and monitoring of all procurement aspects. Thus, over the recent years the purchasing function has evolved. Greater dependence on suppliers increases the need to effectively manage suppliers. One of the aspects for managing suppliers is the use of a Supplier Performance Measurement Systems (SPMS), which will be further described in paragraph
27 Due to the relative new area of research, there are many different definitions for purchasing and supply management. In order to clarify the role of performance measurement within this field, their specific functions are now further described. 3.2 Definition of Purchasing and Supply Management So what exactly is purchasing and supply management? Supply management is in literature often related to terms like purchasing, procurement, sourcing and also to concepts like logistics, material management and with supply chain management. The most commonly used definition is derived from Monzka (2002) that divides purchasing and supply management into two parts. The term purchasing is referred to the more operational and tactical purchasing process from specification till evaluation, while supply management is referred to the more strategic long term focus of identifying evaluating, selecting, managing and developing suppliers to create competitive advantages within the supply chain. Axelsson and Wynstra (2002) define purchasing and supply management as managing the external resources of the firm, aimed at acquiring inputs at the most favourable conditions. This definition indicates that a customer can be interested in more than just goods and services, such as knowledge and skills that can be used in the development and manufacturing of future products. By referring to the management of external resources and not only to acquiring inputs, this definition also refers to activities that are indirectly related such as Supplier Relationship Management (SRM) and Supplier Development (SDP). Van Weele s (2005) definition of purchasing also emphasize on the function of purchasing as a total of the direct of purchasing activities and more of the indirect purchasing activities: The management of the company s external resources in such a way that supply of all goods services, capabilities and knowledge which are necessary for running, maintaining and managing the company s primary and support activities is secured at the most favourable conditions Wynstra (2006) defines purchasing and supply management as: organizing, initiating, managing and monitoring of activities (between and within) organizations with the aim of purchasing (also rent, hire, exchange) goods or services of the external suppliers. This definition gives in my opinion a clear understanding of the multiple aspects of purchasing and supply management as well as the supplier involvement and relationships that is required. The following paragraph describes the supply management process in more detail. 15
28 3.3 Strategic Supply Management Processes In literature purchasing and supply management is often described to include strategic, tactical and operational activities. According to van Weele (2005) the operational activities are often associated with the processes of ordering, monitoring and aftercare. The tactical activities are often associated with the specification from what is purchased, the selection of suppliers and contracting the suppliers. The tactical and operational activities are considered to be critical business processes within the purchasing function. There are in literature some different viewpoints between tactical and strategic activities. Wynstra (2006) defines strategic purchasing and supply management as a more long-term activity which affect the goods or services purchased, the suppliers used and the way suppliers should be involved for a longer period in time. Within this strategic definition, Wynstra (2006) describes two important main processes: First, the analysis, decision making and implementation regarding whether to buy or outsource a product or activity, so called make-or-buy decision and in sourcing / outsourcing decisions. Secondly, this concerns the analysis, decision making and implementation with regarding the course of action for a specific package of products that are repurchased, representing category of commodity development strategy. Within this context organizing, initiating, managing and monitoring of activities as described in the purchasing and supply management definition Paragraph 3.2 can be viewed as a strategic long-term activity. A purchasing and supplier management strategy is the result of the analysis and decision making for these two main processes and provides long-term direction of the organization within it. These two main processes are also part of a practical widely used reference model for strategic sourcing and supplier management processes of the so-called purchasing excellence model from Monczka, Michigan State University (Figure 1) 2. This model is also used by the Dutch Association for Purchasing Management (NEVI) as a comprehensive benchmarking and improvement project, the Purchasing Excellence Program (NEVI, 2002). This Michigan State University (MSU) model allows to possibility to benchmark an organization to others and to the best-in-class. The MSU- model includes eight key strategic processes and six enablers. Each process includes ten steps from low to high and the higher the score is the more mature an organization is and the closer an organization is to purchasing excellence. For detail information about the enablers of the MSU model refer to Appendix A. The changes in viewpoint described earlier can be seen in this model. Wynstra et al (2006) argues that the traditional purchasing processes, Process III, Establish and leverage a World- class supply base and process IV, Develop and manage supplier relationships of the Monczka model includes the selection of suppliers. But when the choice of the suppliers already been determined, then there can only be tactical purchasing and supply management processes, which then processes I and II are defined as strategic 2 The MSU model is developed with the cooperation of several companies. Philips Electronics is one of these companies and they are still using this MSU model extensively for benchmarking purposes. 16

29 purchasing activities, processes and III to VIII as tactical purchasing activities - and not strategic. The foundation of these different viewpoints is often related to the scope of tactical and strategic activities. For different viewpoints about the MSU model refer to Axelsson et al Figure 3.1: Strategic purchasing and supply management processes. This Monzka model has been adapted by the NEVI (2002), Dutch companies towards purchasing Excellence (1). 3.4 Introduction of Performance Measurement Recent studies show that a well integrated Performance Measurement System has a positive influence on the coordination and alignment of purchasing and supply management activities with corporate strategy (Cousins & Spekman, 2003, Carter et al., 2005). A performance measurement system is a critical element in translating supply strategy into action. In literature there are many well known phrases used to underlie the importance of a performance measurement system. Two of them are: If you cannot measure it, you cannot manage it (Garvin, 1993) Measurement is the first step that leads to control and eventually to improvement. If you can t measure something you can t understand it. If you can t understand it you can t control it. If you can t control it you can t improve it (Harrington, 2002) The first companies that used performance measurement were General Motors and DuPont, which introduced financial-based measures (Return on Investment) in order to control and plan performance results on a high corporate level (Bourne et al. 2000). In the late 1970s and 1980s these traditional 17
30 measures became more criticized. According to (Hayes & Abernathy 1980), Dixon et al (1990), Lynch & Cross, (1995), these measures encouraged the short-term planning, were historical and backward focused, and are not integrated in process of the company. As a result of this dissatisfaction new supplier performance measurement systems were developed. These models consisted not only of financial measures, but also non-financial measures and measures that are more future-oriented. Examples of such a system are: The balance scorecard from Kaplan & Norton, 1992), performance pyramid from Lynch & Cross (1995) and the performance prism Neely et al., 2002) were all models based on the improvement of performance measurement systems. Ghalayini and James (1996) define several advantages of performance measurement systems that use both financial and nonfinancial indicators have compared to the traditional measurement systems. These systems: Are based on organization strategy, unlike traditional measures which based on outdated accounting systems. Are simple, accurate and easy to use, unlike traditional measures that are often difficult to use Do not have a fixed format as opposed to traditional measures ones that have a fixed format. Have a main purpose is to improve performance unlike traditional measures whose principal purpose is to assess performance. Change over time if necessary unlike traditional measures which not change over time; Support continuous improvement unlike traditional measures which prevent continuous improvement. 3.5 Definition of Supplier Performance Measurement Systems (SPMS) In literature there are many different definitions of performance measurement systems. Hoffecker & Goldenberg (194) defines a performance measurement system as: A system that strikes an appropriate balance between financial and operational performance measures, translates strategic vision and objectives into actions for individual employees, provides a set of forward-looking (predictive) performance indicators, and links performance to recognition/reward. Bourne et al. (2003) defines a performance measurement system as a multi-dimensional set of performance measures for the planning and management of an organization. Performance measurement literally means the process of quantifying action, where measurement is the process of quantification and action correlates with performance. According to Kotler (1984) organizations achieve their goals i.e. they perform, by satisfying their customers with greater efficiency and effectiveness than their competitors. Where in this context effectiveness refers to the extent to which customer requirements are met, while efficiency is a measure of how economically the companies 18
31 resources are utilized when providing a given level of customer satisfaction. This definition clearly define that there are two fundamental dimensions of performance, but also highlights the fact that there can be internal as well as external reasons for pursuing specific courses of action. Neely et al (1986) describes that the level of performance an organization attains is a function of the efficiency and effectiveness of such actions. According the authors Neely (2005) and Platts (1995) performance measurement involves the concepts of efficiency and effectiveness. They define performance measurement as: Performance measurement can be defined as: the process of quantifying the efficiency and effectiveness of action (Neely, 1994). A performance measure can be defined as: a metric used to quantify the efficiency and/or effectiveness of an action (Neely, 1994). A performance measurement system can be defined as: the set of metrics used to quantify both the efficiency and effectiveness of actions (Neely, 1994). The definitions from Neely (1994) suggest that a performance measurement system can be viewed at the following levels: the individual performance measures, the set of performance measures and the relationship between the performance measurement system and the (organizational) environment within which it operates. From a management perspective, Neely (2005) believes that measuring performance is a necessary tool to highlight the extent to which organizational objectives were achieved and to provide information necessary to improve various processes and activities within the organization. In my view, performance measurement should not be considered just a way of assessing past performance but also a way to support the organization's daily decision making. The definition of Lardenoije et al (2004) uses an modified version of Neely (1994) definition, which covers also the purpose for measurement, this in my opinion a better definition. Performance Measurement: The process of quantifying the efficiency and effectiveness of action, in order to compare results against expectations, with the intent to motivate, guide and improve decision making. Jahns et al (2006) defines a supply performance measurement system as: Translating the efficiency and effectiveness of purchasing and supply management over all organizational levels (e.g., corporate supply management, category management, buyer, supplier) in financial and nonfinancial goals and metrics (e.g. cost, time, quality, innovation potential, supplier responsiveness) by integrating indicators of past and future performance. This last definition covers the concept of supplier performance measurement, with the remark that performance measurement should motivate and drive continuous improvement. 19
32 3.6 Critical Success Factors (CSF s) & Key Performance Indicators (KPI s) One of the most important elements of a Supplier Performance Measurement System (SPMS) are the Critical Success Factors (CSF s) and Key Performance Indicators (KPI). Rockart (1979) was the first in creating the concept of CSF s. He used ideas from Daniel (1961) and Anthony et al. (1972) in defining CSF as: the limited number of areas in which results, if they are satisfactory, will ensure successful competitive performance for the organization. Rockart (1979) describes that that these areas of activity should be constantly and carefully managed by a company. Leidecker (1984) defined CSF s as: those characteristics, conditions or variables that, when properly sustained, maintained, or managed, can have a significant impact on the success of a firm competing in particular industry. According to Rockart (1979) the following benefits exist for managers when applying the CSF approach: The process helps managers to determine those factors, which requires management attention. The process also forces managers to develop good measures for those factors and to seek reports on each of the measures. The identification of CSF allows a clear definition of the amount of information that must be collected by the organization and limits the costly collection of more data than necessary. Key Performance Indicators (KPI s) are derived from CSF s. KPI s represent a particular value or characteristic that is measured to assess whether an organization's goals are being achieved. They reflect the critical success factors, stakeholder requirements, and the expectations of the organization. Carefully selected KPI s to identify precisely where to take action to improve performance. There are many different types of KPI s depending how they are used and what they are meant to show: Strategic / operational: reflects long-term versus short term. Result/driver: KPI s can measure either the driver of activities or the result of activities. Lead/ Lag: Measures are predictive (future based) thus leading or from relate to historical results and lagging. Qualitative / quantitative: Measures can be quantifiable (e.g. delivery on-time) or qualitative (subjective e.g. feeling). Effectiveness/ efficiency: focus on productivity and achievement of individual performance measures. 20
33 3.7 Why measure and evaluate performance? Before designing a SPMS and asking the question What to measure, it is important to answer the question first Why measure? This is because the reason for evaluation is important for the measurement that is required. The suitable measures used for evaluation have to be connected to the purpose of measurement in order to prevent the problem of meeting one required the expense of others (Crowther, 1996). In literature many authors describe that performance measurement is necessary because performance measurement allows organizations to determine whether objectives have been achieved, to assess their performance and develop future initiatives to improve their performance. Crowther (1996) argues that there are a variety of purposes of which performance evaluation is used, all having their own function with an organization. Some are used for instance for long-term planning, others for operational viewpoint. The reason for measure performance can differ, some can have a long-term and a short-term focus while others are past or future based. Accoring to Lohman (2004) an effective performance measurement process requires consideration of two key issues: performance measurement system and performance indicators. The following describes the functions of a performance measurement system: To monitor: measuring actual performance. To control: identify and attempt to reduce the difference between the planned and actual performance. To Improve: identifying opportunities for improving the current situation. To coordinate: providing information for decision making and facilitating internal and external communication. To motivate: encourage continuous improvement of workplace behavior. Barbuio (2005) describes the following performance measurement indicators functions: To reinforce a performance driven culture, whereby performance and its improvement are seen as a core part of its principles of operation. To improve the quality of management decision making by providing the best information so that resources are effectively and efficiently utilized. To identify whether the organizational strategy and milestones are on track so that stakeholders can be confident that management are working towards their objectives. Help to communicate and align strategy across the organization to ensure that all involved achieve the same strategic goals. Provide transparency and accountability at both management and stakeholder. Assist in meeting compliance requirements set by government or regulators (e.g. quality norms). 21
34 Support a focus on continuous improvement which can be facilitated by trackingthe progress of KPIs overtime and between both internal and external benchmarks Crowther (1996) argues that these functions can exist in isolation from each other, the purpose of control does not necessary reflect that accountability or strategy formulation or vice versa and that. Measures must be appropriate for the purpose they are designed for. Crowther (1996) stated that measurement is a relative rather than absolute process and its comparison provides the meaning of measurement. Crowther (1996) also argues that it is often the case that companies first use objective measurement to describe performance and then evaluate performance through subjective value methods. In order to compare one unit against the other a quantitative approach it is necessary, this can also be the case for performance aspects that are qualitative by nature. 3.8 The design of a SPMS Characteristics of a good SPMS In literature it is well described that a SPMS cannot be developed without management support, leadership, resources, and commitment from corporate management. There are many different guidelines available for designing a SPMS and identifying the right set of performance indicators. Globerson (1985) and Maskell (1989) suggest the following: The purpose of each indicator must be clear (easy to understand). Indicators should be related directly to the organisation s business strategy. Be simple and easy to use. Change as circumstances change, be variable. Measure is unlikely to be suitable throughout an organisation). Provide fast feedback. Indicators should be designed to stimulate continuous improvement, rather than simply monitor. The KPI s should also follow the SMART criteria: Specific: provide enough detail so that it can effectively be translated. Measurable: should have defined measures and standards. Aggressive: Catch the aspirations of the people, and get the most out of them. Realistic: While the objective should be aggressive it should not be unrealistic. Timely: Objective should have the time frames for achievement and if possible. Neely (1996) describes that a set of performance measures, performance measurement system, can be examined three different levels. These different levels highlight the complexity of designing a SPMS, 22
35 which not only includes the selection and definition of an appropriate and practical set of measures, but also their integration both with one another and the wider environment. Using Neely s (1996) framework for a performance measurement system together with the results of Globerson (1985) and Maskell (1989) the following summary of the characteristics of a good performance measurement system can be developed (Table 3.1). Characteristics of a good Performance Measurement System: Individual measures characteristics: 1. Must be objective 2. Be incapable of mall usage 3. Dynamic over time 4. Must be clear (easy to understand) 5. Should provide fast feedback 6. Can vary between locations. 7. Simple to use 8. The purpose of each performance criterion must be clear Performance measurement system characteristics: 9. Must be linked with corporate strategy and objectives 10. Stimulate continuous improvement rather than simply monitor. 11. Comprises a balanced mixture of qualitative and quantitative criteria. 12. Requires accurate and available data. Performance measurement system & the environment characteristics: 13. The performance measurement system should match the existing reward system Table 3.1: The characteristics of a good SPMS What to measure? An important element of designing a SPMS system is specifying the measures of performance. Neely et al (1997) developed a framework), the performance measure record sheet (Table 3.2), which specifies the design questions to be answered to achieve a good performance measure. This applies for each performance measure used in the design for a new SPMS. The framework allows structured approach in collecting working performance measures within the design system. The framework consists of ten elements title, purpose, relates to, target, formula, frequency, who measures, source of data, who acts on the data, what do they do, notes and comments. 23
36 Performance measure record sheet: 1. Title 2. Purpose 3. Relates to 4. Target 5. Formula. 6. Frequency 7. Who measures? 8. Source of data 9. Who acts on the data 10. What do they do? 11. Notes and comments Table 3.2: Performance measure record sheet (Neely et al, 1997) Most often used supplier selection and assessment performance criteria Kannan (2002) describes that three dimensions underlie supplier management: effective supplier selection, innovative supplier development strategies, and a meaningful supplier performance assessment approach. The supplier selection is important because it includes the performance criteria on which the supplier later is evaluated. Therefore, an effective selection process with the use of the right performance criteria can reduce or prevent problems in the evaluation phase. Supplier development strategies are required to have a drive for continuous improvement of suppliers. An efficient supplier assessment is necessary for the evaluation process and continuous improvement of the capabilities of the suppliers. Kannan (2002) performed an elaborated research study amongst 4,500 companies (mostly manufacturers) on the impact that supplier selection and assessment have on a company business performance. Table 3.3 shows the most often used CSF s and KPI s sued for supplier assessment. The research study came up with some remarkable findings. First, his research concludes that soft targets like commitment to a buyer have a greater impact on performance than hard quantifiable criteria. This is supported by Ellram (1990), who states that especially in the supplier-buyer strategic relationships soft factors are increasingly important within the selection process. Another remarkable finding was that the willingness of the supplier to share information and to cooperate has a significant impact on performance, but is yet considered to be less important. Kannan (2002) suggests that the focus in the supplier selection process is shifting from the traditional hard and quantifiably performance aspects towards the softer and more qualitative aspects in the supplierbuyer relationship. 24
37 Characteristics of a good Performance Measurement System: Delivery and Service level Service Quality On-time delivery Correct quantity Quality Responsiveness Willingness to change products, services to meet your changing needs Quick response time in case of emergency, problem, or special request. Willingness to participate in new product development, The flexibility to respond to unexpected demand changes Information Use of electronic data interchange (EDI) Sharing Willingness to share sensitive information Table 3.3: The most often used CSF s and KPI s for supplier assessment. While companies differ in the specific approaches used to manage suppliers, certain trends can be observed. According to (Elram, 1990) quantifiable or hard criteria such as price, delivery, quality, and service are routinely used for supplier selection and assessment. Hahn et al. (1990) describe that Soft, difficult-to-quantify factors such as management compatibility and strategic direction of the supplier have also been shown to be important, particularly in the context of strategic buyer-supplier partnership. This supports Elram (1990) research Supplier Performance Management (SPM) Process - Continuous improvement cycle According to Gordon (2008) Supplier performance measurement is a process, not an event. It requires support from stakeholders besides procurement, as supplier performance impacts many functions. A SPM process should include key internal stakeholders who interact with suppliers as well as the suppliers themselves. A SPM program should: align with objectives of the company. planned and designed with those corporate goals in mind. measure and monitor progress against a plan based on metrics. Undergo scheduled reviews and improvement processes. 25
 and Monczka et al.")
38 Figure 3.2 gives an overview of the continuous improvement circle of a Supplier performance management (SPM) process. Figure 3.2: Elements of the SPM process 3.9 Common problems with SPMS Brown (1996) and Monczka et al. (2005) describe the following common problems with SPMS: Too much data and wrong data: When there is too much data, users can focus on data that is less critical for a company. Users can also pursue the wrong data and may instead of improving the performance create a conflict with other measures. Driving the wrong performance: When a measure criterion is the amount of purchase orders, suppliers will use this in their favor, by splitting orders which make their performance look better. This is not the intention of the performance measure. Lack of detail: When a company measure has to little data the data can become meaningless and a company cannot use the data for decision making purposes. Measures are short term focused: Often smaller and medium size companies are using performance measures that are short-term focused such as financial or operating data. Using only short-term measures will result in short-term focus throughout the supply chain which can have negative impact on the company performance Evaluation approaches There are different methods described in literature that are used to evaluate suppliers. The most commonly used methods can be classified into the following four categories. The Subjective: For this method a supplier evaluation card is used. The evaluation card contains several aspects that are used to evaluate the supplier on a periodic basis. The purchaser scores 26
39 these aspects and presents the results to the supplier. The benefit of this method is that it is simple to use, not labour intensive and this method often leads to the improvement of the relationship with the supplier. The drawback of this method is that it is only subjective. Weighing Point System: This method gives one final total score to a supplier. Supplier rating is a weighing point system and uses only quantitative data (Scorecards) from the supplier. Qualitative aspects are not included in a weighing point system. The method is based on giving scores to several decision criteria such as e.g. supply risk, price, and quality assurance. By assigning a weighing factor to each of the criteria, and multiplying each score with its respective weighing factor a final total score is calculated. The benefit of this method is that the results can be compared to a norm or to other suppliers. It also allows the purchaser to present a (potential) shortcoming to a supplier. The drawback is that the method does not say anything about the cause of the shortcoming (low scores) and it highly relies on the accuracy of the data that is used. Historical Overview: This method uses historical data that is gathered from the most important suppliers. This method combines the results from the subjective method and the weighing point system. The historical data is stored in a database and can be updated when needed. The benefit of this method is that it gives more information about the supplier by using quantitative as well as qualitative aspects. Site Visits & Audits: A site visit is a formal way to deploy a survey at the supplier. This method is suited for products or services that are critical or strategic to the business of the company. Sitevisits can be short or can take several hours depending on the review of specific issues or problems. There can also be a total business review performed by cross-functional teams that take several days. An audit is typically quality- oriented and performs a detailed review of the operation of the supplier. An auditor uses standards or specifications to which the supplier is measured. An audit team verifies on-site the business requirements through e.g.: inspection, interviews, documentation, records, and samples. The supplier plant survey goes even a step further by performing a full business audit for strategic suppliers before there is even a contract with the supplier. The last method is typically a proactive method that differs from the reactive methods described in this paragraph. The drawback of a site-visit and an audit is that they are very labor intensive. 27
40 3.11 The use of Information Technology (IT) for supplier evaluation Gordon (2008) describes that technology can enable and scale performance measurement. It allows a broader, more comprehensive evaluation process that is normally not possible through more manual, resource- intensive means. The major ERP suppliers such as Orcale and SAP have supplier performance management capabilities, which are most often included in their SRM- modules. These modules often include functions, which are most often included in application suites of major enterprise supply management suppliers such as Emptoris or Ariba. The following functions are often integrated in these application suites: strategic sourcing, operational procurement, contract management, supplier performance management, spend analysis and E-procurement. Gordon (2008) argues that when a performance measurement system is well deployed the pay-back period (Return of investment) can be very fast. The measurement a broader range of suppliers allows a company to have better insight of suppliers, which eventually can avoid risk, identify improvement areas, save time and cost, and eliminate cost drivers. This also includes the removal of poor-performing suppliers from the supplier pool. A key point Gordon (2008) describes about SRM solutions is that a company must have both a means of deriving meaningful metrics and a closed-loop, sustainable performance management process (Figure 3.2) in order to benefit from these software packages Conclusion In literature, there are many different opinions about the design of good performance measurement system. Many authors differ in the use of individual performance measures, as well as the connection with other measures within the system or with the environment. However, there is consensus about one theme in literature and that is when a company can measure itself at different levels against a corporate direction (mission and vision) than it has the opportunity to create competitive advantage. The translation of the companies direction into individual performance measures (KPI s) provides a foundation for continuous improvement. For the design of a supplier performance measurement system, companies should be aware of common problems. Also the use of technology for supplier evaluation can enable and scale performance measurement, but a company must have both a means of deriving meaningful metrics and a closed-loop, sustainable performance management process in order to benefit from these software packages. 28
41 4. EXTERNAL ANALYSIS This chapter answers the following sub research question (SRQ s): Paragraph answers SRQ: 1.8. How are other petrochemical and non-petrochemical related companies measuring their supplier performance? Two importance questions regarding SRQ 1.8: Paragraph answers SRQ: 1.9. What kind of SPMES do they have in place? Paragraph answers SRQ: 1.10 Are they using Information Technology such as SAP for supplier evaluation? 4.1 Royal Dutch Shell (RD) RD is a Dutch- British multinational and belongs to the top five worldwide oil and energy companies in the world. RD has worldwide around employees and is situated in more than 110 countries. The materials and services that RD buys fall into the following broad categories: Hydrocarbons, Utilities, Raw and process chemicals and catalysts, Operations materials, Operations services, Logistics/transport services, Marketing services, Information Technology support and Professional and administrative services. An important category is the buying (outsourcing) of the worldwide Hauler transportation of petrochemicals to large industrial customers and to worldwide pump stations. Haulers play a critical part in delivering these chemical products for RD in a safe, secure and environmental friendly way. This case study is focused on RD Rotterdam where the selection, coordination, and reviews of Haulers of bulk chemicals for Europe and Africa take place. The land logistic planner and contract manager are responsible for the measurement and evaluation of haulers. RD uses the following main criteria (not in order of importance): Quality, Innovation, Value, Ethics and Health Safety & Environment (HSE) Based on RD s CSF s, hauliers are measured on the following operational KPI s that are based on the day to day business at the plant related to truck and railroad shipments: Number of on-time deliveries SHE- compliance o Documents to be presented by the driver o Observance of RD Supply Location's safety regulations o Weight limits (legal road transport) o Pre departure labeling, documentation o Adverse weather conditions in the vicinity of the loading plant RD uses SAP-QM to register the late orders, quality issues that are derived from customer complaints and documents or other safety deficiencies that are derived by vendor complaints. Safety is one the most important aspects for RD. This means that RD invests time and resources to train hauliers to meet the high safety standards of RD. At the plant not only the required documents and weight (limits) of the trucks are checked, but also if the weather allows a safe loading of trucks. If one the above aspects are not 29
42 agreed upon an improvement plan is triggered. RD rather improves current suppliers then seeks for alternatives. Next to the operational KPI s RD uses tactical KPI s together with the operational KPI s for the evaluation of the supplier. RD uses the following tactical KPI s Cost (efficiency): o Average road transport payload: This is used to measure freight unit cost per delivery, customer, etc. o Railcar utilization rate: Measures asset efficiency. For example, Railcar standing at a customer site for a long period of time will incurred cost by way of it not being available for new order delivery. o Storage tank turnover rate: This is related to inventory stock storage. Like Railcar, best to have your tanks constantly turning. o Additional costs in relation to contractual freight rates. Number of customer complaint, per cause location. Innovation contribution. RD measures the weight of trucks due to safety regulation. However, RD also measure the efficiency of hauliers by measuring average road transport, railcar utilization, cost of not using available capacity and extra cost that are related to extra freight costs. For the evaluation customer as well as vendor complaints are taken into account. For the evaluation of the supplier different weighing factors are used. There are regular feedback from customers and internal Business groups to value the haulier. Every month the RD s the haulier on the operational performance and every quarter RD will have a face to face meeting with the haulier. The operational KPI s are checked every time a truck or train arrives. Truck drivers are trained by the RD academy in safety health environmental way (even driving elements). Every year RD organizes a meeting day for all hauliers working with RD and organizes the best haulier award 4.2 Philips 3 Philips is the world sixth largest supplier of semi conductors. The innovations in digital audio, video and mobile telecommunications positions the company as a leader in consumer, multi-media and wireless communications markets. Semiconductors have used a global supplier rating system (SRS) since An enhanced version has been implemented since In brief the SRS monitors and rates the performance of the preferred and strategic suppliers on the following main criteria (In order of importance): Quality, Price, Technology Support, Logistic, Responsiveness, Commitment and Dependency. At the end of each quarter, the person responsible for the SRS completes the reporting. Since a supplier may be dealing with several affiliates simultaneously, several scoring reports will be generated. These 3 Philips, Sun Micro Systems and DAF case study are performed by Beurskens (2002). 30
43 reports will be consolidated into one single report taking the lowest of all assessing centres for each criterion. The core is then communicated and reviewed with the supplier. An improvement plan is expected from consideration for the yearly company awards. The SRS project team will review the SRS performance system every two years. As an integral part of the continuous improvement program, Philips expects to progressively raise the target levels, expected of the suppliers. 4.3 Sun Micro Systems (SMS) SMS is a leading supplier of enterprise computing products that feature network stations and servers that store, process and distribute information. It is crucial for the company and its suppliers to build a solid relationship with aligned strategies. They have a global performance scorecard for suppliers in place, which is reviewed every quarter with the suppliers. The suppliers are being rated on several criteria which are discussed per commodity group and with the supplier. Each criterion carries a separate weighing, and scores are determined by a clear series of guidelines, which may differ by commodity group. Targets are to be achievable, challenging and slated towards achieving goals of greater significance. There are four main criteria that contribute to a maximum of 100 points: quality (30), leadtime/delivery/flexibility (30), technology (25) and support (15). Since a given supplier may ship multiple part numbers to a given site, and in addition may ship to multiple sites, a roll up procedure is used to calculate a global score for that supplier. The procedure works as follows: o Each item/ part number is given a different individual score, o The score is then weighted by its number of units purchased (relative to total unit purchases of the commodity from the supplier) o The individual roll ups are summed to obtain the site commodity score for the supplier. o Next a global roll up procedure again using a unit (or dollar) volume weighing, is applied to obtain the global Quality score for the commodity for the supplier. o The global scores are obtained for each of the four criteria and then are added to obtain the performance matrix total, which is multiplied by a price index to determine the overall score. o Finally the total cost of ownership (TCO) is calculated: TCO=((100-score)/100+1 The results are shown against the highest scores of other suppliers in that commodity area, thus highlighting relative performance. Currently SUN s suppliers start using it with their suppliers. 4.4 DAF DAF produces trucks of a global market place. As purchased goods hold a large percentage of sales value; monitoring and improving the supplier s performance is a core activity. The supplier Quality Assurance (SQA) employee is responsible for ensuring and improving the suppliers quality performance. 31
44 Therefore the SQA employee monitors the performance and calculates the number of complaints per supplier (data input in production) based on delivered volumes. The outcome are rated A/B/C (A best, C worst). The C suppliers ate contacted quarterly and improvement measures are implemented in the organization. The number of corrective actions (following a complaint) and the number of strategic improvement projects (following a C listing) are also monitored. The remarkable trends and outcomes and quarterly reported to the company board. One time per year the best quality supplier is awarded on a supplier s day, where DAF presents current trends and developments to her suppliers. 4.5 Conclusion The case studies show that all companies have a type of performance measurement system in place. Some systems are more elaborated than others. SMS uses a measurement system based on TCO, while DAF focuses more on Quality. RD uses a measurement system that focuses more on cost efficiency, in this case specific for transportation, while Philips uses a global and broad measurement system. While the systems are all different, one aspect is for all the same. They are all positive about the contribution of their Supplier Performance Measurement & Evaluation System. The most often used performance criteria are Cost (Price), Technology (Innovation), Quality, Time, Flexibility (responsiveness), Service (support). Especially the Innovation contribution of the supplier is an important performance aspect for RD. All described companies share the measurement results with their suppliers and promote continuous improvement. Some companies have a reward system in place, and some give out supplier awards. All companies use a type of supplier scorecard linked with ERP systems such as SAP. These elements should be considered for the design of a new SPMES. 32
45 5. INTERNAL ANALYSIS 5.1 Introduction This chapter describes and analyzes DSM s current working methods and practices related to supplier performance measurement and evaluation using a top down approach. The analysis is based on the comparison of DSM s current working methods and practices with those described in literature. The organization of the rest of this chapter is as follows. First, DSM s strategy and objectives are analyzed to understand DSM s corporate goals and supplier strategy. Second, DSM s Supplier Development Program (SDP) is analyzed, which forms the basis of DSM s effort for continuous improvement of suppliers. Third, DSM s supplier performance management is analyzed with special focus on DSM s supplier performance measurement, and evaluation system. Next, DSM s Enterprise Resource Planning (ERP) landscape is analyzed to understand DSM s possibilities to use technology for supplier evaluation. Finally, the methods and practices of five Business Groups (BG s) are analyzed to find optimization aspects that can be used for the design of a new and improved Supplier Performance Management System (SPMS) described in Chapter 6. The following five sub research questions (SRQ) are addressed in this chapter: Paragraph 5.2 answers SRQ 2.1: How does the current DSM strategy contribute to the continuous improvement of suppliers? Paragraph 5.3 answers SRQ 2.2: How does the current DSM supplier development program contribute to the continuous improvement of suppliers? Paragraph 5.4 answers SRQ 2.3: Which elements of DSM s supplier performance management contribute to the continuous improvement of suppliers? Paragraph 5.5 answers SRQ 2.4: How can DSM s IT-Systems contribute to supplier evaluation? Paragraph 5.6 answers SRQ 2.5: How is the current Supplier Evaluation Tool (SET) applied within the Supplier Performance Measurement Systems (SPMS s) of the Business Groups (BG s)? 5.2 Analysis of DSM s strategy Many authors in literature have stated that in order to have an effective performance measurement system, a company must at least align their corporate strategy with their supply strategy, goals, and objectives. This paragraph analyzes DSM s corporate mission and vision, purchasing strategy, and objectives to understand DSM s strategy elements for the support and DSM s drive for continuous improvement of suppliers. The following sub research question is addressed: SRQ 2.1: How does the current DSM strategy contribute to the continuous improvement of suppliers? 33
46 5.2.1 Corporate Strategy Every five years DSM reviews its corporate strategy program. DSM s current strategic direction is based on the following Vision 2010, called Building on Strengths: Enhance quality of our businesses through innovative growth of our specialties portfolio, building upon our leading position in sustainability with increased presence in emerging economies and continued implementation of operational excellence. DSM is shifting from a chemical based company towards a more specialty Life Science & Material Science company in order to grow faster, improve margins and improve quality earnings. DSM focuses on the following four emerging business areas: Personalized Nutrition, Specialty Packaging, Biomedical, and White/Industrial Biotechnology. This is a clear example of Mintzberg (1994) strategic aspects of perspective and positioning. Using Mintzberg s terminology, DSM s plan is to focus on the specialty market segments, make acquisitions, and sell BG s with products that don t fit DSM s strategic direction. DSM intends also to increase its presence in emerging economies. Within the strategy of DSM, innovation plays an important role. For DSM, innovations means searching for partners with promising new innovations and integrate these innovations with DSM s activities, sharing mutual benefits, and returning innovation benefits back to the society. Further, DSM wants to maintain and improve its leading positions in sustainability. DSM intends to develop better products and to support better health, eco-footprint and value propositions. Another strategic aspect is operational excellence that includes the standardization of processes, process improvements, energy savings, commercialization, and effective price control Purchasing Strategy DSM s purchasing strategy is derived from the corporate strategy: Ensure that DSM purchasing creates maximum value as an integral part of the business strategy, at minimal cost, with fully leveraging our capabilities and spend through a clearly governance structure. DSM s competitive strategy includes the input from understanding the organization s current situation, conducting industry analysis, and integrating Total Cost of Ownership (TCO). The business requirements, specifications and constraints are analyzed to understand the current situation. DSM s Industry Analysis is based on Porter s five force model and combines industry trends, supply market segmentation, and competitive forces. An important aspect within DSM competitive strategy is TCO. DSM uses TCO for price, usage, and process in order to understand, manage, and monitor cost and to reduce waste by optimizing business processes. DSM s strategy and objectives are focused on enhancing the quality of the businesses by developing sustainable supplier relationships, using effective and efficient purchasing techniques and by using well 34
47 established processes. For many of these objectives, DSM must collaborate closely with suppliers, which is further described in Paragraph Conclusion As described in the literature review, continuous improvement initiatives such as Supplier Performance Management (SPM) is a long- term process and cannot be seen as a short- term event. SPM should be developed over time, well deployed, maintained, and continuously improved. The literature review describes that companies often think that supplier evaluation and improvement aspects belong to one function, such as procurement or quality control, whereas SPM includes many stakeholders within the supply chain and therefore most often requires a multifunctional focus and participation. DSM s supplier strategy is derived from DSM s corporate strategy and supports above mentioned elements that are required for effective SPM and continuous improvement of suppliers. The summary below answers the sub research question 2.1: How does the current DSM strategy contribute to the continuous improvement of suppliers? DSM s strategy elements that support continuous improvement of suppliers: Corporate strategy supports: Willingness to change methods and procedures in order to continuous improve. Team up with partners in order to short- or long-term improve DSM businesses and share mutual benefits. Purchasing strategy supports: Sustainable and Innovative supplier relationships (long-term commitment). Efficient and effective purchasing: Use leverage by partnering, reward supplier cost reduction incentives, measure, and continuously improve suppliers, Improve methods and procedures and work towards Operational Excellence ). 5.3 Analysis of DSM s Supplier Development Program From the literature review, supplier development can be formulated as: any effort of a firm to increase performance and/or capabilities to meet the firm s short- and/or long-term supply needs (Krause 1997). Supplier development can range from a limited effort such as informal supplier evaluation and the request for improvement, towards a more extensive effort in which a company shares in-house knowledge and trains suppliers themselves, which is DSM s current ambition. This paragraph analyzes DSM s Supplier Development Program. The following sub research question is addressed: SRQ 2.2: How does DSM s Supplier Development Program (SDP) contribute to the continuous improvement of suppliers? 35
48 5.3.1 SDP objectives In 2006, DSM launched a Supplier Development Program (SDP). The main reason for this SDP was the large number of suppliers that DSM had to manage (more than 50,000). Many of those suppliers delivered their services or products without a contract or were not measured on their performance. At the same time suppliers who were strategic to DSM s business were often approached on purely commercial terms such as price and cost reductions. Thus, DSM was not using the full potential of strategic suppliers and in some cases the relationship with strategic suppliers had even deteriorated over the years. With the launch of the SDP, DSM s supplier development efforts shifted from a short term focus towards a more long term focus. In the short-term, DSM intends to focus on the measurement and improvement of operational aspects of suppliers such as cost, quality, delivery performance, and complaint handling. In the long term, DSM intends to focus on the continuous improvement and capabilities of true strategic suppliers by, increasing relationships and sharing in-house knowledge with the supplier. DSM s SDP has been rolled out over all BG s and its goal and importance are fully acknowledged SDP elements The first step within SDP is Supplier Performance Management (SPM), which includes the following four elements: I. Supplier segmentation: a tool which allows purchasing employees to classify suppliers as commercial, preferred or strategic. II. Supplier performance measurement: a list of essential performance criteria which BG s should use to measure the performance of the supplier. III Supplier evaluation and ranking: a methodology and tool aimed at achieving structural improvements with suppliers. IV Non-performance and complaint processing: a methodology to solve non-conformities and resolve customer complaints. DSM s SPM supports the first initial step of measuring, evaluating, ranking, and improving of new and current suppliers and includes efficient and effective purchasing which is further described in Paragraph 5.4 The second step of SDP is to use truly strategic suppliers for long-term relationships and commitment. DSM strategic suppliers are included within DSM account management. The focus of a DSM account manager is to work together with suppliers to seek opportunities to enhance DSM businesses and share mutual benefits with the supplier. The SDP recognizes three different long-term relationships ranging from developing new business, joint innovation programs untill ultimately strategic alliances with key suppliers. All elements of DSM s SDP are schematically shown in Figure

49 Figure 5.1: Elements of DSM s Supplier Development Program (SDP) SDP competitive advantage The SDP enables DSM to better utilize the capabilities of their most important suppliers. DSM is working with a database wherein all suppliers are ranked according to their relevant importance, that is commercial, preferred or true strategic suppliers. This enables BG s to choose suppliers who can really add value to the business. BG s can fully utilize the capabilities of strategic suppliers, for example with product innovation or the introduction of new technologies. DSM supports the continuous improvement from average / good suppliers towards good / excellent suppliers. However suppliers who are not meeting DSM s minimal requirements are removed from DSM s supply base. This allows BG s to focus on key suppliers and to measure, evaluate, and improve the approved suppliers in order to achieve a higher security of supply. By using a standardised way of working, the SDP enables faster processes and more transparency, and it enables new suppliers a much faster access into DSM s supply base Conclusion As described in the literature review, the development of key or critical suppliers has over the years become more important as outsourcing of products of services increased. Most companies are now more depended on their supplier performance, which also applies to DSM. An aspect of supplier development is supplier rationalizations or right-sizing. When DSM identifies and removes poor performers from its supply base it can fully focus on their key suppliers. The average and good suppliers can then be continuously improved towards good and great suppliers. 37
50 DSM s SDP includes elements that support the continuous improvement of suppliers. First, DSM uses supplier performance management to support the continuous improvement of suppliers in the short-term by working together with the supplier. Next, DSM focuses on truly strategic suppliers on the long-term by partnering and sharing mutual benefits. The summary below answers research question 2.2: How does DSM s Supplier Development Program contribute to Supplier Performance Measurement? DSM s SDP-elements that support the continuous improvement of suppliers: Corporate level supports: Strategic alignment between DSM and its suppliers. Supplier performance management supports: Simplification and focus of key or critical suppliers by reducing DSM s large supply base. The measurement, ranking, and evaluation of key suppliers. A method for the continuous improvement of key suppliers. Standardisation supports: Development of a (standardized) method for continuously improving supplier performance. Development of a method for (new) supplier qualification and integration within DSM. Working together (partnering) supports: Cooperation between suppliers and various BG s to increase efficiency by using leverage. 5.4 Analysis of DSM s Supplier Performance Management As described in the literature review, supplier performance management can be formulated as: The process of evaluating, measuring, and monitoring supplier performance, business processes, and practices for the purpose of reducing costs, mitigating risk, and driving continuous improvement (Gorden, 2008). DSM s Supplier Performance Management is an integral part of the Supplier Development Program (SDP). This paragraph analyzes four elements that are included within DSM s SPM: supplier segmentation (Paragraph 5.4.1), supplier performance measurement (Paragraph 5.4.2), supplier evaluation and ranking (Paragraph 5.4.3), and complaint handling and processing (Paragraph 5.4.4). The following sub research question is addressed: SRQ 2.3: What elements of DSM s supplier performance management system contribute to the continuous improvement of suppliers? 38
51 5.4.1 Supplier Segmentation As described in the literature review, supplier segmentation can be formulated as: an important business activity to maintain and improve the company s strategic position within the market place (Svensson, 2004). In order to determine which supplier to measure, a company needs to segment its supply base. This process divides suppliers into groups according to dependency, strategic importance, risk or cost associating with switching to a new supplier (switching costs). Supplier segmentation enables companies to apply the right amount of resources on the most important (key) suppliers in order to manage and improve or develop supplier relationships. DSM s segmentation is part of DSM s Industry Analysis and is based on the Kraljic approach. Kraljic (1983) developed a 4-phase portfolio approach. The purpose of the portfolio approach is to minimize supply vulnerability and make the most of potential buying power". The portfolio approach includes the following phases: 1. Classification: Determine in which segment a product group fits best. 2. Market Analysis: Determine bargaining position. 3. Strategic positioning: Identify opportunities and vulnerabilities. 4. Action plans: Develop and plan to implement. Kraljic classifies products on the basis of two dimensions: The importance of purchasing and supply risk (low and high). This results in a 2x2 matrix and classification into the following four categories: non-critical products, bottleneck products, leverage products, and strategic products (Figure 5.2). Figure 5.2: Kraljic (1983) matrix Figure 5.3: DSM s mirrored approach For each of the following quadrants of the Kraljic matrix, a different strategy is applicable (Ellram, 1997) For further details about the Kraljic matrix refer to Appendix C. Next to the Kraljic approach, DSM also 39
52 uses the supplier mirrored approach, which focuses on the bargaining position as in the supplier s point of view based on the following four key elements: development, core, exploitable, and nuisance (Figure 5.3). DSM segments suppliers into key suppliers (strategic and preferred) and commercial suppliers: Strategic suppliers are located in the strategic quadrant of the Kraljic matrix. With these suppliers, DSM wants to develop joint cost reduction programs, new business development or joint Innovation programs, and develop long-term relationships (or partnerships). Total Cost of Ownership (TCO) is an important aspect in this segment. Preferred suppliers are positioned in the leverage quadrant of the Kraljic matrix. Leverage products are also important for DSM. Suppliers in this quadrant are part of DSM s key suppliers list. For these types of suppliers often special framework contracts are developed. Commercial suppliers are located in the non-critical quadrant. These suppliers are not of strategic importance for DSM and therefore not further evaluated. Price is the most important selection criteria within this group. For bottleneck suppliers that have low strategic importance and high supply risk, DSM searches worldwide for suppliers in order to lower supplier dependency and move towards the non-critical quadrant. The reason for this is that DSM pursuits the Just in Time (JIT) principle. This means DSM want to avoid unnecessary safety stock and associated costs by always searching for enough capable suppliers. However, suppliers can be segmented in more than one group, this depends on the purchaser performing the segmentation. An example: strategic suppliers from a more corporate perspective, such as DSM Sourcing (DS) can be preferred suppliers from a Business Group (BG) perspective. This is remarkable, because for each segmentation group, purchasers should use a different strategy. For instance, the price criterion is important for commercial suppliers, but TCO is more important for strategic suppliers. This is the same for developing innovative and sustainable relationships. DSM uses an Excel tool to segment suppliers. Purchasers fill in an Excel file by giving grades to questions related to the amount of added value of suppliers. Segmentation questions are based on the following three different areas: Uniqueness of products services, business risks of products, joint development/ joint innovation, and the amount of patents in place. Critical to DSM business: Business risk of products, Joint development/ joint innovation, and the amount of patents in place Potential S Strategic Alliance: The competitive position vs. DSM, alignment with the DSM corporate strategy, financial stability, and supplier regards DSM as a strategic customer. 40
. The minimum score is 39 and the maximum score is 196.")
53 Each of the following criteria are ranked on a scale from 1-5, where 1 is a low score and 5 is high score. For each criterion the total score will be obtained summing up all scores (which are multiplied by a weighing factor). The minimum score is 39 and the maximum score is 196. The suppliers are segmented in the following three categories: Range: = Strategic supplier. Range: = Preferred supplier. Range: = Commercial supplier Supplier Performance Measurement You can't manage what you don't measure, is a well known management expression. Supplier performance measurement is one the most important elements within DSM s supplier performance management. DSM strategic purchasing processes include the analysis of spend & need, market analysis and strategy development. The tactical processes include the selection of suppliers and negotiations & implementation of the contract. The operational processes include the purchase requisitions, release procedure, source determination, purchase order processing, good receipt and invoice verification. Using the standard purchasing process of Van Weele (2008) to visualize DSM s measurement and evaluation tool (SET), DSM s supplier performance measurement can be used as the input for the evaluation and ranking of suppliers. The outcome of supplier evaluation can then be used for the respecification, re-contracting and focus on the continuous improvement of key suppliers (Figure 5.4). Figure 5.4: DSM s Supplier Evaluation Tool (SET) within the Purchasing process. The evaluation can also be used to reduce DSM s supply base removing those suppliers that are not meeting DSM s minimal criteria requirements. Supplier account managers are responsible for the process 41
54 of developing new business, joint innovation programs, and ultimately strategic alliances with truly strategic suppliers. The Business Groups (BG s) are responsible for the measurement and evaluation of suppliers. Within DSM, every BG has their measurement system in place, currently there is no standardisation. DSM Sourcing (DS) supports BG s when support is requested and DS evaluates (not measures) suppliers themselves when multi-source suppliers need to be evaluated. This means evaluating suppliers that deliver goods or services to more than one BG. In such a case, the required BG sends their supplier measurement results to DS for further evaluation. As described in the introduction, DSM purchases a wide range of different chemicals and uses different transportation methods (trucks, train, barges, and pipeline). According to DSM, a standardised overall measurement approach for all materials and products is too complex and should not be implemented. Instead, DSM developed a Supplier Evaluation Tool (SET). The SET allows BG s to qualify new suppliers and develop improvement plans for preferred and strategic ( key ) suppliers using a standardized approach. The SET allows BG s to evaluate suppliers using at least the minimal, most important performance criteria. The SET is mandatory for all BG s and is currently being rolled out throughout the organization. The SET is divided in four Critical Success Factors (CSF s) as further visualised in Table 5.1. I. Security of supplier II. Business commitment III. Quality assurance IV. Sustainability The SET includes four main CSF s and fifteen related sub CSF s. Only examples KPI s are given with the SET. BG s are responsible for developing their relevant set of KPI s and performance measurement system. The SET includes CSF s that are more operational related (1,11,14), tactical related (2,3,5,6,8,10,12) and strategic related (4,7,13,15). The operational related CSF s and derived KPI s are used to measure the day-to-day operations at the plant such as delivery on time, quality, quantity, and plant safety aspects. Tactical and strategic KPI s are not measured everyday but include aspects that are included in DSM s strategy. All the CSF s are used for the evaluation of suppliers. For key suppliers this evaluation occurs at least once every year and for commercial suppliers once every two or three years. The SET does not prescribe in what way BG s have to measure the performance of their suppliers. The scoring process starts with the collection of data needed to score the various KPI s. DSM Sourcing encourages BG s to use quantifiable data to determine scores, including non-conformity reports or questionnaires, where possible. However, some KPI s are more qualitative and should be scored by 42
55 purchasers with the most knowledge about the specific aspect of the supplier's (or DSM's) performance. Scores are filled in by purchasers on the individual CSF worksheets and comments can be added below each KPI when required. When the scoring process is finished, the worksheets are uploaded on DSM s intranet. DSM s CSF s & sub CSF s I. Security of Supply: 1. Delivery (on- time, undamaged and complete) 2. Supply assurance 3. Flexibility II. Business Commitment: 4. Strategic alignment 5. Resource allocation 6. Continuous improvement 7. Innovation 8. Market information III. Quality assurance: 9. Specifications/functional scope 10. payment performance (Invoice accuracy) 11. Documentation availability 12. Complaint management IV. Sustainability: 13. Program/ Compliance to policy 14. Proven performance on SHE 15. Initiatives to reduce carbon footprint Table 5.1: DSM s Supplier Evaluation Tool (SET). Source of data used: [Non Conformity observations] [Non Conformity observations] [Non Conformity observations] [Non Conformity observations] [Non Conformity observations] [Non Conformity observations] [Observations] [Non Conformity observations/ Risk-items, showstopper] [Non Conformity observations] The SET is developed to act as a 2-way (360 degree) evaluation process where DSM and the supplier evaluate each other. Currently the SET only acts as a 1-way evaluation process where DSM evaluated the supplier, which the results are shared with the supplier for improvement purposes. In addition, some BG s send questionnaires to suppliers requesting to score DSM on service quality level. The literature review in Chapter 3 concludes that a good performance measurement system typically comprises the following characteristics (Table 5.2). This framework is used to analyze DSM s SET. For the analysis, a 5-point scale is used: ++, +, 0,,. Where: ++ indicates full compliance with literature. + indicates above average compliance 0 average compliance (minimal acceptance level) Indicates below average compliance zero compliance 43
56 A brief description is given for each of the thirteen characteristics. Characteristics of a good Performance Measurement System: Individual measures characteristics: 1. Must be objective 2. Be incapable of mall usage 3. Dynamic over time 4. Must be clear (easy to understand) 5. Should provide fast feedback 6. Can vary between locations. 7. Simple to use 8. The purpose of each performance criterion must be clear Performance measurement system characteristics: 9. Must be linked with corporate strategy and objectives 10. Stimulate continuous improvement rather than simply monitor. 11. Comprises a balanced mixture of qualitative and quantitative criteria. 12. Requires accurate and available data. Performance measurement system & the environment characteristics: 13. The performance measurement system should match the existing reward system DSM s SET Table 5.2: DSM s Supplier Evaluation Tool (SET) compared to characteristics of a good PMS. 1. The objectivity is not high because most of the tactical and strategic measurements are based on subjective evaluation of the purchaser. These subjective evaluations are often performed directly and often in hast and therefore lack of objectivity. Only the operational KPI s are based on objective quantitative data. 2. SET can be mall used. The purchaser who is responsible for filling in the performance worksheet is also responsible for supplying the data. Most of the data is not easy accessible from SAP and cannot easily be checked. The use of automated or computerized systems can make SET less susceptible to data mall usage. The BG s currently are using different SAP versions and fully rely on On-Time In-Full (OTIF) system based on Microsoft Excel. 3. The measures are dynamic over time. Since the introduction of the SET in 2006, there were several modifications made. Every year, SET is reviewed and modified accordingly. 4. Measurements are not always easy to understand. An outcome of the interviews performed was that purchasers from various BG s found certain measures, such as Carbon Footprint or Innovation not clear and well defined within SET. 5. SET itself provides fast feedback with graphs. However the analysis for multiple BG s and written comments can take a lot of time (it is not automated). 44
57 6. SET should recognize that measures vary between locations. One measure is not suitable for all departments or sites. An example is the use for product quality. The quality of oil flowing through the pipeline is at a standard quality (never checked), while oil delivered by train is not of standard quality and is always checked. 7. Simple to use: The KPI s are in general easy to use. 8. The purposes of the measures are not always clear. There is no clear distinction between the different types of KPI s (operational, tactical, and strategic) within SET and employees who use operational performance measures are not always familiar with the purpose of tactical and strategic KPI s and vice versa. 9. DSM s CSF s and related KPI s are not fully linked to DSM s strategies and objectives. It is remarkable that the criterion Cost is currently not incorporated within DSM s Supplier Evaluation Tool (SET), while Total Cost of Ownership (TCO) is incorporated within DSM s strategy and objectives. 10. The measures should be designed in such a way that they stimulate continuous improvement rather than simply monitor. This aspect is implemented and SET uses an automatic ranking mechanism, in order to determine whether or not an improvement plan is required. 11. The qualitative and quantitative measures are not balanced out. 12. BG s most often use subjective information for supplier evaluation. BG s do not fully rely on all the quantitative data that is required for most operational and tactical KPI s. Some of the measures are not easy to retrieve such as invoice accuracy which is measured by employees from the BG administrative office and this data is not easy accessible for purchasers. Other measures are not easy accessible from DSM s ERP- System SAP. 13. DSM does not have a supplier reward system in place, while the performance measurement system is extensive Supplier Performance Evaluation & Ranking According to the literature review, the evaluation and ranking of suppliers is required to determine the score and service level of the supplier for improvement purposes. DSM s performance ranking is performed in supplier teams, and the results are discussed with the suppliers. Suppliers are ranked into four groups as specified in Table 5.1 Improvement points and improvement programs are agreed upon formally with the supplier and progress is tracked and reported upon on a quarterly basis. For each of the four CSF s and fifteen related KPI s, a specific scoring criterion is used. Scores can range between 1-5 for every KPI, with 1 being the lowest score and 5 being the highest score. Purchasers have to enter the scores on individual CSF worksheets, which will then automatically calculate the end score of 45
58 the supplier. There is the possibility to enter comments below each KPI if required, which can later be used for supplier improvement purposes. The total score will be obtained by summing up all the scores (which are multiplied with a weighing factor). The minimum score is 0 and the maximum score is 5, as visualized in Figure 5.5. Supplier ranking A, range: Supplier ranking B, range: Supplier ranking C, range: Supplier ranking D, range: Strategic suppliers must score at least an A, whereas preferred suppliers should score at least a B and commercial suppliers a C. In all cases where the supplier does not meet the required minimum score, an improvement plan has to be developed. If a supplier is appraised at a D level, this supplier will be replaced as soon as is commercially feasible. Within sustainability, program/ compliance to policy (ref. 5.2 KPI 13) acts as a show stopper, because when not signed, it will lead to immediate disqualification (and replacement) of the supplier. Figure 5.5: Results of SET with graphic representation and follow-up. DSM does not have a standard method to improve suppliers, but the improvement plans of most BG s most often includes the following four key elements: Description of the problem(s). 46
59 Corrective actions points that have to be taken by the supplier. Timeframe for the supplier to improve deficiencies. Re-evaluation of the agreed action points Non-performance & Complaint Processing According to the literature review, a Complaints Management System (CMS) can help in several areas, such as identifying general improvements areas and enabling KPI measurement. Within DSM, Complaints Management (CM) differs between BG s. DSM recognizes the following three types of complaints: supplier complaints, customer complaints, and material complaints. Only customer complaint handling is described by DSM s standardisation process (SAP/Apollo). Apollo is a DSM-wide business process initiative developed by and for the BG s to build, secure, implement, and enhance standard business processes with the use of standard software SAP. The supplier complaint process is not standardised because of the specific rules that are created by the BG s to trigger a complaint. The BG s also differ in the way complaints are registered. Some BG s use SAP for managing complaints, while other BG s use a spreadsheet or other documents Conclusion Supplier performance management is an important aspect of DSM s Supplier Development Program (SDP). With a special Supplier Evaluation Tool (SET) DSM can regularly evaluate and rank key (preferred and strategic) suppliers on Business Commitment, Security of Supply, Quality and Sustainability aspects. DSM s Supplier Performance Management (SPM) is designed to be: Mandatory for all key suppliers, stimulate a two-way dialogue between DSM and the supplier, includes operational performance data from ERP systems and should be connected with the non-performance management systems as they exist in the BG s. Currently, the SET has been rolled out throughout DSM. It acts as a 1-way evaluation process, where DSM evaluates the supplier. In addition, some BG s send questionnaires to suppliers requesting to score DSM on service quality level. Currently, BG s fully rely on traditional OTIF techniques (Non-SAP), which include the required set of evaluation criteria from SET. Currently, there is no standardized Complaint Management System (CMS) in place. The summary below answers SRQ 2.3: What elements of DSM s supplier performance management system contribute to the continuous improvement of suppliers? 47
60 DSM s Supplier performance management support the continuous improvement of suppliers: Segmentation supports: Simplification and focus of key or critical suppliers. Supplier performance measurement supports: Understanding the supplier s performance with the ability to set goals. Evaluation and ranking supports: Development of a standardized method for continuously improving the supplier performance. Development of a method for (new) supplier qualification and integration within DSM. Complaint management supports: A method to solve supplier and customer complaints. 5.5 Using Technology for Supplier Evaluation It is important to understand DSM s IT-Systems related to supplier evaluation, in order to include these elements within the new SPMS. Enterprise Resource Planning (ERP) software like SAP provides software that can automatically analyze, rank and compare suppliers on their performance. Next to other software, DSM uses a modified version of SAP (called SAP/ Apollo), which includes several add-on modules and other software packages that can be used for supplier evaluation. This paragraph focuses on DSM s IT-Systems related to supplier evaluation and in specifically on the following add-on modules and other SAP software. DSM can use different software elements to collect, track, analyze, and give insight into the supplier performance. The following research question will be addressed: SRQ 2.4: How can DSM s IT-Systems contribute to supplier evaluation? DSM s Apollo organization The DSM organization includes BG s which before were stand-alone companies with their own methods, procedures and IT-Systems in place. Therefore, DSM created an organisation within business support called Apollo in order to standardize and align business processes in combination with the functionalities of SAP software between BG s. The Apollo organization is responsible for the design and implementation of DSM-wide best practice standard business processes across BG s and supports the BG s in four main areas: business steering and organization, processes, organization, and IT-Systems as visualized in Table 5.3. The Apollo program started in 2005 and has been rolled out throughout the organization. DSM s business processes are 48
61 continuous updated and improved since. The research study focuses on DSM s implemented SAP (R/3) architecture, SAP-SRM, and SAP-BW, as visualized in Table 5.3 ITresearch DSM s Apollo umbrella for Business Groups focus Business steering & Processes Organization IT- systems organization Enterprise PTO/OTC Authorizations SAP-R/3 models Principals Planning Roles functions SAP-SRM Reseller Sourcing Training SAP-BW Toller Maintenance Support SAP-MDM Agents Service Procedures SAP-BSC Management Shared Service Finance Bwise centres Fiscal/Legal Emptoris Table 5.3: Apollo s umbrella and IT- research focus DSM s IT-Landscape The current DSM software deviates from the standard SAP software and can include company specific elements. SAP uses a concept of modules that can be individually purchased and are build upon a central SAP component. Currently, BG s have the freedom to use SAP for supplier evaluation, but it is not obligated. Most BG s fully rely on the more traditional non-sap techniques, such as On-time in Full (OTIF), which is based on Microsoft Excel. BG s can use different ERP-modules and software for the gathering of information data, referred to as Business Intelligence (BI), as visualized in Figure 5.6. The following IT-Systems and modules are related to supplier evaluation: Material Management (MM), Quality Management (QM), Supplier Relationship Management (SRM), and Business Warehouse (BW). 49
62 Business Intelligence Figure 5.6: DSM s IT-landscape related to supplier evaluation. It is important that SAP-modules and software are standardised by Apollo in order to have the ability to exchange information data between BG s for supplier evaluation. Appendix F describes which elements are supported by Apollo and can be used for the design of a new and improved SPMS. Summary DSM is using a modified version of SAP, called SAP/ Apollo. Only Apollo supported modules and software can be used for supplier evaluation, because only then information data can be exchanged between BG s and procedures are in place Conclusion DSM can use a wide range of SAP modules and other software for supplier evaluation. However, not all the elements within the software are (yet) supported by Apollo and can be used for supplier evaluation. The operational related performance criteria: Delivery, Quantity, and Quality can be measured in SAP-MM. (the criterion Quality is classed similar to Goods receipt ). The functionalities of SAP-QM and SAP-SRM are (still) limited. Following an overview of standard SAP performance criteria, which are either supported by Apollo in SAP (indicated with ) or not (yet) supported by Apollo in SAP (indicated with -). 50
63 SAP-MM (R/3) SAP-QM (R/3) SAP-SRM Apollo supports: Apollo supports: Apollo supports: Price Level - Quality in procurement Shopping cart Price History - Quality planning Approval Goods receipt - Quality inspection - Purchase order - Quality audit - Quality certification - Goods receipt - Complaints/Rejection Quality notification (Confirmation). Level On-time delivery Quantity reliability (Only customer complaints are supported by Apollo) - Invoice confirmation: - Confirmation data - Compliance to shipping instructions 5.6 Analysis of DSM s measurement practices For the analysis of the BG s DEE, DEP, DEX, DFI, and DR, eighteen semi structured interviews were performed. This paragraph describes how the current Supplier Evaluation Tool (SET) is applied within the Supplier Performance Measurement Systems (SPMS s) of the BG s. First, the SET is compared to the IT- Systems that are in place at the BG s. Second, the best evaluation method and best practices are indentified, which can be used as input for the new and improved SPMS design described in Chapter 6. The following research question is addressed: SRQ 2.5: How is the current Supplier Evaluation Tool (SET) applied within the Supplier Performance Measurement Systems (SPMS s) of the Business Groups (BG s)? DSM s BG s measurement practices Many of the (new) BG s are acquired from other companies and still have their own culture, working methods, and procedures in place. However, the BG s should use the selected supplier evaluation criteria that are included within DSM s SET, as basis for supplier evaluation. The outcome of the interviews can be summarized as follows: The BG s have an On-Time In-Full (OTIF), or OTIF-like based PMS in place. The BG s most often use Microsoft Excel to measure and analyze the performance of the supplier. For products delivered by trucks, the most often used operational performance criteria are: Delivery on-time, Quantity, Quality, Documentation, and Safety. Some BG s use other names such as Volume or Time, which are classed similar to Quantity and Delivery on-time. 51
64 BG s found it difficult to use the performance criteria Sustainability and Innovation for the evaluation process. Currently, BG s use these criteria in a qualitative (subjective) way for the supplier evaluation. Also, the purpose and evaluation aspects of Sustainability and Innovation are not clear. The BG s differ in the use of operational performance criteria. It depends on how the products are transported (by truck, railroad, pipeline or barge). Most of the operational performance criteria are used for products delivered by truck, railroad, and barge. There is however an exception for products transported through pipeline. These products are always flowing through the (European) pipeline network, and have 100% reliability and standard (100%) quality. The BG s that purchase products through pipeline do not measure these performance criteria. The BG s also differ on the quality inspection. Some BG s check all the critical products and use samples every time. Others rely on the Certificate of Analysis from the supplier and randomly check inbound deliveries, or not even check the quality until a customer complaint is triggered. The communication differs also between BG s. Some call their suppliers on a monthly basis or organize supplier meetings and others do not speak until a complaint occurs and a problem has to be resolved. Not one BG is using SAP for supplier evaluation. BG s are free to use SAP for supplier evaluation, it is not obligated. One of the reasons that BG s do not use SAP is that they think that the SAP-Master Data within the system is unreliable and cannot be used for supplier evaluation. Secondly, the BG s stress that SAP does not include enough possibilities to reflect BG-specific needs, as visualized in Table 5.4. Another reason is that it is not (yet) possible to combine DSM s IT-systems for the use of supplier evaluation. There is no direct link and follow-up is not possible. BG s are also limited to the performance criteria and functionally within SAP-MM. Also sometimes SAP training is missing and BG s do not fully understand the advantages for using SAP for supplier evaluation. Business Groups needs: Standard SAP R/3 functionalities: Security of supply Price Competitiveness Quality SHE (Safety, Health, Environmental) Delivery Quality General service/support Technical support External Service provision Table 5.4: SAP R/3 functionality compared to the needs of the BG s 52
65 5.6.2 Conclusion Currently, the BG s have customized Supplier Performance Measurement System (SPMS) in place and are using a different set of performance criteria for supplier evaluation. However, the BG s should use the selected supplier evaluation criteria that are included within DSM s SET, as basis for supplier evaluation. The outcome of the interviews can be summarized as follows: Summary of results: Key results: SET related: SAP related: 6 out of 6 BG s have an OTIF- based evaluation system in place. 0 out of 6 BG s use SAP for supplier evaluation for several reasons. The purpose and measurement aspects for the performance criteria Sustainability and Innovation are not clear. Mostly qualitative (subjective) methods are used for supplier evaluation. The BG s are free to use SAP for supplier evaluation, it not obligated. The BG s describe that SAP does not does not include enough possibilities to reflect BG-specific needs (this has not been researched). SAP-Master Data is unreliable for several reasons. The knowledge and advantages of using SAP for evaluation is sometimes missing DSM s New Design Elements For the design of a new and improved SPMS (Chapter 6), the results of the SET-analysis and BG-analysis are included. The following elements will be considered: SET related elements: Reducing and improving the amount of CSF s and related KPI s in SET. BG s related elements: The most important CSF s and related KPI s for supplier assessment should be determined. The purpose and measurement aspects for the performance criteria Sustainability and Innovation should be clearer. The possibility of using SAP for supplier evaluation should be considered. A method should be developed to increase the reliability of SAP-Master Data. An analysis should be performed on how different sets of performance criteria can be shared and combined between BG s for supplier evaluation. Develop a set of Implementation aspects for the new and improved SPMS design. 53
66 6. DESIGN OF DSM S NEW SPMES 6.1 Introduction This Chapter describes the design of an improved Supplier Performance Management & Evaluation System (SPMES) for DSM. An important aspect for DSM s SPMES design is to determine a set of Critical Success Factors (CSF s) and Key Performance Indicators (KPI s), also referred to as DSM s set of performance criteria. First, the most important performance criteria derived from literature (Chapter 3), from an external company analysis (Chapter 4), from internal BG analysis and best practices (Chapter 5) are described in Paragraph 6.2. Next, the strategic performance criteria (Paragraph 6.3), tactical performance criteria (Paragraph 6.4) and operational performance criteria (Paragraph 6.5), are further described in more detail. For each of the performance criteria, DSM s possibilities of using SAP-software for supplier evaluation are further described. The final SPMES design that includes a combined set of performance criteria linked with DSM s IT-Systems, the functional requirements, and a complaint management system are described in Paragraph 6.6. For the new SPMES, a distinction is made between supplier selection performance criteria and assessment 4 performance criteria (see also Figure 6.2). The literature review describes that certain performance criteria require more emphasis in the selection step or evaluation step of van Weele s purchasing process (Figure 5.4). In literature it is argued, that the implementation of the Just- In Time concept leads to more single sourcing, closing long-term contracts and work contracts with local suppliers. Supplier selection is not just about the purchase price, but more the overall of the total cost, i.e. costs including the waste that results from poor suppliers performance, safety stocks, quality and inspections and production standstills. This kind of supplier relationship should be included in an agreement on Total Cost of Ownership (TCO). This chapter focuses on the assessment performance criteria. The changes that are required within the DSM s selection step are further described in Paragraph 7.3. This chapter ends with a summary of results in Paragraph 6.6, which includes a detailed overview on how the current SPMES can be further improved and optimized. This chapter answers the following sub research questions (SRQ s): Paragraph 6.2 answers SRQ 2.6: Which set of supplier assessment performance criteria are important for DSM based on criteria from literature, external company analysis, and internal BG documents and best practices? 4 The term assessment is defined in literature as a broader term compared to supplier evaluation and comprises the collection and analysis of information as well as the evaluation of suppliers. 54
67 Paragraph 6.3 answers SRQ 2.7: What are the most important related KPI s for strategic related CSF s and how can these criteria be used with SAP for supplier evaluation? Paragraph 6.4 answers SRQ 2.8: What are the most important related KPI s for tactical related CSF s and how can these criteria be used with SAP for supplier evaluation? Paragraph 6.5 answers SRQ 2.9: What are the most important related Key Performance Indicators (KPI s) for operational related Critical Success Factors (CSF s) and how can these criteria be used with SAP for supplier evaluation? Paragraph 6.6 answers SRQ 2.10: Which IT-Systems and functional requirements are important for an effective SAP supplier evaluation, based on the decision set of performance criteria? 6.2 Developing DSM s set of performance criteria The new SPMES design is developed from findings from the literature review, external company analysis, and from internal analysis of DSM s documents and best practices. These three elements are now described in more detail. The following research question is addressed: SRQ 2.6: Which set of supplier assessment performance criteria are important for DSM based on criteria from literature, external company analysis, and internal BG documents and best practices? Literature derived performance criteria Paragraph describes that performance measures should be Specific, Measurable, Achievable, Realistic, and Timed (SMART) and should at least reflect DSM s corporate & purchasing strategy and objectives. Therefore, elements such as Sustainability, Innovation, and Cost, which are important for DSM, should be considered for the design of a new improved SPMES. Paragraph describes that the following CSF s are most often used for supplier selection and assessment: Quality, Delivery, Time, Cost, Price, Flexibility, Responsiveness and Service. Most of these CSF s are related to each other and often synonyms are used. CFS s such as Quality and Time are for instance related to delivery performance, where as Flexibility and the willingness for the supplier to participate are classed similar to Responsiveness. Paragraph also describes that a good performance management is based on: effective supplier selection process, innovative supplier development strategies, and efficient supplier assessment procedures. The selection step is important because it includes the performance criteria on which the supplier later is evaluated. Therefore, an efficient selection process with the use of the right performance criteria can reduce or prevent problems later on. An efficient supplier assessment is necessary for the evaluation and continuous improvement of the capabilities of the suppliers. 55

68 DSM s supplier development strategy should eventually lead to a better overall efficiency and a lower Total Cost of Ownership (TCO), which is visualized in Figure 6.1. Thus, a clear supplier strategy with the right set of performance criteria should be considered for the design of a new improved SPMES. Figure 6.1: the continuous improvement of the supplier's capabilities reduces TCO. One of the key elements of a good SPMES is to have a balanced set of hard (quantifiable) and soft (qualitative) criteria (Paragraph 3.8.1). Hard criteria such as Price, Delivery, Quality and Service aspects are relatively easy to quantify, while soft criteria such as Management compatibility and Strategic direction are more difficult to quantify. A remarkable aspect of the literature review (Paragraph 3.8.3) is that companies most often use hard criteria for the supplier selection and assessment process. However, literature studies also show that soft criteria are just as important or even in some cases more important then hard criteria. Kannan (2002) performed an elaborated research study amongst 4,500 companies (mostly manufacturers) on the impact that supplier selection and assessment have on a company business performance. Kannan s research came up with some remarkable findings. First, his research concludes that soft targets like commitment to a buyer have a greater impact on performance than hard quantifiable criteria. This is supported by Ellram (1990), who states that especially in the supplier-buyer strategic relationships soft factors are increasingly important within the selection process. Another remarkable finding was that the willingness of the supplier to share information and to cooperate has a significant impact on performance, but is yet considered to be less important. Kannan suggests that the focus in the supplier selection process is shifting from the traditional hard and quantifiably performance aspects towards the softer and more qualitative aspects in the supplier-buyer relationship. Thus, both hard and soft performance criteria should be considered for the design of a new improved SPMES. Paragraph 3.9 describes that too many performance criteria will lead to an increase in time (and cost) that are spend for the evaluation of the supplier. Too many performance criteria will only lead to less cooperation and support from purchasing managers. Too many means in this context the amount 56
69 performance measures by which users loose their focus of the performance measures and measurement system. DSM s current SET does not distinct between the emphasis of performance criteria in the selection and assessment process and includes many performance criteria. Thus, the new SPMES should include a distinction between supplier selection and supplier assessment and should emphasize the different performance criteria used within DSM s purchasing process. Paragraph 3.11 describes that companies can use technology such as SAP to improve the supplier evaluation process. An investment in these software tools have most often a quick payback period, referred to as return of investment. By reaching more suppliers, more realistic supplier insight can help companies to avoid risk, save time, and to identify improvement opportunities and eliminate drivers. However, the difficulty about using technology instead of using traditional evaluation techniques such as On-Time in Full (OTIF) methods is that it requires a link between IT-Systems, reliable data, and performance criteria that can be included within the IT-System. Hard criteria such a Delivery, Quality or Service are easier to add in these systems than qualitative performance criteria. Thus, the advantages and disadvantages using technology such as SAP for supplier evaluation should be considered for the design of a new improved SPMES External company analysis performance criteria The case study performed and the three case studies from literature (Chapter 4) conclude that the CSF s which are most often externally used are: Quality, Time, Cost, Flexibility, Innovation and Service. Of which Cost, Quality, and Innovation were highlighted as the most important CSF s. Paragraph 4.3 describes that for most companies, cost reduction is more than just getting a better price. An important aspect is also to eliminate cost drivers because price reductions may not be sustainable for suppliers. Methods such as improving company methods and procedures, building a long-term relationship, and sharing mutual benefits are also important to reduce cost. Paragraph 4.2 describes that the performance criterion Quality is also important, because it has a direct impact on the product or service. The criterion Quality is also a cost driver, because when quality is not according to specifications it can cause rework, re-shipping, increased inventory, and customer dissatisfaction and complaints. Paragraph 4.1 & 4.3 describes that Innovation is an important performance criterion, because it enables companies to outperform competitors. The productivity of outperforming companies grows faster when more is invested in innovation and differentiation. Thus, the performance criteria Cost, Quality and Innovation should be considered for the design of a new improved SPMES. 57
70 6.2.3 Internal analysis performance criteria The internal analysis (Chapter 5) concludes that the most often used CSF s are: Quality, Delivery, Sustainability, Innovation, Flexibility, Service, and Information sharing. Of which Quality, Delivery, Flexibility, and Service were highlighted by the BG s as the most important CSF s, while Sustainability and Innovation were corporate requirements. It is remarkable that the criterion Cost is currently not incorporated within DSM s Supplier Evaluation Tool (SET) (Paragraph 5.4.2), while TCO is incorporated within DSM strategy and objectives. Thus, the performance criteria Cost should be considered for the new SPMES. Sustainability is also important for DSM. DSM intends to maintain and improve its leading position in Sustainability (Dow Jones Sustainability World Index) by developing better products, supporting better health, better eco-footprint, and increasing value propositions. Despite the fact that Sustainability is not fully embedded in the current supplier strategy, it will be fully embedded in the vision strategy of Thus, the criterion Sustainability should be considered for the new SPMES. The CSF Information sharing is also important for DSM. This element is reflected in the Supplier Development Program (SDP), which supports a strategic supplier-buyer relationship. This is also supported by literature where Information sharing is stated to be an important soft criterion that can be used to improve DSM s performance in long-term relationships. Thus, the criterion Information sharing should be considered for the new SPMES. Paragraph 5.6 describes the analysis of DSM s SET compared to the BG s OTIF methods used in practice For further detail refer to Appendix Y & Z. The results conclude that Innovation and Sustainability were often included in SET as a subjective qualitative aspect, because purchasers found it difficult to assess these criteria more objectively. Thus, clearer and better defined criteria for Sustainability and Innovation should be considered for the new SPMES. The BG s analysis also shows that not a single BG uses SAP for supplier evaluation, because BG s found that most information stored in the system was not fully reliable and can therefore not be used for supplier evaluation. One of the reasons for this was that changes made in delivery time and quantities were not adjusted in the SAP-system accordingly. Another reason why BG s do not use SAP is that BG s have specific needs that do not fully align with the functionality of SAP. The current version does not fully incorporate all the BG needs for supplier evaluation. Also, qualitative performance criteria are more difficult to include in SAP. Another aspect is that BG s often bundle Purchase Orders (PO s) in one big order. SAP can only evaluate these orders when all orders are fully received, which makes the evaluation 58
71 of day-by-day good receipts using SAP more difficult. Thus, the reliability of SAP-Master Data, the BG s needs, and the possibilities for using SAP for bulk products should be considered for the new SPMES DSM s new set of performance criteria From the analysis of literature, external company analysis, and internal documents and best practices, the SPMES can be divided in supplier selection criteria and supplier assessment performance criteria, as visualized in Figure 6.2. The most important selection criteria in literature are: Quality, Price, and Delivery. In general these aspects are considered factors that create competitive advantage for a company. However, for the development of long-term relationships DSM should also focus on Strategic commitment, Innovation, and Sustainability aspects within the selection process, which are important for DSM s current strategy. However this research focuses on DSM s supplier assessment. Therefore, the performance criteria for DSM s selection process are further described in Paragraph DSM s supplier assessment criteria include strategically related CSF s, tactical related CSF s, and operational CSF s which are visualized in Figure 6.2. Design Input Design Output Literature Review: Supplier Selection Performance Cost, Delivery, Responsiveness, Service, Flexibility. Criteria: (Chapter 3) Clustered: Strategic Commitment, Strategic Fit, Capability, Honesty/Integrity, Case studies: Ability to meet buyer needs (Paragraph Cost, Innovation, Quality, Time, Flexibility. Service Supplier Assessment Performance 7.2.1) (Chapter 4) Criteria: (Chapter 6) Strategic: Sustainability, Innovation. Internal Analysis: Tactical: Cost, Flexibility, Service, Quality, Delivery, Service, Flexibility, Information Sharing, Information sharing. Innovation, Sustainability (Chapter 5) Operational: Quality, Delivery. (Chapter 5) Figure 6.2: DSM s new performance criteria set-up for supplier selection and assessment. DSM s strategic CSF s include the performance criteria Sustainability and Innovation, visualized in Table 6.1. The strategic performance criteria are important for DSM, because these criteria are incorporated within DSM s corporate strategy and objectives. The measurement aspects for the performance criterion Sustainability are based on a sustainability questionnaire that includes questions that are linked to a scoring method. The measurement aspects for the performance criterion Innovation 59
72 are based on an innovation questionnaire that includes questions that are also linked to a scoring method. The research questions are further described in more detail Paragraph and Paragraph Strategic performance criteria: Measurement aspect: Measurer: Method: Sustainability Sustainability questionnaire Paragraph Semi- Quantitative Innovation Innovation questionnaire Paragraph Table 6.1: The recommended new set of strategic performance for DSM s SPMES Semi- Quantitative DSM s tactical CSF s include the performance criteria Cost, Flexibility, Service, and Information sharing. The tactical performance criteria are less critical for DSM production process but are important to improve DSM s business processes. An exception is made for the measurement aspect invoice accuracy which is closely related to DSM s operational performance criteria. This measurement aspect is important for supplier evaluation but is not of critical importance for DSM s operational business processes. The measure aspects for each of the performance criteria are visualized in Table 6.2. The measures of these CSF s are further described in respectively Paragraph to Paragraph Tactical performance criteria: Measurement aspect: Measurer: Method: Cost Invoice accuracy Price setting Paragraph Quantitative Flexibility Ability to adjust to changes of plans Paragraph Qualitative Service Ability to follow-up complaints accordingly Paragraph Qualitative Information Sharing Willingness to share Paragraph Qualitative market information Table 6.2: The recommended new set of tactical performance criteria for DSM s SPMES DSM s operational CSF s include the performance criteria Quality and Delivery. The operational performance criteria are critically important for DSM s day-to-day business processes at the production facilities. The measurement aspects for each of the performance criteria are visualized in Table 6.3. The measures of these CSF s are further described in Paragraph and Paragraph
73 Operational performance criteria: Measurement aspect: Measurer: Method: Quality Product quality Package quality Paragraph Quantitative Delivery On-time delivery Paragraph Right quantity Right documents According to Safety, Health, and Environmental (SHE) policy requirements Table 6.3: The recommended new set of operational performance for DSM s SPMES Quantitative 6.3 Strategic Performance Criteria This paragraph describes DSM s strategic related CSF s and KPIs. The performance criteria Sustainability and Innovation are important for DSM, because these criteria are incorporated within DSM s corporate strategy and objectives. According to the literature review these criteria are increasingly effective with stronger buyer-supplier relationships. First, for every CSF a definition is formulated. Next the corresponding KPI s are defined and linked to DSM s current working methods and practices. Following, for every KPI, the possibilities of using SAP for supplier evaluation is further described. The following research question is addressed: SRQ 2.7: What are the most important related KPI s for strategic related CSF s and how can these criteria be used with SAP for supplier evaluation? Sustainability The CSF Sustainability is one of the performance criteria that are most often used for strategic supplier assessment. This paragraph describes the CSF Sustainability and related KPI s Definition of sustainability The criterion Sustainability is often quoted in literature as: Meeting the needs of the present generation without compromising the ability of future generations to meet their own needs (Keiner 2003). Sustainability is the relation between people, planet and profit also referred to as the three pillars or triple bottom line (3BL). It comprises a wide spectrum of values and criteria for measuring organizational success in terms of ecological, social and financial performance. Sustainability is integrated into DSM s Vision 2010 strategy and objectives. Next to People, Planet and Profit, DSM includes a fourth dimension related to general sustainability aspects, which comprises elements such as The Code of Conduct, Green incentives and ISO-certification. 61
 to questionnaires (10-15%) to audits (ca")
74 DSM s sustainability procedure DSM s supplier sustainability program started in 2007 and comprises a three step approach from code of conduct letters (100%) to questionnaires (10-15%) to audits (ca 5%) as visualized in Figure % 10-15% Ca. 5% Figure 6.3: DSM s sustainability program. These elements should be performed within the selection and evaluation step of DSM s purchasing process. The Code of Conduct (CoC) includes the elements of valuable partnerships, Respect for people and Good corporate citizenship. The CoC must be signed by the supplier and act as a show-stopper when not signed. The questionnaire includes a list of questions related to the DSM values of the four dimensions General factors, People, Planet and Profit The questionnaire is filled in by the purchaser and when completed send to the supplier. A DSM audit can be used when additional improvements are required. The starting point is a completed questionnaire. The goal of an audit can be two ways: Detect possible gaps and if applicable, discuss these gaps and agree upon an improvement program. Search for opportunities to improve (if applicable), discuss these opportunities and agree upon an improvement program Key Performance Indicator Sustainability. The old Sustainability questionnaire includes questions that can be answered with a YES or NO, which are not related to a scoring criterion. The outcome of the analysis of several BG s (Paragraph 5.6) show that many BG s find the purpose and the measurements aspects for the performance criteria Sustainability not clear. Therefore, my recommendation is to link Sustainability questions to a scoring criterion. This results in a more quantitative evaluation approach, which enables an easier and more 62
75 understandable evaluation process, where the purpose of the criterion Sustainability becomes clearer. This idea has been further developed and is implemented in the beginning of I have contributed in the development of the Sustainability questionnaire, which has been tested and approved by DSM. For the development of the questionnaire interviews with sustainability experts were performed. The questionnaire uses a clear scoring criterion for the performance criteria Sustainability and is easy to use. For further details refer to Appendix A. This is supported by business groups that are using this tool in practice to evaluate suppliers. The questionnaire is built-up of performance criteria divided into four dimensions: General factors People, Planet and Profit and linked to a scoring criterion, as visualized in Figure 6.4. The scoring criterion is also linked to several follow-up actions. Figure 6.4: DSM's sustainability scoring methodology. The supplier sustainability score is based on the total sustainability weight points as follows: Supplier ranking A: weight point 4 and above. Supplier ranking B: weight point 3.25 and above. Supplier ranking C: weight point 2.5 and above. Supplier ranking D: weight point below 2.5. The following actions should be taken when results are known: A good performance: No follow up required B acceptable performance: Specific improvements should be addressed C unacceptable performance: Improvements program must be initiated with the supplier. 63
76 D performance completely unacceptable: supplier must be replaced. If a supplier is categorized A,B or C and a show stopper is reported, then this individual case should be discussed with the relevant persons within the BG/ DSM sourcing in order to take the proper action Innovation The CSF Innovation is an important performance criterion and is integrated within DSM s Vision 2010 strategy and objectives. Innovation is an import criterion for the strategic assessment of suppliers. This paragraph describes the CSF Innovation and related KPI s Definition of Innovation According to the literature review innovation can be formulated as: a critical dimension of any dynamic approach to business strategy as it allows a company to activate and defend competitive advantage (Chessborough, 2003). The difficulty about Innovation is that it is not directly linked to the purchasing process. The time-span of an innovation can differ from the daily operational purchasing processes. While operational and tactical performance criteria can be evaluated on a periodic basis, innovations can take a long period of time. The Research and Development (R&D) process for new product development can take even years. It is very difficult to manage Innovation, since for instance, researchers do not know in advance exactly how to accomplish the desired result. More investment in R&D does not (automatically) guarantee "more creativity, higher profit or a bigger market share. Another aspect of Innovation is that according to the literature review, Innovation does not usually occur in isolation, Innovation requires collaboration. A recent study by ten Kate (2008) focuses on the contribution of the purchasing functions of large firms in the firm s innovation. DSM is also included in the study. The focus of the study is the open innovation paradigm where the use of technology sources outside the company is stressed. The traditional question of what to make (internally) or buy (externally) closely relates to the purchasing and innovation processes within a company. The study shows that three factors are determinants of a purchasing contribution to firm innovation: (1) the level of strategic purchasing, (2) supplier involvement, and (3) the extent of purchasing integration within the company DSM s Innovation procedure DSM s Innovation criterion is linked to the criterion Technology and both criteria are first used in the supplier selection process. Suppliers are selected on three different Innovation / Technology criteria elements: (1) The amount of patents/ proprietary technology for commodities in place, (2) the laboratory facility for R&D, Early Supplier Involvement (ESI), and on-going support, and (3) the global / industry recognized experts for commodities. 64
77 DSM s SET, which is used for the evaluation of suppliers, includes the following three criteria elements: (1) the willingness of the supplier to share technical know-how (2) the joint developed products with DSM and (3) the capability of the supplier to facilitate DSM s innovation efforts. The last criterion is for DSM more important than the others, because it refers to the contribution of the supplier towards DSM. DSM should focus on the supplier Innovation and Technology contribution towards DSM, because an innovative scored company does automatically mean it will contribute innovation towards DSM. This aspect is important because most of the designed products are patented and therefore innovation plays a key role in DSM value portfolio Key performance Indicator Innovation Innovation is used as synonym to: a developed material or product or technology. I have contributed in the development of the Innovation questionnaire, which has been approved by DSM. For the development of the questionnaire interviews with Innovation experts were performed. DSM s has an Innovation centre that supports and accelerates innovation (programs) world-wide. The questionnaire has been tested in practice at the Innovation centre with positive results. The questionnaire includes the following elements and scoring criteria: The contribution of the development of the Innovation by DSM, supplier, or both. The patency rights of the Innovation by DSM, the supplier or both. The exclusiveness of the Innovation - [high, medium, low] The capability of the supplier to facilitate DSM s innovation efforts. [high, medium, low] The willingness of the supplier to share technical know-how. [high, medium, low] The amount of joint innovation programs with DSM. [high, medium, low] The first scoring criterion refers to innovation itself. Who developed the innovation? Is it by shared achievement or developed by DSM or by the supplier? The patents rights are important in order to benefit from the innovation. Sometimes knowledge (a patent) is bought or leased to develop another innovation. It is important to determine who has the rights to the use this information and can it also be used by the competitors? The amount of patent rights can tell something about the importance of the innovation and its exclusiveness. The facility and innovation contribution related to buildings and other contribution aspects such as people or money can be measured. Long-term criteria such as sharing of technical knowhow and joint innovation programs can tell something on mutual sharing of innovation and contributions. These aspects can be measures using a web-based questionnaire. The questionnaire includes a list of most important determinants for innovation with the use of a scoring criteria and weighing factors Conclusion The strategic performance criteria Sustainability and Innovation are important for DSM, because these criteria are incorporated within DSM s corporate strategy and objectives. According to the literature review 65
78 these criteria are increasingly effective with stronger buyer-supplier relationships. The Sustainability criterion can be measured with the use of SAP-SRM. This criterion can be measured using a web-based questionnaire linked to a scoring criterion. Strategic performance criteria: Measurement aspect: Measurer: Method: Sustainability Sustainability questionnaire Paragraph Semi- Quantitative Innovation Innovation questionnaire Paragraph Semi Quantitative Table 6.4: The recommended strategic performance criteria: Sustainability & Innovation The criterion Innovation should also be measured with respectively (R/3) SAP-SRM with the use of an Innovation questionnaire. Reference is made to Table 6.4. The scoring results can be used with other performance criteria within the (R/3) architecture. This results in a fast evaluation process where information can be stored in SAP. 6.4 Tactical Performance Criteria This paragraph describes DSM s tactical related CSF s and KPI s. First, for every CSF a definition is formulated. Next the corresponding KPI s are defined and linked to DSM s current working methods and practices. Following for every KPI the possibilities of using SAP for supplier evaluation is further described. The following research question is addressed: SRQ 2.8: What are the most important related KPI s for tactical related CSF s and how can these criteria be used with SAP for supplier evaluation? Cost The CSF Cost is one the performance criteria that is most often used for the tactical supplier assessment. This paragraph describes the CSF Cost and related KPI s Definition of Cost There are two different types of costs drivers related to supplier assessment. These are (1) avoiding unnecessary costs related to the supply of goods and (2) costs related to the actual price of the products compared to the market price (price fairness). The Concept of Total Cost of Ownership (TCO), in order to determine overall direct and indirect costs of a product/supplier are not part of the scope of this research. DSM does not often use TCO in practice due the time and cost it requires to gather all information data to use a proper TCO. 66
79 The first type of a Cost criterion is related to DSM s day-to-day processes and includes the avoidance of costs other than defined at the agreed contract. When the goods are not according to agreed specifications it can cause rework, re-shipping, and increased inventory which are all cost drivers. To measure this type of cost the purchaser can compare the invoice of supplier against the actual delivered goods at the production facilities. Any deviation between these two results in a non-conformity, which can trigger a supplier complaint. When an invoice is not accurate, goods can be rejected and send back to the supplier, resulting in additional costs that should be avoided. The definition for the Cost criterion is: The suppliers ability to deliver accurate invoices as defined in the agreed contract. The second type of Cost criterion is related to cost reduction incentives and suppliers price history. Analyzing the supplier price against the market price can give a good insight on the how fair the price of the product (or service) is compared to that of competitors (market price). Normally it is quite difficult to determine the market price for products. However Petrochemical products such as crude oil and derivates are known, because prices are globally set. The only differences are the regional taxation structures and import and export fees. DSM s calculates price fairness for petrochemical related products on a regular basis. Therefore this criterion van be included in the new SPMES. The definition for this Cost criterion is: The supplier s ability to deliver in the short- and long-term products with a fair price. Both of these cost drivers are now described in more detail and the possibilities of using SAP for these criteria are further described in Paragraph DSM s Invoice Accuracy procedure DSM s logistic invoice verification is situated at the end of the purchasing process. In SAP-MM and SAP- FICO, incoming invoices are most often verified in terms of their content, price, and quantity according to the Purchase Order (PO) and the Goods Receipts (GR). This process is also called three-way-matching. When an invoice is not accurate or information is missing, the financial department informs the responsible purchaser. The purchaser is responsible that the invoice is further processed. SAP can be (automatically) updated when the purchaser completes missing elements. Invoicing is not an operational process; it can take several weeks before an invoice is checked on content or goods receipt. This criterion must not be confused with the quantity performance criterion, which is an operational criterion. Therefore this criterion is situated with the tactical performance criteria The financial department of the BG s registers only the total amount of invoice non-conformities, but does not register the individual suppliers. The reason for this is that not all the non-conformities are supplier specific, it can also be internal related and therefore invoices have to be checked manually. DSM performed in 2007 a process improvement scan to analyze DSM s operational business processes. One of the results of the scan was that from just over 50,000 invoices, 28% of the invoices were without 67
80 reference to a purchase order and could not be further processed (manual procedures were required). The scan also showed that of all the invoices, 25% had a different amount that stated in the goods receipt, 3% of the invoices were blocked for payment, which can result in missing discounts from the supplier or supplier deliveries and 0.2% were duplicate invoices or parked invoices (incomplete information, no time registration). The scan also shows that the block ratio is 29.1% (number of blocked invoices on total invoices). To use supplier specific Cost non-conformities (complaints) for supplier evaluation, the responsible purchaser has to confirm and register individual supplier s Cost non-conformities themselves Price Level The second type of Cost criterion is related to cost reduction incentives. The Price level can be used for the evaluation and re-contracting of suppliers. The Price level measures the supplier s price against the market price (benchmark price). In order to evaluate the supplier, the market price must be accurate and continuously updated. When only a single supplier is used for a product/ material, then DSM ignores the product/ material for supplier evaluation for price level. The reason for this is that in case of a single supplier, the standard price must be set equal to the expected/agreed price of the single source, and a deviation in price measures DSM s accuracy in price setting instead of the supplier s behaviour. DSM is using the criteria Price level for supplier evaluation only at the DNP (Pharma) locations. The reason for this is that the pharmaceutical sector requires high regulations and often product/material specific suppliers. The BG s that are included for this research are not yet using this functionality for supplier evaluation, because the supply base for bulk products is very large and more multi-source suppliers are used, which requires the possibility to share information between BG s. This functionality requires a SAP platform which is not yet supported by DSM Key performance Indicators Cost In literature, there are different measures for the Criterion Cost, it depends on the definition used. For the new design DSM should focus on the accuracy of invoices and on the price of the purchased products. Therefore the KPI s for the CSF Cost can be defined as: supplier invoice complaints Invoice accuracy per supplier 100% totalamount of invoices per supplier 68
81 Supplier level price deviation Flexibility 100% supplier's price - market price supplier price The CSF Flexibility is one of the performance criteria that are most often used for the tactical supplier assessment. This paragraph describes the CSF Flexibility and related KPI s Definition of flexibility Within management literature, Flexibility is often referred to the supply-chain flexibility and includes the ability of a company to react and cope with changes in the environment. According to the literature review, the characteristics of an effective supply chain (including suppliers) includes the awareness to disturbances in the business environment, correctly assess and quickly respond to disturbances and controlling the organization by keeping the performance Table. Especially when purchasing concepts such as Just in Time (JIT) are pursued, it is necessary that companies can cope with low level of parts (in stock) during demand volatility. Therefore flexibility of the supplier is important in order to react on outside (external) demand fluctuations. This applies also for DSM and its suppliers. Therefore the definition for the criterion Flexibility is: The suppliers ability to adjust to changes of plans (increase or decrease in purchasing volume and adjustment of the time of deliver) Key Performance Indicators Flexibility In literature there are different measures for the Criterion Flexibility, it depends on the definition used. For the new design DSM can measure the amount of Time deliveries granted and the amount Volume changes granted. However, it is not recommended to measure these KPI s. The literature review describes that for the criterion Flexibility often a more subjective (qualitative) approach should be used. The time and related cost associating to measure the time deliveries and volume changes outweigh the benefits of using this criterion for supplier evaluation. There must be a trade-off between efficient supplier evaluation and including quantitative performance criteria within a supplier evaluation framework. For this criterion the responsible purchaser should use a qualitative approach and evaluate the supplier based on experience Service The CSF Service is one of the performance criteria that are most often used for tactical supplier assessment. This paragraph describes the CSF Service and related KPI s. 69
82 Definition of Service The criterion Service is described in literature as: the provision of service to customers before, during and after a purchase. The criterion Service can also be related to an outsource agreement, also referred to as a Service Level Agreement (SLA). An SLA is an agreement between a buyer and service provider that includes the suppliers performance requirements criteria such as Availability, Responsiveness, Priorities, Responsibilities, and Guarantees. The SLA agreement can be legally bounded or informal. For DSM, the service of the supplier is about the effective problem solving capacity of the supplier. The supplier needs to react and solve problems accordingly. Therefore the definition for the criterion Service is: The suppliers availability to quickly respond to and solve complaints DSM s service procedure The performance criterion Service is referred in DSM s SET to the CSF complaint management, which includes the repetitive behaviour of complaints, response time, the quality of the solved-problem, the complaint follow-up and the availability & responsiveness on claims. When a complaint is triggered, the BG informs the supplier on the non-conformity and corrective actions are taken. Depending on the severity of the complaint DSM requires a detailed root cause analysis and an effective improvement action plan within a given timeframe. The corrective actions and time-frames to resolve complaints are BG specific. It depends on the type of contract and whether a BG has set-up an SLA with their own terms & conditions Key Performance Indicators Service In literature there are different measures for the Criterion Service, it depends on the definition used. The measures within SET such as repetitive behaviour the responsiveness should not be included for an efficient supplier evaluation for complexity reasons. For the new design, DSM can measure the response time to complaints and the problem solving capability of the supplier. However, it is not recommended to measure these KPI s. The literature review describes that also for the criterion Service a more subjective (qualitative) approach should be used. The time and related cost associating to measure the responsiveness of complaints and amount of satisfied complaints outweigh the benefits of using this criterion for supplier evaluation. For this criterion the responsible purchaser should use a qualitative approach and evaluate the supplier based on experience Information sharing The CSF Information sharing is one the performance criteria that is most often used for tactical supplier assessment. This paragraph describes the CSF Information sharing related KPI s. 70
83 Definition of information sharing The criterion Information sharing is described in literature as the exchange of information between buyer and supplier. It is often related to the business-to-business (B2B) principle, which includes electronic commerce (e-commerce) and the sharing of business information, maintaining business relationships, and conducting business transactions by digital means between two businesses. E-commerce is often associated with forecasting, sales and procurement activities, product development (collaboration), production planning, inventory management, and production planning. It can help to share knowledge, increase the speed of response, and reduce the costs of servicing a market by improving information exchange between exchange supplier and buyer. For DSM the definition for the criterion information sharing is: The supplier s willingness to share market information (which is important for DSM s business intelligence) DSM s information sharing procedure The performance criterion Information sharing is referred in DSM s SET to the CSF Market Information, which includes the willingness of the supplier to: exchange market information, conduct regular business reviews, share major trends in the market and is prepared to conduct join studies. The information flow between DSM and the supplier includes materials, financial factors, and information. There are no hard criteria for the type or amount of information shared between DSM and the supplier. However both parties most often (informally) agree that important market information should be exchanged, but the sharing of information is not obligated. Information can be shared during meetings with the supplier or by phone and , there is no standard procedure Key performance Indicators Information Sharing In literature there are different measures for the criterion Information sharing, it depends on the definition used. The measures within SET such as conducting regular business reviews and join studies should not be included for an efficient supplier evaluation for complexity reasons. For the new design, DSM can measure the willingness of the supplier to share market information. However, it is not recommended to measure this KPI. The literature review describes that also for the criterion Information sharing a more subjective (qualitative) approach should be used. The time and related cost associating to measure the times that a supplier shared market information outweigh the benefits of using this criterion for supplier evaluation. For this criterion the responsible purchaser should use a qualitative approach and evaluate the supplier based on experience. 71
84 6.4.5 Conclusion The tactical performance criteria Cost, Flexibility, Service, and Information sharing are important for the improvements of DSM s business processes. According to the literature review, these criteria are increasingly effective with stronger buyer-supplier relationships. The criteria Price Setting and Price History can be measured within the (R/3) SAP-MM module as visualized in Table 6.5. These criteria can automatically be retrieved from the system. The criterion Invoice accuracy requires strong manual procedures and should therefore be measured with the SAP-QM module as a supplier Cost complaint. Tactical performance criteria: Measurement aspect: System Method: Cost Invoice accuracy Price Setting QM MM-module Manual Automatic Flexibility Ability to adjust to changes of plans. SRM - questionnaire Semi-auto Service Ability to follow-up complaints accordingly. SRM - questionnaire Semi- auto Information Sharing Willingness to share SRM - market information questionnaire Semi- auto Table 6.5: The recommended tactical performance criteria: Cost, Flexibility, Service, Information sharing. The criteria Flexibility, Service and Information sharing should be measured with respectively (R/3) SAP-SRM with the use of a short (1-2 questions) questionnaire. These semi-automatic criteria require a manual qualitative approach, because these criteria are difficult (or not cost efficient) to quantify. The scoring results of the questionnaires can be used with other performance criteria within the (R/3) architecture. An important aspect of using SAP for supplier evaluation is that the SAP Master Data must be fully reliable. This means that the data used for supplier evaluation has to be accurate. For the criterion Cost it is important that market price (benchmark price) is accurate and continuously updated in order to measure price deviation. When the market price is not accurate, this can result in an unreliable supplier evaluation process. 6.5 Operational Performance Criteria This paragraph describes DSM s operational related CSF s and KPI s. First, for every CSF a definition is formulated. Next, the corresponding KPI s are defined and linked to DSM s current working methods and practices. Following, for every KPI, the possibilities of using SAP for supplier evaluation is further described. 72
85 The following research question is addressed: SRQ 2.9: What are the most important related KPI s for operational related CSF s and how can these criteria be used with SAP for supplier evaluation? Quality The CSF Quality is one the performance criteria that is most often used for operational supplier assessment. However the definition and interpretation of quality differs between authors in literature. This paragraph describes the CSF Quality and related KPI s Definition of quality There are a number of well known quality definitions and interpretations on quality that have developed over time. Crosby (1979) defines quality as conformance to requirements, where the output must conform to design and the design and price must conform to customer expectations. Juran (2004) defines quality as "fitness for use", where fitness is defined by the customer. The worldwide license certificating agency ISO defines quality as "degree to which a set of inherent characteristics fulfils requirements", where ISO defines requirement as need or expectation. In other literature, the definition of the quality of a product (or service), refers to the perception of the degree to which the product or service meets the customer's expectations. For DSM, quality cannot be assigned to a supplier, department or person, it is related to the whole organization. The delivered goods by the supplier (inbound) have an impact on the quality (or service) used for manufacturing (DSM s internal customer), which effects the outcome of the quality (or service) of the goods for the external customer. Quality is an important aspect for DSM s internal as well as external customers. Therefore on a higher level, quality can be described as: meeting the expectations of the internal and external customers. However, this research focuses on the supplier assessment and therefore the quality definition can be defined as: The suppliers ability to deliver goods according to the agreed quality specifications conform the expectations of the internal and external customers DSM s quality procedure DSM s quality inspections are performed by warehouse staff at the production facilities of the BG s. Petrochemical products can arrive by truck, railroad, pipeline or barge. DSM inbound products can be checked on their product quality and/or on their packaged material quality depending on the transportation method used. Product quality refers to the quality of the product itself, while packaged material quality refers to the packaging of the products that is used to protect the goods during transportation. However, goods that have damaged packaging are not automatically rejected, this depends also on the impact of the damage on the quality of the product. 73
86 Bulk goods that require quality inspection are not received and unloaded until they have passed the quality tests. Packed goods are received and unloaded before product quality testing. Within DSM, there is no common standard for the required inspection frequency, or for the kind of quality inspection to be performed, this responsibility is left to the individual BG s. This results in a large variety of inspection frequencies and inspection methods between BG s, even for those products which are transported in a similar way. Some BG s sample all products (batches) that arrive, while other BG s choose random sampling or have no quality inspection at all. In the latter case, BG s fully rely on the certificate of analysis given by the supplier that should guarantee that the quality of the products are according to agreed specification stated in the contract. There are several reasons why different inspection approaches are used. According to most BG s, the cost and time associated for testing and blocking products for a full 100% quality inspection outweighs the benefits. This is also supported by literature that indicates a trend shift from Quality Control (QC) towards Quality Assurance (QA). Whereas QC emphasizes on testing and blocking defective products, QA is about improving and standardizing production and associated processes to minimize the occurrence of defective products. However, QA does not fully eliminate the need for QC. Some products are so critical that they require testing. For DSM, this is the case for pharmaceutical and nutritional products. However, most chemical bulk products don t fit these requirements. Second, the segmentation of suppliers described in Paragraph is performed on a corporate level. This means that suppliers are ranked according to their strategic importance for DSM. However some strategic suppliers deliver the same goods to multiple BG s, but the delivery of these goods are not all of the same importance for the BG s day-to-day business processes. Therefore some of these suppliers can be a strategic important supplier on a corporate level but a preferred supplier for a BG, and vice versa. Also strategic suppliers have a closer relationship with DSM and are better researched on their (quality) procedures and working methods during the selection process. This is not always the case for preferred suppliers, which often results in less trust in quality and more quality inspections. How are quality problems reported? DSM registers quality problems in two ways. The first way is by performing quality inspections for packaging and product quality. Samples are taken from the product and send to a laboratory for testing and the quality-test determines if the product is 100% according to specification, partly approved (only packaging damage) or fully rejected. In either of these cases a nonconformity report or a supplier complaint can be triggered, this is also not standardized between BG s. The second method used is to fully rely on the certificate of analysis. In this case no quality inspection takes place and quality problems arrive from the customer side by a customer quality complaint. Often 74
87 these complaints trigger more frequent inspections and quality audits at the supplier site. Even BG s that perform continuous quality inspections are still occasionally independently audited every few year(s). Thus, quality problems can trigger a supplier complaint or pop-up as customer complaint Key Performance Indicators Quality In literature, the measure for quality is Quality reliability. According to the quality definition, the goods must be according to agreed specifications stated in the contract. BG s that perform quality inspection can evaluate suppliers based on their amount of quality non-conformities (goods that are not according to agreed specifications). Non-conformity most often results in a supplier quality complaint. Thus for the measurement criteria the amount of non-conformities or supplier complaints can be used for individual evaluation of the quality reliability of the supplier. If BG s do not (or randomly) use a quality inspection, not all inbound non-conformities are registered. Quality non-conformities will then pop-up as quality complaints (internal manufacturing not taken into accounted). In both methods, the quality non-conformities will show as complaints, either in a supplier complaint triggered by the BG or triggered by the customer (outbound) as a quality complaint. Therefore the KPI s for the CSF Quality can be defined as: supplier quality complaints customer quality complaints Quality reliabilit y per supplier 100% totalamount of deliveries per supplier Delivery Accuracy (DA) The CSF Delivery is one the performance criteria that is most often used for operational supplier assessment. This paragraph describes this CSF and related KPI s Definition of delivery In literature, Delivery Accuracy (DA) is often regarded as the company s ability to fulfil the requirements of a customer order in terms of delivery time. However on-time delivery, quantity reliability and quality are related to each other. Lehtonen et al. (2006) describe that a delivery can only be accurate or complete when next to the criterion time other conditions are met such as quality, quantity, and problem free delivery. DA can therefore be seen as the combination of different performance criteria. However, for clarity purposes this paper describes the performance criterion quality separately. For DSM, the delivery of goods is important throughout the supply chain. This means that the DA can be influenced by the goods delivered by the supplier to the production facility, but also for internal goods delivery within the company (internal DA) and the delivery from the production facility towards the end customer (external DA). 75
88 Some BG s are using dangerous chemicals that require strict plant safety guidelines & documentation. Therefore DSM s delivery definition can be formulated as follows: The supplier s ability to deliver goods (or services) on- time (and location), with the right quantity, with the right documents and according to DSM s Safety (SHE) Policy requirements DSM s delivery procedure DSM s delivery inspections are performed by the controller (warehouse staff) at the production facilities of the BG s. Petrochemical products can arrive by truck, railroad, pipeline or barge. Next to quality, DSM s inbound products are also checked on their on-time delivery, quantity, right documentation, and on safety aspects. There is no standardized delivery procedure. The criterion Documents is checked on the following criteria: Purchase order number, net weight, gross weight, production description, SAP material number, batch number and a certificate of analysis if required according to the quality agreement. When one of the delivery criteria is not (fully) met delivery non-conformity occurs and a supplier complaint can be triggered. However the severity of the non-conformity and the cause that triggers a supplier complaint is not standardized between BG s Key Performance Indicators for Delivery In literature, the measure for delivery is Delivery reliability. In a similar way as for Quality, the KPI s for the CSF Delivery can be defined. Because non-conformities will often trigger a supplier complaint and all incoming aspects are measured, the total delivery performance without distinguishing between elements can be defined as: supplier delivery complaints customer delivery complaints Delivery accuracy per supplier 100% totalamount of deliveries per supplier Conclusion The operational performance criteria Quality and Delivery are critically important for DSM s day-day business processes. The criteria Product quality, On- time delivery and Quantity reliability can be measured within the (R/3) SAP-MM module as visualized in Table 6.4. These criteria can automatically be retrieved from the system. The criteria Package quality, Document reliability and SHE policy requirements should be measured with respectively (R/3) SAP-QM. These criteria and supplier complaints should be manually inputted by the purchaser. 76
89 Operational performance criteria: Measurement aspect: System(R/3): Method: Quality Product quality Package quality MM-module QM-module Automatic Manual Delivery Delivery reliability o On-time delivery o Right quantity o Right documents o According to SHE MM-module MM-module QM-module QM-module Automatic Automatic Manual Manual Table 6.6: The recommended operational performance criteria: Quality & Delivery An important aspect of using SAP for supplier evaluation is that the SAP Master Data must be fully reliable. This means that the data used for supplier evaluation has to be accurate. Purchase managers should update changes, such as order volume, time of delivery, split order or cancellations within the system. Purchase orders that are booked in the end of the week should use the statistical (scheduled) date of delivery. When these elements are not applied accordingly, the supplier is evaluated with the wrong master data and this results in an unreliable supplier evaluation process. 6.6 Final Evaluation Method: Combined performance criteria DSM s final evaluation design comprises operational, tactical, and strategic performance criteria, derived from three IT-systems, respectively SAP-MM, SAP-QM and SAP-SRM. The SAP-BW-VE is used to integrate, transform, consolidate, clean and store information data from these systems and report information data using BW- report, as visualized in Figure 6.5. This paragraph described the new SPMES design, the functional requirements, and necessary complaint management system that should be implemented. The following research question is addressed. SRQ:2.10: Which IT-systems and functional requirements are important for an effective SAP supplier evaluation, based on the decision set of performance criteria? DSM s new SPMES Design The SPMS design requires six functional requirements (Paragraph 6.6.2) and includes a well integrated complaint management system (Paragraph 6.6.3), which should be supported by Apollo! The design is completely new. DSM s use of SAP/ Apollo for supplier evaluation has never been investigated before. The research for combining DSM s different IT-systems for supplier evaluation has also never been investigated before. 77
90 Figure 6.5: DSM s new and improved SPMES design Functional Requirements The following summary is based on three interviews performed with several SAP specialists. For the new SPMES, the following six functional requirements should be met according to the SAP specialists: 1. The possibility to share and store information data between IT-Systems from business groups. 2. DSM supported written procedures for SAP-QM and SAP- SRM. Currently, DSM supports only the SAP-MM module with written procedures. 3. Management support for the use of SAP instead of traditional techniques for supplier evaluation. All business groups are required to use SAP in order to share information. 4. The possibility to share and store web-based questionnaires. This is important to register certain performance criteria, which are required for the new set-up. 78
91 5. The possibility to share and store (customer and supplier) complaints for the evaluation process. This is important to measure certain performance criteria, especially related to poor quality. 6. The possibility to report stored information data (using BW-report). Following a brief description is given for each of the six functional requirements: (1) In order to have the technical capability to share and use information data between BG s the following should be met: First all data fields within the shared (implemented) modules should be activated so they are equally set- up. Second, for the comparison of information data the supplier and material numbers should be the standardized between BG s. Suppliers should be assigned with a unique supplier number using Dun & Bradstreet (DUNS) and materials should be aggregated using international standards (ecl@ss). Within DSM, the SAP (R/3) systems are provided with DUNS-numbers and SAP-BW supports DUNS and ecl@ss numbers. (2) DSM should develop procedures for using SAP for supplier evaluation and additional SAP training of employees should be included. (3) It is important that the use of SAP is obligatory in order to have an effective supplier evaluation. The traditional (OTIF) measurement results cannot be used effectively in combination with SAP for supplier evaluation. The BG s are willing to use one standardised (obligated) system, only when management support them in the tools (required resources: time, budget, training) to use and maintain the system. (4) For the tactical and strategic performance criteria, it is important that questionnaires can be used within SAP. SRM uses a web-based survey that provides questionnaires in certain areas of SAP Enterprise Buyer package. Standard templates are available for goods receipt, invoice, and supplier list. However for the performance criteria: Flexibility, Service, Information sharing, Sustainability and Innovation, a customized version should be developed. The option of using customized questionnaires is supported by SRM. (5) For BG s that do not perform a 100% quality check with inbound products, quality non-conformities will show as customer complaints. Other performance criteria such as Package quality, Document reliability and SHE safety policy requirements can be measured as supplier complaints within SAP-QM. It is important to share, combine, and store customer and supplier complaints in SAP. Whether a complaint management system should be developed within R/3 or outside, DSM should support the complaint management procedure. (6) The storage of information data has no value when it cannot be used for supplier evaluation. The individual SAP-modules have their own reports that can be used. However, SAP cannot use information data between BG s, this functionality is only supported by Business Warehouse (BW) DSM s Complaint Management System DSM should implement a Complaint Management System (CMS), in order to share and use customer and supplier complaints for the evaluation process. 79
92 DSM does not have a complaint management system in place (so no reference), therefore with the guidance of SAP specialists the following minimum requirements are important for DSM s new SPMES design: Simplify SAP (R/3) notifications. Improve reporting (KPI definition/ reporting). Link to CRM (for customer complaints)/ link to supplier development program/ supplier evaluation. Workflow functionality. Complete documentation & DSM process descriptions. Possibility to monitor/ report complaint handling cost/ hours spend. There are two options to set-up a CMS, A CMS can be used within the (R/3) environment or outside (R/3) which both have advantages and disadvantages, which are now described in more detail. The first option is to use the current SAP-QM and SAP-MM modules to measure supplier complaints and use the current SAP-Customer Relationship Management (CRM) for customer complaints. However, the use of SAP-CRM for the new design is not recommended, because the performance criteria used for supplier evaluation such as: Package quality, Documents and Safety are manually inputted in the SAP-QM module and these notifications cannot trigger automatic follow-up. SAP-CRM is still important for the follow-up and sharing of customer complaints between the BG and the Sales Department (SD). The BG s that don t use a 100% quality inspection method and measures customer complaints should manually input these notifications in SAP-QM. The advantage of using CRM within the (R/3) environment is that it can directly be set-up and implemented, all the necessary components (IT-System and link between BG s) are available. The disadvantage of a CRM within the (R/3) environment is that BG s are limited to the functionality of SAP- QM and SAP-MM. Not all the BG requirements ( needs ) of a CMS can be used within (R/3). A detailed set of technical and operation requirements of the BG s are further described in the Appendix I. The second option is to use a CMS outside (R/3). The advantage of this method is that it is not limited to the (R/3) environment and extra BG requirements can be added. The disadvantage is that such a system should be developed first and this takes time and can be expensive. Therefore, the first option is recommended for the new SPMES design. The general benefit of a CMS (within or outside (R/3)) is that it allows complaints to be registered and solved using an 8 Disciplines (8D) process. This integrated problem management tool of SAP-QM incorporates all the important aspects of problem management, that is, containment of the problem, root cause analysis, problem correction, and problem prevention which can be used by the BG s. The tool 80
93 uses the problem solving ability in combination with dashboard and timeframes (Appendix F, quality notifications) Reporting of Results SAP Business Warehouse (SAP BW) should be used for the extraction of data from the different ITsystems. SAP-BW is a comprehensive business intelligence software product that is optimized for (but not limited to) the (R/3) environment from SAP. DSM s operational performance criteria, which should be measured in (R/3) SAP-MM or SAP-QM modules, are directly supported by BW. However the other tactical and strategic performance criteria are not directly supported (outside-r/3). There is a feature of BW, which is called Business Application Programming Interfaces (BAPI s) which enables the connections to non-r/3 applications such as SRM and CRM. Thus, all the performance criteria can be retrieved out of different system using SAP-BW. The next important aspect is retrieving the information from different BG s. This requires a link between BG s. Currently DSM is using a special kernel, called BW-Magneto (BW-M) which allows corporate DSM to retrieve all the purchasing spend (aggregation of supplier spend) from the BG s, BW-M has a direct link to the IT-systems from the BG s. DSM should develop the same sort of kernel as BW-M, only this time to retrieve supplier evaluation data from the BG s. The new kernel, which should be called BW-Supplier Evaluation (BW-VE) allows the retrieval of information data from BG s to be stored in so called cubes (storage places). The information out of these cubes can then be used for reporting. SAP-BW includes preconfigured reporting tools and business process models that use queries. Queries result in a customized favourite report, as visualized in Figure 6.6. Figure 6.6: SAP-BW reporting ability 81
94 7. Implementation aspects 7.1 Introduction The new SPMES design (Figure 6.5) comprises a set of operational, tactical, and strategic KPI s, which are retrieved by SAP-BW-SE from the following IT-Systems: SAP-MM, SAP-QM, and SAP SRM. This Chapter describes the additional changes required within DSM s purchasing process for a successful implementation of the new SPMES- system (Paragraph 7.2). Also, other aspects such as: Costs and benefits of using SAP for supplier evaluation (Paragraph 7.1), the recognition and reward of suppliers, and the communication towards internal and external stakeholders are important and described. The following research questions are addressed: Paragraph 7.2 answers SRQ 3.1: What are the cost and benefits of using SAP for supplier evaluation? Paragraph 7.3 answers SRQ 3.2: Which changes within DSM s purchasing process are important for a successful implementation of DSM s new SPMES? Paragraph 7.4 answers SRQ 3.3: How should DSM communicate with internal and external stakeholders? Paragraph 7.5 answers SRQ 3.4: How important is recognition and reward for the (continuous) improvement of supplier? Paragraph 7.6 answers SRQ 3.5 Which elements should be included for the implementation of the new SPMES? 7.2 Advantages and disadvantages of using SAP for supplier evaluation. The current installed SAP-MM module allows the BG s to use the most common operational performance criteria such as: Delivery, Quantity and Quality. The possibility of using these criteria in combination with SAP allows BG s to get a more realistic insight into the suppliers performance. Other reasons why DSM should use SAP for supplier evaluation are: Facilitates decisions based on actual performance data. Uncovers risk and problems. Saves time. Eliminates cost drivers. Facilitates improvements plans and automatic follow-up. Identifies supplier development projects. Tracks supplier performance improvement projects. Indentifies suppliers for recognition and reward. These elements are more difficult to indentify and accomplish when traditional non-sap measurement techniques like On-Time In-Full (OTIF) are used. 82
95 However, in order to use performance criteria from SAP, several requirements must be met. The new SPMES (based on SAP) should include: a close-loop system, meaningful metrics, and a standardized performance management process to gain maximum benefits out of SAP. This means that other nonoperational performance criteria should also be integrated within SAP. Therefore, other system such as SAP-QM and SAP-SRM should be used to include tactical and strategic performance criteria. DSM should support and develop methods and procedures for the use of these IT-Systems for supplier evaluation. DSM should also develop a cost-estimate for the implementation of the new SPMES. The following cost aspects should be included: The design of a new BW- kernel for the extraction of information data from IT-systems. The data fields of the modules used should be activated across all BG s. The development of additional methods and DSM processes. SAP training for DSM employees. Optional: The design of a Complaint Management System (CMS) outside the (R/3) environment. 7.3 Changes within DSM s purchasing process In order to implement the new SPMES design successfully, DSM should focus on certain steps within DSM s purchasing process, which are related to the evaluation of suppliers. The following purchasing steps within DSM s purchasing process are important and further described: supplier selection, supplier contract, goods receipt, and invoice verification, as visualized in Figure

96 Figure 7.1: DSM's purchasing process and required points of attention Supplier Selection DSM s selection step is an important step within the purchasing process because the performance criteria that are used for the supplier selection process are the input for the supplier evaluation process. The most important selection criteria in literature are: Quality, Price and Delivery. However, literature studies also show that soft criteria are just as important or even in some cases more important then hard criteria (see Table 7.1). Therefore, DSM should focus also on qualitative aspects such as Strategic commitment, Innovation and Sustainability aspects within the selection process, which are important for DSM s current strategy. The current supplier selection process already includes these soft-factors. However, the use of these criteria within the process can be further improved. Recommendation: DSM should focus on the performance criteria Innovation, Sustainability and Strategic Fit for the selection process. These criteria are increasingly effective with stronger buyer-supplier relationships. DSM should develop a Sustainability list and Innovation list, which includes suppliers that fit the minimal requirement of Sustainability and Innovation. Suppliers are ranked (from High to Low) on the criterion used. This enables a faster selection process, because BG s can use the list for the selection process. The list should be updated on a yearly basis. 84

97 Table 7.1: Most often used selection criteria (Kannan 2002) Supplier Contracting The contract of a supplier is important, because it includes the operational performance indicators on which the supplier is evaluated. The BG s often include the Certificate of Analysis within the contract. The literature review also describes that when a contract includes the sentence that supplier are measured and evaluated on their performance, suppliers tend to improve from 5 percent to as much as 25 percent, just by knowing that they are being measured and evaluated (Source: Aberdeen Group) DSM Resins (DR) includes such a sentence within their contract.. 85
98 Recommendation: DSM should use contracts that clearly indicate the KPI s on which suppliers are evaluated on. DSM should include a sentence within the contract that describes that suppliers are measured and evaluated on their performance Goods receipt The delivery inspection for goods receipt is performed by the controller (warehouse staff) at the production facilities of the BG s. It is important that the delivery date in the purchase order at goods receipt is correct, also when the date is changed afterwards. The purchase order has two dates: the delivery date (scheduled) and the statistical (actual) date. Initially those dates are equal, but the statistical date is used for calculating the supplier s on-time delivery score. When the purchase orders are accumulated till the end of the week and then updated in SAP without changing the date, the evaluation of the supplier is unreliable. Recommendation: DSM should develop a process that ensures that the scheduled (and correct) date is used for supplier s on-time delivery score. DSM can also purchase an electronic device (PDA), which the controller can use to check inbound deliveries with the PO and report non-conformities directly (wireless) into SAP. Such a device is not being used within DSM Invoice verification DSM performed in 2007 a process improvement scan to analyze DSM s operational business processes. One of the results of the scan was that from just over 50,000 invoices, 28% of the invoices were without reference to a purchase order and could not be further processed (manual procedures were required). Recommendation: DSM should develop a procedure that ensures that invoices are always related to a Purchase Order (PO). DSM should also develop a process that ensures that duplicate invoices and other aspects are filtered out. When all the invoices are refered to a PO, the invoice can automaticlaly be evaluated by SAP. Then there is no need for manual procedures, which saves DSM time and reduces cost. 7.4 Internal and external stakeholder communication The literature review describes that the communication about the supplier evaluation process to both internal and external stakeholders is very important. After the supplier performance management system is set-up, a communication framework is required in order to achieve consistent results. The performance 86
 evaluation process where DSM and the supplier evaluate each other.")
99 feedback should be a two-way flow of communications between DSM and the supplier, as visualized in Figure 7.2. Figure 7.2: DSM-supplier feedback process flow The current SET is developed to act as a 2-way (360 degree) evaluation process where DSM and the supplier evaluate each other. However the current SET acts as a 1-way evaluation process where DSM only evaluates the supplier. In addition, some BG s send questionnaires to suppliers requesting to score DSM on service quality level. The new SPMES should develop a 2-way (360 degree) evaluation. The BW-report which includes the results of the performance of the supplier should be send to the supplier (external stakeholder). The result of the performance of the supplier should also be accessible for other BG s (internal stakeholders). The supplier should also have the ability to score DSM on their performance using a (web-based) questionnaire. Recommendation: DSM should develop a 2-way (360 degree) evaluation process, which includes evaluation of the supplier by DSM using the BW-report and the evaluation of DSM by the supplier using a (web-based) questionnaire. The supplier performance results should be accessible for other BG s. 7.5 Recognition and rewarding suppliers Motivating suppliers is important for the continuous improvement of suppliers. Supplier recognition programs are a good way to motivate suppliers and promote performance. DSM already uses different tools to motivate suppliers, as visualized in Table 7.2. However, DSM should develop a supplier 87
 the internal cost (improvement cost) and cost associated to reducing poor performers can decrease.")
100 recognition program that awards suppliers on their performance. The expense of such a system can generate a return in investment. When suppliers improve (because they want to be recognized) the internal cost (improvement cost) and cost associated to reducing poor performers can decrease. DSM has already implemented supply base rationalization, supplier development and supplier evaluation. The only tool missing is a supplier recognition program. Table 7.2: Tools to evaluate, recognise and motivate suppliers. Recommendation DSM should develop and implement a supplier recognition program to reward suppliers on their performance. Such a program is important for the continuous improvement of suppliers and reduces overall costs and increase supplier commitment. 7.6 Implementation plan The new SPMES requires an implementation plan to go live. Table 7.3 provides a summary of the most important set of the activities that are required for the implementation of the new SPMES. This is typically SAP related. It is difficult to give a time-frame for the implementation of the new SPMES. This depends how fast SAP specialists can implement the components required for the extraction of data from BG s, so called info cube has to be designed and implemented. This applies also for a BG s connection to the complaint management system for the extraction of all non-conformities. This can take weeks, even months to implement. After implementation the system is directly ready for us. However, there should be training on how to work with the new designed system. After that automatic developed progress reports is the new way of evaluation for both DSII as for the BG s! 88
101 Table 7.3.: DSM s implementation plan for the new SPMES (Source 89
102 8. RESEARCH CONCLUSIONS & RECOMMENDATIONS This chapter describes the conclusions and recommendations for DSM s corporate management and for DSM s Sourcing department. Paragraph describes the conclusions and recommendations based on the outcome of the literature analysis, internal company analysis, and case studies analysis. The recommendations are related to the design and implementation of the new SPMES. Paragraph describes the differences between the current and the new SPMES. Paragraph describes the new set-up for the new SPMES using SAP Paragraph 8.2 describes the further research requirements. 8.1 Research Conclusions and Recommendations Analysis aspects This paragraph answers: RQ1: What is the best practice of supplier performance measurement used in literature, internal analysis and external analysis The literature review performed shows: That the following CSF s are most often used for the supplier assessment process: Quality, Delivery, Time, Cost, Price, Flexibility, Responsiveness, and Service. (Paragraph 3.8.3) That soft criteria such as Strategic fit and Strategic commitment are just as important, or even in some cases more important than hard criteria such as Price and Quality. SAP software can be used to measure operational performance criteria within SAP-MM. The data can be used for the evaluation of suppliers (Paragraph 5.6). The internal BG-SAP analysis shows that: The BG s are free to use SAP for supplier evaluation, it not obligated. BG s think that SAP does not include enough possibilities to reflect BG-specific needs. SAP-Master Data is unreliable for several reasons. The knowledge of using SAP for evaluation is sometimes missing. The advantages of using SAP are not known. Currently, DSM s Supplier Evaluation Tool (SET) includes supplier performance evaluation criteria, which BG s should use for the evaluation of suppliers (Paragraph 5.4). The SET analysis shows that: SET includes many performance criteria. SET includes performance criteria related to the supplier selection process and to the supplier assessment process. The performance criterion Cost is not included within SET. 90
103 SET stimulates continuous improvement rather than monitor and objectives are dynamic over time. SET does not include objective and clear measures and is not linked with corporate strategy and objectives. BG s fully rely on traditional On-Time In-Full (OTIF) techniques (Non-SAP) for the evaluation of suppliers (Paragraph ). The BG analysis shows that: 6 out of 6 BG s have an OTIF- based evaluation system in place. 0 out of 6 BG s use SAP for supplier evaluation for several reasons. The purpose and measurement aspects for the performance criteria Sustainability and Innovation are not clear. Mostly qualitative (subjective) methods are used for supplier evaluation. The case study performed and three case studies from literature (Paragraph ): Show that the following CSF s are most often used for the supplier assessment process: Quality, Time, Cost, Flexibility, and Innovation and Service. Cost, Quality, and Innovation were highlighted as the most important CSF s. Show that SAP can be used for supplier evaluation. Have supplier award programs in place to award the best supplier of the year Design aspects This paragraph answers: RQ2: How should the current SPMES be modified and optimized according to the theoretical and Empirical research results of the best practices and current corporate and purchasing strategy? SET should be divided into selection performance criteria and assessment performance criteria (Paragraph 6.2). The SET analysis shows that: The supplier selection process should include soft factors such as Innovation and Sustainability The supplier assessment criteria should include DSM s new SPMES factors. The new SPMES design includes strategic, tactical and operational performance criteria (Paragraph 6.2). The design analysis shows that: The strategic related performance criteria Sustainability and Innovation should be measured using web-based questionnaires in SAP-SRM (Paragraph 6.3). The tactical related performance criteria: Price level should be measured using SAP-MM (Paragraph 6.4). 91
104 The tactical related performance criteria: Flexibility, Service, and Information sharing and invoice accuracy should be measured using web-based questionnaires in SAP-SRM (Paragraph 6.4) The tactical performance criterion Invoice accuracy should be measured using notifications in Sap-QM (Paragraph 6.4). The operational related performance criteria: Product quality, On-time delivery, and Right quantity should be measured using SAP-MM (Paragraph 6.5). The operational related performance criteria: Package quality, Documents, and SHE safety policy requirements should be measured using notifications in SAP-QM (Paragraph 6.5) DSM should implement a Complaint Management System (CMS), in order to share and use customer and supplier complaints for the evaluation process (Paragraph 6.6.3). The CMS analysis shows that: DSM should use the current SAP-QM and SAP-MM modules to measure supplier and customer complaints. SAP CRM is important for the follow-up and sharing of customer complaints between the BG and the sales department. SAP Business Warehouse (SAP BW) should be used for the extraction of data from the different IT- Systems (Paragraph 6.6.4). The SAP BW analysis shows that: DSM should develop the same sort of kernel as BW-M, only this time to retrieve supplier evaluation data from the BG s. The new kernel, which should be called BW-Supplier Evaluation (BW-VE) allows the retrieval of information data from BG s to be stored in so called cubes (storage places). The information out of these cubes can then be used for reporting Implementation aspects This paragraph answers: RQ3: How should a Performance Measurement System be set up and implemented with the use of SAP? DSM should develop a cost-estimate for the implementation of the new SPMES. The following cost aspects should be included (Paragraph 7.2): The design of a new BW- kernel for the extraction of information data from IT-Systems. The data fields of the modules used should be activated across all BG s. The development of additional methods and DSM processes. SAP training for DSM employees. 92
105 DSM should focus on certain steps within DSM s purchasing process, which are related to the evaluation of suppliers: Supplier selection step: DSM should focus on the performance criteria Innovation, Sustainability, and Strategic Fit for the selection process. These criteria are increasingly effective with stronger buyer-supplier relationships. (Paragraph 7.3.1) DSM should also develop a Sustainability list and Innovation list, which includes suppliers that fit the minimal DSM requirements. This enables a faster selection process, because BG s can use the list for the selection process. (Paragraph 7.3.1) Supplier contract step: DSM should use contracts that clearly indicate the KPI s on which suppliers are evaluated on and include a sentence within the contract that describes that suppliers are measured and evaluated on their performance. (Paragraph 7.3.2) Goods receipt: DSM should develop a process that ensures that the scheduled (and correct) date is used for supplier s on-time delivery score (Paragraph 7.3.3). DSM can also purchase an electronic device (PDA), which the controller can use to check inbound deliveries with the PO and report non-conformities directly (wireless) into SAP (Paragraph 7.3.3). Invoice verification: DSM should develop a procedure that ensures that invoices are always related to a Purchase Order (PO). DSM should also develop a process that ensures that duplicate invoices and aspects are filtered out. When all the invoices are referred to a PO, the invoice can automatically be evaluated by SAP. Then there is no need for manual procedures, which saves DSM time and reduces cost (Paragraph 7.3.3). DSM should communicate with internal and external stakeholders: DSM should develop a 2-way (360 degree) evaluation process, which includes evaluation of the supplier by DSM using the BW-report and the evaluation of DSM by the supplier using a (webbased) questionnaire (Paragraph 7.4). The supplier performance results should be accessible for other BG s (Paragraph 7.4). 93
106 DSM should develop a recognition and reward program: DSM should develop and implement a supplier recognition program to reward suppliers on their performance. Such a program is important for the continuous improvement of suppliers and reduces overall costs and increase supplier commitment (Paragraph 7.5) The new SPMES requires an implementation plan to go live: The following DSM activities should be followed: Project preparation, Sizing and blueprinting, SAP functional development, Final preparation and Go Live (Paragraph 7.6) Current versus new SPMES overview The following most important differences between the current and the new developed system Current New - BG s use their own SPMES with different CFS s and KPI S. - BG s use the same standardised SPMES with the same CSF s and KPI S but with the option to add different weight-factors for each performance criterion. - SAP is not used for supplier - SAP is used for supplier evaluation evaluation - Supplier evaluation is time - Supplier evaluation performed with consuming - The performance criteria Innovation and Sustainability were not clear - No complaint management system to register customer and supplier complaints. - Outdated list of CSF s and KPI s - Internal SAP possibilities for supplier evaluation and supplier relationship management unknown. a push of a button. - The performance criteria Innovation and sustainability are clear due to developed and approved web-based questionnaires. - A complaint management system in place to register customer and supplier complaints. - Updated list of most important CSF s and KPI s - SAP possibilities for supplier evaluation researched and clearly described. Supplier relationship management now part of DSM s continuous improvement and evaluation process Set-up requirements for DSM s new SPMES The following SAP modules 5 are required for the new set-up: SAP Material Management (SAP-MM). SAP-MM is the largest functional module in SAP. This module mainly deals with DSM s Procurement Process, Master Data, Inventory Management, Material Requirement Planning, Invoice Verification etc. 5 For information on SAP-modules, please refer to 94
107 SAP Supplier Relationship Management (SAP-SRM). The SAP-SRM application automates, simplifies, and accelerates procure-to-pay processes for goods and services. With SAP- SRM the DSM business groups can reduce procurement costs, build collaborative supplier relationships, manage supply bases better etc. SAP Quality Management (SAP-QM). SAP-QM assures that products meet regulatory standards and meet DSM s product specifications. SAP-QM processes are thoroughly integrated into the manufacturing process. An important aspect is the possibility to create Quality Notifications which enables the recording and processing of internal or external problems that result from poor product quality. SAP Business Warehouse (SAP-BW). SAP-BW gives the option to analyse different data retrieved from DSM s IT-systems with each other. It allows the extraction, transformation and reporting of information data amongst SAP modules. SAP BW can be used to calculate and report the overall performance of a supplier. To use SAP for supplier evaluation, certain functional requirements must be met. To identify these requirements elaborated interviews with SAP specialist were performed to come to a list of six minimal requirements. DSM s new IT-set-up for the implementation of a standardised supplier performance measurement & evaluation system is visualized in figure 8 and includes the following minimal requirements: 1. The possibility to share and store information data between IT-Systems from business groups. 2. DSM supported written procedures for SAP-QM and SAP- SRM. Currently, DSM supports only the SAP-MM module with written procedures. 3. Management support for the use of SAP instead of traditional techniques for supplier evaluation. All business groups are required to use SAP in order to share information. 4. The possibility to share and store web-based questionnaires. This is important to register certain performance criteria, which are required for the new set-up. 5. The possibility to share and store (customer and supplier) complaints for the evaluation process. This is important to measure certain performance criteria, especially related to poor quality. 6. The possibility to report stored information data (using BW-report). 95
108 Figure 8 Set-up for DSM s new Supplier Performance Measurement & Evaluation System Strategic performance criteria Innovation and Sustainability are registered by the use of an online SRM web-based questionnaire that incorporates questions related to a scoring method with individual weighing factors for each performance criterion. SAP can automatically calculate a questionnaire from each of the six business groups to get an overall score. It is possible to create an individual questionnaire for each criterion. I have contributed in the development of the Innovation and Sustainability questionnaire, which both have been tested and approved by DSM. The tactical performance criteria: Cost, Flexibility, Service, and Information sharing are also registered by a SRM web based questionnaire. The operational performance criteria Quality and Delivery can be automatically retrieved from DSM s SAP- MM module. DSM s SAP-QM 8d notification report can be used to register and manage customer and supplier complaints regarding poor quality, which are required for certain performance criteria. When these systems are implemented DSM will have an elaborated supplier performance measurement and evaluation system that minimizes manual handling, speeds up the supplier evaluation process and allows performance data to be shared and analyzed between business groups. 96
109 8.2 Further research required The current IT- landscape of DSM is very complex. It comprises more SAP functionality than described in this thesis. The result of this complexity is that DSM employees find it difficult to work in this ITenvironment. The performed interviews with several SAP-specialists conclude that even they find it sometimes difficult to understand what the effects are of changes within the current IT-System. Further research is required to simplify the current DSM- landscape, so more people within DSM can use the benefits of these systems. 97
110 REFERENCES For this research professional publications from online search engines, university libraries and online knowledge portals such as: and were used. Bensaou, M. (1999) Portfolios of Buyer Supplier Relationships, Sloan Management Review Summer, pp Bourne, M. and Neely, A. (2003) Implementing performance measurement systems: A literature review, International Journal of Business Performance Management, vol. 5, pp Boynton, A.C. and Zmud, R.W. (1984) An assessment of critical success factors, Sloan Management Review, vol. 25 (4), pp Cousins, P. (1999) Supplier Base Rationalization Myth or Reality? European Journal of Purchasing and Supply Management, vol. 5, pp Crowther, D (1996) Corporate performance operates in three dimensions, Managerial Auditing Journal, 11/8. Ellram, L.M. (1990) The Supplier Selection Decision in Strategic Partnerships, Journal of Purchasing and Materials Management, vol. 20:4, pp Ellram, L.M. (1991) A managerial guide for the development and implementation of purchasing partnerships. International Journal of Purchasing and Materials Management, vol. 27 (3), pp Gordon, S.R. (2005) Seven Steps to Measure Supplier Performance, Quality Progress, pp Why Its Important to Measure Suppliers Well, Purchasing, May 4, Gordon, S.R. (2008) Supplier Evaluation and Performance Excellence, J. Ross Publishing, p. 83. Kaplan, R.S. and Norton, P.D. (1992) The balanced scorecard measures that drives performance. Harvard Business Review, vol. 70 (1), pp Kraljic, P. (1983) Purchasing Must Become Supply Management, Harvard Business Review, vol. 61, pp Krause, D.R. (1997) Supplier Development: Current Practices and Outcomes, International Journal of Purchasing and Materials Management, vol. 33:2, pp Krause, D.R. and Ellram, L.M. (1997) Critical Elements of Supplier Development.The Buying Firm Perspective, European Journal of Purchasing and Supply Management, vol. 3 (1), pp Krause, D.R., Scannell, T.V. and Calantone, R.J. (2000) A Structural Analysis of the Effectiveness of Buying Firms Strategies to Improve Supplier Performance, Decision Sciences, vol. 31:1, pp Lambert, D.M. and Harrington, T.C. (1990) Measuring Non-Response Bias in Mail Surveys, Journal of Business Logistics, vol. 11:2, pp Lambert, D.M., Adams, R.J. and Emmelhainz, M.A. (1997) Supplier Selection Criteria in the Healthcare Industry: A Comparison of Importance and Performance, International Journal of Purchasing and Materials Management, vol. 33:4, pp
111 Lamming, R., Cousins, P., and Notman, D. (1996) Beyond Supplier Assessment. Relationship Assessment Programmes, European Journal of Purchasing and Supply Management, vol. 2 (4), pp Leidecker et al. (1984) Identifying and using critical success factors, Long Range Planning, vol. 17 (1), pp Maskell, B. (1989) Performance Measures of World Class Manufacturing, Management Accounting, Rizza, Mickey North. "Supplier Performance - Reality Check", 2007, p. 9 Mintzberg, H. (1994) The Rise and Fall of Strategic Planning, Prentice-Hall, New York. Monczka, R.M. and Trecha, S.J. (1988) Cost Based Supplier Performance Evaluation, Journal of Purchasing and Materials Management, vol. 24:1, pp Monczka, R.M., Trent, R.J. and Callahan, T.J. (1994) Supply Base Strategies to Maximize Supplier Performance, International Journal of Physical Distribution and Logistics, vol. 24:1, pp Narasimhan, R. An Analytical Approach to Supplier Selection, Journal of Purchasing and Materials Management, (19:4), 1983, Neely et al. (1997) Designing performance measures; a structured approach, International Journal of Operations & Production Management, vol. 17 (11), pp. X-x. Prahalad, C.K. and Hamel, G. (1990) The Core Competence of the Corporation, Harvard Business Review, vol. 68:3, pp Ragatz, G.L., Handfield, R.B. and Scannell, T.V. (1997) Success Factors for Integrating Suppliers into New Product Development, Journal of Production and Innovation Management, vol. 14:3, pp Rockart, J.F. (1979) Chief executives define their own data needs, Harvard Business Review, vol. 57 (2), pp Rockart, J.F. and Treacy, M.E. (1982) The CEO Goes On-line, Harvard Business Review, pp Snow, C., Miles, R. and Coleman, H. (1992) Managing twenty-first century network organisations', Organizational Dynamics, Winter, pp Spekman, R., Kamauff, J. and Spear, J. (1999) Towards More Effective Sourcing and Supplier Management, European Journal of Purchasing and Supply Management, vol. 5 (2), pp Telgen, J. and Boer, de L. (2004) Purchasing Management, University Twente, pp Trent, R.J. and Monczka, R.M. (1994) Effective cross-functional sourcing teams: Critical success factors, International Journal of Purchasing and Materials Management, vol. 30 (4), pp Tully, S. (1995) Purchasing s New Muscle, Fortune, vol. 20, p. 76. Wilson, E. (1994) The Relative Importance of Supplier Selection Criteria: A Review and Update, International Journal of Purchasing and Materials Management, vol. 30:3, pp Wynstra, F., Van Weele., A. and Axelsson, B. (1999) Purchasing involvement in product development: A framework, European Journal of Purchasing and Supply Management, vol. 5, pp
112 2012 Design of a Supplier Performance Measurement & Evaluation System for DSM s Petrochemical & Energy Group APPENDICES Acc. to.s University of Twente Industrial Engineering and Management 1/27/2012
113 Measurement is the first step that leads to control and eventually to improvement. If you can t measure something, you can t understand it. If you can t understand it, you can t control it. If you can t control it, you can t improve it H. James Harrington Design of a Supplier Performance Measurement & Evaluation System for DSM s Petrochemical & Energy Group Twente University Faculty of Technology and Management Industrial Engineering & Management Author T.A. Beijer s Tutor University Dr. Ir. F. Schotanus Prof. Dr. J. Telgen Tutor DSM L. van de Walle Category Manager 2 Leiden, February 2012
114 APPENDICES Table of Content A. MSU model... 4 B. Interview questions... 6 C. Kraljic Matrix... 7 D. DSM s SET... 8 E. IT-systems related to supplier evaluation F. SAP MM R/3 Architecture G. SAP SRM H. SAP BW I. SAP Apollo for Qaulity J. DSM s delivery procedure K. Key performance indicators delivery L. SAP Apollo for delivery M. DSM s Invoice procedure N. SAP Apollo for Cost performance O. Key performance indicators flexibility P. SAP Apollo for Flexibility Q. Key performance indicators Service R. SAP Apollo for Service S. DSM s information sharing procedure T. Key performance indicators information sharing U. SAP Apollo for information sharing V. SAP Apollo for sustainability A. New developed sustainability questionnaire B. DSM s complaint management system C. Implementation plan D. Gathering of measurement results E. Analysis of the Business Groups measurement practices
, a more recent purchasing model which is currently used by the Dutch Association for Purchasing Management (NEVI) program includes eight key strategic processes and six")
115 A. MSU model The purchasing function involves more then just the purchasing process. Purchasing Excellence (PE), a more recent purchasing model which is currently used by the Dutch Association for Purchasing Management (NEVI) program includes eight key strategic processes and six enablers developed by Monczka from Michigan State University in the late 1990s (Figure 9). This Michigan State University (MSU) model makes it possible to benchmark an organization to others and to the best-in-class. Each process includes ten steps from low to high and the higher the score is the more mature an organization is and the closer an organization is to purchasing excellence. The scoring outcome can be showed in a diagram (appendix). Figure 9 The eight strategic processes of the MSU model. The following strategic processing steps are included in the MSU model: Step 1: Determine to outsource processes or to in-source processes that currently being outsourced. Step 2: Determine which commodities to use and create a strategy for each commodity with the use of crossfunctional teams. Step 3: Establish a world class supply base by optimizing the supply base through supplier reduction or costs & risk calculation from doing business with the supplier. Step 4: Develop and manage supplier relations by setting a strategy in order to identify which suppliers are worth to intensify a partnership with and to what level. Step 5: Integrate suppliers into the new product/process development process by measuring the role of the procurement department in the product creation and to that of suppliers. Step 6: Integrate suppliers into the order fulfilment process by connecting the logistical processes of the company to the supplier. 4

116 Step 7: Create supplier development and quality management by using supplier quality and improvement programs. Step 8: Manage the costs strategically across the supply chain by working together with the supplier to identify where costs can be cut. The strategic processes can not be performed without the six relevant capabilities or also called enablers. Therefore a second cycle is introduced (Figure 10). Figure 10: The six enablers of the MSU model The following strategic enablers are included in the MSU model: Step 1: Align globally the Purchasing and Supply Chain Strategies and Plans. Step 2: Develop organization and Teaming Strategies. Step 3: Deploy Globalization. Step 4: Develop Purchasing and Supply Chain Measures. Step 5: Develop and Implement enabling IS/IT-Systems. Step 6: Establish Human Resource Development and Training. Using Monczka s MSU- model the following circled steps (Figure 9&10) are directly related to the measurement and evaluation of suppliers and include the strategic process of Supplier Development & Quality Management and the development of Purchasing and Supply Chain Measures as an enabler. The elements of the strategic process Quality Management and the elements of the enabler Measurement are described in table 1 and 2 (Appendix). The link and benefits of Supplier Development and Quality management is further described in Paragraph
117 B. Interview questions 1. General Questions: - What is your role in the company? - What is the current role of purchasing at your company? Explanation: centralized or decentralized purchasing, the purchasing function within a matrix structure, strategic importance of purchasing. 2. Supply Base Questions: - How big is your Supply Base (in general)? - How is the Supply Base segmented at your company? Explanation: In order to determine which suppliers to measure the supply base needs to be segmented. This is the process of putting suppliers into groups or categories based on common attributes such as dependence, strategic importance, risks or costs, usually into A/B/C categories. o What are the segmentation criteria and weighing factors that your company uses? Explanation: How do you determine which supplier belongs to a certain category? This can be linked to corporate policy and strategy. 3. Supplier Performance Measurement and Evaluation Questions - What kind of Supplier Performance Measurement and Evaluation System do you use at you company? - Who is responsible for the supplier performance measurement and evaluation at your company? - What are the measurement criteria that your company uses for measuring supplier performance? Explanation: For example: quality, lead-time, delivery time, flexibility, technology, innovation, price, responsiveness, commitment, dependency. o How are the several measurement criteria defined? o What are the weighing factors used for the different measurement criteria? - What is the method used for data collection? Explanation; for example data comes from: Corporate Information System (SAP) other ERP systems, Surveys, Questionnaires, Site visits (audits) Scorecards, ISO. - How do you measure and evaluate a supplier that delivers different products to several sites? - In what way are measurement results communicated back to the supplier? Explanation: Face- to face meetings, sending suppliers measurement results, an internet portal that they can visit, of all together? - Do you have a special method/program to correct (adjust) and improve the performance of suppliers after a dissatisfied evaluation outcome? - Do you have a best quality award for suppliers? 6
118 C. Kraljic Matrix Kraljic classifies products on the basis of two dimensions: The importance of purchasing and supply risk (low and high). This result in a 2x2 matrixes and classification into the following four categories: non-critical products, bottleneck products, leverage products and strategic products (Figure 5.3). Figure 5.3: Kraljic (1983) Matrix Figure 5.4: DSM s mirrored approach For each of the following quadrants a different strategy is applicable (Elram, 1997): I. Strategic products: Products in this Quadrant are characterized by a high supply risk caused by scarcity or difficult delivery. The recommended strategy is to establish a close relationship with the supplier, focus on early supplier involvement, joined development of products (or services) and keeping a long-term value focus. II. Leverage products: Products is this quadrant represents a high percentage of the profit of the buyer and many suppliers are available. The recommended strategy is to exploit the favourable situation of the buyer with vendor selections, targeted pricing and with centrally negotiated umbrella agreement with preferred suppliers III. Bottleneck products: Products in this quadrant can only be acquired from one supplier and have low impact on the financial results. The recommended strategy is to develop Volume insurance and simultaneously open up other supply opportunities to improve the buyer s purchasing position. IV. Non-critical products: Products in this quadrant are not of great importance to the company. Products represent a low value and can be acquired everywhere. The recommended strategy is to reduce the number of suppliers and focus on standardisation of business processes 7
119 D. DSM s SET 8

120 9
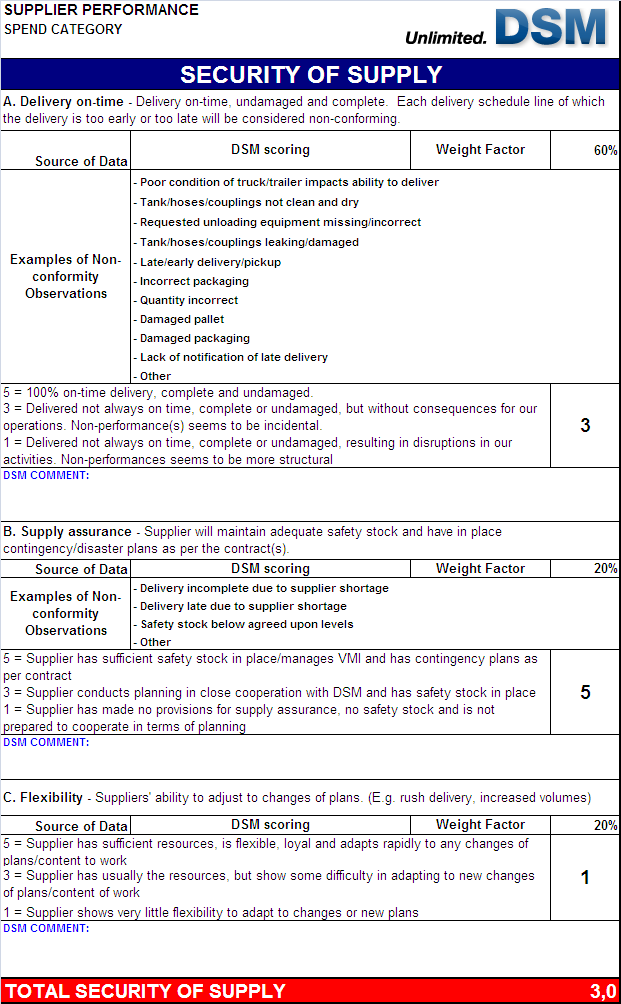
121 10
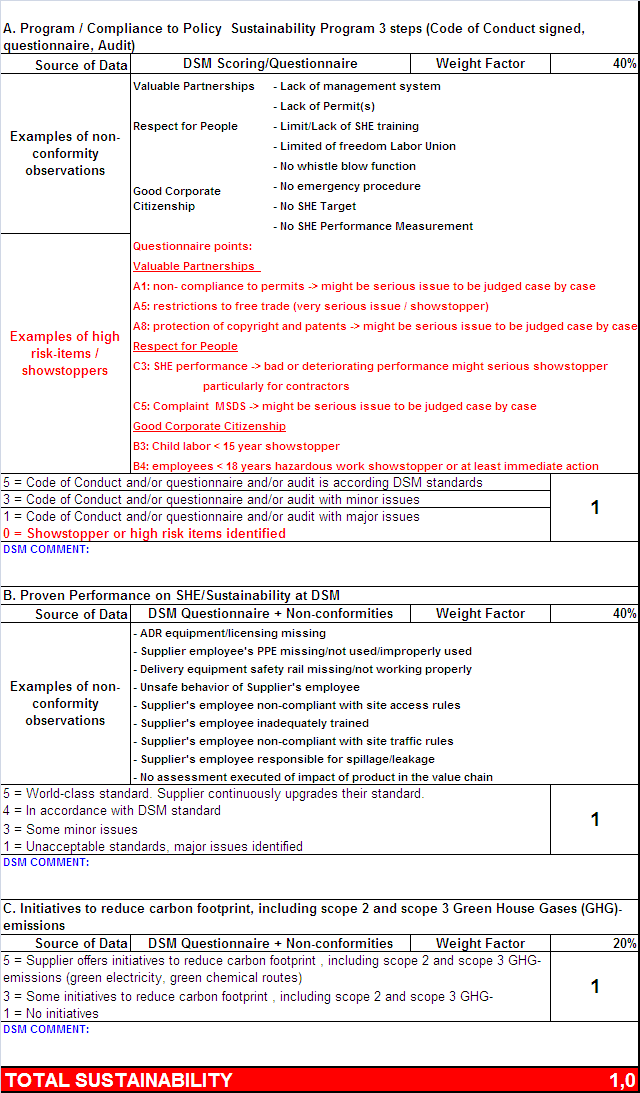
122 11

123 12
 can be used to register a limited set of operational performance data that is already registered")
124 E. IT-systems related to supplier evaluation The SAP R/3 architecture includes add-on Enterprise Resource Planning (ERP) modules that can be used for the order fulfilment and billing process. The following IT-Systems and modules are related to supplier evaluation: o Material Management (MM) can be used to register a limited set of operational performance data that is already registered within DSM s Purchase-to-Pay process (paragraph 5.1.9) such as e.g: delivery on-time, quantity and quality. Currently the SAP-MM module is not indented to be used as a full evaluation process. o Quality Management (QM) can be used for quality planning, quality assurance and quality control. The latter is important and includes an 8 discipline (8D) -report that can be used to register and solve customer and vendor complaints. o Supplier Relationship Management (SRM) can be used as a managing tool to manage the Source to Pay process. It includes the possibilities to find the right supplier, maintain contacts the process of ordering and paying of products and services using a shopping cart. o Customer Relationship Management (CRM) can be used to acquire and retain customers, gain marketing and customer insight. o Business Warehouse (BW) can be used to integrate, transform, consolidate, clean and store information data from different IT-Systems. BW Magneto (BW-M) can be used to measure the total amount of purchase spend from all suppliers in all BG- systems. BW-Magneto is linked with al the BG s and can retrieve all relevant financial data. Figure 5.7: DSM s IT-landscape related to supplier evaluation. 13
125 F. SAP MM R/3 Architecture Within standard SAP, supplier evaluation is completely integrated into the Materials Management [MM] purchasing component. This means that information such as delivery dates, prices, and quantities can be taken (automatically) from purchase orders. The SAP-MM module can use data from other modules within the (R/3) architecture such as e.g.: Production Planning (PP), Quality Management (QM), Finance & Controlling (FICO) and Sales & Distribution (SD). Following an overview of standard SAP performance criteria, which are either supported by Apollo in SAP-MM (indicated with ) or not (yet) supported by Apollo in SAP-MM (indicated with -). Group Pricing Price level: measures vendor s price against the market price (benchmark price). Price history: measures if the vendor s price development during a period of time is comparable to the development of the market price Group Quality Goods receipt: measurers the quality of the product that the supplier delivers. - Quality audit: it depends on specific rules for creating an audit notification in the QM system, a part that is not standardized by Apollo. Apollo recommends including the outcome of supplier audits in the broader vendor evaluation process that is positioned outside (R/3). - Complaints/rejection Level: it depends on specific rules for creating complaint notifications in the QM system, a part that is not standardized by Apollo. Apollo recommends including the evaluation of supplier complaints in the broader vendor evaluation process that is positioned outside R/3. Only when BG s have implemented a complaints system in (R/3) and there is a simple interface possible with the vendor evaluation process, Apollo promotes that complaints should be used as part of the vendor evaluation process. Group Delivery o o o On-time delivery Quantity reliability Confirmation date: The system measures the deviation from the confirmed delivery date. This function can only be used when there are inbound deliveries. Because Apollo does not use inbound deliveries, Apollo does not support evaluation of the confirmation date. 14
126 o Compliance to shipping instructions: This evaluation is possible only when for each goods a receipt is indicated if the shipment complies with the instructions. That requires additional training. Apollo does not support this function. Apollo does not support other non-operational performance criteria for supplier evaluation. Also the semiautomated measurement criteria and manual measurement criteria are not supported by Apollo, because these options require additional manual actions, which are vulnerable for human errors. SAP- QM (R/3 architecture) Within standard SAP, quality management is integrated into the Quality Management (QM) component within SAP (R/3) architecture (figure 5.7). It is an add-on module and can be implemented at the beginning or it can also be implemented after go-live. The QM module supports tasks related to quality planning, quality inspection and quality control. In addition, QM supports the creation of quality certificates and manages problems with the use of quality notifications. The integration of the QM module in the (R/3) architecture allows information to be shared between other applications such as Material Management (MM), Production Planning (PP), Sales & Distribution (SD) and Finance and Controlling (FICO). Following an overview of standard SAP performance criteria, which are either supported by Apollo in SAP-QM (indicated with ) or not (yet) supported by Apollo in SAP-QM (indicated with -). Group Quality: Quality planning: Includes basic data for quality management and the planning for inspections. Quality assurance: Includes the quality inspections and quality certificates. Quality control: includes quality notifications and a QM- Information System. (Only customer complaints are supported by Apollo). Quality Notifications An important aspect of the QM- module is the creation of quality notifications. These notifications should be used for the input for a Complaint Management System (CMS). A CMS can be used by DSM to achieve company specific (quality) goals. SAP supports complaint management with a flexible quality notification tool. The tool can be used to record, process, and monitor all non-conformities (problems) within an organization such as e.g. complaints against vendors, customer complaints, internal problems or other user-specific non-conformities. The creation of notifications can be important for vendor evaluation, especially for CSF s that are difficult to quantify. Therefore a test was performed (Appendix), which shows that it is possible to create notifications that are not Quality or Delivery (operational) related. However this option can not be automated and require a manual notification input, whereas SAP supported operational elements can be triggered automatically (depending on the settings). 15
127 Within QM there are two applications that can be used, QM(01) for the creation of a notification and QM(02) to modify a notification. The benefit of using SAP for Complaint Management (CM) is that the follow up is clearly described with the use of dashboards and timeframes. Table 5.3 shows the 8 disciplines that are included within the current standard QM- module, which includes an 8D-report complaint notification application. SAP QM- 8D report Discipline 1. Discipline 2. Discipline 3. Discipline 4. Discipline 5. Discipline 6. Discipline 7. Discipline 8. Form the team Describe the problem Contain the problem Identify the root cause Formulate and verify corrective actions Correct the problem and confirm the effects Prevent the problem Congratulate the team G. SAP SRM Within standard SAP, Supplier Relationship Management (SRM) is integrated into the SAP-SRM component outside the (R/3) architecture (figure 5.7). SRM is a managing tool to manage the Purchase to Pay process (figure 5.8). It can be used to find the right vendor, maintain the contacts with this vendor and handles the process of ordering and paying. The receipt handling can be done in SRM as well in the SAP-MM-module described in paragraph This means that in SRM, vendor evaluation can be used in combination with web-based surveys that can be used to evaluate vendors. The BG s can develop individual surveys and questionnaires and select the criteria that are required for the evaluation, and determine (by contract) when the evaluation has to take place. Afterwards the data gathered from the questionnaires and surveys can be transferred to SAP Business Warehouse (BW). This information can then be used for the evaluation of vendors. 16
128 Figure 5.8 DSM s Purchase-to-Pay process related to the functionalities of SAP-MM and SAP-SRM. Following an overview of standard SAP performance criteria, which are either supported by Apollo in SAP-SRM (indicated with ) or not (yet) supported by Apollo in SAP-SRM (indicated with -). Group SRM: Shopping Cart: Within SRM every purchase starts with a shopping cart, which is the equivalent of a purchase request within the SAP-MM module. Purchasers can select and buy products from a catalogue, referred to as catalogue buying. The catalogue includes the fixed price of a product when purchased from a specific supplier. DSM uses this function primarily for Maintenance, Repair and Operations (MRO) and covers materials such as office supplies, laboratory chemicals, tools, work clothing, small repair supplies and others. The creation of a shopping cart is supported by the SAP (R/3) backend system. Via the view-only application purchasers can search, find and select products and services of a number of DSM suppliers. Approval: The shopping cart has to be approved before a purchase order can made. Purchase order: Shopping carts that are approved are turned into a purchase order in SRM or a backend ERPsystem. It depends on the chosen scenario (classic, extended classic, stand-alone), which methods are later described in this paragraph. When the order is made in SRM, a copy is send to the back-end ERP-system. When the order is created in the backend ERP-system there is no order available, only the shopping cart that is used for the order. The process from creating a shopping cart and towards the purchase order can be fully automated when there is a catalogue. When information is missing or additional information is used the purchaser has to perform this step manually, which is less efficient. Goods Receipt (Confirmation). When goods are received, SRM requires a confirmation, which is the equivalent of goods receipt within the SAP- MM module. Also a copy of the confirmation is send to the back-end ERP- system and linked to the purchase order. The goods receipt can also be used directly by the MM-module. In this case a goods receipt copy will be send to SRM and linked to the shopping cart. 17
 master data.")
129 Invoice Confirmation: The Invoice that is received from the supplier for the delivered goods can be processed in SRM or a back- end ERP-system. Currently DSM uses SAP-MM and SAP FICO for invoice verification. H. SAP BW SAP- BW is an application which can be used as a reporting tool. The reports are often based on SAP (R/3) master data. DSM uses SAP-BW for the following reasons: There is a seamless integration between SAP (R/3) and SAP-BW SAP- BW is also open for information data from other databases. With SAP- BW the development of new reports is less costly then in SAP (R/3). SAP- BW includes business content that allows a fast implementation at relatively low cost. In SAP BW pre-defined reports (queries) can be made. The purchaser can generate various views on the data and if needed save such a view as a favourite report, as visualized in figure 5.9 Figure 5.9: DSM s SAP-BW reporting. Despite these benefits, SAP- BW will not replace all SAP (R/3) reporting. Currently DSM uses SAP-BW only for management reports. The operational reports will be generated in SAP (R/3). DSM also developed a special SAP kernel, called BW Magneto which allows corporate DSM to retrieve all the purchase spend by the BG s and the total spend of the supplier can be calculated. To be able to aggregate spend, the vendors in the SAP (R/3)-systems are provided with a DUNS-number from Dun & Bradstreet. I. SAP Apollo for Qaulity In standard SAP there are three automatic sub criteria for the main criterion Quality. These criteria are: Goods Receipt, Quality Audits and Complaints/ rejection level. However as described in paragraph 5.5.1, DSM works with an adapted version of SAP called SAP/Apollo. This means not all the functionalities are supported by Apollo and fully available to for vendor evaluation, which are now described in more detail. The sub criterion Goods Receipt can be used to evaluate the quality of the product that the supplier delivers. For goods receipt inspection lots can be created. Each inspection lot receives a rating, derived from the decision made 18
130 from the quality controller (warehouse staff). This rating must be on a scale from 1 to 100, where 1 is the worst possible rating, and 100 is the best possible rating. Each BG can individually build specific quality lots and tolerances for bulk or non-bulk goods. Also the weighing factors can be changed by every BG individually. The purchase orders for bulk goods that include multiple deliveries can also be split, SAP recognizes split orders. However SAP can only incorporate measurements results when a purchase order is fully closed and no further delivery occurs. The following table 6.5 visualizes the SAP default settings for the quality performance criteria. Usage Decision of Quality Calculation Usage decision Approved 100 Usage decision Accepted 80 Usage decision Restricted 50 Usage decision Split 50 Usage decision Rejected 1 Table 6.5: User decisions options for quality in standard SAP. J. DSM s delivery procedure DSM s delivery inspections are performed by the controller (warehouse staff) at the production facilities of the BG s. Petrochemical Products can arrive by truck, railroad, pipeline or barge. Next to quality DSM s inbound products are also checked on their on-time delivery, quantity, right documentation and on safety aspects. The controller checks whether deliveries of the goods are on-time and forward any non-conformities to the purchaser. When the goods are too late or too early the responsible purchaser will accept or reject the goods, depending on the impact this has on DSM s production process. DSM wants to avoid production stops due to shortage and unnecessary warehouse costs. The on-time delivery tolerances for packaged material and bulk goods are often stated in the contract are set individually by the BG s. There is no standardized delivery procedure. For the criterion Quantity the controller checks if the goods quantity with the purchasing order. For bulk products orders are often split in several deliveries, which can vary and it is therefore more difficult to define whether the sub-delivery has exactly the right quantity. The BG purchaser is responsible for checking the total amount of subdeliveries with the total quantity amount stated in the contract. The difference in quantity can also be the result of the use of different weighing bridges at different locations. Therefore for this criterion the BG s use individual tolerances for packaged material and bulk goods. These conditions are also stated in the contract. The criterion Documents is checked on the following criteria: Purchase order number, net weight, gross weight, production description, SAP material number, batch number and a certificate of analysis if required according to the quality agreement. 19
131 Safety is also an important aspect for DSM. Therefore a BG controller checks if the loading and unloading of chemicals is according to DSM s safety requirements. Truck drivers that deliver goods at the production facility must wear protective gear (helmet, earplugs, and goggles) and are obligated to pass a plant safety test in order to get access to production facilities. When one of the delivery criteria is not (fully) met delivery non-conformity occurs and a vendor complaint can be triggered. However the severity of the non-conformity and the cause that triggers a vendor complaint is not standardized between BG s. K. Key performance indicators delivery In literature the measure for delivery is Delivery reliability. To measure the total delivery reliability of the supplier, all the measurement results from the different BG s have to be used in order to evaluate the total reliability of the supplier. According to the quality definition the goods must be according to agreed specifications stated in the contract. BG s that perform quality inspection can evaluate suppliers based on their amount of quality non-conformities. A nonconformity most often results in a vendor (quality) complaint. Thus for the measurement criteria the amount of nonconformities or vendor complaint can be used for individual evaluation of the Quality reliability of the supplier. However BG s that don t use or randomly use quality inspection the non-conformities are not registered. Quality non-conformities will show by customer quality complaints related to supplier quality (internal manufacturing not accounted for). In both methods quality non-conformities will show in complaints, either in vendor complaints triggered by the BG or by customer complaints triggered by the customer. Therefore the KPI s for the CSF Delivery can be defined as: - Time reliability = 1- (number of time non-conformities/ total # of deliveries per supplier). - Quantity reliability= 1- (number of quantity non-conformities/ total # of deliveries per supplier). - Document reliability= 1- (number of document non-conformities/ total # of deliveries per supplier). - Safety reliability= 1- (number of safety non-conformities/ total # of deliveries per supplier). L. SAP Apollo for delivery In the standard SAP system there are two automatic sub criteria and a manual sub criterion for the main criterion delivery. These criteria are: On-time delivery (automatic), Quantity reliability (automatic) and QM general (manual), which includes e.g.: Documents and SHE criteria. The sub criterion on- time delivery is based on goods receipt, and compares the actual date of goods receipt with the date in the purchase order. A useful measurement of on-time delivery depends on the ordering and receipt 20
132 process. The results from the interviews (paragraph 5.6) clearly stated that one of the reasons for BG s to use traditional (OTIF) techniques instead SAP is the reliability of the master data in SAP. It is important that the delivery date in the purchase order is correct, also when the date is changed afterwards. The purchase order has two dates: the delivery date (scheduled) and the statistical (actual) date. Initially those dates are equal, but the statistical date is used for calculating the vendor s on-time delivery score. In case of changing the delivery date, it is necessary to differentia between two situations: (1) DSM initiates the changed delivery date: in this case both delivery date and statistical date must be changed, resulting in an optimal score than the supplier delivers on the newly requested date. (2) The supplier informs about the changed date. In this case the delivery date in the order must be adapted, in order to have correct planning information for operational processes. But the statistical date can be kept unchanged, because that date is the bases for evaluation. Evaluation will not work correctly when all good receipts are booked at the end of the week with the wrong date. For on time delivery inspection lots can be created. Each inspection lot receives a rating, derived from the decision made from the quality controller (warehouse staff). This rating must be on a scale from 1 to 100, where 1 is the worst possible rating, and 100 the best possible rating. Each BG can individually build specific quality lots and tolerances for bulk or non-bulk goods. BG s can also setup a Minimum delivery quantity. When a supplier delivers only a very small quantity on the requested date it cannot be considered as an on-time delivery. In order to avoid small deliveries a filter can be set in the system. The default for this filter is 30%. The following table 6.6 visualizes the SAP default settings for the on-time delivery performance criteria. On-time del. of Delivery Calculation On-time del. up to 5 days late 100 On-time del. 6 to 10 days late 80 On-time del. 11 to 20 days late 60 On-time del. 21 to 99 days late 1 On-time del. up to 5 days early 100 On-time del. 6 to 10 days early 90 On-time del. 11 to 20 days early 50 On-time del. 21 to 99 days early 25 Table 6.6: User decisions options for on-time delivery in standard SAP. There is also an option in SAP to set the minimum delivery quantity per material, and even to set the number of days per material. With the Apollo default this function is not activated, though BG s have the freedom to activate it. The reason for this is that these parameters vary per material and the evaluation process become more complex. 21
133 The sub criterion quantity reliability is based on goods receipt, and is measured when a purchase order item is closed and no more deliveries are expected. Then the total receipt is compared to the ordered quantity. BG s often use partial deliveries, especially for bulk products. In order to have a correct evaluation when partial delivery are used is to use the delivery completed indicator. It is also possible when a purchase order is closed to equalize order quantity with the actual receipt, but these results are of course unreliable. This type of evaluation is executed per purchase order line, therefore special focus is required for framework orders or scheduling agreements that are open for a long time with multiple deliveries are received. Most evaluations are made per item line. The following table 6.7 visualizes the SAP default settings for the quantity performance criteria. Qty. reliability or Delivery Calculation Qty. reliability no variance 100 Qty. reliability within 5%+ 95 Qty. reliability 6 to 10%+ 90 Qty. reliability 11 to 20%+ 20 Qty. reliability 21 to 99% + 1 Qty. reliability within 5%- 95 Qty. reliability 6 to 10%- 90 Qty. reliability 11 to 99% - 20 Table 6.7: User decisions options for quantity in standard SAP. The criterion QM general is based on goods receipt, and compares the actual status of documents or safety aspects of that of DSM s inbound goods policy. Within the current SAP/Apollo module these criteria can be manual put in system as a document or safety complaints. BG s can use individual weighing factors for these criteria, depending on the safety and other aspects of the product. M. DSM s Invoice procedure DSM s logistic invoice verification is situated at the end of the purchasing process, as visualized in figure 6.3 (circled). In SAP-MM and SAP-FICO, incoming invoices are most often verified in terms of their content, price, and quantity according to the Purchase Order (PO) and the Goods Receipts (GR). This process is also called the three ways match (Appendix). When an Invoice is received the financial department of a BG checks whether an invoice is accurate and process the invoice for payment. When the invoice is posted, the invoice data is saved in the system. The system updates the data saved in the invoice documents in materials management (MM) and financial accounting (FICO). It is also possible to perform invoice verification in SAP-SRM, however this function is not 22
134 standardized by Apollo. Figure 6.3 DSM s invoice verification within the purchasing process. N. SAP Apollo for Cost performance In the standard SAP MM-module there are three automatic sub criteria for the main criterion Cost. These criteria are: Price level, Price history and Invoice Accuracy. The sub criterion Price level compares the price of the products of the supplier to the market price. It is important to have a valid market price in the system. Apollo uses the standard price from the material master data as the market price. SAP can copy the standard price from the material master to the table where the vendor evaluation module retrieves the standard price. However the update has to run periodically because the standard prices are adjusted once per quarter. When a single supplier is used for a material/product, the material will be ignored for vendor evaluation for price level. The following table 6.9 visualizes the SAP default settings for the price levels. BG s are allowed to modify the evaluation parameters. Price level of Price Calculation Price level no variance 80 Price level 1-5% higher 60 Price level 6-20% higher 20 Price level 21-50% higher 5 Price level 50% or above 1 Price level 1 5 % lower 90 23
135 Price level 6 10 % lower 95 Price level 11 % lower or more 100 Table 6.9: User decisions options for price level in standard SAP. The sub criterion Price history measures if the price development in the time is comparable to the development of the market price. The same situation applies for market price and single source of supply are valid as for the price level. The following table 6.10 visualizes the SAP default settings for price behaviour. BG s are allowed to modify the evaluation parameters. Price Behaviour of Price Calculation Price Behaviour no variance 80 Price Behaviour 1-5% higher 60 Price Behaviour 6-20% higher 20 Price Behaviour 21-50% higher 5 Price Behaviour 50% or above 1 Price Behaviour 1 5 % lower 90 Price Behaviour 6 10 % lower 95 Price Behaviour 11 % lower or more 100 Table 6.10: User decisions options for price behaviour in standard SAP. The sub criterion Invoice accuracy measures the accuracy of the suppliers invoices to that of the purchase order. There are three options for using SAP for this criterion: (1) Use SAP-MM and SAP-FICO to automatically measure invoice accuracy. However paragraph describes that invoice accuracy most often requires manual procedures. Thus, using automatic criteria for invoice verification is not the best option. (2) Use SRM for invoice verification, which includes the possibility to use qualitative factors such as, e.g.: questionnaire in combination with the experience of the purchaser. This option is not recommended because a quantitative approach is required by DSM. (3) Use the measurer Cost non-conformities and derived supplier complaints in the system with the use of ability to create notifications from SAP-QM. The latter option is recommended in combination with a complaint management system. The registered complaints can be used within the scoring process with other modules within (R/3) such as SAP-MM and SAP-QM. 24
136 O. Key performance indicators flexibility In literature there are different measures for the Criterion Flexibility, it depends on the definition used. For the new design DSM can measure the amount of Time deliveries granted and the amount Volume changes granted. Therefore the KPI s for the CSF Flexibility can be defined as: - The amount of Time deliveries granted (e.g. rush deliveries) = 1- (number of changes of time deliveries/ total amount of changes requested per supplier). - The amount of Volume changes granted = 1- (number of changes of volume deliveries/ total amount of changes requested per supplier). However, it is not recommended to measure these KPI s. The literature review describes that for the criterion Flexibility often a more subjective (qualitative) approach should be used. The time and related cost associating to measure the time deliveries and volume changes outweigh the benefits of using this P. SAP Apollo for Flexibility Sap/Apollo does not support the criterion Flexibility and other tactical or strategic (non- operational) performance criteria. There are two options for using SAP for this criterion: (1) Use the measurer Flexibility non-conformities and derived vendor complaints in the system with the ability to create notifications from SAP-QM. This option is not recommended, because it requires a target setting for when a complaint is triggered, which is difficult when the criterion is not measured and when a more qualitative approach is used. (2) Use SAP-SRM for Flexibility, which includes a customized web-based questionnaire with above mentioned two KPI-questions related to a scoring criteria (Appendix). The responsible purchaser rates both questions based on experience, with a score between 1-10 (from low to high). A BG can individual change the weighing factors. The scoring output can be used with other performance criteria within the (R/3) architecture. This option is recommended because the scoring process is fast and information can be stored in SAP. Q. Key performance indicators Service In literature there are different measures for the Criterion Service, it depends on the definition used. For the new design DSM can measure the response time to complaints and the problem solving capability of the supplier. The other measures within SET such as e.g.: repetitive behaviour the responsiveness should not be included for an efficient supplier evaluation for complexity reasons. Therefore the KPI s for the CSF Service can be defined as: - The responsiveness to complaints within the agreed timeframe = Time between the action (follow-up) of complaint and the time of origin of complaints, compared to the agreed specifications. 25
137 - The amount of satisfied-resolved complaints within the agreed timeframe measures the deviation in problem solving capability of the supplier = 1- (number of complaints that are solved according to specification within the agreed timeframe/ total amount of complaints that need to resolved). However, it is not recommended to measure these KPI s. The literature review describes that also for the criterion Service a more subjective (qualitative) approach should be used. The time and related cost associating to measure the responsiveness of complaints and amount of satisfied complaints outweigh the benefits of using this criterion for supplier evaluation. There must be trade-off between efficient supplier evaluation and including quantitative performance criteria within a supplier evaluation framework. For this criterion the responsible purchaser should use a qualitative approach and evaluate the supplier based on experience. R. SAP Apollo for Service Sap/Apollo does not support the criterion Service and other tactical or strategic (non- operational) performance criteria. There are two options for using SAP for this criterion: (1) Use the measurer Service non-conformities and derived vendor complaints in the system with the ability to create notifications from SAP-QM. This option is not recommended, because it requires a target setting for when a complaint is triggered, which is difficult when the criterion is difficult to quantify and a more qualitative approach is used. (2) Use SAP-SRM for Service, which includes a customized web-based questionnaire with the above mentioned two KPI-questions related to a scoring criteria. The responsible purchaser rates both questions based on experience, with a score between 1-10 (from low to high). A BG can individual change the weighing factors. The scoring results can be used with other performance criteria within the (R/3) architecture. This option is recommended because the scoring process is fast and information can be stored in SAP S. DSM s information sharing procedure The performance criterion Information sharing is referred in DSM s SET to the CSF Market Information, which includes the willingness of the supplier to: exchange market information, conduct regular business reviews, share major trends in the market and is prepared to conduct join studies. The information flow between DSM and the supplier includes materials, financial factors and information, as visualized in figure 6.5. There are no hard criteria for the type or amount of information shared between DSM and the supplier. However both parties most often (informal) agree that important market information should be exchanged, but the sharing of information is not obligated. Information can be shared during meetings with the supplier or by phone and , there is no standard procedure. 26

138 Figure 6.5: DSM s information flow between DSM and supplier. T. Key performance indicators information sharing In literature there are different measures for the criterion Information sharing, it depends on the definition used. For the new design DSM can measure the willingness of the supplier to share market information. The other measures within SET such as e.g.: conducting regular business reviews and join studies should not be included for an efficient supplier evaluation for complexity reasons. Therefore the KPI s for the CSF Information Sharing can be defined as: - The willingness to share market information measures the percentage = the number of times market information is shared /number of times DSM performed business with the supplier. However, it is not recommended to measure this KPI. The literature review describes that also for the criterion information sharing a more subjective (qualitative) approach should be used. The time and related cost associating to measure the times that a supplier shared market information outweigh the benefits of using this criterion for supplier evaluation. There must be trade-off between efficient supplier evaluation and including quantitative performance criteria within a supplier evaluation framework. For this criterion the responsible purchaser should use a qualitative approach and evaluate the supplier based on experience. U. SAP Apollo for information sharing Sap/Apollo does not support the criterion Information sharing and other tactical or strategic (non- operational) performance criteria. There are two options for using SAP for this criterion: (1) Use the measurer Information sharing non-conformities and derived vendor complaints in the system with the ability to create notifications from SAP-QM. This option is not recommended, because it requires a target setting for when a complaint is triggered, which is difficult when the criterion is difficult to quantify and a more qualitative approach is used. (2) Use SAP- SRM for Information sharing, which includes a customized web-based questionnaire with above mentioned one KPI-question related to a scoring criteria (Appendix). The responsible purchaser rates both questions based on experience with a score between 1-10, (from low to high). A BG can individual change the weighing factors. The 27
 performance criteria.")
139 scoring results can be used with other performance criteria within the (R/3) architecture. This option is recommended because the scoring process is fast and information can be stored in SAP. V. SAP Apollo for sustainability Sap/Apollo does not support the criterion Sustainability and other tactical or strategic (non- operational) performance criteria. DSM should use SAP-SRM for Sustainability, which includes a customized web-based questionnaire with questions from the four dimensions General factors, People, Planet and Profit related to a scoring criteria (Appendix). The responsible purchaser rates questions based on experience, with a specific score between 1-5 (from high to low) related to each sub question. The weighing factors are fixed (developed from corporate level) and should not be individual changed. The scoring results can be used with other performance criteria within the (R/3) architecture. This method is recommended because the scoring process is fast and information can be stored in SAP. A. New developed sustainability questionnaire. 28

140 29

141 30
www.pwc.nl Procurement Transformation: Towards Sourcing & Procurement Excellence
 www.pwc.nl Procurement Transformation: Towards Sourcing & Procurement Excellence PwC firms provide Industry-focused Assurance, Tax and Advisory services to enhance value for their clients. More than 161.000
2016 Survey on Leadership Development. Copyright Borderless - http://borderless.net
 2016 Survey on Leadership Development Table of Contents 3 9 Executive Summary About Survey Respondents 15 Leadership Development definition & scope Leadership Development inside organizations 24 36 Leadership
Outsourcing in control
 Outsourcing in control Outsourcing within Rabobank Centraal Twente; Facility Services - Summary - Ruben B.G. Rouhof Hengelo (ov), June 2010 Summary The summary of the master report is structured as follows;
Supply Chain Acceleration: Our Offering for Enabling Growth
 Supply Chain Acceleration: Our Offering for Enabling Growth Supply Chain Acceleration Services Supply Chain Acceleration (SCA) brings together 30 years of supply chain knowledge and domain expertise, that
Talking your Language. E-WorkBook 10 provides a one-platform, single source of truth without adding complexity to research
 Talking your Language E-WorkBook 10 provides a one-platform, single source of truth without adding complexity to research Meet E-WorkBook 10 In January 2015 we launched E-WorkBook 10 - the next step in
BUSINESS INTELLIGENCE. Keywords: business intelligence, architecture, concepts, dashboards, ETL, data mining
 BUSINESS INTELLIGENCE Bogdan Mohor Dumitrita 1 Abstract A Business Intelligence (BI)-driven approach can be very effective in implementing business transformation programs within an enterprise framework.
Control and Synergies in the Outsourced Supply Chain -
 Control and Synergies in the Outsourced Supply Chain - Recommendations for how to improve and organize Tetra Pak s supply chain. CLARA CARLSSON & JOHAN RASMUSSON 2005-01-17 Lund Institute of Technology,
Why Professional Services Firms Need an Integrated ERP Solution
 A Computer Generated Solutions, Inc. White Paper Why Professional Services Firms Need an Integrated ERP Solution Microsoft Dynamics Case Study 2011 Table of Contents ERP Landscape... 3-4 A More Focused
Transforming Enterprise
 Transforming Enterprise OpenERP Solutions www.apagen.com About Apagen Appearance Apagen Solutions, head office is based out of Delhi Apagen is a sister concern of Enventa Group Track record of world class
Supply Chain Management and Value Creation
 Supply Chain Management and Value Creation YAN Xi 1, KANG Canhua 2 School of Economics, Wuhan University of Technology, Wuhan 430070, China 1. cassie_yan@163.com, 2.kchhua@whut.edu.cn Abstract: In recent
Management-Forum Strategic MDM
 Management-Forum Strategic MDM Frankfurt / Hilton Frankfurt Airport Value Chain Excellence. Strategy to Results. Master Data Management Strategy Agenda 1 Survey MDM: Strategic Master Data Management (Extract)
Outsourcing. A Global Speech Networks Whitepaper
 Everything you need to know about Outsourcing A Global Speech Networks Whitepaper Global Speech Networks Pty Ltd 2012 Level 12, 114 Albert Road South Melbourne, Victoria 3205 (+613) 9015 2555 www.globalspeechnetworks.com.au
Talent Suite @ Tessenderlo Group
 Talent Suite @ Tessenderlo Group Hiring Management Performance Management Integrated Talent Suite global, single platform for Talent support key HR processes critical for implementation of HR strategy
Transport Management from a Shipper s Perspective
 Transport Management from a Shipper s Perspective Utilizing the Analytical Hierarchy Process to assess the shipper s transport outsourcing decision Author P.J. Marijnissen 1102214 January 8, 2009 Final
BEST PRACTICES RESEARCH
 2013 Frost & Sullivan 1 We Accelerate Growth Entrepreneurial Company of the Year Award Pharmaceutical Knowledge Process Outsourcing North America, 2013 Frost & Sullivan s Global Research Platform Frost
Organizing for Sourcing Excellence Insights for impact on profitability and revenue.
 Organizing for Sourcing Excellence Insights for impact on profitability and revenue. The Transformation of Procurement Strategic decision making opportunities that can have immediate impact on profitability
How To Improve Profits At Dismana
 Life Sciences and Materials Sciences Presentation to Investors Q1 2015 Results, 29 April 2015 Safe harbor statement This presentation may contain forward-looking statements with respect to DSM s future
Speed, Agility and Muscle:
 New White Paper from ISG & GEP Speed, Agility and Muscle: The Rise of Procurement Outsourcing in the Results-Driven Enterprise Executive Summary With long-term economic and revenue trends uncertain, both
MEASURING PURCHASING PROCESS IN CONSTRUCTION INDUSTRY: CASE X OY HANKINTAPROSESSIN MITTAAMINEN RAKENNUSALALLA: CASE X OY.
 School of Business International Business Bachelor s Thesis MEASURING PURCHASING PROCESS IN CONSTRUCTION INDUSTRY: CASE X OY HANKINTAPROSESSIN MITTAAMINEN RAKENNUSALALLA: CASE X OY Autumn 2012 Date: 12.12.2012
Accenture Advanced Enterprise Performance Management Solution for SAP
 Accenture Advanced Enterprise Performance Management Solution for SAP Helping oil and gas companies exploit today s insight and fuel tomorrow s high performance In the recent Accenture High Performance
The First Decade: 1999-2009. Dow Jones Sustainability Indexes
 The First Decade: 1999-2009 Dow Jones Sustainability Indexes The first decade Since 1999, a growing number of investors have started identifying sustainability issues as key factors for financial success.
Rockwell Automation Supplier Handbook. Meeting Our Customer s Needs Through Supplier Partnerships
 Rockwell Automation Supplier Handbook Meeting Our Customer s Needs Through Supplier Partnerships 3 Doing Business a Better Way As a Rockwell Automation supplier, you are critical to our company s success
Mastering working capital to build financially sustainable supply chains: A research perspective
 Mastering working capital to build financially sustainable supply chains: A research perspective Simon Templar I would like to acknowledge the assistance of the International Supply Chain Finance Community
Eliminating Barriers for the Next-Generation of Manufacturing MAKE COMPLEXITY AN OPPORTUNITY WITH GREATER COLLABORATION
 Eliminating Barriers for the Next-Generation of Manufacturing MAKE COMPLEXITY AN OPPORTUNITY WITH GREATER COLLABORATION The economic downturn has heightened the pressure on manufacturing enterprises to
MANAGED SERVICES IMPACT ON THE TELECOM INDUSTRY
 284 23-3115 Uen MANAGED SERVICES IMPACT ON THE TELECOM INDUSTRY March 2007 White Paper By adopting the Managed Services concept, operators can reduce their costs and increase their competitiveness. Contents
Six Key Trends Changing Supply Chain Management Today. Choosing the optimal strategy for your business
 A Knowledge-Driven Consulting White Paper 2009 Corporation Six Key Trends Changing Supply Chain Management Today Choosing the optimal strategy for your business Contents Demand Planning.........................................
A s s e t I n f o r m a t i o n M a n a g e m e n t
 A s s e t I n f o r m a t i o n M a n a g e m e n t M i s s i o n C r i t i c a l 2 4 / 7 U p t i m e M a i n t a i n L i c e n s e t o O p e r a t e E n s u r e A s s e t P e r f o r m a n c e R e g u
Center for Business and Industrial Marketing
 Center for Business and Industrial Marketing Dr. Wesley Johnston, Executive Director, CBIM J. Mack Robinson College of Business Georgia State University Editor, Journal of Business & Industrial Marketing
How To Know How To Perform Well In An Organizational Change Management Project
 BEST PRACTICES SURVEY: AGGREGATE FINDINGS REPORT Organizational Change Management: Effective Strategies to Drive Implementation Success November 2007 Table Of Contents Program Background and Study Objectives...
10 Fundamental Strategies and Best Practices of Supply Chain Organizations
 10 Fundamental Strategies and Best Practices of Supply Chain Organizations Robert J. Engel, C.P.M. National Director of Client Service Resources Global Professionals - SCM Practice 713-403-1979: Bob.Engel@Resources-us.com
A Compelling Case for AP Automation in the Cloud
 WHITE PAPER Purchase-to-pay by ReadSoft Author: Daneen Storc December 2012 Copyright ReadSoft - www.readsoft.com A Compelling Case for AP Automation in the Cloud A Compelling Case for AP Automation in
Services Competitive Product Strategy Leadership Innovation Award and Leadership Award
 2013 2014 2014 Global Governmental 2013 North American Online Voting SSL Certificate and Election Modernization Services Competitive Product Strategy Leadership Innovation Award and Leadership Award Frost
2015 Russian Nanotechnology Investment Enabling Technology Leadership Award
 2015 Russian Nanotechnology Investment Enabling Technology Leadership Award 2015 Contents Background and Company Performance... 3 Technology Leverage and Customer Impact of OJSC RUSNANO... 3-5 Conclusion...
Strategies and Methods for Supplier Selections - Strategic Sourcing of Software at Ericsson Mobile Platforms
 Strategies and Methods for Supplier Selections - Strategic Sourcing of Software at Ericsson Mobile Platforms Caroline Raning & Johanna Vallhagen February 2007 Department of Industrial Management and Logistics,
INSERT COMPANY LOGO HERE. Solutions for Discrete Product Industries Leadership New Product Award Innovation Award
 2013 2014 INSERT COMPANY LOGO HERE 2014 Global Plant 2013 North Data Management American SSL and Certificate Quality Optimization Solutions for Discrete Product Industries Leadership New Product Award
Strategic Solutions that Make Your Work Easier. Projects Made Easier Decisions Made Easier Business Made Easier
 Strategic Solutions that Make Your Work Easier Projects Made Easier Decisions Made Easier Business Made Easier Have You Outgrown Your Systems? Buyers Say the Partner and the Product are More Important
Developing a CRM Platform: a Bulgarian case
 Developing a CRM Platform: a Bulgarian case SOFIYA VACHKOVA OmegaSoft Ltd. 51 Aleksandar Malinov Blvd., 1712 Sofia BULGARIA sophy.v@gmail.com http://www.omegasoft.bg ELISSAVETA GOUROVA Faculty of Mathematics
Drive to the top. The journey, lessons, and standards of global business services. kpmg.com
 Drive to the top The journey, lessons, and standards of global business services kpmg.com The new normal for global enterprises is about doing more with less while at the same time driving the top line
Market Intelligence as a Strategic Weapon
 PESA SUPPLY CHAIN SEMINAR FEBRUARY 18, 2015 Market Intelligence as a Strategic Weapon Edward J. Koval Chief Procurement Officer & Vice President Global Supply Chain & Procurement Spectra Energy Agenda
Partnership for Polymer Intermediates & Composite Resins
 DSM in motion: driving focused growth Partnership for Polymer Intermediates & Composite Resins Investor Presentation 16 March 2015 Safe harbor statement This presentation may contain forward-looking statements
Supplier Relationships Lecture 7. Briony Boydell Managing Business Relationships
 Supplier Relationships Lecture 7 Briony Boydell Managing Business Relationships Objectives of lecture Identify the types of relationships within the supply chain Discuss the benefits of improved relations
IT Service Desk Health Check & Action Plan
 IT Service Desk Health Check & Action Plan Version: 1.0 Date: April, 2003 Authors: Fatima Cabral, Gary Case, David Ratcliffe Pink Elephant Leading the Way in IT Management Best Practices www.pinkelephant.com
CASE STUDY: IIS GIVES A GLOBAL BEAUTY AND FASHION COMPANY AN IT MAKE-OVER MISSION ACCOMPLISHED
 CASE STUDY: IIS GIVES A GLOBAL BEAUTY AND FASHION COMPANY AN IT MAKE-OVER MISSION ACCOMPLISHED IIS GIVES A GLOBAL BEAUTY AND FASHION COMPANY AN IT MAKE-OVER IIS is a long-time trusted resource to one of
Management Update: The Eight Building Blocks of CRM
 IGG-06252003-01 S. Nelson Article 25 June 2003 Management Update: The Eight Building Blocks of CRM Customer relationship management (CRM) represents the key business strategy that will determine successful
Visual Enterprise Architecture
 Business Process Management & Enterprise Architecture Services and Solutions October 2012 VEA: Click About to edit Us Master title style Global Presence Service and Solution Delivery in 22 Countries and
The New Data Integration Model. The Next Real B2B Integration Opportunity for System Integrators & VARs
 The New Data Integration Model The Next Real B2B Integration Opportunity for System Integrators & VARs 2 In this E-book This E-book highlights a new framework called the New Integration Model created to
Boost the performance of your Accounts Payable and Treasury departments thanks to the Ariba Network
 Boost the performance of your Accounts Payable and Treasury departments thanks to the Ariba Network Franck Dupas, Business Networks Executive / SAP France September 9th, 2015 Optimizing Payables Via Invoice
Driving an Upswing in a Downturn at PolyOne. High Performance through Business Transformation
 Driving an Upswing in a Downturn at PolyOne High Performance through Business Transformation PolyOne Corporation is a premier global provider of specialized polymer materials, tailored services and end-to-end
MarketsandMarkets. http://www.marketresearch.com/marketsandmarkets-v3719/ Publisher Sample
 MarketsandMarkets http://www.marketresearch.com/marketsandmarkets-v3719/ Publisher Sample Phone: 800.298.5699 (US) or +1.240.747.3093 or +1.240.747.3093 (Int'l) Hours: Monday - Thursday: 5:30am - 6:30pm
Global Supply Chain Control Towers
 Cove r-re rre fere nce Nu um b er e - r Global Supply Chain Control Towers Achieving end-to-end Supply Chain Visibility LOBAL L CONTROL TOWER Prepared and edited by: Gaurav Bhosle Capgemini Consulting
Business Intelligence. Technology Innovation and Business Solutions
 Introductions Tyler Sherman :: CEO, Motivity Solutions» Defining» How business intelligence is being used by mortgage bankers today Jim Connell :: CIO, Sierra Pacific Mortgage» Defining your scorecard»
RESEARCH NOTE NETSUITE S IMPACT ON MANUFACTURING COMPANY PERFORMANCE
 Document K59 RESEARCH NOTE NETSUITE S IMPACT ON MANUFACTURING COMPANY PERFORMANCE THE BOTTOM LINE When Nucleus analysts investigated the use of NetSuite by manufacturers, they found these companies were
Process Automation Markets 2010
 PRESS RELEASE Important Findings of the New Market, Strategy, and Technology Report Process Automation Markets 2010 Development of the automation world market for the process industries until 2010 World
The Business Value of a Complete Front Office and Back Office Process and Technology
 The Business Value of a Complete Front Office and Back Office Process and Technology WHITE PAPER NEW ECONOMIC REALITIES One of the most complex management challenges found in any enterprise today is managing
Recruitment and Selection
 Recruitment and Selection The recruitment and selection belongs to value added HR Processes. The recruitment is about: the ability of the organization to source new employees, to keep the organization
Chapter: IV. IV: Research Methodology. Research Methodology
 Chapter: IV IV: Research Methodology Research Methodology 4.1 Rationale of the study 4.2 Statement of Problem 4.3 Problem identification 4.4 Motivation for the research 4.5 Comprehensive Objective of study
SIMATIC IT Production Suite Answers for industry.
 Driving Manufacturing Performance SIMATIC IT Production Suite Answers for industry. SIMATIC IT at the intersection of value creation processes With SIMATIC IT, Siemens is broadening the scope of MES. Plant
Call Center Optimization. Utility retail competition is about customer satisfaction, and not just retail prices
 Energy, Utilities and Chemicals the way we see it Call Center Optimization Utility retail competition is about customer satisfaction, and not just retail prices Customers critical awareness; emancipation
PROCUREMENT OUTSOURCING: The 10 Things Companies Really Want to Know
 PROCUREMENT OUTSOURCING: The 10 Things Companies Really Want to Know By Jason Gilroy Vice President of Outsourcing ICG Commerce As featured in: Over the past year, ICG Commerce has seen an unprecedented
The Future of Global Consulting Services and IDS Consulting
 The Future of Global Consulting Services and IDS Consulting Ivo Totev Chief Services Officer & Executive Board Member Software AG Josef Bommersbach Executive Board IDS Scheer, responsible for operations
Achieving high performance with Accenture s on-demand solution for the chemical industry. Driving business performance with SAP Business ByDesign
 Achieving high performance with Accenture s on-demand solution for the chemical industry Driving business performance with SAP Business ByDesign 2 Accenture helps small to mid-size companies and subsidiaries
Generating Value through Sourcing and Procurement Services
 Generating Value through Sourcing and Procurement Services 0 (VPS) VPS - since 2005 provides specialized support to the Management through effective and innovative solutions for Sourcing & Procurement.
Managing Expansion and Complexity in Growing Chemical Enterprises
 Chemicals Managing Expansion and Complexity in Growing Chemical Enterprises Table of Contents 3 SAP ERP: Not Just for Large Enterprises 4 The Next-Generation Deployment Model: Chemical Company in a Box
Introduction to Strategic Supply Chain Network Design Perspectives and Methodologies to Tackle the Most Challenging Supply Chain Network Dilemmas
 Introduction to Strategic Supply Chain Network Design Perspectives and Methodologies to Tackle the Most Challenging Supply Chain Network Dilemmas D E L I V E R I N G S U P P L Y C H A I N E X C E L L E
BUSINESS INTELLIGENCE
 BUSINESS INTELLIGENCE Microsoft Dynamics NAV BUSINESS INTELLIGENCE Driving better business performance for companies with changing needs White Paper Date: January 2007 www.microsoft.com/dynamics/nav Table
VISION BPM. Business Process Management. www.visionware.ro
 VISION BPM Business Process Management 2 Streamline your business processes with is an integrated business processes modeling, optimization and management solution enabling companies to increase their
11741 E-Business Credit Hours: 3 11752 Integrated Application Systems Credit Hours: 3 11742 Enterprise Systems Architecture Credit Hours: 3
 11741 E-Business E-Business is radically changing the ways in which business organizations operate and compete in the global market. This course introduces students to various aspects and models for e-business.
Meeting Professionals International (MPI) June 2006, www.mpiweb.org
 June 2006, www.mpiweb.org") 1 360º of Teamwork: How Meetings and Travel Professionals Can Build Strategic Synergies to Drive Results A Position Paper from Meeting Professionals International s Global Corporate Circle of Excellence
1 360º of Teamwork: How Meetings and Travel Professionals Can Build Strategic Synergies to Drive Results A Position Paper from Meeting Professionals International s Global Corporate Circle of Excellence
mysap ERP FINANCIALS SOLUTION OVERVIEW
 mysap ERP FINANCIALS SOLUTION OVERVIEW EFFECTIVE FINANCIAL MANAGEMENT ... IS KEY TO BUSINESS SUCCESS mysap ERP FINANCIALS YOUR BUSINESS, YOUR FUTURE, YOUR SUCCESS mysap ERP is the world s most complete
Data Governance: A Business Value-Driven Approach
 Data Governance: A Business Value-Driven Approach A White Paper by Dr. Walid el Abed CEO January 2011 Copyright Global Data Excellence 2011 Contents Executive Summary......................................................3
Diagram. Microsoft Dynamics Sure Step Methodology
 Diagram Microsoft Dynamics Sure Step Methodology Designed to enable you to better serve your customers by helping reduce their Microsoft Dynamics total cost of ownership, the Sure Step Methodology can
Predicts 2004: Supplier Relationship Management
 Strategic Planning, D. Hope-Ross Research Note 17 November 2003 Predicts 2004: Supplier Relationship Management Enterprises using technology to improve supplier relationships should pay attention to changes
ERP/EDI INTEGRATION METHODOLOGIES In-House versus Hosted. Prepared by John Simmons
 ERP/EDI INTEGRATION METHODOLOGIES In-House versus Hosted A White Paper Prepared by John Simmons Table of Contents PREFACE 1 OVERVIEW 1 SELECTING A MODEL 2 A STUDY OF MODEL ADVANTAGES AND COST COMPARISONS
ITA Dynamics Waste & Recycling Document Management System enwis) DOCMA
 DOCMA") ITA Dynamics Waste & Recycling Document Management System enwis) DOCMA From a technological point of view, ITA Dynamics enwis) Docma is the optimum product for Microsoft SharePoint and enlarges SharePoint
ITA Dynamics Waste & Recycling Document Management System enwis) DOCMA From a technological point of view, ITA Dynamics enwis) Docma is the optimum product for Microsoft SharePoint and enlarges SharePoint
2013 ICT Enterprise Insights in the Life Sciences Industry
 2013 ICT Enterprise Insights in the Life Sciences Industry Key findings from the 2013 survey results Reference Code: IT010-000185 Publication Date: 03 Oct 2013 Author: Andrew Brosnan SUMMARY Catalyst The
2012 Global Online Analytics Enabling Technology Award
 2011 South African Data Centre Green Excellence Award in Technology Innovation Cybernest 2012 2012 Global Online Analytics Enabling Technology Award 2011 Frost & Sullivan 1 We Accelerate Growth Enabling
Quick Guide: Meeting ISO 55001 Requirements for Asset Management
 Supplement to the IIMM 2011 Quick Guide: Meeting ISO 55001 Requirements for Asset Management Using the International Infrastructure Management Manual (IIMM) ISO 55001: What is required IIMM: How to get
Customer Satisfaction Using Surveys
 Introduction Customer Satisfaction is the measure that indicates current and can be a leading indicator for future performance. Although each individual or organization may have their own expectations,
Data Governance: A Business Value-Driven Approach
 Global Excellence Governance: A Business Value-Driven Approach A White Paper by Dr Walid el Abed CEO Trusted Intelligence Contents Executive Summary......................................................3
An Enterprise Resource Planning Solution (ERP) for Mining Companies Driving Operational Excellence and Sustainable Growth
 for Mining Companies Driving Operational Excellence and Sustainable Growth") SAP for Mining Solutions An Enterprise Resource Planning Solution (ERP) for Mining Companies Driving Operational Excellence and Sustainable Growth 2013 SAP AG or an SAP affi iate company. All rights reserved.
SAP for Mining Solutions An Enterprise Resource Planning Solution (ERP) for Mining Companies Driving Operational Excellence and Sustainable Growth 2013 SAP AG or an SAP affi iate company. All rights reserved.
Supply Chain Management Build Connections
 Build Connections Enabling a business in manufacturing Building High-Value Connections with Partners and Suppliers Build Connections Is your supply chain responsive, adaptive, agile, and efficient? How
Mapping COBIT 5 with IT Governance, Risk and Compliance at Ecopetrol S.A. By Alberto León Lozano, CISA, CGEIT, CIA, CRMA
 Volume 3, July 2014 Come join the discussion! Alberto León Lozano will respond to questions in the discussion area of the COBIT 5 Use It Effectively topic beginning 21 July 2014. Mapping COBIT 5 with IT
What s Trending in Analytics for the Consumer Packaged Goods Industry?
 What s Trending in Analytics for the Consumer Packaged Goods Industry? The 2014 Accenture CPG Analytics European Survey Shows How Executives Are Using Analytics, and Where They Expect to Get the Most Value
China Grand Auto: Partnering with SAP on a State-of-the-Art Platform for a Multibrand Dealer Group
 2015 SAP SE or an SAP affiliate company. All rights reserved. China Grand Auto: Partnering with SAP on a State-of-the-Art Platform for a Multibrand Dealer Group Company China Grand Automotive Services
Background and Company Performance... 3. Industry Challenges... 3. Product Family Attributes and Business Impact... 3. Conclusion...
 Contents Background and Company Performance... 3 Industry Challenges... 3 Product Family Attributes and Business Impact... 3 Conclusion... 6 Significance of Product Leadership... 6 Understanding Product
Executive Briefing Outsourcing your Enterprise Management Services - IT Challenge or Business Opportunity?
 Executive Briefing Outsourcing your Enterprise Management Services - IT Challenge or Business Opportunity? Contents Introduction Outsourcing Opportunities Challenges SAP Outsourcing Models Selecting the
DESIGN OF CORPORATE PERFORMANCE MANAGEMENT SYSTEM: CASE STUDY AT X COMPANY IN INDONESIA
 DESIGN OF CORPORATE PERFORMANCE MANAGEMENT SYSTEM: CASE STUDY AT X COMPANY IN INDONESIA Dermawan Wibisono Graduate School of Business and Management, Bandung Institute of Technology, Bandung, Indonesia
SPEND ANALYSIS and SUPPLY BASE RATIONALIZATION
 SPEND ANALYSIS and SUPPLY BASE RATIONALIZATION Presented By: TABLE OF CONTENTS INTRODUCTION.............................. 1 SURVEY METHODOLOGY..................... 1 DEMOGRAPHICS OF RESPONDENTS...........
2015 Global Performance Monitoring for Network Operators New Product Innovation Award
 2015 Global Performance Monitoring for Network Operators New Product Innovation Award 2015 Contents Background and Company Performance... 3 Industry Challenges... 3 New Product Attributes and Customer
INSERT COMPANY LOGO HERE
 2013 2014 INSERT COMPANY LOGO HERE 2014 Global 2013 North Process American Tunable SSL Diode Certificate Laser Analyzers Competitive Product Strategy Leadership Innovation Award & Leadership Award Contents
SAP ERP OPERATIONS SOLUTION OVERVIEW
 SAP ERP OPERATIONS SOLUTION OVERVIEW YOUR SUCCESS Solving business problems is the general criterion for measuring success... SAP provides us with the powerful tools we need to solve our business problems.
Takeda s CSR Activities
 Takeda s CSR Activities Recognizing companies are part of society, Takeda conducts activities with a holistic approach to not only create but also sustain corporate value. UNGC United Nations Global Compact
FI-IMS Fertilizer Industry Information Management System
 FI-IMS Fertilizer Industry Information Management System By: Ashraf Mohammed December 2011 Fertilizer Industry Information Management System FI-IMS Fertilizer Industry Information Management System Fertilizer
SEVEN WAYS THAT BUSINESS PROCESS MANAGEMENT CAN IMPROVE YOUR ERP IMPLEMENTATION SPECIAL REPORT SERIES ERP IN 2014 AND BEYOND
 SEVEN WAYS THAT BUSINESS PROCESS MANAGEMENT CAN IMPROVE YOUR ERP IMPLEMENTATION SPECIAL REPORT SERIES ERP IN 2014 AND BEYOND CONTENTS INTRODUCTION 3 EFFECTIVELY MANAGE THE SCOPE OF YOUR IMPLEMENTATION
Trading Partner Practices January February March 2008
 Perfecting Retailer-Supplier Execution Journal of Trading Partner Practices January February March 2008 What is SRM and Why Does it Matter to the Retail Industry? Reprinted with permisson Journal of Trading
Vendor briefing Business Intelligence and Analytics Platforms Gartner 15 capabilities
 Vendor briefing Business Intelligence and Analytics Platforms Gartner 15 capabilities April, 2013 gaddsoftware.com Table of content 1. Introduction... 3 2. Vendor briefings questions and answers... 3 2.1.
Business Intelligence Meets Business Process Management. Powerful technologies can work in tandem to drive successful operations
 Business Intelligence Meets Business Process Management Powerful technologies can work in tandem to drive successful operations Content The Corporate Challenge.3 Separation Inhibits Decision-Making..3