U.S. State And Local Government Credit Conditions Forecast: 2014 Will Be A Balancing Act
|
|
|
- Maud Morris
- 8 years ago
- Views:
Transcription
1 U.S. State And Local Government Credit Conditions Forecast: 2014 Will Be A Balancing Act Primary Credit Analyst: Gabriel J Petek, CFA, San Francisco (1) ; gabriel.petek@standardandpoors.com Secondary Contacts: Jennifer K Garza (Mann), Dallas (1) ; jennifer.garza@standardandpoors.com Carol A Hendrickson, Chicago (1) ; carol.hendrickson@standardandpoors.com Emmanuelle Lawrence, Dallas (1) ; emmanuelle.lawrence@standardandpoors.com Victor M Medeiros, Boston (1) ; victor.medeiros@standardandpoors.com Le T Quach, New York (1) ; le.quach@standardandpoors.com Sarah Sullivant, San Francisco (1) ; sarah.sullivant@standardandpoors.com Lindsay Wilhelm, New York (1) ; lindsay.wilhelm@standardandpoors.com U.S. Chief Economist: Beth Ann Bovino, New York (1) ; bethann.bovino@standardandpoors.com Table Of Contents Local Governments Live In A World Of Tradeoffs Municipal Bankruptcy States Didn't Let A Crisis Go To Waste Unsustainable Trends Won't Be Sustained: Looking Beyond 2014 Credit Conditions Forecast For 2014 The Regions DECEMBER 17,
 212-438-5544; le.quach@standardandpoors.com Sarah Sullivant, San Francisco (1) 415-371-5051; sarah.sullivant@standardandpoors.")
2 U.S. State And Local Government Credit Conditions Forecast: 2014 Will Be A Balancing Act Despite Standard & Poor's Ratings Services' economic forecast anticipating slow economic growth and some potential pitfalls on the horizon, we expect state and local government credit quality to continue to strengthen in The housing market, after finally stabilizing, is now contributing to economic growth, reversing its role in prior years. Our economists have scaled back their forecast of real GDP growth for 2014, but they still anticipate an acceleration to 2.6%, from 1.7% in Growth could be a bit higher, at 2.8%, if the budget agreement currently working its way through Congress is enacted. Although this rate of growth remains slow by historic norms, we view the economic expansion as having established its foothold at this point. The real story for the sector's credit quality in 2014, in our view, is how state and local governments go about balancing the competing demands they have on constrained resources. In short, it's about management. Overview Local government credit quality should continue to strengthen in 2014 as housing market gains gradually become reflected in their finances. Management's abilities to make strategic investments in infrastructure and employment levels without undermining budget positions could differentiate credit quality. State governments come into 2014 with revenues and spending better aligned. States will face political pressure to restore services despite possibly having reached a cyclical peak in revenue collections. Medicaid expansion and health care reform could push costs higher than states had projected. Pension and other long-term liability management is likely to continue to differentiate credit quality. Local Governments Live In A World Of Tradeoffs A large part of the reason why credit quality in the local government sector has been resilient in recent years is the sector's revenue structure. Property taxes, which account for 74% of revenue collected by all local governments, are surprisingly insensitive to underlying fluctuations in home prices. After peaking in April 2006, home prices in the 20 metropolitan areas that make up the S&P/Case-Shiller Home Price Index fell by 34%. But property tax revenue collected by local governments nationally never even dipped into negative year-over-year growth. The slowest rate of property tax revenue growth occurred in 2010, when collections increased by just 0.16%. True, that's a lot slower than the average annual 12.4% rate of property tax revenue collections growth since 1959, but it's hardly what sectorwide credit crises are made of. And what it really reflects is the effect of the institutional frameworks under which local governments operate. In many states, local governments were able to compensate for home value declines with higher tax rates. In other states, laws governing how property values are assessed have effectively decoupled property assessments, the critical factor for levying taxes, from market prices. DECEMBER 17,

3 If nationally, local government property tax receipts didn't experience a year-over-year decline, what explains the widespread fiscal stress many local governments have been under for the past several years? First, we continue to maintain that the outlook for the local government sector has never been as dire as some market commentators suggested. But we also recognize that there have been -- and remain -- pockets of acute fiscal stress. In addition, although aggregate property tax collections by U.S. local governments overall didn't experience an outright year-over-year decline, many individual local governments did. And finally, while property tax collections are arguably the most important revenue for most, local governments also rely on other types of income. Sales taxes, intergovernmental aid from states, and especially in growing areas, a range of ancillary revenues -- such as housing permit fees -- also help fund local government. Therefore, virtually all local governments experienced at least some degree of financial strain as a result of the housing market decline, even if their property tax receipts didn't contract. In fact, a number of the non-property tax revenues exhibit greater sensitivity to home price values than do property taxes. Tellingly, a small number of cities, which rely relatively less on property tax revenues than do other types of local government, have encountered the most severe fiscal stress. (We are not including certain types of special districts with land-secured debt obligations.) The lagging housing market recovery has only delayed the economic and fiscal recovery among local governments. The S&P/Case-Shiller Index didn't hit bottom until January 2012, roughly 2.5 years after the official end of the recession. Since then, an increasing segment of the local government sector has seen the lagging assessed value declines layer on top of ongoing softness in their sales taxes or other revenues. The housing market recovery now underway is helpful to local governments, but to-date, most of the benefits have been from non-property tax revenue sources. As home prices and sales activity have picked up, local economies (and finances) get a boost from consumers whose willingness to spend tends to rise with asset values. A revival of the housing market also fuels new home building activity, and our economists estimate that each newly constructed home translates to the creation of two or three jobs, not all of them in the construction sector. Gains in property tax revenues from rising home values are only starting to appear in the property tax collections, which for the most part will lag price appreciation by at least one year, depending upon the state and its assessment cycle. Table 1 S&P/Case-Shiller Home Price History Metropolitan area 12-month change (%) Peak to trough (%) Months since peak Trough to September 2013 (%) Months since trough AZ Phoenix 18.7 (56.5) CA Los Angeles 21.8 (41.5) CA San Diego 20.9 (42.2) CA San Francisco 25.7 (45.3) CO Denver 9.9 (14.9) DC Washington 7.0 (32.9) FL Miami 14.3 (51.1) FL Tampa 14.6 (47.6) GA Atlanta 18.7 (37.0) IL Chicago 9.6 (36.8) MA Boston 7.5 (17.5) MI Detroit 17.1 (47.4) DECEMBER 17,

4 Table 1 S&P/Case-Shiller Home Price History (cont.) MN Minneapolis 10.1 (36.1) NC Charlotte 7.7 (17.8) NV Las Vegas 29.2 (61.7) NY New York 4.2 (25.6) OH Cleveland 5.0 (21.2) OR Portland 13.5 (28.7) TX Dallas 9.0 (12.9) WA Seattle 13.2 (30.7) Composite (34.1) Composite (33.8) Management's delicate balance Now that the slow economic expansion has gained some traction, the challenge facing local governments is one of management: how to strategically add back to services, employment, and infrastructure investments without compromising still tenuous financial positions. We anticipate that striking a sustainable balance between these two fiscal objectives will occasionally differentiate credit quality in Years of underinvestment in infrastructure by all levels of government have begun to noticeably impair local governments' recovery prospects. Although rebuilding reserves and budget management remain central to credit quality, it would be shortsighted for local governments to focus solely on their financial position at the expense of all other demands on their resources. Over the longer term, a municipality has to maintain infrastructure and services sufficient to attract and retain the residents and firms that makeup its tax base. Indeed, under our criteria, a local government's economy and tax base are among the most heavily weighted factors we consider. Unlike the federal government and many governmental sectors in other parts of the world, most U.S. state and local governments do not finance operating deficits with bonded debt frequently as a matter of law. Thus, debt levels tend not to rise as a result of fiscal stress; on the contrary, we have seen a sectorwide trend toward deleveraging since the onset of the Great Recession. A reluctance to add to their financial obligations while they have been under fiscal stress has led governments, to some extent, to bypass a period of historically low interest rates even as they have seen infrastructure needs accumulate. Related to this, some of the proposals for comprehensive federal tax reform could have the effect of raising borrowing costs for state and local governments, and this is on our radar for Tax reform that includes a reduction or elimination of the tax exemption for municipal bonds could strain the ability of state and local governments to begin doing their part to address the nation's infrastructure gap. Already, the municipal market has been shrinking, and since 2010, the amount of bonds maturing or being redeemed has exceeded new issues. In large part, we believe this reflects state and local governments' caution about taking on new financial commitments. Taken too far, however, low levels of investment can weaken a governmental tax base (see "Short-Term Savings On Infrastructure Spending Could Prove To Be Short Sighted," published Sept. 24, 2013 on RatingsDirect). Sustained levels of inadequate investment can lead to a service or infrastructure deficit that ultimately could undermine a government's tax base. DECEMBER 17,

5 Municipal Bankruptcy Despite the attention that Detroit's bankruptcy case has received, the number of Chapter 9 filings has actually been trending down. The small number of municipal bankruptcies and the declining trend of municipal defaults, let alone a wave of them, is aligned with the view we have been expressing for several years. It's important to recall that, under the federal bankruptcy code, a municipality's eligibility for protection under Chapter 9 is not a given. A municipality must first convince a judge that it is insolvent. Waging this kind of a negative campaign on its own behalf runs contrary to a local government's purpose. In the rare circumstance where a municipality becomes genuinely insolvent, measured by an insufficiency of cash flow to fund its obligations as they come due, the end result might be bankruptcy. And even then, that's only if it's in a state that allows municipalities to file. However uncommon they are, we actually view these instances as reminders that the state and local sector is not free of default risk. But for municipalities, bankruptcy is not the type of management tool it is in the corporate sector. And we believe that any municipality that views it this way is likely underestimating the costs and overestimating the benefits of going through the process. Finally, nothing about recent events has caused us to expect a significant increase in incidents of municipal bankruptcy. If anything, developments in Detroit may serve as a catalyst in other distressed situations by helping to bring a more comprehensive range of creditors to the negotiating table prior to the municipality filing. States Didn't Let A Crisis Go To Waste In the years since the Great Recession officially ended, many states have taken meaningful steps to shore up their finances and, from a credit perspective, the results are favorable. Many states approach 2014 with stronger budget reserves and, perhaps more importantly, significantly improved structural alignment between revenues and expenditures. In fact, the fiscal structures of numerous states look better than they did even before the recession began. Reflecting awareness that the Great Recession was atypical and that the depressed conditions were likely to outlast all the one-time measures they could assemble, the states turned to a more structural approach. The benefits of having brought recurring spending into better alignment with a sustainable revenue base could become more evident if, as is reasonable to believe, personal income tax growth rates reached a cyclical peak in Even if revenues don't decline outright, we expect slower growth in the upcoming year. State revenue forecasters are also aware of these trends, and we anticipate that many states will forecast a slower rate of revenue growth through the upcoming 18 months compared with Apart from naturally slower revenue growth, a number of states enacted tax rate reductions for fiscal On top of this, with 36 states holding gubernatorial elections in 2014, we expect that additional tax rate-reduction proposals could be put forward for the upcoming fiscal year. Nevertheless, thanks to a more sustainable approach to budget management, many states are now uncharacteristically projecting multiple years of fiscal balance. The trend toward improved overall fiscal alignment among the states has resulted in a stronger financial position now and also offers greater fiscal flexibility going forward. Both are favorable for credit quality. DECEMBER 17,

6 The new year brings new fiscal management challenges The approaching turn of the year, which traditionally kicks off the budget process for most states, arrives as state revenues appear to be leveling off after having increased for 14 consecutive quarters through July In some ways, state tax collections throughout 2013 give the impression of stronger underlying conditions than actually exist. Part of the revenue strength this year is a byproduct of the federal income tax increase that took effect in January 2013 and a record performance in the stock market. Both have had the effect of boosting income tax receipts from capital gains in 2013, but states can count on neither for As a result, even if the economy and stock market perform according to our forecast for modest growth, we expect state revenue trends to flatten somewhat in Depending on the degree of flattening, in the aggregate, states could wind up spending down a portion of their reserves by the end of the year compared with where they began. Also, over the longer term, the state sector has gradually increased its reliance on personal income taxes (PIT). With more of their revenues coming from PIT, which typically includes taxes on capital gains, state revenues have become more volatile, suggesting a more precarious revenue outlook going into None of this, however, is likely to reduce the pressure to restore funding levels for a variety of programs to where they were before the recession. Numerous states enacted deep recurring cuts to social services and education following the onset of the recession. And even though state general fund spending has ticked up in nominal terms each year since 2010, in real dollars, state general fund spending in fiscal 2013 was still almost 8% below 2008, according to data compiled by the National Assn. of State Budget Officers. The real or perceived austerity in recent years, coupled with the recent strong revenue collections, result in pressure on the states to undo some of the cuts they've made. States that budget for large spending increases or tax rate reductions in the wake of strong but potentially tenuous revenue trends, however, could be setting themselves up for renewed fiscal stress. And even if revenues weren't approaching what appears to be a plateau, state fiscal structures make revenues prone to budget pressure when conditions soften. When it comes to spending, the states are more responsible for funding the various social services that have countercyclical demand profiles. In other words, when the economy slumps, states experience budget pressure from both falling revenues and a rise in demand for social services. That revenue trends are already poised to slow in 2014 implies there is less fiscal capacity for adding back to services than year-to-date 2013 collections might suggest. And if economic or stock market performance were to falter on top of this, the fiscal tradeoffs in making new spending commitments would only be more pronounced. Less predictable federal fiscal policy Intergovernmental funding from the federal government -- which accounts for 30% or more of total state revenue -- has emerged in recent years as a key source of fiscal uncertainty for the states. Although we now believe that the risk of another federal government shutdown has dissipated, the role of federal fiscal policy has become a more complicated variable for states. States have had to develop contingencies and weigh the prospect of floating the costs of federally funded programs -- or abruptly shuttering them -- in the event stalemated negotiations in Washington were to hold up federal aid. States have also had to contend with the indirect economic effects of federal fiscal policy. The Congressional Budget Office estimates that sequestration and the October shutdown have reduced real GDP growth in 2013 by 1.5%. If the budget agreement currently taking shape in Congress averts another shutdown, our economists have indicated that real GDP growth in 2014 could be 0.2% higher than had been forecast. Nevertheless, any foregone DECEMBER 17,

7 economic growth as a result of federal policy translates to lower state revenues and higher demand for social services, adding pressure to both sides of state budgets. And, even if there isn't another shutdown, state economic and revenue growth is at risk of being undercut again in 2014 by another round of sequestration and the approaching federal debt limit. While some of the recent changes to federal fiscal policy have complicated the economic and fiscal landscape for states, it hasn't altered the institutional framework in which they operate. State credit quality continues to reflect constitutionally protected autonomy and the lack of negative intervention in their fiscal affairs by the federal government. In fact, the U.S. Supreme Court's ruling that states could not be compelled to expand their Medicaid programs as envisioned under the health reform law reaffirmed their independence. Certain features of federal fiscal policy function as automatic stabilizers to the national economy indirectly benefit the states during economic downturns. Congress has, in addition, provided extraordinary fiscal assistance to the states via the Medicaid program in the 2001 recession and again during the Great Recession. Notably, however, none of it targeted specific states. The concept of a federal bailout for a particularly stressed state remains absent from the U.S. federal-state fiscal framework. In our view, the hands-off approach of the federal government has, over time, fostered a relatively conservative credit culture among the states. From a global perspective, U.S. states stand out for being minimally leveraged, being subject to balanced budget requirements, structuring most debt with amortizing repayment schedules, and refraining from financing operating deficits with debt. A lot of these characteristics are helpful to state credit quality but, unlike in the 2009 timeframe, we do not anticipate that Congress would step in with fiscal stimulus in the event of another economic downturn. Medicaid and the Affordable Care Act (ACA) Already the largest spending item and greatest source of federal fiscal integration in state budgets, Medicaid is poised to undergo an unprecedented expansion in Medicaid is likely to be a growing expense, both for the states planning to expand their Medicaid programs, as envisioned under the ACA, as well as those so far intending to reject the expansion option. In our view, there are two ways to look at the role of Medicaid in state finances. First, the program is a federal entitlement, and the 50 state Medicaid programs are subject to an array of federal requirements and oversight. Similar to health care spending generally, expenditures for Medicaid have increased faster than other state programs and state budgets overall. As a result, a large and growing share of state budgets is consumed by a relatively inflexible cost. On the other hand, precisely because of its status as an entitlement, federal Medicaid funding to the states has thus far been shielded from reduction under sequestration or delay during the shutdown. (Congress had already appropriated Medicaid funding through Dec. 31, 2013 prior to the October shutdown.) Medicaid, the states' single largest federal funding inflow has, therefore, emerged as a reliable source of revenue. However, we do note that federal Medicaid funds could be delayed if federal spending authority were to lapse during a period in which it hadn't already made its Medicaid appropriations. However, even if the current continuing resolution were to expire in January with no new agreement, there is funding authority in place for up to about one month for Medicaid claims. Our baseline forecast does not envision another shutdown, let alone one that lasts for more than 30 days. DECEMBER 17,

8 Medicaid spending could pressure state budgets if the enrollment trends, especially among people who are currently eligible but not enrolled, significantly outpace state forecasts. States will only receive their traditional federal matching rate, which averages 57%, for the new but previously eligible population that enrolls in Medicaid. Based on evidence from some early expansion trial programs in a number of states, forecasts related to this population have proven difficult, and state estimates have tended to run below their actual experience. Sustained high rates of medical inflation and, more recently, the lingering effects of the recession, have contributed to increasing shares of state budget spending going to fund Medicaid. Whether or not they plan to expand their Medicaid programs, the states have a stake in the success of the ACA insofar as one of its objectives is to constrain the rate of growth of national health expenditures. There is some recent evidence that health care inflation has begun to subside somewhat, but it's unclear how much is a consequence of provisions in the ACA versus a lingering effect of the recession. Unsustainable Trends Won't Be Sustained: Looking Beyond 2014 As we look beyond 2014, some long-term sources of fiscal pressure, if they don't change, could be trouble for credit quality in the state and local government sector. Two of the most prominent, which are related, are actuarial retirement benefit liabilities and rising health care costs. An April 2013 study by the Government Accountability Office (GAO) found that, collectively, state and local governments face a large projected fiscal gap (measured as a shortfall of operating revenues relative to operating expenses, excluding capital expenditures). In order to eliminate the fiscal gap from 2014 through 2060, the GAO estimated that state and local governments would need to bring down current expenditures (or raise taxes) by 14.2%, and the fiscal adjustment necessary to retain balance would grow in nominal terms with each passing year. The GAO's analysis is useful in highlighting that health care spending, both on Medicaid and for state and local government employee and retiree health care benefits, is the main culprit behind the projected fiscal gap for state and local governments. Left unabated, these trends could lead to a material erosion of state and local government credit quality over the longer-term. We have found, however, that state and local governments tend to address fiscal imbalances, sometimes after they have become a problem but, in the vast majority of cases, prior to insolvency. Management is the intervening factor, and one for which the GAO's simulation does not account. Along with health care, pension liabilities are also a financial commitment for which state and local governments are currently on unsustainable trajectories. Following the financial crisis of 2008, market participants intensified scrutiny of the long-term liabilities related to pension benefits. Various analyses estimated that the trajectories that were in place at the time were unsustainable over the long term. Since 2009, however, 49 states have enacted some type of pension reform. And some of the more recently enacted legislation has tended to be increasingly substantive. Overall, in the span of four years, states have implemented reforms reducing projected long-term pension liabilities by hundreds of billions of dollars. The issue is far from resolved, however, and we expect that many state and local governments will continue to pursue reforming their long-term exposure to retiree benefit costs. The smoothing of asset returns practiced by most states DECEMBER 17,

9 not only reduces the volatility of annual contribution requirements, it also kept the market losses of at the forefront of the policy discussion for several years. Phasing in the steep market losses from those years has provided a sustained multiyear source of pressure that has served as a catalyst to the reform efforts that remain ongoing. In fiscal 2011, for example, the states' aggregate pension assets continued to fall -- by about 1% -- in relation to their actuarial accrued liabilities despite median investment returns of 21.6%. (See "A Bumpy Road Lies Ahead For U.S. Public Pension Funded Levels," published July 16, 2013.) At this point, however, we see mounting evidence that the reforms undertaken in recent years will result in these liabilities growing more slowly in the future. Cost-containment strategies might have an effect more immediately in the area of retiree health care benefits. Here we found that, as of 2013, aggregate unfunded liabilities had declined by $16 billion, or 3%, compared with 2011 (see "U.S. State OPEB Liabilities Decline Slightly, But Continue To Vary Widely," published Nov. 25, Reflecting a forward-looking orientation, our rating actions frequently pick up on the management of these long-term liabilities earlier than their effects can be fully reflected in the actuarial numbers. For example, in 2013, Hawaii enacted a law requiring increased state contributions to its retiree health care plan and other reforms to its pension. We subsequently assigned a positive outlook to the state's rating even though the new reforms have yet to be formally captured in actuarial reports. Conversely, ratings have trended in a downward direction or were blocked from being raised for obligors that have not begun to address these liabilities. We anticipate ratings differentiation along these lines to continue in In our view, the sectorwide movement on pension reform helps demonstrate the powerful role of management, both within a budget cycle and through its effects on an entity's longer-term cost structure. Credit Conditions Forecast For 2014 One of the main challenges we have identified for the management of state and local governments in balancing restoration of services against maintaining fiscal restraint -- is actually the result of good news. Led so far by the private sector, GDP growth in 2014 should translate to gradually dissipating fiscal strain across the state and local sector. But the rate of growth our economists expect for the new year has been dialed back a couple of times, with each adjustment eroding the degree of potential fiscal relief that is likely. In addition, with much of the economic growth coming from the housing rebound and energy production, credit conditions will likely improve unevenly across the nation. State and local governments with a heavier federal government presence are likely to experience slower growth thanks to the second round of sequestration, which is scheduled to take effect in Round two is included as part of our baseline forecast, which, on a more favorable note, assumes that another shutdown will be avoided. Having already weathered a series of federal fiscal storms, consumer spending also strengthens in our 2014 forecast, which has positive near-term retail and sales tax implications for state and local governments. Housing looks to remain an area of strength in 2014, which helps governments in many ways. Our forecast is that increasing existing home sales (6.4% in 2014) and new home sales (26.7%) should benefit governments' employment and tax bases relatively quickly. Our forecast for a 6% increase in the 20-city S&P/Case-Shiller Home Price Index in 2014 is lower than the 13% appreciation we have seen in 2013 (through September), but it would also be more sustainable. Housing market improvement is also unevenly dispersed across the country. Despite some softening in the summer, the economy has now added an average of 195,000 jobs per month in the 12 DECEMBER 17,

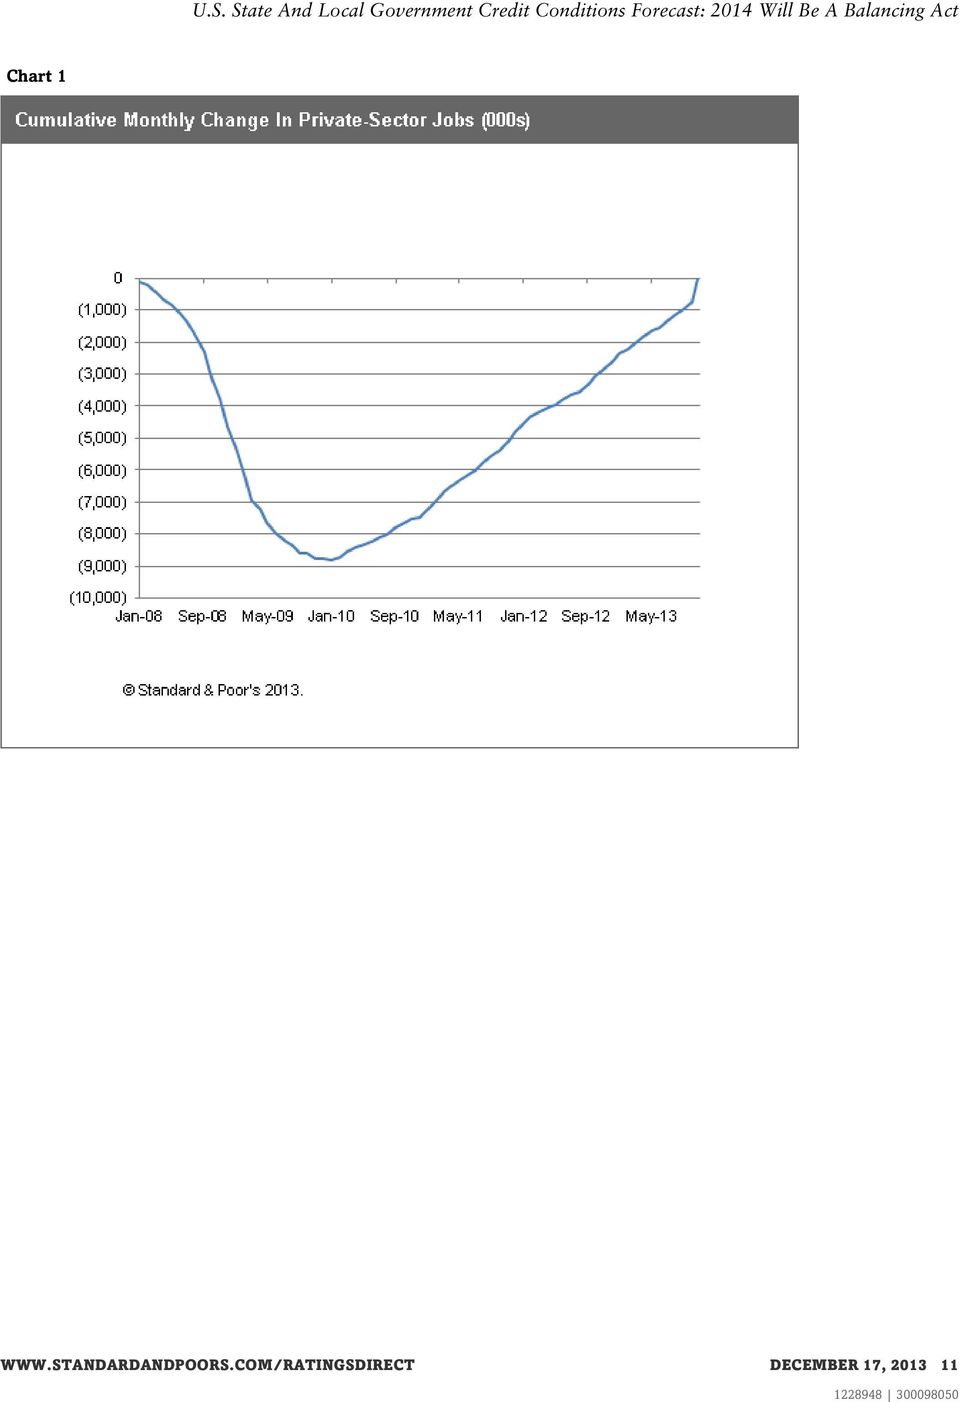
10 months since November In fact, since bottoming out in February 2010, the private sector has been adding jobs. Conversely, the public sector employment trends have largely dampened the overall jobs picture in the U.S. throughout most of the four-plus years of the recovery. More recently, however. Instead of serving as a source of weakness by continuing to shed positions, the state and local sector appears to have hit bottom and is now tepidly adding back to its workforce. Since peaking in August 2008, state and local government employment fell by an average of 12,300 jobs per month through June Beginning in July 2013, the sector began adding jobs, at a rate of 12,800 per month through November, signaling the beginning of a trend we expect to continue in 2014, although most likely at a slower rate. Table Economic Outlook For U.S. State And Local Governments Forecast/Scenarios Actual Macroeconomic indicators Comment Downside (10%-15%) Baseline (65%-75%) Upside (15%-20%) Real GDP (% change) Federal government purchases Unemployment rate (%) Real consumer spending (% change) Housing starts (mil) Core CPI S&P Common Stock Index The growth forecast for 2014 has been dialed back but expectations remain higher than for Continued modest expansion with some acceleration should offer some relief to local governments, in particular, from persistent fiscal strain depending on location. The short window for negotiating government appropriations and debt limit make it less likely a comprehensive package softening the second round of sequestration can be negotiated. We expect federal sequestration to continue to be a drag on economic growth. Monthly jobs numbers have improved, and the state and local sector has added average of 8,300 jobs in six months through November. It had shed an average of 12,300 jobs per month in the prior 57 months. Consumer spending has been relatively resilient. The very strong equity markets and strengthening housing market add to consumer confidence, translating to near-term sales tax strength for state and local governments. Housing recovery should persist, albeit at a reduced pace in Gains should begin to work their way into property taxes. Housing starts fuel related economic activity, lifting non-property tax revenues. Very low--below the Fed's target with minimal formulaic cost driver implications. Stronger labor markets could begin adding to price increases, which would stimulate for the economy. We would watch for budget stress if health care spending began accelerating again. Having reached record price levels, we expect appreciating values to level off. Fundamentals don't point to bubble-like conditions, thus reducing the risk of large sustained downdraft. The overall picture suggests slower personal income tax revenues for states in (4.70) (3.00) (4.70) 0.40 (4.30) 0.90 (1.40) * U.S. Economic Forecast: Two Economies Diverged In A Wood (Dec. 5, 2013) DECEMBER 17,

11 Chart 1 DECEMBER 17,
12 Chart 2 Inflation has remained almost nonexistent in 2013, and we expect it to remain well contained in The difference in interest rates between regular and inflation-protected Treasuries supports this view. The yield on five-year Treasury bonds as of Dec. 6, 2013 relative to the inflation-protected bonds implied an inflationary expectation of 1.65%, just 0.10% higher than at the same point in But as the labor market gains momentum, the prospects for upward pressure on prices could build. While a bit of inflation might help stimulate more robust spending throughout the economy, if it occurs, we would be on the lookout for trends in health care spending, which play an inordinate role in state budgets. The Regions New England (Connecticut, Maine, Massachusetts, New Hampshire, Rhode Island, Vermont) We expect credit conditions in New England to remain stable in 2014 as economic growth, albeit still modest, should strengthen compared with In our view, a stabilizing credit factor is New England's residential real estate market, which we forecast will continue to be relatively favorable. The primary revenue sources for local governments in New England are property taxes, so a stable real estate environment is important for municipalities' abilities to sustain structural balance. According to our forecast, housing starts in 2014 will continue to remain positive, driven by gains in DECEMBER 17,

13 both single-family and multifamily construction activity. As such, communities should generally benefit from higher building fees and other ancillary revenues. In addition, recent data indicate that the region's median home prices will continue to strengthen in 2014, which bodes well for a recovery in local assessed values. Our base forecast shows that growth of New England's economy will be 2.38% in 2014, up from 1.32% in Rising home prices along with a strong stock market have restored confidence, which has translated to higher consumer spending and an uptick in construction activity. We anticipate that federal spending will grow in 2014 following a considerable decline in the prior year. While the effects of sequestration and cuts to federal spending have hampered GDP growth over the past few quarters, the impact has varied from state to state. Looking ahead, while all states in the region are affected to some extent, we believe given the size of each state's respective economy, Connecticut, with its heavy reliance of defense manufacturing, and New Hampshire and Maine, home to the Portsmouth Naval Shipyard, are the most vulnerable. Massachusetts is the largest economy in New England, and we project that it will be the strongest with GDP growth of 2.6% in Maine continues to be the weakest state, with forecasted growth of 1.57%, ranking at the bottom regionally and very low nationally. Leisure and hospitality, a traditional strength in Maine, has seen some growth, along with construction and professional and business services; however, we believe Maine's economy will continue to rely primarily on U.S. economic growth, as will regional growth to a certain extent, so it will continually lag behind its regional peers. We note New England remains one of the regions with the weakest employment growth prospects nationally, mainly due to demographic factors and lower labor force growth rates. Our data suggest that growth in total nonfarm employment will increase 1.14% in 2014, slightly above 2013 levels. Nominally, the largest gains in total nonfarm employment will be in Massachusetts, Connecticut, and New Hampshire. We expect the unemployment rate to decline only gradually, to 6.45% in 2014 from 7.0% in 2013, because of the low employment growth. Mid-Atlantic (New Jersey, New York, Pennsylvania) Overall, the Mid-Atlantic economy is growing at a slower pace than the U.S. economy. We have revised our forecast for 2013 economic expansion to 1.85% from 1.62% in September despite the disruption caused by federal sequestration. We now forecast federal spending will decline 3.96% (relative to September's 5.20%), which we expect will nearly rebound in 2014 with 3.59% growth. We forecast real GDP growth will remain at current levels through Pennsylvania will likely lead the three states with real GDP growth of 2.3% over the next four quarters (which is still below projected national growth), compared with New Jersey's 2.0% and New York's 1.8%. We expect the employment picture to improve overall within the region, albeit at a slower pace than most of the rest of the nation. We project growth of 1.14% in 2014, compared with 1.09% in The professional and business services and leisure and hospitality sectors are showing the strongest growth in 2013 while information and, not surprisingly, government are lagging. We expect government employment to reverse its course slightly in 2014, with 0.2% growth projected for the region. Health care will also likely be prominent, particularly given the region's aging population relative to the nation as a whole and both New York's and New Jersey's plans for Medicaid expansion. Pennsylvania is contemplating expansion at this time. Housing starts continue to show momentum, with 22.9% growth in 2013, and 15% projected for Pennsylvania is DECEMBER 17,

14 a bright spot, with average annual housing start growth of 29.4% from 2012 through 2014, ranking eighth in the nation. New Jersey and New York rank 31st and 32nd, respectively, but are also seeing growth of 14.2% and 13.5%. We forecast that regional personal income growth will gain momentum, albeit from a low starting point, with 2013 growth of 0.8%, improving to 3.05% in We expect retail sales growth to continue at a pace of 1.62% in 2014, slower than the 2.36% in Regional issues to watch for in 2014 include significant road and bridge investment: Pennsylvania passed a long-awaited transportation bill in November providing up to $2.3 billion per year for roads, bridges, and mass transit with funding from the phase out of the wholesale franchise tax cap, likely leading to increases in retail prices at the pump. The Port Authority of New York and New Jersey has plans to invest in improvements for three bridges providing connections to New Jersey: The Goethals Bridge, the Outerbridge Crossing, and the Bayonne Bridge. New York's $4 billion Tappan Zee bridge replacement is also underway. New York City's mayoral election could also have credit implications with mayor-elect Bill DeBlasio sweeping to power on a populist platform that will require significant cooperation with the state. The new administration will face challenges with respect to expired union contracts and an underfunded pension system. South Atlantic (Delaware, District of Columbia, Florida, Georgia, Maryland, North Carolina, South Carolina, Virginia, West Virginia) Based on anticipated ongoing federal consolidation, we expect that additional federal jobs will be eliminated in As a result of the October federal government shutdown, wages temporarily fell, but we understand arrears payments will limit the amount of wage losses. However, given the strong presence of federal government employment in the region, including private contractors working for the federal government, we may see higher wage and employment losses. We have revised our regional total nonfarm employment growth forecast down to 1.58% from 1.68% for We also revised our 2014 forecast down, to 1.75% from 1.94%. Federal government employment continues to fall as anticipated, with a reduction of 2.06% for 2013, which is more than we forecast last quarter. However, we expect private sector gains to offset some of these reductions. We have revised our forecast for real regional GDP growth upward to 1.91% from 1.85% for 2013, and our forecast for 2014 remains about the same -- at 2.64%. Federal spending in the region is projected to be muted in 2014, down from our last estimate to just 0.60% year-over-year. For states that are not expanding Medicaid, such as Georgia, South Carolina, North Carolina, and Virginia, it is unclear whether this decision will have any effect on their health care employment bases or regional GDP. The region is still struggling with the weakened housing market, and investments in large capital projects appear unpopular at the moment although there are certain exceptions. In the Atlanta metro area, there will be significant capital investment in several large-scale infrastructure projects. In addition, within areas that suffered multiple years of large taxable value reductions, we are now observing positive growth and believe the region is firmly on the path toward continued increases. Other areas that had less severe reductions also saw sharp increases in home sale prices, with average selling prices up markedly from just a year ago. We project total private housing starts will rise 22% for 2013 and 25% for Our forecast for existing median home prices remains unchanged at 8.87% for 2013 and 7.39% for These recent housing improvements have had a profound effect on consumer sentiment and spending DECEMBER 17,

15 expectations, as consumers appear to be more willing to spend and feel generally more optimistic about their finances. Likewise, we have revised our real retail sales projections upward for 2013 and 2014, to 3.09% and 2.50%, respectively. In addition, recent gains in the stock market have also contributed to this buoyant environment. East South Central Region (Alabama, Kentucky, Mississippi, Tennessee) In 2014, we expect the region to continue to make strides as the regional economy continues to rebound from the recession. However, despite projected growth in several economic indicators, we still do not expect the region to reach pre-recession performance until mid-to-late The region experienced a much deeper recession than the nation as a whole; thus, we expect the recovery to take longer than in some of the other regions. Mississippi and Alabama will not expand Medicaid while Kentucky will. Tennessee is leaning toward expansion, as far as we are aware. The expansion of Medicaid could pressure state budgets. Another potential challenge for the region could be improving its transportation infrastructure. While, comparatively speaking, the region's transportation infrastructure is relatively sound, projections are that over 30% of major roadways within the region are in need of repair. The state's attempt to address these needs will yield a hefty price tag. Federal spending and employment in the region has dropped by about 4% and 3.8%, respectively, since the same period last year. Over the next year, we expect federal spending will drop by an additional 1%, and federal employment will experience marginal improvement of less than 1%. We expect regional unemployment will experience continual improvement, dropping to 7.46% from 7.89%. Manufacturing-related employment has grown by just less than 2% since last year, and our forecast is for additional 2% growth during the same period, late 2014 and early Auto-manufacturing facilities, several of which have experienced expansions, continue to support manufacturing employment growth. We believe that employment growth in the education and health services sector will remain moderate, increasing by roughly 1% over the next year. In spite of the federal sequestration and continual declines in federal spending, military employment will likely experience a small uptick. As seen in much of the county, consumer confidence continues to improve and is poised to gain more momentum. As consumer sentiment strengthens, we will see consistent expansion of various economic indicators, including housing starts, and auto and retail sales. We expect regional housing starts to grow by 26% within the upcoming year. We also expect home prices will increase by roughly 6% and retail sales by about 2% by the final quarter of However, the region's economy lags the nation, and its recovery will take longer than the nation overall. While much of this is attributable to the region having experienced a deeper recession than others, several factors position it for a solid recovery, including its manufacturing sector, which will experience an uptick in production as consumer sentiment continues to improve. Likewise, housing starts and commercial development will likely continue to grow. The region's abundant and favorably priced land, relatively good transportation infrastructure, attractive business laws, and large labor force skilled in manufacturing will likely support commercial and residential development over the long term. We anticipate more strides than setbacks for the region in East North Central (Illinois, Indiana, Michigan, Ohio, Wisconsin) We have revised our economic outlook upward for the East North Central region for 2013 and 2014; however, it still remains the slowest-growing region. We expect real regional GDP to increase 1.15% in 2013 but pick up to 2.04% in While job losses in the manufacturing sector have historically been cited as a reason for the region's slower DECEMBER 17,
 In 2014, we expect the region to continue to make strides as the regional economy continues to rebound from the recession.")
16 economic growth, manufacturing employment continues to play a key role in its economic recovery. We expect manufacturing employment will increase by 1.19% in 2013, followed by a 2.21% increase in High-tech manufacturing has particularly been a bright spot, and manufacturers continue to benefit from the clustering of industries within the region. We have seen local governments compete for high-tech industries and entrepreneurial firms using a variety of economic incentives. Even during periods of declining operating revenues, many local governments have chosen to attract manufacturing firms through tax increment districts, loan programs, or guaranteed debt, believing that such employment bases are necessary to keep their communities viable and competitive. Local governments facing budget pressures, however, have not had the budget flexibility to offer such incentives, perhaps leaving those most in need of attracting growth left behind. Demographics will continue to challenge the region, with rural to urban migration and pockets of declining metropolitan areas. Slow population growth lessens the rate of GDP and housing growth as well as local tax revenues. While not to the same degree as in the 1980s, forecasts show Youngstown, Cleveland, and other northeastern Ohio metro areas will continue to lose population over the next 10 years despite economic development efforts. Most Midwestern communities have not seen population flight and financial consequences to the same degree as Detroit, and likely local government management will prevent them from heading down the same path. However, population decreases leave behind communities with higher per capita infrastructure and legacy costs, and even as tax bases start to pick up again, these local governments will need to make tough budget decisions. Net migration figures do not just represent flight but also trends of whether people are moving into the region. The region's projected unemployment rates, though improving, are still high compared with other regions, making it less attractive. However, certain metro areas, such as Madison and Columbus, supported by stabilizing university and government institutions, have seen population growth, and college graduates continue to flock to Chicago. Housing market trends for the region have been improving, coinciding with national trends. We expect the median existing home price for the region to increase 6.36% in 2013, followed by a 7.5% increase in Housing starts have also been rising, and we expect 2014 to be a stronger year than Conveyance fees have begun to increase; initial assessed value figures in many areas have stabilized; and some areas boasted modest growth. As the housing market improves, we may see further bifurcation within the region due to differences in housing market recovery and to residents who choose to vote with their feet. Homeowners who previously did not have equity in their homes may choose to move at a higher rate than during the past few years now that prices are rising. While many of these moves may be local, they can lead to shifts in school district enrollment and changes to other service demands. Our baseline scenario shows federal spending increasing by a modest 0.46% in 2014, outpacing a 4.32% decline in Many defense contractors are located in the Midwest and will be sensitive to Congressional decisions on looming sequestration defense cuts. Illinois, Michigan, and Ohio, the largest states in the region, are accepting Medicaid expansion under the ACA, which may boost federal spending levels. West North Central (Iowa, Kansas, Minnesota, Missouri, Nebraska, North Dakota, South Dakota) We expect the West North Central Region will continue to grow, with GDP rising at a slow, 1.32% rate in 2013 but accelerating to 2.47% in Despite growing less quickly than the other western regions, it has consistently demonstrated below-average unemployment, the rate of which we expect to fall to 5.17% in DECEMBER 17,

17 The mining sector, particularly the oil and gas boom in North Dakota, is supporting growth throughout the region. We expect the mining sector to continue to exhibit production and investment growth in 2014 although employment may taper somewhat because it takes fewer jobs to maintain a well than to do the procedures leading up to the initial drilling. North Dakota's oil industry has bolstered state revenues, and as a result, it has increased aid to local governments across the entire state. A contraction in the oil sector could affect future state aid payments. We expect agriculture GDP to take a sharp, 40.15% decline in 2013 but rebound slightly with 5.49% growth in In October 2013, a storm wiped out a large share of livestock in South Dakota, and various other weather related events delayed crop planting earlier in the year. Farm economy growth has slowed as production costs have risen and food prices have declined, leaving farmers with less money for investment. Demand from ethanol producers has slowed, but the removal of policy restrictions limiting the percent of ethanol in fuel blends could boost demand. Housing growth will likely be uneven across the region in As with the other areas, we expect housing starts and prices to rise over the next year. The Bakken Shale region will likely continue to see construction demands into 2014, and the Minneapolis area has also demonstrated strong housing trends. However, housing market growth will likely be slower in areas with less population growth. Regionwide, we expect existing median home prices to rise 6.21% in 2013 and 7.22% in We expect federal spending levels will improve by 2.14% in 2014, following a 4.24% decrease in Boeing has announced that it will be closing its plant in Wichita in early However, substantial government payments to farmers could stabilize federal spending levels throughout the region. West South Central (Arkansas, Louisiana, Oklahoma, Texas) While the region remains a leader for the nation in terms of real GDP growth, our projections indicate a weaker growth rate estimate, at 2.35% for 2013, down from 2.6% in the prior quarter. Our current 2014 real GDP growth forecast is also slightly weaker, at 2.8% from 3.4% in the prior forecast, reflecting a slowdown in the construction sector. The region's GDP growth received a boost from the construction sector during the first half of the year along with stable growth from the energy sector. However, within the past two quarters, the construction sector slowed down nationwide due to increasing mortgage rates, which resulted in fewer jobs. As consumer confidence recovers, we anticipate regional housing starts and retail sales will continue to garner momentum. The region's housing market did not see the big boom in prices in the pre-recession years and, therefore, did not experience a big bust as other regions did. But given the region's low cost of living and affordable home prices, we expect that a stronger construction sector will aid healthy growth in total housing starts through The region's states are susceptible to event-related risks (primarily hurricanes, flooding, and tornadoes) that could impact GDP growth and migration levels on an annual basis. Our projections for the region's unemployment rate remain unchanged from the prior quarter, well below the national level and continuing to decline at a slow pace through 2014 as many workers outside the labor force try to jump back in as they see jobs being created. Texas, Louisiana, and Oklahoma have surpassed their pre-recession employment levels whereas Arkansas, the one state in the region that did not benefit from the high energy prices during 2011 and early 2012, has seen lackluster employment growth, well below the national average. The Arkansas labor force participation rate has declined, and the manufacturing and public employment sectors are weakening. Federal government employment projections for the region reflect a 2% decline for 2013 and a 2% expansion for DECEMBER 17,

18 In addition, we expect expansion in the state and local government, professional and business service, trade, and construction sectors to continue through In addition, our projections for federal spending for the region have improved from the prior quarter, reflecting a 4.7% decline in 2013 but a rebound in 2014 with just less than 1.0% growth despite additional federal spending cuts likely in early As a result, defense contractors may see layoffs as a result of the next round of cuts in early 2014 as federal defense spending is further constrained. Both Oklahoma and Texas have adopted infrastructure financing initiatives to boost infrastructure improvement. Oklahoma adopted a $1 billion infrastructure financing program within the last 12 months to promote street, bridge, and transportation infrastructure improvements in the near term. In addition, Texas adopted a $2 billion infrastructure financing initiative this year by providing additional borrowing capacity through the Texas Water Development Board to fund water supply projects. Mountain (Arizona, Colorado, Idaho, Montana, Nevada, New Mexico, Utah, Wyoming) The Mountain states, led by Arizona and Colorado, have surged ahead of the national recovery thanks in large part to resilient housing markets and strong tourism and service sectors. We believe that the accelerating recovery in the region will strengthen credit conditions for the municipal sector in 2014; however, careful financial management will continue to be a key distinguishing factor among local government entities treading a delicate line between growing spending and investment pressures on the one hand, and the need to maintain a prudent level of financial flexibility on the other. During the recent crisis, new housing construction in the region came to a virtual standstill and still has a long recovery ahead. We expect the construction sector to grow by 4.6% in 2014 and to accelerate in 2015 as surplus inventory in Arizona and Nevada, the two states devastated by the housing boom and bust, declines. We expect new housing starts will grow by more than 30% in perhaps a greater testament to the depth to which they had fallen than to the number of new starts -- which is still nowhere yet near pre-recession levels. This development activity will help generate retail sales, a major determinant of revenue for states, as well as many for Arizona, Colorado, and Utah municipalities. Entities that receive shared revenues will likely feel less budgetary pressure as states relax fiscal austerity measures. But those with local economies that are indelibly tied to federal spending -- either through direct employment as in New Mexico's national labs or through aerospace and defense in the case of some Arizona communities -- are likely to see a dip in local employment as the federal sequester continues. Meanwhile, the region's tourism industry has benefited substantially from the global recovery -- so much so that some local businesses stepped in to keep national parks open during the federal shutdown -- and we expect it to grow by nearly 3% in Indeed, the fine weather and natural beauty of the region have attracted more than just tourists: robust population growth has resulted from a nearly constant influx of retirees and service workers, as well as skilled professionals drawn to high-tech and business service jobs in Utah, Colorado, and Arizona. The ability to attract highly educated, skilled workers will strengthen these states' economic performance: we forecast that real regional GDP growth in 2014 will speed ahead at 2.75% -- the highest in the nation. Yet this does not come without risks: a growing population will put pressure on infrastructure and will, in all likelihood, accelerate the region's impending water supply pressures. Both may ultimately have a credit impact on state and local government entities if left unaddressed. DECEMBER 17,

19 Pacific (Alaska, California, Hawaii, Oregon, Washington) A swift rebound in the housing market throughout the Pacific region has played a key role in the western states' recovery to date, and we expect it to continue to be a tailwind in 2014 and beyond. Although actual housing starts won't reach pre-recession levels in the hardest-hit area of California until after 2016, they will likely continue to grow at about 30% next year, even as prices continue to rise. Now well into their second year, these price gains are good news for local governments, which will see renewed growth in property taxes as price increases are realized in the tax rolls. We expect to see strengthening local government credit quality in 2014 to the extent that local housing markets and economic activity continue to improve. Historically, major metropolitan areas along the coast have been the first to recover after a recession, with jobs, wages, and capital diffusing inland as a recovery gathers momentum. In the Pacific region, these jobs are being added primarily in the construction sector (5.4%), as well as business services (3.2%) and technology (2.3%). In Washington, growth will continue to be fueled by the trade and transportation sectors, which benefit from its many working ports, as well as by manufacturing and technology. While these sectors have historically been major contributors to the state's economy and continue to be strengths in the short run, the concentrated presence of large employers like Boeing and Microsoft could become a liability in communities with less-diversified economies, particularly if outsourcing of manufacturing jobs to lower-wage areas on the East Coast continues. Despite the generally positive outlook for local government credit in 2014, we note that the recovery has not advanced evenly throughout the region. Many smaller communities that lack ties to a diversified metropolitan economy are only just beginning to see new development and job growth, and at a rate far slower than that of the major metro areas. Those with weaker management teams may be at risk of overestimating the rate of recovery in key revenue streams, which could pose a threat to already strained budgets. Another long-term challenge for Washington and California, in particular, is the need for capital investment to maintain or replace aging infrastructure and relieve congestion. Without significant federal transportation funding -- which does not appear to be forthcoming -- communities will be left to grapple with critical capital needs that have been deferred throughout the crisis. How they ultimately decide to approach the problem will not only affect their finances, it will also have a lasting impact on their economic competitiveness and future growth potential. Fortunately, most local governments are beginning to see their major revenue streams recover, albeit at different rates, and along with them the opportunity to shift from fiscal crisis mode to more future-oriented planning. Table 3 Regional Baseline Credit Driver Forecasts (Baseline scenario as of December 2013) Percent change unless otherwise indicated New England Real regional GDP Federal spending (5.20) 1.67 Unemployment rate (%) Employment, total nonfarm Employment, government (0.02) 0.52 Real retail sales Housing starts, total private DECEMBER 17,

20 Table 3 Regional Baseline Credit Driver Forecasts (cont.) Home price, existing median Mid-Atlantic Real regional GDP Federal spending (3.96) 3.59 Employment, total nonfarm Employment, government (0.43) 0.20 Real retail sales Real personal income Housing starts, total private Home price, existing median South Atlantic Real regional GDP Federal spending (4.63) 0.60 Employment, total nonfarm Employment, financial activities Employment, federal government (2.06) 0.55 Real retail sales Housing starts, total private Home price, existing median East South Central Real regional GDP Federal spending (3.98) (0.89) Unemployment rate (%) Employment, total nonfarm Employment, manufacturing Employment, education and health services Employment, federal government (3.76) 0.36 Employment, military (1.28) 0.75 Real retail sales Housing starts, total private (0.80) Home price, existing median East North Central Real regional GDP Federal spending (4.32) 0.46 Regional CPI Real retail sales Unemployment rate (%) Employment (NAICS), manufacturing Net migration (15.69) (13.18) Housing starts, total private Home price, existing median DECEMBER 17,
 (0.")
Between 1986 and 2010, homeowners and renters. A comparison of 25 years of consumer expenditures by homeowners and renters.
 U.S. BUREAU OF LABOR STATISTICS OCTOBER 2012 VOLUME 1 / NUMBER 15 A comparison of 25 years of consumer expenditures by homeowners and renters Author: Adam Reichenberger, Consumer Expenditure Survey Between
Gauging Current Conditions: The Economic Outlook and Its Impact on Workers Compensation
 August 2014 Gauging Current Conditions: The Economic Outlook and Its Impact on Workers Compensation The exhibits below are updated to reflect the current economic outlook for factors that typically impact
More than Just Curb Appeal Factors that affect the Housing Market
 Insight. Education. Analysis. M a r c h 2 0 1 5 More than Just Curb Appeal Factors that affect the Housing Market By Kevin Chambers Not only is buying a house usually the largest purchase anyone will make,
DEUTSCHE ASSET & WEALTH MANAGEMENT REAL ESTATE OUTLOOK
 Research Report DEUTSCHE ASSET & WEALTH MANAGEMENT REAL ESTATE OUTLOOK Second Quarter 2013 Economic Outlook Business and consumer spending to drive recovery Quantitative easing beginning its expected unwinding
From Widening Deficits to Paying Down the Debt: Benefits for the American People
 From Widening Deficits to Paying Down the Debt: Benefits for the American People August 4, 1999 Office of Economic Policy U.S. Department of Treasury From Widening Deficits to Paying Down the Debt: Benefits
U.S. charitable giving: 2014 results & initial 2015 forecast
 the exclusive resource for monthly U.S. charitable giving results and forecasts by sector, source and state U.S. charitable giving: 2014 results & initial 2015 forecast contents faq about the atlas of
2009-10 STATE AND LOCAL GOVERNMENT TAX AND REVENUE RANKINGS. By Jacek Cianciara
 2009-10 STATE AND LOCAL GOVERNMENT TAX AND REVENUE RANKINGS By Jacek Cianciara Wisconsin Department of Revenue Division of Research and Policy December 12, 2012 TABLE OF CONTENTS Key Findings 3 Introduction
States Can Adopt or Expand Earned Income Tax Credits to Build a Stronger Future Economy By Erica Williams
 Updated January 19, 2016 States Can Adopt or Expand Earned Income Tax Credits to Build a Stronger Future Economy By Erica Williams Twenty-six states plus the District of Columbia have enacted their own
MBA Forecast Commentary Joel Kan
 MBA Forecast Commentary Joel Kan Mortgage Originations Estimates Revised Higher MBA Economic and Mortgage Finance Commentary: February 2016 In our most recent forecast, we presented revisions to our mortgage
REGIONAL QUARTERLY REPORT
 April 2015 1 REGIONAL QUARTERLY REPORT State Personal Income and More... In this report... Fourth-quarter 2014 state personal income statistics, page 1 Acknowledgments, page 3 Annual state personal income
FEDERAL GRANTS TO STATES AND LOCALITIES CUT DEEPLY IN FISCAL YEAR 2009 FEDERAL BUDGET By Iris J. Lav and Phillip Oliff
 820 First Street NE, Suite 510 Washington, DC 20002 Tel: 202-408-1080 Fax: 202-408-1056 center@cbpp.org www.cbpp.org February 4, 2008 FEDERAL GRANTS TO STATES AND LOCALITIES CUT DEEPLY IN FISCAL YEAR 2009
THE POTENTIAL MACROECONOMIC EFFECT OF DEBT CEILING BRINKMANSHIP
 OCTOBER 2013 THE POTENTIAL MACROECONOMIC EFFECT OF DEBT CEILING BRINKMANSHIP Introduction The United States has never defaulted on its obligations, and the U. S. dollar and Treasury securities are at the
Statement by. Janet L. Yellen. Chair. Board of Governors of the Federal Reserve System. before the. Committee on Financial Services
 For release at 8:30 a.m. EST February 10, 2016 Statement by Janet L. Yellen Chair Board of Governors of the Federal Reserve System before the Committee on Financial Services U.S. House of Representatives
recovery: Projections of Jobs and Education Requirements Through 2020 June 2013
 recovery: Projections of Jobs and Requirements Through June 2013 Projections of Jobs and Requirements Through This report projects education requirements linked to forecasted job growth by state and the
The U.S. Economy after September 11. 1. pushing us from sluggish growth to an outright contraction. b and there s a lot of uncertainty.
 Presentation to the University of Washington Business School For delivery November 15, 2001 at approximately 8:05 AM Pacific Standard Time (11:05 AM Eastern) By Robert T. Parry, President and CEO of the
Delaware. 2 All data are expressed in terms of 2010 U.S. dollars. These calculations were performed using implicit price deflators
 Venture Capital in the Philadelphia Metro Area* Jennifer Knudson October 2011 Many consider venture capital to be a barometer of innovation and economic growth. It is an important source of capital for
Zillow Negative Equity Report
 Overview The housing market is finally showing signs of life, with many metropolitan areas having hit the elusive bottom and seeing home value appreciation, however negative equity remains a drag on the
california Health Care Almanac Health Care Costs 101: California Addendum
 california Health Care Almanac : California Addendum May 2012 Introduction Health spending represents a significant share of California s economy, but the amounts spent on health care rank among the lowest
National Heavy Duty Truck Transportation Efficiency Macroeconomic Impact Analysis
 National Heavy Duty Truck Transportation Efficiency Macroeconomic Impact Analysis Prepared for the: Union of Concerned Scientists 2397 Shattuck Ave., Suite 203 Berkeley, CA 94704 Prepared by: Marshall
Executive Summary: The Comprehensive Impact of Offshore IT Software and Services Outsourcing on the U.S. Economy and the IT Industry
 Executive Summary: The Comprehensive Impact of Offshore IT Software and Services Outsourcing on the U.S. Economy and the IT Industry SPONSORED BY: Information Technology Association of America 1401 Wilson
Hawai i s Workers Compensation System; Coverage, Benefits, Costs: 1994-2004
 Hawai i s Workers Compensation System; Coverage, Benefits, Costs: 1994-2004 Lawrence W. Boyd Ph. D. University of Hawaii-West Oahu Center for Labor Education and Research January 12, 2006 1 Introduction
Non Farm Payroll Employment Developments among States during the Great Recession and Jobless Recovery
 Non Farm Payroll Employment Developments among States during the Great Recession and Jobless Recovery Prepared by: Paul E. Harrington and Neeta P. Fogg Center for Labor Markets and Policy, Drexel University
Executive Summary. Model Structure. General Economic Environment and Assumptions
 Executive Summary The (LTFP) report is an update from the preliminary report presented in January 2009 and reflects the Mayor s Proposed Budget for Fiscal Year 2010 and Fiscal Year 2011. Details of the
The U.S. Outlook and Monetary Policy. Esther L. George President and Chief Executive Officer Federal Reserve Bank of Kansas City
 The U.S. Outlook and Monetary Policy Esther L. George President and Chief Executive Officer Federal Reserve Bank of Kansas City February 2, 2016 Central Exchange Kansas City, Mo. The views expressed by
Chapter 1: Overview of the Auto and RV Dealership Industry
 Chapter 1: Overview of the Auto and RV Dealership Industry A macro overview of a company's industry and the economy are critical starting points for any valuation analysis. In many cases, the automotive
kaiser medicaid and the uninsured commission on The Cost and Coverage Implications of the ACA Medicaid Expansion: National and State-by-State Analysis
 kaiser commission on medicaid and the uninsured The Cost and Coverage Implications of the ACA Medicaid Expansion: National and State-by-State Analysis John Holahan, Matthew Buettgens, Caitlin Carroll,
22 States do not provide access to Chapter 9 Bankruptcy
 22 States do not provide access to Chapter 9 Bankruptcy -Georgia explicitly denies access to municipal bankruptcy. (GA Code 36 80-5) States with No Statutes: Alaska Delaware Hawaii Indiana Kansas Maine
Commonwealth of Puerto Rico Pension Overview
 Morningstar Pension Report Release Date: 20 v 2013 Page 1 of 5 Pension Overview Pension Funded Level Pension Level Management Overall Pension Quality Poor Poor Poor Poor # of Plans Administered By State:
Q1 2009 Homeowner Confidence Survey. May 14, 2009
 Q1 2009 Homeowner Confidence Survey Results May 14, 2009 The Zillow Homeowner Confidence Survey is fielded quarterly to determine the confidence level of American homeowners when it comes to the value
Closing the College Attainment Gap between the U.S. and Most Educated Countries, and the Contributions to be made by the States
 National Center for Higher Education Management Systems Closing the College Attainment Gap between the U.S. and Most Educated Countries, and the Contributions to be made by the States Patrick J. Kelly
THE STATE OF THE ECONOMY
 THE STATE OF THE ECONOMY CARLY HARRISON Portland State University Following data revisions, the economy continues to grow steadily, but slowly, in line with expectations. Gross domestic product has increased,
EMBARGOED UNTIL 6:00 AM ET WEDNESDAY, NOVEMBER 30, 2011
 A State-by-State Look at the President s Payroll Tax Cuts for Middle-Class Families An Analysis by the U.S. Department of the Treasury s Office of Tax Policy The President signed into law a 2 percentage
Monthly Economic Dashboard
 RETIREMENT INSTITUTE SM Economic perspective Monthly Economic Dashboard Modest acceleration in economic growth appears in store for 2016 as the inventory-caused soft patch ends, while monetary policy moves
Chapter URL: http://www.nber.org/chapters/c1737
 This PDF is a selection from an out-of-print volume from the National Bureau of Economic Research Volume Title: Commercial Bank Activities in Urban Mortgage Financing Volume Author/Editor: Carl F Behrens
University of Massachusetts School of Law: Career Services Office State-By-State Online Job Search Resources
 University of Massachusetts School of Law: Career Services Office State-By-State Online Job Search Resources Alabama http://www.alabar.org - Alabama Bar Association http://www.judicial.state.al.us - Alabama
Report on Nevada s Housing Market
 June Report on Nevada s Housing Market This is the first of a series of reports on Nevada s Housing Market co-presented by the Lied Institute for Real Estate Studies at the University of Nevada, Las Vegas
ObamaCare s Impact on Small Business Wages and Employment
 ObamaCare s Impact on Small Business Wages and Employment Sam Batkins, Ben Gitis, Conor Ryan September 2014 Executive Summary Introduction American Action Forum (AAF) research finds that Affordable Care
B U S I N E S S C O S T S
 Introduction A company s success in today s highly competitive global economy is determined by its ability to produce the highest quality products and services at the lowest costs. This competitive imperative
14 Million Millennials Benefit From Pro-Work Tax Credits But 6 Million Will Lose Out if Congress Fails to Save Key Provisions
 820 First Street NE, Suite 510 Washington, DC 20002 Tel: 202-408-1080 Fax: 202-408-1056 center@cbpp.org www.cbpp.org June 15, 2015 14 Million Millennials Benefit From Pro-Work Tax Credits But 6 Million
Changes in Self-Employment: 2010 to 2011
 Changes in Self-Employment: 2010 to 2011 American Community Survey Briefs By China Layne Issued January 2013 ACSBR/11-21 INTRODUCTION From December 2007 to June 2009, the United States experienced an economic
The following text represents the notes on which Mr. Parry based his remarks. 1998: Issues in Monetary Policymaking
 Phoenix Society of Financial Analysts and Arizona State University Business School ASU, Memorial Union - Ventana Room April 24, 1998, 12:30 PM Robert T. Parry, President, FRBSF The following text represents
State and Federal Individual Capital Gains Tax Rates: How High Could They Go?
 Special Report State and Federal Individual Capital Gains Tax Rates: How High Could They Go? A Special Report by the ACCF Center for Policy Research As the debate on federal tax reform continues, the ACCF
Maryland s Job Growth Continues to Lag in 2014 State behind national growth rates for fourth consecutive year
 Maryland s Job Growth Continues to Lag in 2014 State behind national growth rates for fourth consecutive year Job growth in Maryland continued to lag the U.S. in 2014 for the fourth consecutive year. Moreover,
BUSINESS DEVELOPMENT OUTCOMES
 BUSINESS DEVELOPMENT OUTCOMES Small Business Ownership Description Total number of employer firms and self-employment in the state per 100 people in the labor force, 2003. Explanation Business ownership
Preparing for 2015 Housing Market Opportunities
 January U.S. Economic & Housing Market Outlook Preparing for 2015 Housing Market Opportunities As we enter 2015, the U.S. economy and housing markets are prepared for a robust start. Unlike one year ago,
Venture Capital Tax Credits By State
 Venture Capital Tax Credits By State Alabama States Credit Amount Eligibility Notes Alaska Arizona Angel Investment Bill (Direct Tax Credit available for investments made after June 30, 2006, for tax years
Multifamily Market Commentary July 2014 The Nation s Aging Multifamily Housing Stock
 Multifamily Market Commentary July 2014 The Nation s Aging Multifamily Housing Stock Although America s population is rising at its slowest pace in more than 70 years, and it has taken 76 months for employment
THE BURDEN OF HEALTH INSURANCE PREMIUM INCREASES ON AMERICAN FAMILIES AN UPDATE ON THE REPORT BY THE EXECUTIVE OFFICE OF THE PRESIDENT
 THE BURDEN OF HEALTH INSURANCE PREMIUM INCREASES ON AMERICAN FAMILIES AN UPDATE ON THE REPORT BY THE EXECUTIVE OFFICE OF THE PRESIDENT INTRODUCTION In September 2009, the Executive Office of the President
Cancellation of Debt (COD) R. Bruce McCommons Harford County, MD TrC 12/4/2013 rbrucemcc@comcast.net
 R. Bruce McCommons Harford County, MD TrC 12/4/2013 rbrucemcc@comcast.net") Cancellation of Debt (COD) R. Bruce McCommons Harford County, MD TrC 12/4/2013 rbrucemcc@comcast.net 1 Cancellation of debt (COD)... Generally, if a debt for which the taxpayer was personally responsible
Cancellation of Debt (COD) R. Bruce McCommons Harford County, MD TrC 12/4/2013 rbrucemcc@comcast.net 1 Cancellation of debt (COD)... Generally, if a debt for which the taxpayer was personally responsible
The U.S. and Midwest Economy in 2016: Implications for Supply Chain Firms
 The U.S. and Midwest Economy in 2016: Implications for Supply Chain Firms Rick Mattoon Senior Economist and Economic Advisor Federal Reserve Bank of Chicago Right Place Supply Chain Management Conference
REPORT OF THE MAINE STATE REVENUE FORECASTING COMMITTEE
 REPORT OF THE MAINE STATE REVENUE FORECASTING COMMITTEE December 2013 Michael Allen, Chair Associate Commissioner for Tax Policy James Breece University of Maine System Melissa Gott State Budget Officer
PRESS RELEASE. Home Prices Grew at Twice the Rate of Inflation in 2014 According to the S&P/Case-Shiller Home Price Indices
 Home Prices Grew at Twice the Rate of Inflation in 2014 According to the S&P/Case-Shiller Home Price Indices New York, February 24, 2015 today released the latest results for the S&P/Case-Shiller Home
ENERGY COST INDEX 2012: RANKING THE STATES
 ENERGY COST INDEX 2012: RANKING THE STATES Raymond J. Keating Chief Economist Small Business & Entrepreneurship Council June 2012 Protecting small business, promoting entrepreneurship www.sbecouncil.org
#1: Unemployment benefits provide an important boost to the economy.
 The Economic Program January 2014 TO: Interested Parties FROM: Alicia Mazzara, Policy Advisor RE: Renew Emergency Unemployment Compensation: 4 Facts about Unemployment Benefits On December 28, Congress
Issue Brief How Does Illinois Spending on Public Services Compare to Other States?
 Issue Brief How Does Illinois Spending on Public Services Compare to Other States? JANUARY, 2014 Recent projections show that the state of Illinois will run a deficit ranging from $7.59 to $7.96 billion
Online Labor Demand Shows Strong Increases, up 217,900 in December
 News Release Follow The Conference Board For further information: Peter Tulupman 212-339-0231 / peter.tulupman@conference-board.org Release #5640 Jonathan Liu 212-339-0257 / jonathan.liu@conference-board.org
Statement to Parliamentary Committee
 Statement to Parliamentary Committee Opening Remarks by Mr Glenn Stevens, Governor, in testimony to the House of Representatives Standing Committee on Economics, Sydney, 14 August 2009. The Bank s Statement
Supplemental Unit 5: Fiscal Policy and Budget Deficits
 1 Supplemental Unit 5: Fiscal Policy and Budget Deficits Fiscal and monetary policies are the two major tools available to policy makers to alter total demand, output, and employment. This feature will
Total state and local business taxes
 Total state and local business taxes State-by-state estimates for fiscal year 2013 August 2014 The authors Andrew Phillips is a principal in the Quantitative Economics and Statistics (QUEST) practice of
Job Market Intelligence:
 March 2014 Job Market Intelligence: Report on the Growth of Cybersecurity Jobs Matching People & Jobs Reemployment & Education Pathways Resume Parsing & Management Real-Time Jobs Intelligence Average #
Small Business Credit Outlook
 2015 Q1 Small Business Credit Outlook Small Business to the Rescue Small business came to the rescue for the U.S. economy in Q1 2015. GDP surprised on the low side at 0.2% in the 1st quarter and demand
FITCH RATES $1B MARYLAND GOS 'AAA'; OUTLOOK STABLE
 FITCH RATES $1B MARYLAND GOS 'AAA'; OUTLOOK STABLE Fitch Ratings-New York-26 May 2016: Fitch Ratings has assigned an 'AAA' rating to $1.036 billion in State of Maryland general obligation (GO) bonds, state
US Economic Outlook. How long will the ride last? IHS ECONOMICS. US Outlook
 IHS ECONOMICS US Outlook US Economic Outlook How long will the ride last? December 2014 ihs.com Douglas Handler, IHS Chief US Economist, +1 781 301 9283, doug.handler@ihs.com US Economic Overview 2 Executive
U.S. State Pension Funding: Strong Investment Returns Could Lift Funded Ratios, But Longer-Term Challenges Remain
 U.S. State Pension Funding: Strong Investment Returns Could Lift Funded Ratios, But Longer-Term Challenges Primary Credit Analyst: John A Sugden, New York (1) 212-438-1678; john.sugden@standardandpoors.com
April 2014. For Kids Sake: State-Level Trends in Children s Health Insurance. A State-by-State Analysis
 April 2014 For Kids Sake: State-Level Trends in Children s Health Insurance A State-by-State Analysis 2 STATE HEALTH ACCESS DATA ASSISTANCE CENTER Contents Executive Summary... 4 Introduction... 5 National
Adjusting to a Changing Economic World. Good afternoon, ladies and gentlemen. It s a pleasure to be with you here in Montréal today.
 Remarks by David Dodge Governor of the Bank of Canada to the Board of Trade of Metropolitan Montreal Montréal, Quebec 11 February 2004 Adjusting to a Changing Economic World Good afternoon, ladies and
How To Calculate College Enrollment In The United States
 EDUCATION POLICY BRIEF May 2008 The Nelson A. Rockefeller Institute of Government The public policy research arm of the State University of New York The States and Their Community Colleges Every state
The 2004 Report of the Social Security Trustees: Social Security Shortfalls, Social Security Reform and Higher Education
 POLICY BRIEF Visit us at: www.tiaa-crefinstitute.org. September 2004 The 2004 Report of the Social Security Trustees: Social Security Shortfalls, Social Security Reform and Higher Education The 2004 Social
percentage points to the overall CPI outcome. Goods price inflation increased to 4,6
 South African Reserve Bank Press Statement Embargo on Delivery 28 January 2016 Statement of the Monetary Policy Committee Issued by Lesetja Kganyago, Governor of the South African Reserve Bank Since the
EXECUTIVE OFFICE OF THE PRESIDENT. The Burden of Health Insurance Premium Increases on American Families
 EXECUTIVE OFFICE OF THE PRESIDENT The Burden of Health Insurance Premium Increases on American Families SEPTEMBER 22, 2009 Health insurance premiums for American families continue to skyrocket. A report
INTRODUCTION. Figure 1. Contributions by Source and Year: 2012 2014 (Billions of dollars)
") Annual Survey of Public Pensions: State- and Locally- Administered Defined Benefit Data Summary Report: Economy-Wide Statistics Division Briefs: Public Sector By Phillip Vidal Released July 2015 G14-ASPP-SL
Annual Survey of Public Pensions: State- and Locally- Administered Defined Benefit Data Summary Report: Economy-Wide Statistics Division Briefs: Public Sector By Phillip Vidal Released July 2015 G14-ASPP-SL
Joint Economic Forecast Spring 2013. German Economy Recovering Long-Term Approach Needed to Economic Policy
 Joint Economic Forecast Spring 2013 German Economy Recovering Long-Term Approach Needed to Economic Policy Press version Embargo until: Thursday, 18 April 2013, 11.00 a.m. CEST Joint Economic Forecast
The April 15 deadline for personal income tax returns
 STATE REVENUE FLASH REPORT WWW.ROCKINST.ORG JUNE 18, 2009 Personal Income Tax Revenues Portend Deepening Trouble for Many States Lucy Dadayan and Donald J. Boyd HIGHLIGHTS State personal income tax collections
Health Insurance Coverage of Children Under Age 19: 2008 and 2009
 Health Insurance Coverage of Children Under Age 19: 2008 and 2009 American Community Survey Briefs Issued September 2010 ACSBR/09-11 IntroductIon Health insurance, whether private or public, improves children
The Performance and State Policies Of Higher Education in Illinois: Insights from a Five- State Policy Review Project
 The Performance and State Policies Of Higher Education in Illinois: Insights from a Five- State Policy Review Project Laura W. Perna Joni Finney Patrick Callan With Assistance from: Michael Armijo, Jamey
Health Insurance Exchanges and the Medicaid Expansion After the Supreme Court Decision: State Actions and Key Implementation Issues
 Health Insurance Exchanges and the Medicaid Expansion After the Supreme Court Decision: State Actions and Key Implementation Issues Sara R. Collins, Ph.D. Vice President, Affordable Health Insurance The
EUROSYSTEM STAFF MACROECONOMIC PROJECTIONS FOR THE EURO AREA
 EUROSYSTEM STAFF MACROECONOMIC PROJECTIONS FOR THE EURO AREA On the basis of the information available up to 22 May 2009, Eurosystem staff have prepared projections for macroeconomic developments in the
Fiscal Year 2015 Integrated Financial Plan. 2015 Operating Plan 2015 Capital Plan 2015 Financing Plan
 Fiscal Year Integrated Financial Operating Capital Financing EXECUTIVE SUMMARY Despite the ongoing efforts A Deep Financial Hole (as of September 30, ) of the Postal Service to Liabilities exceed assets
US Department of Health and Human Services Exclusion Program. Thomas Sowinski Special Agent in Charge/ Reviewing Official
 US Department of Health and Human Services Exclusion Program Thomas Sowinski Special Agent in Charge/ Reviewing Official Overview Authority to exclude individuals and entities from Federal Health Care
Impacts of Sequestration on the States
 Impacts of Sequestration on the States Alabama Alabama will lose about $230,000 in Justice Assistance Grants that support law STOP Violence Against Women Program: Alabama could lose up to $102,000 in funds
Forecasts of Macroeconomic Developments, State Revenues from Taxes and Revenue from Other Sources, 2013-2014
 Ministry of Finance Chief Economist - Research, State Revenue and International Affairs June 2013 Forecasts of Macroeconomic Developments, State Revenues from Taxes and Revenue from Other Sources, 2013-2014
Bond Market Insights October 10, 2014
 Bond Market Insights October 10, 2014 by John Simms, CFA and Jerry Wiesner, CFA General Bond Market Treasury yields rose in September as prices fell. Yields in the belly of the curve (5- to 7-year maturities)
University System of Georgia Enrollment Trends and Projections to 2018
 University System of Georgia Enrollment Trends and Projections to 2018 Introduction: Projections of USG Headcount Enrollment Enrollment projections use past trends and information on other variables to
Small Business Credit Outlook
 2014 Q4 Small Business Credit Outlook The Growth Engine in 2015 Stock market volatility and GDP growth slowing to 2.6% lead many to believe the economy is stumbling. This problem can be attributed to a
S&P/Case-Shiller Home Price Indices
 Home Prices in the New Year Continue the Trend Set in Late 2009 According to the S&P/Case-Shiller Home Price Indices New York, March 30, 2010 Data through January 2010, released today by Standard & Poor
Fiscal Year 2015 Integrated Financial Plan
 Fiscal Year Integrated Financial Operating Capital Financing Integrated Financial EXECUTIVE SUMMARY Unaudited - A Deep Financial Hole (as of September 30, 2014) Liabilities exceed assets by approximately
These are among the major findings and conclusions to be drawn from School Planning & Management s 16th Annual School Construction Report.
 S CHOOL M ARKET R ESEARCH I NSTITUTE, INC 1721 Saybrook Road, P.O. Box 10, Haddam, CT 06438 800-838-3444 FAX 860-345-3985 www.smriinc.com SCHOOL CONSTRUCTION SPENDING SHIFTS GEARS Fewer Dollars Mean More
2016 Individual Exchange Premiums updated November 4, 2015
 2016 Individual Exchange Premiums updated November 4, 2015 Within the document, you'll find insights across 50 states and DC with available findings (i.e., carrier participation, price leadership, gross
Meeting with Analysts
 CNB s New Forecast (Inflation Report II/2015) Meeting with Analysts Petr Král Prague, 11 May, 2015 1 Outline Assumptions of the forecast The new macroeconomic forecast Comparison with the previous forecast
County - $0.55/$500 - $.75/$500 depending on +/- 2 million population 0.11% - 0.15% Minnesota
 22-Apr-13 State Deed Transfer and Mortgage Tax Rates, 2012 Alabama State Tax Description Transfer Fee Rate Deeds $0.50/$500 0.10% Mortgages $0.15/$100 0.15% Alaska Arizona $2 fee per deed or contract Flat
Pioneer AMT-Free Municipal Fund
 Pioneer AMT-Free Municipal Fund COMMENTARY Performance Analysis & Commentary September 2015 Fund Ticker Symbols: PBMFX (Class A); PBYMX (Class Y) us.pioneerinvestments.com Third Quarter Review Pioneer
Next 10 is an independent nonpartisan organization that educates, engages and empowers Californians to improve the state s future.
 ISSUE BRIEF SEPTEMBER 3, 2015 Next 10 is an independent nonpartisan organization that educates, engages and empowers Californians to improve the state s future. Next 10 is focused on innovation and the
COMPENSATION, RETIREMENT AND BENEFITS TRENDS REPORT NON-PROFIT INDUSTRY
 COMPENSATION, RETIREMENT AND BENEFITS TRENDS REPORT NON-PROFIT INDUSTRY 2012/2013 Today s Agenda INTRODUCTIONS BACKGROUND COMPENSATION PRACTICES HEALTH AND WELFARE BENEFITS RETIREMENT PLANS QUESTIONS Discover
Benefits of Selling WorkLife 65
 PruTerm WorkLife 65 SM LEARN ABOUT THE PRODUCT AND MARKET Benefits of Selling WorkLife 65 Pru s new and innovative term product will resonate with your clients. WorkLife 65 is a new and innovative term
The Case for Change The Case for Whopping Big Change
 TESTIMONY The California Assembly Higher Education Committee October 7, 2013 Presentation by: David Longanecker President, Western Interstate Commission for Higher Education (WICHE) FINANCING CALIFORNIA
Changes in the Cost of Medicare Prescription Drug Plans, 2007-2008
 Issue Brief November 2007 Changes in the Cost of Medicare Prescription Drug Plans, 2007-2008 BY JOSHUA LANIER AND DEAN BAKER* The average premium for Medicare Part D prescription drug plans rose by 24.5
Tompkins County Department of Administration
 Tompkins County Department of Administration 125 East Court Street Ithaca, NY 14850 Phone: (607) 274-5551 Fax: (607) 274-5558 COUNTY ADMINISTRATOR Joe Mareane DEPUTY COUNTY ADMINISTRATOR Paula E. F. Younger
National Surety Leader
 National Surety Leader Email: Underwriting@SuretyOne.org Facsimile: 919-834-7039 Mail: P.O. Box 37284, Raleigh, NC 27627 MORTGAGE BROKER BONDS MORTGAGE LOAN ORIGINATOR BONDS MORTGAGE LENDER BONDS STATE-BY-STATE
Pro-Growth Tax Policy: Why Small Businesses Need Individual Tax Reform
 Statement for the Record Of Dave Koenig, Vice President, Tax and Profitability, National Restaurant Association For The Hearing On Pro-Growth Tax Policy: Why Small Businesses Need Individual Tax Reform