IMPROVING THE PERFORMANCE OF SATELLITE-TO-IRRADIANCE MODELS USING THE SATELLITE S INFRARED SENSORS
|
|
|
- Theresa Walters
- 7 years ago
- Views:
Transcription
1 IMPROVING THE PERFORMANCE OF SATELLITE-TO-IRRADIANCE MODELS USING THE SATELLITE S INFRARED SENSORS Richard Perez ASRC, Albany, NY, Perez@asrc.cestm.albany,edu Sergey Kivalov ASRC, Albany, NY, skivalov@asrc.cestm.albany,edu Jim Schlemmer ASRC, Albany, NY, Jim@asrc.cestm.albany,edu Karl Hemker, Jr. ASRC, Albany, NY, kmh1@asrc.cestm.albany,edu Antoine Zelenka MeteoSuisse (emeritus) Antoine.zelenka@tele2.ch ABSTRACT This article describes, and presents a preliminary validation of a new geostationary satellite-to-irradiance model designed to complement the existing SUNY model used in the US National Solar Resource Data Base and in SolarAnywhere. The new model uses the satellite s infrared channels to circumvent the main weakness of the current visible channel-based model: its poor performance under snow or persistent cloud conditions. Operationally the new model runs in the background when no snow cover is detected, but takes over when snow cover is detected from the existing model s data input stream. 1. INTRODUCTION The SUNY satellite model [1, 2 has been used to produce the post-1998 part of the National Solar Resource Data Base (NSRDB, [3]) and is the main engine of new operational products such as SolarAnywhere [4]. This model performs acceptably but exhibits shortcomings under certain conditions. The most important weakness of the model is its increased uncertainty and resulting bias when the ground is covered by snow or, more generally, when the ground is highly reflective. This is because, following the fundamental relationship identified by Schmetz [5], the model uses, as its main input, the satellite s visible channel in a way that treats the darkest radiances observed at a particular location as ground seen from space (i.e., clear sky conditions) and the brightest as clouds (i.e., overcast sky conditions). This dark-bright operational dynamics is considerably reduced when the ground is bright from snow or from local geology, and in some cases, such as fresh snow over barren land, it may even be reversed. Because the accuracy of the model depends upon a proper differentiation between cloud and ground, i.e., upon the brightness difference between the two, it deteriorates considerably under bright ground and/or snow cover conditions. Another shortcoming recently identified by Gueymard et al. [6], and sometimes referred to as the Eugene syndrome occurs during prolonged periods of persistent cloud cover when the satellite does not see the ground, resulting in the model losing track of its evolving dark-bright dynamics. This paper presents a practical approach to circumvent the shortcomings: weather geostationary satellites such as NOAA s operational GOES series also view the earth through several infrared (IR) sensors that cover complementary parts of the IR spectrum. Unlike the visible light seen by the satellite which is solar radiation reflected by the earth s surface and atmosphere, IR radiation is emitted by both and is therefore a function of the temperature of the emitting source along the line of sight. It has been shown that a combination of different IR channels could effectively discriminate between most clouds and the ground (e.g., [7, 8]) whether it is snow-covered or not. Figure 1 shows a qualitative example of a scene in North America where the visible image cannot distinguish

2 between the snow-covered ground and the clouds, but a simple combination of two IR channels can. 2. METHODOLOGY The current visible model already acquires and uses ground snow cover as an auxiliary input [1]. Therefore the aim of the new model is not to detect snow but to take advantage of this information to build a stronger model. The new IR model is thus conceived as a stand-by model that runs in the background and takes over either when ground snow is present or when the ground is overly bright from geology. This approach lets us keep the operational strength of the current model under normal conditions. Note that other approaches under development in Europe with the MSG satellite include snow recognition as part of their algorithm (e.g., [9]) and embed the visible and IR channels in one single model. The approach presently retained to build the IR model is purely empirical, relying on multi-site consensus least square fitting of IR-derived brightness temperatures to highquality measurements representing distinct climatic environments in North America. All four IR channels from the GOES imager (Table 1) are used as an input to the model. The empirical approach is retained because (1) the physical processes linking surface downwelling irradiance and IR channels are not as clear-cut as those linking it with reflected visible radiances [5]; and (2) it is an effective approach, further noting that existing operational satellitebased snow detection algorithms rely in part on empirical thresholds in their implementation (e.g., [10]). Whereas the current visible model is self-calibrating and does not depend on evolving satellite calibrations [1], the IR model assumes that the satellite IR channels are properly calibrated and do not drift over time. This is a safe assumption because these channels, which are essentially temperature sensors, are constantly calibrated onboard from an absolute temperature source with an operational accuracy of ± 1K [11]. In addition to the four IR channels, the model also uses operational inputs already available as part of the SolarAnywhere data production stream, including zenith angle, surface temperature, and ground elevation. Surface temperature is a particularly important input which provides real time ground-truth reference to the remotely sensed brightness temperatures -- which are temperatures of the atmospheric layers seen by each IR channel, and that may or may not include the ground, depending on the channel and meteorological conditions. The measurements used to develop the model consist of five stations from NOAA s SURFRAD network [ref] that regularly experience winter snow cover, including: Fort peck, Montana, Boulder, Colorado, Sioux Falls, South Dakota, Bondville, Illinois, Penn State, Pennsylvania. These stations cover several distinct climatic environments ranging from humid (Penn State) to dry continental (Fort peck) locations, and low to high ground elevation (~2,000 m in Boulder). The model per se consist of a polynomial least square fit of ~ 4,000 data points at the 5 sites under snow cover conditions. Figure 2 provides a snapshot of the relevance of each selected input, plotting both the T-ratio and the relative standard deviation of each coefficient extracted through the least square fitting process. The most important inputs are channel 4 and solar geometry (high T-score, very low standard deviation), followed by channel 2, elevation, channel 6 and ground temperature. IR channel 3 plays almost no role in the determination of surface irradiance this would be expected because channel 3 s spectral range covers a very strong water vapor absorption band limiting its sensing domain to the upper atmosphere. 3. PRELIMINARY VALIDATION The IR+visible model is validated against a little over one year of data at each site spanning 1/1/09 to 1/21/10. Snow was present on the ground nearly 25% of the time in Fort Peck, and respectively 21%, 19%, 14% and 12% in Sioux Falls, Penn State, Bondville and Boulder. Table 2 presents comprehensive model validation results for the five selected sites. Results are benchmarked against the existing all-visible model. Two sets of results are presented: (1) snow-only in this case the new model consists exclusively of the new IR model, and, (2) all data points, when the new model is the proposed operational IR-visible combination. The validation metrics include RMSE and MBE as well as the two statistical distribution metrics, KSI and OVER, recommended by the IEA-Task 36 [12]. KSI is the integral of the absolute difference between the modeled and measured cumulative frequency distributions. KSI is computed as % of the Kolmogorov-Smirnoff critical value an allowable departure range from the cumulative distribution based upon the considered number of data

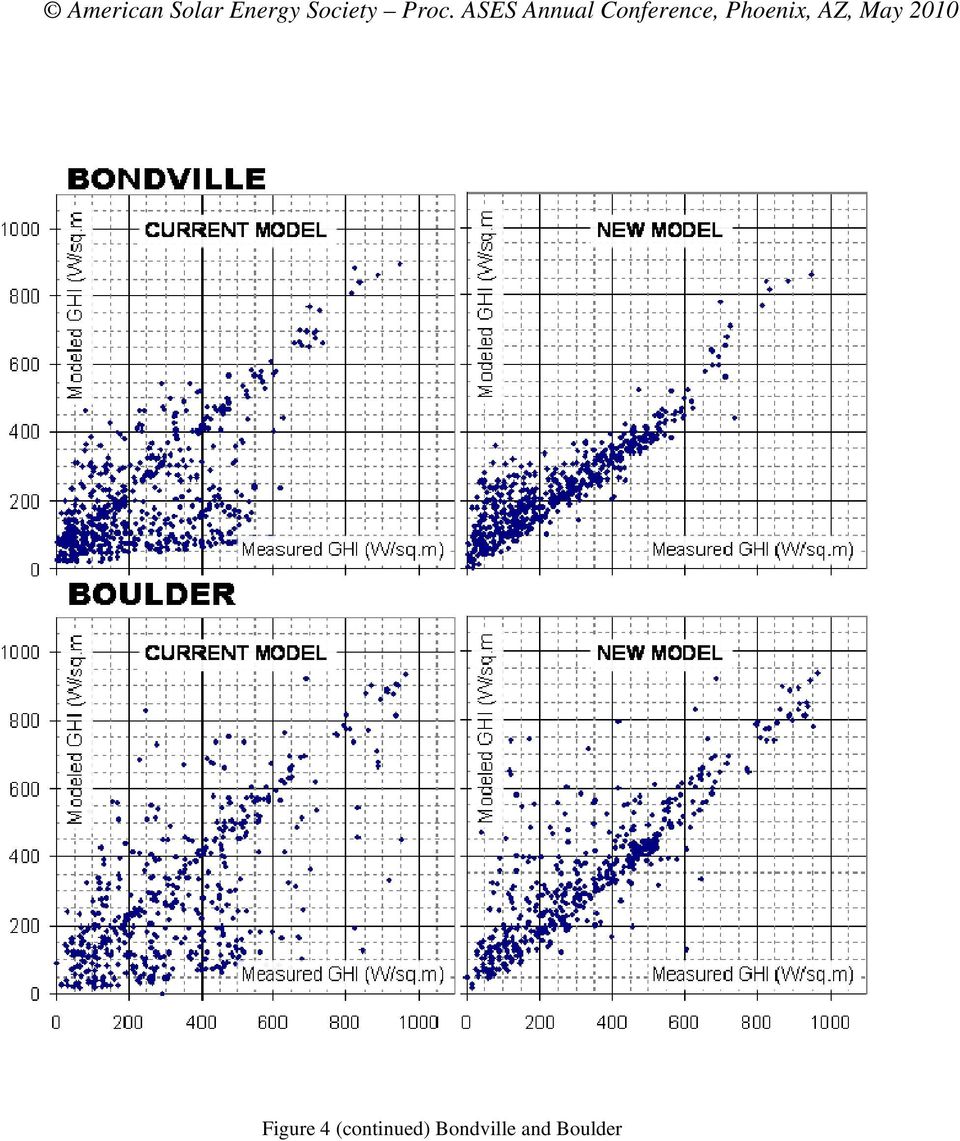
3 points [12]. The OVER statistics only integrates absolute differences in excess of the critical value. Figure 3 provides visualization of Table 2 s KSI and OVER statistics for the snow-cover events, while the scatter plots in Fig. 4 provide a qualitative visualization of the RMSE and MBE results also for the snow-only points when the two models differ. 4. DISCUSSION The present investigation suggests that the new IR-based model enables a considerable operational improvement over the existing model during snow-cover conditions, reducing winter-time bias by a factor of ~ 4, while RMSEs are reduced by almost a factor of 2. The winter performance improvement translates into a considerable year-around improvement as well, with an overall RMSE reduction of nearly 20%. Improvement is across the board for all sites in terms of RMSE and MBE. The largest improvement occurs for sites with little or no vegetation where snow cover results in bright reflecting surfaces (Sioux, Ft. Peck, and Boulder). In Penn State, where wooded land minimizes the visible snow impact in the first place, improvement is more modest. Interestingly, the new model is capable of correcting the snow bias whether it is negative (bright ground mistaken as clouds as in Fort Peck) or positive (overestimation of the dynamic range s lower bound as in Penn State). Although the present limited validation is not fully independent we used the same points to test and validate the model -- it is nevertheless a unique multi-site fit validated against multiple sites with differing environments, not a site-specific fit. Of course the model will have to be validated further and will probably benefit from an extension of the number of fitting sites, much like other robust semi-empirical models previously developed by the authors have shown [e.g., 13]. This empirical model is designed to work with GOES IR channels and is not directly transportable to transport to other geostationary satellites because of differences in the number and the bandwidth of their IR channels. However a similar approach would be straightforward and could be replicated with similar success. While we have not yet tested it operationally, we believe that the model will also improve performance under other circumstances: (1) very high albedo (in this case the test would not be snow, but the visible model s dynamic range s lower bound) and (2) persistent seasonal cloud cover Finally, since the IR-based model could also be implemented for cloud index determination when the sun is below the horizon, operational short-term forecasting will be enhanced for the first hours of the day. 5. ACKNOWLEDGEMENT This work was done under funding from Clean Power Research. 6. REFERENCE 1. Perez R., P. Ineichen, K. Moore, M. Kmiecik, C. Chain, R. George and F. Vignola, (2002): A New Operational Satellite-to-Irradiance Model. Solar Energy 73, 5, pp Perez R., P. Ineichen, M. Kmiecik, K. Moore, R. George and D. Renne, (2004): Producing satellitederived irradiances in complex arid terrain. Solar Energy 77, 4, Myers, D., S. Wilcox, W. Marion, R. George, M. Anderberg (2005): Broadband Model Performance for an Updated National Solar Radiation Data Base in the United States of America, Proc. Solar World Congress, International Solar Energy Society, Orlando, FL. 4. Ressler J. PV output validation with SolarAnywhere and PVSimulator, Napa, California: Clean Power Research, See also: CPR_PVSimulatorOverview.pdf. 5. Schmetz J., (1989): Towards a Surface Radiation Climatology: Retrieval of Downward Irradiances from Satellites, Atmospheric Research, 23, Gueymard C., and S. Wilcox, (2009): Spatial and temporal variability in the solar resource: Assessing the value of short-term measurements at potential solar power plant sites. Proc. ASES National Solar Conference, Buffalo, New York. 7. Barton H., (1988): Differentiating snow from clouds using mid-ir wavelength an example from Ecuador. Proc. IGARS-88 Symposium, Edinburgh, Scotland (IEEE-88CH2497-6) 8. Connell, B., K. Gould and J. Purdom, (2001): High- Resolution GOES-8 Visible and Infrared Cloud Frequency Composites over Northern Florida during the Summers Weather and Forecasting, vol. 16, no6, pp Cebecauer T., M. Suri, and R. Perez, (2010): High performance MSG satellite model for operational solar energy applications. ASES National Solar 2010 Conference, Phoenix, Arizona

4 10. Duerr, B. and A. Zelenka (2009): Deriving surface global irradiance over the Alpine region from METEOSAT Second Generation data by supplementing the HELIOSAT method. Int. Jour. of Remote Sensing 30(22) NOAA-NESDIS, US Department of commerce (2010): Beyer H. G., J. Polo-Martinez, M. Suri, J. L. Torres, E. Lorenz, C. Hoyer-Klick & P. Ineichen, (2008): Handbook on Benchmarking. International Energy Agency, Solar and Heating Cooling Programme, Task 36, Subtask A. 13. Perez, R., P. Ineichen, R. Seals, J. Michalsky and R. Stewart, (1990): Modeling Daylight Availability and Irradiance Components from Direct and Global Irradiance. Solar Energy Vol. 44, pp TABLE 1 GOES 12 Imager Channels SATELLITE IMAGER CHANNEL WAVELENGTH RANGE (μm) GROUND RESOLUTION AT NADIR PRIMARY DETECTION # 1 VISIBLE km Clouds, albedo, smoke # 2 SHORTWAVE IR km Clouds, smoke # 3 Moisture IR km Clouds, water vapor # 4 SURFACE TEMP IR km Clouds, water vapor, surface temperature # 6 LONGWAVE IR* km Couds, water vapor * Channel 6 replaces channel 5, centered at 12 μ on previous platforms before GOES 12, Figure 1: Comparing satellite images from the visible channel (left) and obtained by the difference of two IR channels (right). The IR view qualitatively distinguishes between snow-covered ground and clouds in the upper Great Plains.
: Modeling Daylight Availability and Irradiance Components from Direct and Global Irradiance. Solar Energy Vol. 44, pp.")
5 TABLE 2 Model Performance Summary RMSE (w/sq.m) MBE (w/sq.m) KSI (%critical) OVER (%critical) RMSE (w/sq.m) MBE (w/sq.m) KSI (%critical) OVER (%critical) Fort Peck Sioux Falls Bondville Boulder Penn State all data points % 57% 101% 56% 133% 49% 48% 99% 40% 149% 54% 11% 21% 0% 39% 6% 9% 21% 0% 50% snow data points % 106% 78% 67% 40% 56% 62% 74% 31% 56% 154% 61% 27% 19% 5% 10% 11% 19% 0% 15% Current Model New Model 30 0% T Ratio T Ratio coefficient standard deviation (%) 20% 40% 60% 80% 100% 120% 140% 160% Relative Standard Deviation 0 elevation IR ch 2 IR ch 3 IR ch 4 IR ch 6 Temperature Temperature squared cos Z 180% Figure 2: T-ratio and Coefficient-Standard Deviation resulting from least square fitting process

6 Figure 3: Cumulative Frequency distributions for measured and modeled GHI during snow cover events

7 Figure 4: Modeled vs. measured GHI during snow cover events in Fort Peck, Sioux Falls and Penn State

8 Figure 4 (continued) Bondville and Boulder
VALIDATION OF THE SUNY SATELLITE MODEL IN A METEOSAT ENVIRONMENT
 VALIDATION OF THE SUNY SATELLITE MODEL IN A METEOSAT ENVIRONMENT Richard Perez ASRC, 251 Fuller Rd Albany, NY, 12203 Perez@asrc.cestm.albany,edu Jim Schlemmer ASRC Jim@asrc.cestm.albany,edu Shannon Cowlin
VALIDATION OF SHORT AND MEDIUM TERM OPERATIONAL SOLAR RADIATION FORECASTS IN THE US
 VALIDATION OF SHORT AND MEDIUM TERM OPERATIONAL SOLAR RADIATION FORECASTS IN THE US Richard Perez, Sergey Kivalov, James Schlemmer, Karl Hemker Jr., ASRC, University at Albany David Renné National Renewable
EVALUATION OF NUMERICAL WEATHER PREDICTION SOLAR IRRADIANCE FORECASTS IN THE US
 EVALUATION OF NUMERICAL WEATHER PREDICTION SOLAR IRRADIANCE FORECASTS IN THE US Richard Perez ASRC, Albany, NY, Perez@asrc.albany,edu Mark Beauharnois ASRC, Albany, NY mark@asrc..albany,edu Karl Hemker,
Vaisala 3TIER Services Global Solar Dataset / Methodology and Validation
 ENERGY Vaisala 3TIER Services Global Solar Dataset / Methodology and Validation Global Horizontal Irradiance 70 Introduction Solar energy production is directly correlated to the amount of radiation received
Solarstromprognosen für Übertragungsnetzbetreiber
 Solarstromprognosen für Übertragungsnetzbetreiber Elke Lorenz, Jan Kühnert, Annette Hammer, Detlev Heienmann Universität Oldenburg 1 Outline grid integration of photovoltaic power (PV) in Germany overview
User Perspectives on Project Feasibility Data
 User Perspectives on Project Feasibility Data Marcel Šúri Tomáš Cebecauer GeoModel Solar s.r.o., Bratislava, Slovakia marcel.suri@geomodel.eu http://geomodelsolar.eu http://solargis.info Solar Resources
Overview of the IR channels and their applications
 Ján Kaňák Slovak Hydrometeorological Institute Jan.kanak@shmu.sk Overview of the IR channels and their applications EUMeTrain, 14 June 2011 Ján Kaňák, SHMÚ 1 Basics in satellite Infrared image interpretation
The Surface Energy Budget
 The Surface Energy Budget The radiation (R) budget Shortwave (solar) Radiation Longwave Radiation R SW R SW α α = surface albedo R LW εσt 4 ε = emissivity σ = Stefan-Boltzman constant T = temperature Subsurface
2012. American Solar Energy Society Proc. ASES Annual Conference, Raleigh, NC.
 2012. American Solar Energy Society Proc. ASES Annual Conference, Raleigh, NC. PREDICTING SHORT-TERM VARIABILITY OF HIGH-PENETRATION PV Thomas E. Hoff Clean Power Research Napa, CA 94558 tomhoff@cleanpower.com
Radiative effects of clouds, ice sheet and sea ice in the Antarctic
 Snow and fee Covers: Interactions with the Atmosphere and Ecosystems (Proceedings of Yokohama Symposia J2 and J5, July 1993). IAHS Publ. no. 223, 1994. 29 Radiative effects of clouds, ice sheet and sea
Studying cloud properties from space using sounder data: A preparatory study for INSAT-3D
 Studying cloud properties from space using sounder data: A preparatory study for INSAT-3D Munn V. Shukla and P. K. Thapliyal Atmospheric Sciences Division Atmospheric and Oceanic Sciences Group Space Applications
EVALUATING SOLAR ENERGY PLANTS TO SUPPORT INVESTMENT DECISIONS
 EVALUATING SOLAR ENERGY PLANTS TO SUPPORT INVESTMENT DECISIONS Author Marie Schnitzer Director of Solar Services Published for AWS Truewind October 2009 Republished for AWS Truepower: AWS Truepower, LLC
Clouds and the Energy Cycle
 August 1999 NF-207 The Earth Science Enterprise Series These articles discuss Earth's many dynamic processes and their interactions Clouds and the Energy Cycle he study of clouds, where they occur, and
Development of a. Solar Generation Forecast System
 ALBANY BARCELONA BANGALORE 16 December 2011 Development of a Multiple Look ahead Time Scale Solar Generation Forecast System John Zack Glenn Van Knowe Marie Schnitzer Jeff Freedman AWS Truepower, LLC Albany,
ATM S 111, Global Warming: Understanding the Forecast
 ATM S 111, Global Warming: Understanding the Forecast DARGAN M. W. FRIERSON DEPARTMENT OF ATMOSPHERIC SCIENCES DAY 1: OCTOBER 1, 2015 Outline How exactly the Sun heats the Earth How strong? Important concept
CLOUD COVER REPORTING BIAS AT MAJOR AIRPORTS
 CLOUD COVER REPORTING BIAS AT MAJOR AIRPORTS Richard Perez Joshua A. Bonaventura-Sparagna & Marek Kmiecik ASRC, SUNY, Albany, NY Ray George & David Renné NREL, Golden, CO ABSTRACT Cloud cover has traditionally
Improvement in the Assessment of SIRS Broadband Longwave Radiation Data Quality
 Improvement in the Assessment of SIRS Broadband Longwave Radiation Data Quality M. E. Splitt University of Utah Salt Lake City, Utah C. P. Bahrmann Cooperative Institute for Meteorological Satellite Studies
ESCI 107/109 The Atmosphere Lesson 2 Solar and Terrestrial Radiation
 ESCI 107/109 The Atmosphere Lesson 2 Solar and Terrestrial Radiation Reading: Meteorology Today, Chapters 2 and 3 EARTH-SUN GEOMETRY The Earth has an elliptical orbit around the sun The average Earth-Sun
Evaluation of the Effect of Upper-Level Cirrus Clouds on Satellite Retrievals of Low-Level Cloud Droplet Effective Radius
 Evaluation of the Effect of Upper-Level Cirrus Clouds on Satellite Retrievals of Low-Level Cloud Droplet Effective Radius F.-L. Chang and Z. Li Earth System Science Interdisciplinary Center University
Electromagnetic Radiation (EMR) and Remote Sensing
 and Remote Sensing") Electromagnetic Radiation (EMR) and Remote Sensing 1 Atmosphere Anything missing in between? Electromagnetic Radiation (EMR) is radiated by atomic particles at the source (the Sun), propagates through
Electromagnetic Radiation (EMR) and Remote Sensing 1 Atmosphere Anything missing in between? Electromagnetic Radiation (EMR) is radiated by atomic particles at the source (the Sun), propagates through
USING CLOUD CLASSIFICATION TO MODEL SOLAR VARIABILITY
 USING CLOUD CLASSIFICATION TO MODEL SOLAR VARIABILITY Matthew J. Reno Sandia National Laboratories Georgia Institute of Technology 777 Atlantic Drive NW Atlanta, GA 3332-25, USA matthew.reno@gatech.edu
Solar Irradiance Forecasting Using Multi-layer Cloud Tracking and Numerical Weather Prediction
 Solar Irradiance Forecasting Using Multi-layer Cloud Tracking and Numerical Weather Prediction Jin Xu, Shinjae Yoo, Dantong Yu, Dong Huang, John Heiser, Paul Kalb Solar Energy Abundant, clean, and secure
Chapter 2: Solar Radiation and Seasons
 Chapter 2: Solar Radiation and Seasons Spectrum of Radiation Intensity and Peak Wavelength of Radiation Solar (shortwave) Radiation Terrestrial (longwave) Radiations How to Change Air Temperature? Add
Solar Energy Forecasting Using Numerical Weather Prediction (NWP) Models. Patrick Mathiesen, Sanyo Fellow, UCSD Jan Kleissl, UCSD
 Models. Patrick Mathiesen, Sanyo Fellow, UCSD Jan Kleissl, UCSD") Solar Energy Forecasting Using Numerical Weather Prediction (NWP) Models Patrick Mathiesen, Sanyo Fellow, UCSD Jan Kleissl, UCSD Solar Radiation Reaching the Surface Incoming solar radiation can be reflected,
Solar Energy Forecasting Using Numerical Weather Prediction (NWP) Models Patrick Mathiesen, Sanyo Fellow, UCSD Jan Kleissl, UCSD Solar Radiation Reaching the Surface Incoming solar radiation can be reflected,
Clear Sky Radiance (CSR) Product from MTSAT-1R. UESAWA Daisaku* Abstract
 Product from MTSAT-1R. UESAWA Daisaku* Abstract") Clear Sky Radiance (CSR) Product from MTSAT-1R UESAWA Daisaku* Abstract The Meteorological Satellite Center (MSC) has developed a Clear Sky Radiance (CSR) product from MTSAT-1R and has been disseminating
Clear Sky Radiance (CSR) Product from MTSAT-1R UESAWA Daisaku* Abstract The Meteorological Satellite Center (MSC) has developed a Clear Sky Radiance (CSR) product from MTSAT-1R and has been disseminating
USING THE GOES 3.9 µm SHORTWAVE INFRARED CHANNEL TO TRACK LOW-LEVEL CLOUD-DRIFT WINDS ABSTRACT
 USING THE GOES 3.9 µm SHORTWAVE INFRARED CHANNEL TO TRACK LOW-LEVEL CLOUD-DRIFT WINDS Jason P. Dunion 1 and Christopher S. Velden 2 1 NOAA/AOML/Hurricane Research Division, 2 UW/CIMSS ABSTRACT Low-level
The Next Generation Flux Analysis: Adding Clear-Sky LW and LW Cloud Effects, Cloud Optical Depths, and Improved Sky Cover Estimates
 The Next Generation Flux Analysis: Adding Clear-Sky LW and LW Cloud Effects, Cloud Optical Depths, and Improved Sky Cover Estimates C. N. Long Pacific Northwest National Laboratory Richland, Washington
1. Theoretical background
 1. Theoretical background We consider the energy budget at the soil surface (equation 1). Energy flux components absorbed or emitted by the soil surface are: net radiation, latent heat flux, sensible heat
Estimating Firn Emissivity, from 1994 to1998, at the Ski Hi Automatic Weather Station on the West Antarctic Ice Sheet Using Passive Microwave Data
 Estimating Firn Emissivity, from 1994 to1998, at the Ski Hi Automatic Weather Station on the West Antarctic Ice Sheet Using Passive Microwave Data Mentor: Dr. Malcolm LeCompte Elizabeth City State University
Solar Input Data for PV Energy Modeling
 June 2012 Solar Input Data for PV Energy Modeling Marie Schnitzer, Christopher Thuman, Peter Johnson Albany New York, USA Barcelona Spain Bangalore India Company Snapshot Established in 1983; nearly 30
SOLAR IRRADIANCE FORECASTING, BENCHMARKING of DIFFERENT TECHNIQUES and APPLICATIONS of ENERGY METEOROLOGY
 SOLAR IRRADIANCE FORECASTING, BENCHMARKING of DIFFERENT TECHNIQUES and APPLICATIONS of ENERGY METEOROLOGY Wolfgang Traunmüller 1 * and Gerald Steinmaurer 2 1 BLUE SKY Wetteranalysen, 4800 Attnang-Puchheim,
Meteorological Forecasting of DNI, clouds and aerosols
 Meteorological Forecasting of DNI, clouds and aerosols DNICast 1st End-User Workshop, Madrid, 2014-05-07 Heiner Körnich (SMHI), Jan Remund (Meteotest), Marion Schroedter-Homscheidt (DLR) Overview What
Power Output Analysis of Photovoltaic Systems in San Diego County Mohammad Jamaly, Juan L Bosch, Jan Kleissl
 1 Power Output Analysis of Photovoltaic Systems in San Diego County Mohammad Jamaly, Juan L Bosch, Jan Kleissl Abstract Aggregate ramp rates of 86 distributed photovoltaic (PV) systems installed in Southern
Progress on an Updated National Solar Radiation Data Base
 March 2004 NREL/CP-560-36038 Progress on an Updated National Solar Radiation Data Base Preprint S. Wilcox, M. Anderberg, R. George, W. Marion, D. Myers, and D. Renne National Renewable Energy Laboratory
Passive Remote Sensing of Clouds from Airborne Platforms
 Passive Remote Sensing of Clouds from Airborne Platforms Why airborne measurements? My instrument: the Solar Spectral Flux Radiometer (SSFR) Some spectrometry/radiometry basics How can we infer cloud properties
Blackbody radiation. Main Laws. Brightness temperature. 1. Concepts of a blackbody and thermodynamical equilibrium.
 Lecture 4 lackbody radiation. Main Laws. rightness temperature. Objectives: 1. Concepts of a blackbody, thermodynamical equilibrium, and local thermodynamical equilibrium.. Main laws: lackbody emission:
REDUCING UNCERTAINTY IN SOLAR ENERGY ESTIMATES
 REDUCING UNCERTAINTY IN SOLAR ENERGY ESTIMATES Mitigating Energy Risk through On-Site Monitoring Marie Schnitzer, Vice President of Consulting Services Christopher Thuman, Senior Meteorologist Peter Johnson,
Solar Flux and Flux Density. Lecture 3: Global Energy Cycle. Solar Energy Incident On the Earth. Solar Flux Density Reaching Earth
 Lecture 3: Global Energy Cycle Solar Flux and Flux Density Planetary energy balance Greenhouse Effect Vertical energy balance Latitudinal energy balance Seasonal and diurnal cycles Solar Luminosity (L)
Cloud detection and clearing for the MOPITT instrument
 Cloud detection and clearing for the MOPITT instrument Juying Warner, John Gille, David P. Edwards and Paul Bailey National Center for Atmospheric Research, Boulder, Colorado ABSTRACT The Measurement Of
Authors: Thierry Phulpin, CNES Lydie Lavanant, Meteo France Claude Camy-Peyret, LPMAA/CNRS. Date: 15 June 2005
 Comments on the number of cloud free observations per day and location- LEO constellation vs. GEO - Annex in the final Technical Note on geostationary mission concepts Authors: Thierry Phulpin, CNES Lydie
The impact of window size on AMV
 The impact of window size on AMV E. H. Sohn 1 and R. Borde 2 KMA 1 and EUMETSAT 2 Abstract Target size determination is subjective not only for tracking the vector but also AMV results. Smaller target
Comparison of NOAA's Operational AVHRR Derived Cloud Amount to other Satellite Derived Cloud Climatologies.
 Comparison of NOAA's Operational AVHRR Derived Cloud Amount to other Satellite Derived Cloud Climatologies. Sarah M. Thomas University of Wisconsin, Cooperative Institute for Meteorological Satellite Studies
The APOLLO cloud product statistics Web service The APOLLO cloud product statistics Web service
 The APOLLO cloud product statistics Web service Introduction DLR and Transvalor are preparing a new Web service to disseminate the statistics of the APOLLO cloud physical parameters as a further help in
Energy Pathways in Earth s Atmosphere
 BRSP - 10 Page 1 Solar radiation reaching Earth s atmosphere includes a wide spectrum of wavelengths. In addition to visible light there is radiation of higher energy and shorter wavelength called ultraviolet
a) species of plants that require a relatively cool, moist environment tend to grow on poleward-facing slopes.
 species of plants that require a relatively cool, moist environment tend to grow on poleward-facing slopes.") J.D. McAlpine ATMS 611 HMWK #8 a) species of plants that require a relatively cool, moist environment tend to grow on poleward-facing slopes. These sides of the slopes will tend to have less average solar
J.D. McAlpine ATMS 611 HMWK #8 a) species of plants that require a relatively cool, moist environment tend to grow on poleward-facing slopes. These sides of the slopes will tend to have less average solar
Assessing Cloud Spatial and Vertical Distribution with Infrared Cloud Analyzer
 Assessing Cloud Spatial and Vertical Distribution with Infrared Cloud Analyzer I. Genkova and C. N. Long Pacific Northwest National Laboratory Richland, Washington T. Besnard ATMOS SARL Le Mans, France
Lake Monitoring in Wisconsin using Satellite Remote Sensing
 Lake Monitoring in Wisconsin using Satellite Remote Sensing D. Gurlin and S. Greb Wisconsin Department of Natural Resources 2015 Wisconsin Lakes Partnership Convention April 23 25, 2105 Holiday Inn Convention
Volcanic Ash Monitoring: Product Guide
 Doc.No. Issue : : EUM/TSS/MAN/15/802120 v1a EUMETSAT Eumetsat-Allee 1, D-64295 Darmstadt, Germany Tel: +49 6151 807-7 Fax: +49 6151 807 555 Date : 2 June 2015 http://www.eumetsat.int WBS/DBS : EUMETSAT
Observed Cloud Cover Trends and Global Climate Change. Joel Norris Scripps Institution of Oceanography
 Observed Cloud Cover Trends and Global Climate Change Joel Norris Scripps Institution of Oceanography Increasing Global Temperature from www.giss.nasa.gov Increasing Greenhouse Gases from ess.geology.ufl.edu
ARM SWS to study cloud drop size within the clear-cloud transition zone
 ARM SWS to study cloud drop size within the clear-cloud transition zone (GSFC) Yuri Knyazikhin Boston University Christine Chiu University of Reading Warren Wiscombe GSFC Thanks to Peter Pilewskie (UC)
Temporal variation in snow cover over sea ice in Antarctica using AMSR-E data product
 Temporal variation in snow cover over sea ice in Antarctica using AMSR-E data product Michael J. Lewis Ph.D. Student, Department of Earth and Environmental Science University of Texas at San Antonio ABSTRACT
Use of ARM/NSA Data to Validate and Improve the Remote Sensing Retrieval of Cloud and Surface Properties in the Arctic from AVHRR Data
 Use of ARM/NSA Data to Validate and Improve the Remote Sensing Retrieval of Cloud and Surface Properties in the Arctic from AVHRR Data X. Xiong QSS Group, Inc. National Oceanic and Atmospheric Administration
by Ben Bourne 2009 PVSim and Solar Energy System Performance Modeling
 by Ben Bourne 2009 PVSim and Solar Energy System Performance Modeling EXECUTIVE SUMMARY SunPower Corporation develops and maintains a custom photovoltaic (PV) simulation tool called SunPower PVSim for
Forecasting of Solar Radiation
 Forecasting of Solar Radiation Detlev Heinemann, Elke Lorenz, Marco Girodo Oldenburg University, Institute of Physics, Energy and Semiconductor Research Laboratory, Energy Meteorology Group 26111 Oldenburg,
Monitoring Soil Moisture from Space. Dr. Heather McNairn Science and Technology Branch Agriculture and Agri-Food Canada heather.mcnairn@agr.gc.
 Monitoring Soil Moisture from Space Dr. Heather McNairn Science and Technology Branch Agriculture and Agri-Food Canada heather.mcnairn@agr.gc.ca What is Remote Sensing? Scientists turn the raw data collected
163 ANALYSIS OF THE URBAN HEAT ISLAND EFFECT COMPARISON OF GROUND-BASED AND REMOTELY SENSED TEMPERATURE OBSERVATIONS
 ANALYSIS OF THE URBAN HEAT ISLAND EFFECT COMPARISON OF GROUND-BASED AND REMOTELY SENSED TEMPERATURE OBSERVATIONS Rita Pongrácz *, Judit Bartholy, Enikő Lelovics, Zsuzsanna Dezső Eötvös Loránd University,
Improving Accuracy of Solar Forecasting February 14, 2013
 Improving Accuracy of Solar Forecasting February 14, 2013 Solar Resource Forecasting Objectives: Improve accuracy of solar resource forecasts Enable widespread use of solar forecasts in power system operations
MODIS IMAGES RESTORATION FOR VNIR BANDS ON FIRE SMOKE AFFECTED AREA
 MODIS IMAGES RESTORATION FOR VNIR BANDS ON FIRE SMOKE AFFECTED AREA Li-Yu Chang and Chi-Farn Chen Center for Space and Remote Sensing Research, National Central University, No. 300, Zhongda Rd., Zhongli
Cloud Climatology for New Zealand and Implications for Radiation Fields
 Cloud Climatology for New Zealand and Implications for Radiation Fields G. Pfister, R.L. McKenzie, J.B. Liley, A. Thomas National Institute of Water and Atmospheric Research, Lauder, New Zealand M.J. Uddstrom
Example of an end-to-end operational. from heat waves
 Example of an end-to-end operational service in support to civil protection from heat waves Paolo Manunta pkt006-11-1.0 1.0_WEBGIS Athens, 8 June 2007 OUTLINE Heat Island definition and causes Heat Island
RESULTS FROM A SIMPLE INFRARED CLOUD DETECTOR
 RESULTS FROM A SIMPLE INFRARED CLOUD DETECTOR A. Maghrabi 1 and R. Clay 2 1 Institute of Astronomical and Geophysical Research, King Abdulaziz City For Science and Technology, P.O. Box 6086 Riyadh 11442,
The APOLLO cloud product statistics Web service
 The APOLLO cloud product statistics Web service Introduction DLR and Transvalor are preparing a new Web service to disseminate the statistics of the APOLLO cloud physical parameters as a further help in
CHAPTER 2 Energy and Earth
 CHAPTER 2 Energy and Earth This chapter is concerned with the nature of energy and how it interacts with Earth. At this stage we are looking at energy in an abstract form though relate it to how it affect
Best practices for RGB compositing of multi-spectral imagery
 Best practices for RGB compositing of multi-spectral imagery User Service Division, EUMETSAT Introduction Until recently imagers on geostationary satellites were limited to 2-3 spectral channels, i.e.
Treasure Hunt. Lecture 2 How does Light Interact with the Environment? EMR Principles and Properties. EMR and Remote Sensing
 Lecture 2 How does Light Interact with the Environment? Treasure Hunt Find and scan all 11 QR codes Choose one to watch / read in detail Post the key points as a reaction to http://www.scoop.it/t/env202-502-w2
Active Fire Monitoring: Product Guide
 Active Fire Monitoring: Product Guide Doc.No. Issue : : EUM/TSS/MAN/15/801989 v1c EUMETSAT Eumetsat-Allee 1, D-64295 Darmstadt, Germany Tel: +49 6151 807-7 Fax: +49 6151 807 555 Date : 14 April 2015 http://www.eumetsat.int
Global LAnd Surface Satellite (GLASS) Products: Characteristics and Preliminary Applications. Shunlin Liang & GLASS data production team
 Products: Characteristics and Preliminary Applications. Shunlin Liang & GLASS data production team") Global LAnd Surface Satellite (GLASS) Products: Characteristics and Preliminary Applications Shunlin Liang & GLASS data production team University of Maryland and Beijing Normal University GV2M, Avignon,
Global LAnd Surface Satellite (GLASS) Products: Characteristics and Preliminary Applications Shunlin Liang & GLASS data production team University of Maryland and Beijing Normal University GV2M, Avignon,
The study of cloud and aerosol properties during CalNex using newly developed spectral methods
 The study of cloud and aerosol properties during CalNex using newly developed spectral methods Patrick J. McBride, Samuel LeBlanc, K. Sebastian Schmidt, Peter Pilewskie University of Colorado, ATOC/LASP
COMPUTING CLOUD MOTION USING A CORRELATION RELAXATION ALGORITHM Improving Estimation by Exploiting Problem Knowledge Q. X. WU
 COMPUTING CLOUD MOTION USING A CORRELATION RELAXATION ALGORITHM Improving Estimation by Exploiting Problem Knowledge Q. X. WU Image Processing Group, Landcare Research New Zealand P.O. Box 38491, Wellington
Maximizing PV peak shaving with solar load control: validation of a web-based economic evaluation tool
 Solar Energy 74 (2003) 409 415 Maximizing PV peak shaving with solar load control: validation of a web-based economic evaluation tool Richard Perez *, Tom Hoff, Christy Herig, Jigar Shah a, b c d a ASRC,
Solar Radiation Measurement. Bruce W Forgan, WMO RAV Metrology Workshop, Melbourne, Novemberr 2011
 Solar Radiation Measurement Bruce W Forgan, WMO RAV Metrology Workshop, Melbourne, Novemberr 2011 Why Do We Need Data on Solar Energy? Global Climate System Climate Energy Balance Solar Exposure and Irradiance
3.4 Cryosphere-related Algorithms
 3.4 Cryosphere-related Algorithms GLI Algorithm Description 3.4.-1 3.4.1 CTSK1 A. Algorithm Outline (1) Algorithm Code: CTSK1 (2) Product Code: CLFLG_p (3) PI Name: Dr. Knut Stamnes (4) Overview of Algorithm
Solar and PV forecasting in Canada
 Solar and PV forecasting in Canada Sophie Pelland, CanmetENERGY IESO Wind Power Standing Committee meeting Toronto, September 23, 2010 Presentation Plan Introduction How are PV forecasts generated? Solar
Cloud Model Verification at the Air Force Weather Agency
 2d Weather Group Cloud Model Verification at the Air Force Weather Agency Matthew Sittel UCAR Visiting Scientist Air Force Weather Agency Offutt AFB, NE Template: 28 Feb 06 Overview Cloud Models Ground
NCDC s SATELLITE DATA, PRODUCTS, and SERVICES
 **** NCDC s SATELLITE DATA, PRODUCTS, and SERVICES Satellite data and derived products from NOAA s satellite systems are available through the National Climatic Data Center. The two primary systems are
5.5. San Diego (8/22/03 10/4/04)
") NSF UV SPECTRORADIOMETER NETWORK 23-24 OPERATIONS REPORT 5.5. San Diego (8/22/3 1/4/4) The 23-24 season at San Diego includes the period 8/22/3 1/4/4. In contrast to other network sites, San Diego serves
NSF UV SPECTRORADIOMETER NETWORK 23-24 OPERATIONS REPORT 5.5. San Diego (8/22/3 1/4/4) The 23-24 season at San Diego includes the period 8/22/3 1/4/4. In contrast to other network sites, San Diego serves
2.3 Spatial Resolution, Pixel Size, and Scale
 Section 2.3 Spatial Resolution, Pixel Size, and Scale Page 39 2.3 Spatial Resolution, Pixel Size, and Scale For some remote sensing instruments, the distance between the target being imaged and the platform,
Towards assimilating IASI satellite observations over cold surfaces - the cloud detection aspect
 Towards assimilating IASI satellite observations over cold surfaces - the cloud detection aspect Tuuli Perttula, FMI + Thanks to: Nadia Fourrié, Lydie Lavanant, Florence Rabier and Vincent Guidard, Météo
T.A. Tarasova, and C.A.Nobre
 SEASONAL VARIATIONS OF SURFACE SOLAR IRRADIANCES UNDER CLEAR-SKIES AND CLOUD COVER OBTAINED FROM LONG-TERM SOLAR RADIATION MEASUREMENTS IN THE RONDONIA REGION OF BRAZIL T.A. Tarasova, and C.A.Nobre Centro
Broadband and Spectral Shortwave Calibration Results from ARESE II
 Broadband and Spectral Shortwave Calibration Results from ARESE II Introduction J. J. Michalsky, P. W. Kiedron, and J. L. Berndt State University of New York Albany, New York T. L. Stoffel, D. Myers, I.
SIXTH GRADE WEATHER 1 WEEK LESSON PLANS AND ACTIVITIES
 SIXTH GRADE WEATHER 1 WEEK LESSON PLANS AND ACTIVITIES WATER CYCLE OVERVIEW OF SIXTH GRADE WATER WEEK 1. PRE: Evaluating components of the water cycle. LAB: Experimenting with porosity and permeability.
Empirical study of the temporal variation of a tropical surface temperature on hourly time integration
 Global Advanced Research Journal of Physical and Applied Sciences Vol. 4 (1) pp. 051-056, September, 2015 Available online http://www.garj.org/garjpas/index.htm Copyright 2015 Global Advanced Research
Joint Polar Satellite System (JPSS)
") Joint Polar Satellite System (JPSS) John Furgerson, User Liaison Joint Polar Satellite System National Environmental Satellite, Data, and Information Service National Oceanic and Atmospheric Administration
Joint Polar Satellite System (JPSS) John Furgerson, User Liaison Joint Polar Satellite System National Environmental Satellite, Data, and Information Service National Oceanic and Atmospheric Administration
Lectures Remote Sensing
 Lectures Remote Sensing ATMOSPHERIC CORRECTION dr.ir. Jan Clevers Centre of Geo-Information Environmental Sciences Wageningen UR Atmospheric Correction of Optical RS Data Background When needed? Model
MODELING DISTRIBUTION SYSTEM IMPACTS OF SOLAR VARIABILIY AND INTERCONNECTION LOCATION
 MODELING DISTRIBUTION SYSTEM IMPACTS OF SOLAR VARIABILIY AND INTERCONNECTION LOCATION Matthew J. Reno Sandia National Laboratories Georgia Institute of Technology P.O. Box 5800 MS 1033 Albuquerque, NM
SAFNWC/MSG Cloud type/height. Application for fog/low cloud situations
 SAFNWC/MSG Cloud type/height. Application for fog/low cloud situations 22 September 2011 Hervé LE GLEAU, Marcel DERRIEN Centre de météorologie Spatiale. Lannion Météo-France 1 Fog or low level clouds?
Solar Energy. Outline. Solar radiation. What is light?-- Electromagnetic Radiation. Light - Electromagnetic wave spectrum. Electromagnetic Radiation
 Outline MAE 493R/593V- Renewable Energy Devices Solar Energy Electromagnetic wave Solar spectrum Solar global radiation Solar thermal energy Solar thermal collectors Solar thermal power plants Photovoltaics
How To Forecast Solar Power
 Forecasting Solar Power with Adaptive Models A Pilot Study Dr. James W. Hall 1. Introduction Expanding the use of renewable energy sources, primarily wind and solar, has become a US national priority.
Cloud Thickness Estimation from GOES-8 Satellite Data Over the ARM-SGP Site
 Cloud Thickness Estimation from GOES-8 Satellite Data Over the ARM-SGP Site V. Chakrapani, D. R. Doelling, and A. D. Rapp Analytical Services and Materials, Inc. Hampton, Virginia P. Minnis National Aeronautics
How To Measure Solar Spectral Irradiance
 Accurate Determination of the TOA Solar Spectral NIR Irradiance Using a Primary Standard Source and the Bouguer-Langley Technique. D. Bolsée, N. Pereira, W. Decuyper, D. Gillotay, H. Yu Belgian Institute
Comparison between current and future environmental satellite imagers on cloud classification using MODIS
 Remote Sensing of Environment 108 (2007) 311 326 www.elsevier.com/locate/rse Comparison between current and future environmental satellite imagers on cloud classification using MODIS Zhenglong Li a,, Jun
Sky Monitoring Techniques using Thermal Infrared Sensors. sabino piazzolla Optical Communications Group JPL
 Sky Monitoring Techniques using Thermal Infrared Sensors sabino piazzolla Optical Communications Group JPL Atmospheric Monitoring The atmospheric channel has a great impact on the channel capacity at optical
Overview. What is EMR? Electromagnetic Radiation (EMR) LA502 Special Studies Remote Sensing
 LA502 Special Studies Remote Sensing") LA502 Special Studies Remote Sensing Electromagnetic Radiation (EMR) Dr. Ragab Khalil Department of Landscape Architecture Faculty of Environmental Design King AbdulAziz University Room 103 Overview What
LA502 Special Studies Remote Sensing Electromagnetic Radiation (EMR) Dr. Ragab Khalil Department of Landscape Architecture Faculty of Environmental Design King AbdulAziz University Room 103 Overview What
Data Processing Flow Chart
 Legend Start V1 V2 V3 Completed Version 2 Completion date Data Processing Flow Chart Data: Download a) AVHRR: 1981-1999 b) MODIS:2000-2010 c) SPOT : 1998-2002 No Progressing Started Did not start 03/12/12
CLOUD CLASSIFICATION EXTRACTED FROM AVHRR AND GOES IMAGERY. M.Derrien, H.Le Gléau
 CLOUD CLASSIFICATION EXTRACTED FROM AVHRR AND GOES IMAGERY M.Derrien, H.Le Gléau Météo-France / SCEM / Centre de Météorologie Spatiale BP 147 22302 Lannion. France ABSTRACT We developed an automated pixel-scale
Southern AER Atmospheric Education Resource
 Southern AER Atmospheric Education Resource Vol. 9 No. 5 Spring 2003 Editor: Lauren Bell In this issue: g Climate Creations exploring mother nature s remote control for weather and Climate. g Crazy Climate
The Centre for Australian Weather and Climate Research. A partnership between CSIRO and the Bureau of Meteorology
 The Centre for Australian Weather and Climate Research A partnership between CSIRO and the Bureau of Meteorology Testing and diagnosing the ability of the Bureau of Meteorology s Numerical Weather Prediction
Title: Evaluation of numerical weather prediction for intra day solar forecasting in the continental United States
 Title: Evaluation of numerical weather prediction for intra day solar forecasting in the continental United States Authors: Patrick Mathiesen 1 and Jan Kleissl 1 (corresponding author) 1 Department of
Predicting daily incoming solar energy from weather data
 Predicting daily incoming solar energy from weather data ROMAIN JUBAN, PATRICK QUACH Stanford University - CS229 Machine Learning December 12, 2013 Being able to accurately predict the solar power hitting
Improved diagnosis of low-level cloud from MSG SEVIRI data for assimilation into Met Office limited area models
 Improved diagnosis of low-level cloud from MSG SEVIRI data for assimilation into Met Office limited area models Peter N. Francis, James A. Hocking & Roger W. Saunders Met Office, Exeter, U.K. Abstract