NOTORNIS. Editor B D. Heather, 10 Jocelyn Crescent, SILVERSTREAM
|
|
|
- Ernest Patterson
- 8 years ago
- Views:
Transcription
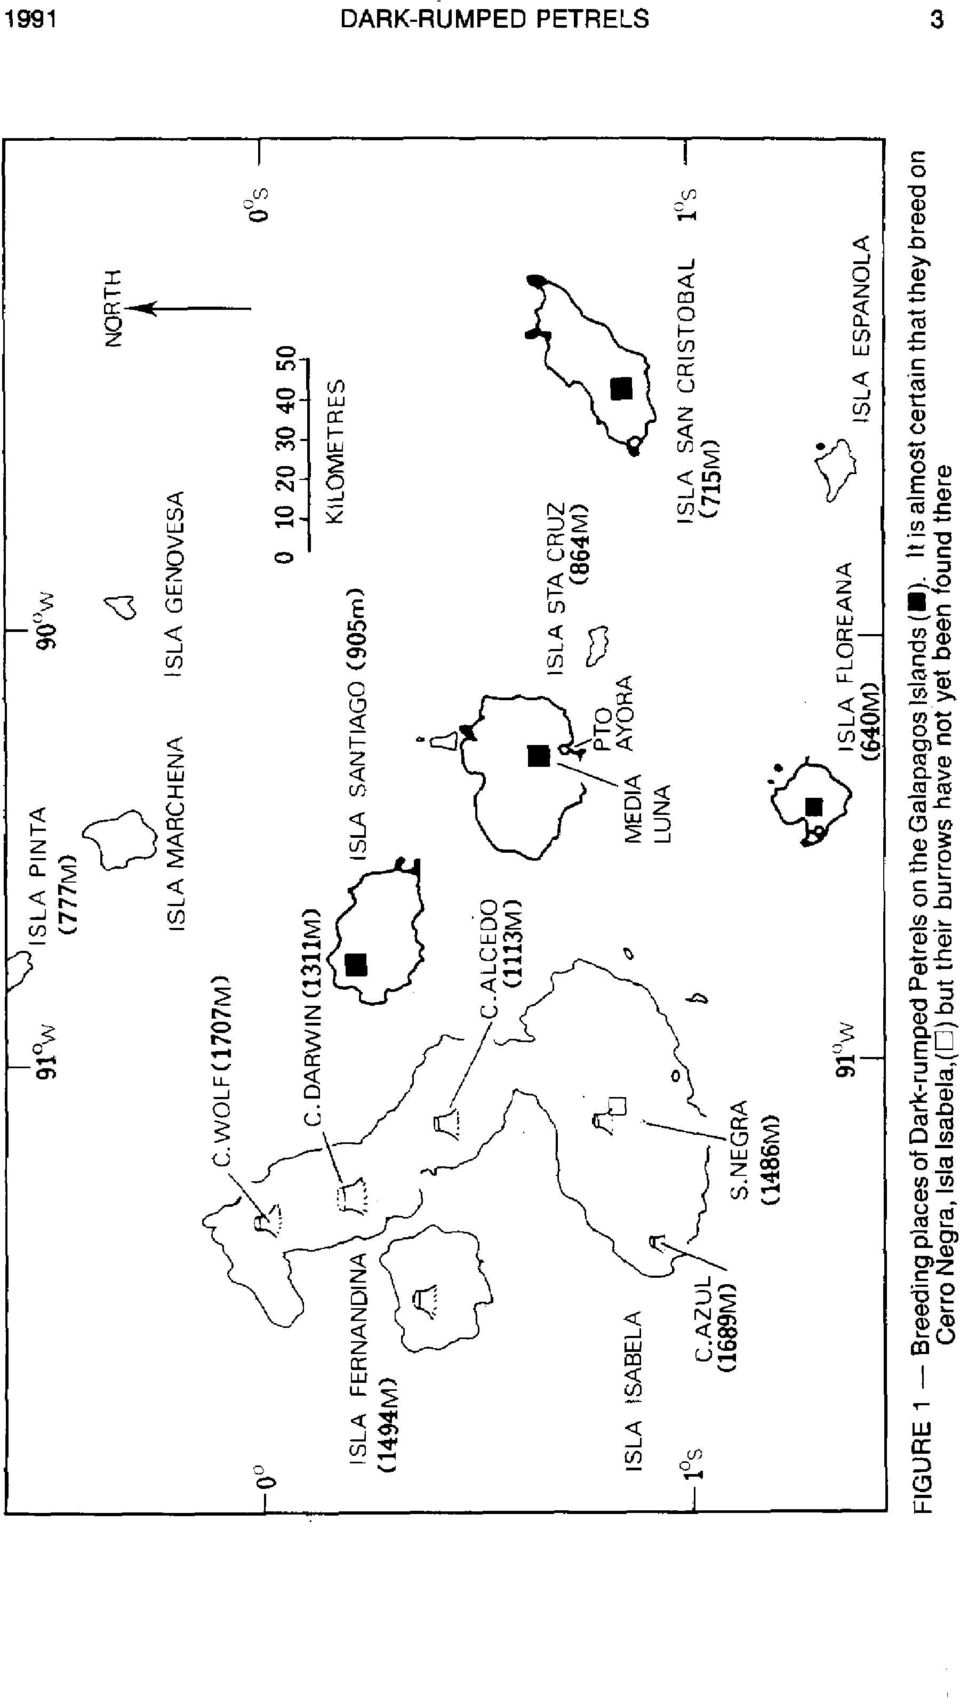
1 - NOTORNIS is the journal of the Ornithological Society of New Zealand (Inc Editor B D. Heather, 10 Jocelyn Crescent, SILVERSTREAM VOLUME 38 PART 1 MARCH pp DIFFERENCES AMONG DARK-RUMPED PETREL (Pterodroma phaeopygia) POPULATIONS WITHIN THE GALAPAGOS ARCHIPELAGO 1 By R. J. TOMKINS and B. J. MILNE ABSTRACT Differences in the time of onset of breeding, morphology, egg size, plumage and vocalisations of Dark-mmped Petrels (Prerodroma phaeopygia phaeopygia) were investigated on four islands in the Galapagos. Comparisons were made with P. p. sandwichensis in Hawaii. In Galapagos, breeding cycles differed among islands, and on San Cristobal there were two populations that bred at different times. On Floreana, colonies at different altitudes bred at different times. Eggs were laid on Santiago over four consecutive months; on Santa Cruz the egg-laying period was shorter. Analyses of morphological measurements and notional volume separated Galapagos Dark-rumped Petrels into three groups. Birds on Santa Cruz and those breeding in the middle of the year on San Cristobal were the smallest; birds on Santiago and those breeding at the end of the year on San Cristobal were of intermediate size; and those on Floreana were the largest. There was a similar size trend in the breadth and volume of eggs. No relationship was found between variable plumage patterns on head and chest or between plumage and island populations. Evidence is presented that supports sexual dimorphism in vocalisations, and it is suggested that males make Sweet calls and females make Coarse calls. There were statistically significant interisland differences among Sweet calls and among Coarse calls. Didects probably exist within the archipelago. Calls had either one or two introductory syllables. When present, the second introductory syllable was very similar to the single introductory syllable, and these may serve the same function. Discriminant analysis of Sweet calls correctly classified of these into island of origin. A similar analysis of morphology correctly classified 58.6OI0 of birds from five populations. A theoretical combination of these two analyses indicates a potential classification rate of 92.6%. Although there are differences among Galapagos populations, there is not yet sufficient evidence to warrant subspecific status. Vocalisations of the Hawaiian birds were quite different from those in Galapagos, and Galapagos birds were bigger. Dark-rurnped Petrels in Galapagos and Hawaii might be more distant taxonomically than currently recognised and they map be different species. 1 Contribution Number 405 of the Charles Darwin Foundation for the Galapagos NOTORNIS 38: 1-35 (1991)

2 2 TOMKINS & MlLNE NOTORNIS 38 INTRODUCTION Dark-rurnped Petrels (Pterodroma phaeopygia) breed on the Galapagos (P.p. phaeopgyi'a) and Hawaiian (P. p. sandwichensis) archipelagos and are endangered at both locations (King 1981). They are members of the P. hasitata superspecies of medium-sized gadfly petrels. This group comprises five to eight low-latitude, dichromatic forms which are similar in colour, size, behaviour and breeding habitat (Murphy & Mowbray 1951, Palmer 1962, Jouanin & Mougin 1979, Warren King, pers. comm.). The calls differ among these forms. Imber (1985) recently included Dark-rumped Petrels in the subgenus Hallstroma, and Meredith2 included them in the P. neghcta group. In Galapagos (Fig. l), petrels breed on four islands less than 170 krn apart. This study includes data from four adjacent colonies on Isla Santa Cruz, nine widespread colonies on Isla Santiago, four widespread colonies on lsla San Cristobal, and two adjacent and one distant colony on Isla Floreana. Here, we regard a colony as an aggregation of burrows in an area of variable size, sometimes as large as 200 m by 300 m. Not all nests in any colony were monitored, nor were all colonies on any island found. Distances between colonies varied from 300 m to 5 km. Local residents are sure that petrels breed on Sierra Negra, Isla Isabela (A. Tupiza, pers. comm.), although nests have not been reported. Petrels have also been seen and heard on other volcanoes on Isabela (Tomkins 19803, 1985). Dark-rumped Petrels are pelagic feeders, dispersing to sea after breeding (Harris 1970). At present they breed mostly in the wet and cool zones of the highlands, but this has not always been so, at least on Santa Cruz (Harris 1970). They are annual breeders, and do not replace their single egg if it is damaged or lost. Optimistic estimates of the Galapagos population were up to pairs (Baker+, Duffy 1984, Harris 1984); however, results from recent investigations imply that 7500 breeding pairs are more likely (Tomkins3; Cruz & Cms). On all breeding islands in Galapagos, Dark-rumped Petrels return to colonies only at night. During this study they were almost silent on their return and for most of the night, but began aerial calling about three hours before sunrise (about 0600 h). However, this pattern might not be typical of all islands, as there are reports that birds began to call shortly after sunset and continued until dawn (Robert I. Bowman, pers. comm., F. and J. C m, pas. comm.). The birds call while circling the colony, often during highspeed chases (Fig. 2), and while flying from the colony out to sea. As the number of birds in the air increases shortly before sunrise, calling reaches a maximum. Some birds then return to their burrows, but most fly to sea. MEREDITH, C The vertebrate fossil fauna of Norfolk Island, and the phylogeny of the genus Pterodmma. Unpubl. Ph.D. thesis, Monash University, Melbourne, Australia. 255 pp. TOMKINS, R.J A study of the conservation of the Dark-rumped Petrel (Prerodtoma phaeopygiu): considered to be an endangered species in the Galapagos. Unpubl. report, Charles Danvin Research Station, Galapagos. 74 pp. BAKER, A.R Breeding distribution and population size of the Dark-rumped Petrel (Ptnodmphaew) on Santa Ouz Island, Galapagos. Unpubl. report, Charles Darwin Research Station, Galapagos. 78 pp. CRUZ, F.; CRUZ, J The Dark-rumped Petrel conservation project. Unpubl. annual report. Charles Darwin Research Station, Galapagos. 17 pp.
. The calls differ among these forms. Imber (1985) recently included Dark-rumped Petrels in the subgenus Hallstroma, and Meredith2 included them in the P. neghcta group.")
3 DARK-RUMPED PETRELS
4 4 TOMKINS & MILNE NOTORNIS 38 FIGURE 2 - Dark-rurnped Petrels call loudly while circling over colonies before dawn. Different calls are ascribed to males and females Galapagos Dark-rumped Petrels use three flight calls frequently (Tomkins, in prep.): a short 3-5 syllable call (possibly used for identification); a similar but longer call of syllables (possibly used in aggressive or defensive situations; Fig. 3); and a single-syllable call (possibly used in conditions of extreme stress; none was analysed). There are two unmistakable forms of the short and long calls. One, which we term the Sweet call, is sweet and pleasant to the ear; the other, termed Coarse, is coarse and grating. Harris (1970) studied general aspects of this species on Santa Cruz, and Tornkins (19803, 1985) studied their breeding success and predators on all four islands. More recently Coulter et a16 investigated petrel predators on 6COULTER, M.C.; CRU.Z, F.; BEACH, T The biology and conservation of the Darkrumped Petrel, Pterodramh phaeopygia, on Floreana Island, Galapagos, Ecuador. Unpubl. report, Chafles Darwin Research Station, Galapagos. 33 pp.
; and a single-syllable call (possibly used in conditions of extreme stress; none was analysed). There are two unmistakable forms of the short and long calls.")
5 DARK-RUMPED PETRELS 'N' x F (c) FE?fiLE: wide, h~~nd (d) FEMALE: narrow hand FIGURE 3 - Two of the three common flight calls made by Dark-rurnped Petrels. A rare overlap of second and third syllables is arrowed.

6 Floreana. Cruz & Cruz (1987) studied the diet and breeding phenology of these birds and control of their predators, mainly on Floreana. The Galapagos National Parks Service (SPNG) and the Charles Darwin Research Station (CDRS) are currently monitoring breeding success and controlling predators. Sirnons (1985) investigated many aspects of this species on the Hawaiian islands. Over the years, studies have revealed differences in size, breeding phenology, and plumage between specific members of the order Procellariiformes at different locations, but these studies have rarely incorporated vocalisations. It is difficult to provide quantitative analyses of the vocalisations of nocturnal petrels. Several workers have described such calls phonetically (Oliver 1955, Warham 1956, 1979, Wingate 1964, Cramp 81 Simmons 1977, Imber 1985, Simons 1985) and have often provided sonagrams of "typical" calls, e.g. Brooke (1986). These two tools can only detect gross interpopulation differences. Ainley (1980) quantified some features of sonagrams for comparative studies of Leach's Storm Petrels (Oceanodroma leucorhoa), as did James & Robertson (1986) when discussing the usefulness of vocalisations in petrel systematics. We have examined less obvious and more detailed interpopulation differences than did Ainley or James & Robertson. In this paper we investigate the existence of consistent interisland differences among groups of birds breeding on four islands in Galapagos, by comparing their breeding phenology, morphology, egg size, plumage and vocalisations. Comparisons are made with the Hawaiian subspecies. We discuss possible causes of the differences that were found. METHODS Breeding phenology Burrows on each island were numbered and monitored individually; 232 known breeding attempts in 444 burrows were recorded (Tomkins 1985). Colonies on Santa Cruz were visited 31 times in 1978 and 1979, and the colonies on other breeding islands were visited 4-5 times, mostly in Adults and large chicks were banded with numbered metal bands from the British Museum. We estimated the age of eggs by comparing their weights with eggs of known age, by their cleanliness, and by the parents' attendance at the burrow. We estimated the age of chicks by comparison with knownage chicks, and by the colour and type of their down. Thus, we established a breeding timetable for each nest and verified or adjusted it based on information from subsequent visits. We compared sample distributions of laying dates using ANOVA and t-tests. In the absence of a standard statistical procedure, we tested whether the distribution of laying dates for San Cristobal was bimodal or uniform, using a method suggested by Dr R. C. Griffiths, Mathematics Department, Monash University. The hypothesis that the sample distribution was a mixture of two distinct temporally separated samples was tested against the null hypothesis that egg laying was uniformly random (Fig. 4). The test is done by fmt sorting the dates. Any date can then be arbitrarily chosen to separate the sample distribution into two subgroups; the date that optimally separates the sample into two distinct subgroups is defined as the one which minimises the sum

7 1991 DARK-RUMPED PETRELS 7 of the variances of the two subgroups. The minimum variance sum statistic derived in this way may then be compared with similar statistics computed from randomly generated uniform distributions. Santa Cruz 1978 Santa Cruz 1979 Santiago 1979 Floreana 1979 (HABI Average date : 18 March n =22 (LAB] Average n = 21 date = 8 May San Cristobal 1979 Agerage date = 9 January n =27 n = 17 Average date = 1 June 1 1 ' ' I ' I ' l ' ~ ~ r l ' l ' l ' l ' l N D J F M 4 M J J A S O MONTH FIGURE 4 - Estimated laying dates among and within islands.

8 8 TOMKINS & MlLNE Morphology and weight RJT caught all birds in burrows by day, banded them, and measured them with calipers and a rule. Bill depth was measured ( mm) at the shallowest part, anterior to the nares. The exposed culmen (for live Galapagos birds and Hawaiian museum specimens) was measured (+ 0.1 mm) as the maximum distance from the junction of skin and upper mandible on the forehead to the most distant part of the unguis, i.e. to the curve, not the bill tip. Although the difference between these two measurements of length in Dark-rumped Petrels and similar species is less than 0.3% (Tomkins, unpubl. data), the advantage of the maximum-distance measurement over the usual culmen length measurement (Baldwin et al ) in Procellariiformes is that it is less influenced by wear (Tornkins 1984). There was great variation in the size of the latericorn plate on the sides of birds' bills, but as it was difficult to measure this plate accurately on live birds, the significance of this variation could not be investigated. Chords ( + 1 mrn) of flattened wings were measured, as were lengths of the central tail feathers ( + 1 mm), tarsus, and middle toe excluding claw ( f 0.1 mm). A notional index of the volume of each bird was calculated by multiplying together the six mensural values and taking the square root of the product; thus, it may be considered as an aggregative variable. Galapagos birds were weighed (+ 2 g) in a bag with a Pesola 1 kg spring balance. Consecutive weight readings taken a few weeks apart on the same individual varied by up to 20% (Tomkins, unpubl. data). This great fluctuation is common in Procellariiformes (Imber 1976, Dunnet 1985). Although we consider weight to be unreliable for taxonomy, we have included weights in preliminary analyses to allow future workers to make comparisons with similar species. We ascertained the sex of only 19 birds (from different islands), by examination of cloacae and dissecting dead birds. This was an inadequate sample size to investigate sexual dimorphism. Based on differences in altitude and breeding phenology, data for the three colonies on Floreana were condensed to two groups, Low-Altitude- Breeders (LAB) and High-Altitude-Breeders (HAB). On San Cristobal egg laying occurred intermittently throughout a ten month period in each of the four colonies. There did not appear to be any association between colonies and laying dates, and following persuasive evidence of bimodality (see Results), data were separated into two groups, End-Of-Year (EOY) breeders and Middle-Of-Year (MOY) breeders. The populations on Santa Cruz and Santiago were each considered to be homogeneous. One-way ANOVA was applied to the six mensural variables, the derived notional volume, and weight, with population as the classification factor. Following these analyses, the Floreana LAB and HAB samples were amalgamated. Discriminant analysis was then used to separate the five breeding groups, with five mensural variables as predictors. Measurements of the mensural variables from 11 birds of the Hawaiian subspecies were compared with those from the combined Galapagos sample, using t-tests. Eggs Eggs were weighed, and their length and breadth measured (2 0. I mm) with vernier calipers. A notional index of their volume was obtained by

9 1991 DARK-RUMPED PETRELS 9 multiplying length by the square of the breadth. One-way ANOVA was applied to lengths, breadths and volumes. In these analyses, data for the three Floreana colonies were pooled, as also were the data for the four San Cristobal colonies. The analyses therefore tested for differences among islands. We used Student's t-tests to compare the dimensions of eggs from Hawaii (summary data extracted from Simons 1985) and Galapagos. Plumage The variable patterns of black and white on the forehead and collar (neck and chest) were scored on a scale of A very white forehead scored 1, and a very black or heavily speckled forehead scored 10 (Fig. 5). A cleansided, all-white neck scored 1, and a neck that was very uneven or had black bars across it scored 10 (Fig. 6). Intermediate patterns were given correspondingly intermediate scores. Although aged and worn black feathers were slightly paler than when new, wear did not affect plumage patterns. Mild body and facial moult occurred throughout the breeding cycle; this moult lessened the intensity of black markings but did not alter the overall pattern. Large chicks also have variable forehead and collar patterns, but chicks were not included in these analyses. Statistical tests similar to those for the morphological measurements were applied to the forehead and collar scores, which we treated as interval-level quantities. Vocalisations Recordings were made at night at breeding colonies on the four islands with a Nagra 111 tape recorder and a Dan Gibson parabolic reflector with omnidirectional microphone. These recordings were made on 31 March 1979 on Floreana, 19 May 1979 on Santiago, 20 June and 10 July 1979 on Santa Cruz, and 4 April 1979 on San Cristobal, that is, during egg laying for all islands except San Cristobal, where EOY chicks were about 7 weeks old and MOY birds had just begun to lay. Sirnons (1985) showed that similar numbers of breeding and non-breeding birds were in the colony during the egg laying period, and we assume that the attendance pattern was similar in Galapagos. Thus we probably recorded calls of both breeding and non-breeding birds. Based on sound alone, calls were first classified into Sweet or Coarse. Wide- and narrow-band sonagrams of the 320 clearest calls then were prepared with a Kay Elemetrics sonagraph (1 10 calls from Santa Cruz, 60 from San Cristobal, 100 from Santiago and 50 from Floreana). Some sonagrams were incomplete because the call faded as the bird flew away from the microphone. For other sonagrams, a number of birds calling at the same time prevented some measurements from being accurately deciphered. The difference in clarity between the sonagrams of Sweet and Coarse calls was outstanding. Unusual calls (highly varied and atypical, or possibly Doppler shifted) were omitted from our analyses. Each call was divided into syllables, and parameters of these syllables were measured (Fig. 7). The number of syllables in both short and long calls varied. Each had either one introductory syllable (called One Of One 000) or two introductory syllables (First Of Two FOT, Second Of Two SOT), before a protracted syllable called a DRONE. A short, small increase in frequency (UPSWEEP) was seen at the end of each DRONE.
 were scored on a scale of 1-10.")
10 FIGURE 5 - Method of scoring forehead patterns, from palest (1) to darkest (10, not shown)
 to darkest (10,")
11 DARK-RUMPED PETRELS 11

12 (a) MALE. wrde band (b) FEMALE wlde band -- FINAL 000 DRONE NOTES <. * * FIGURE 7 - Sonagrams of putative male and female calls showing the parameters measured One or two syllables (FINAL) followed the DRONE in short calls, but this increased to 17 + in long calls. Most Coarse 000, FOT and SOT syllables incorporated a SPLIT, which was a very small period when the frequency increased dramatically, leaving a gap in the low basic frequency, as in Fig. 7(b). No Sweet syllables incorporated a split. Wide-band sonagrams were used to measure 10 frequency (Hz or khz), and narrow-band to measure time (ms). Usually, we could easily locate the harmonic containing the most energy by examining narrow-band sonagrams. For the 000, FOT and SOT syllables, the following measurements were made on both Sweet and Coarse calls: Fly the mean basic frequency (Hz) of the syllable; F2, the mean frequency (khz) of the highest harmonic; TI,
, and narrow-band to measure time (ms).")
13 1991 DARK-RUMPED PETRELS 13 the duration of the syllable; and T2, the interval between this and the next syllable. Harmonics were easily distinguished in the Sweet calls, whereas they were indistinguishable for all but three of the Coarse calls. H1, the number of harmonics, and H2, the harmonic that contained the maximum energy, were measured in the Sweet calls (and rarely, in Coarse calls). In the Coarse calls, F3, the frequency (khz) of the maximum of the split, and T3, the duration of the split, were measured. For the DRONE, five parameters were recorded. These were F1, the mean frequency (Hz) of the syllable; T1, the duration of the syllable; T2, the interval between the DRONE and the first of the FINAL syllables; F4, the increase in frequency (Hz) of the upsweep; and T4, the duration of the upsweep. Six parameters were measured for the group of FINAL syllables. These were F1, the mean basic frequency (Hz); TI, the mean duration of the syllables; T2, the mean interval between the FINAL syllables; HI, the mean number of harmonics in the FINAL syllables; H2, the number of the harmonic showing the maximum energy; and N, the number of FINAL syllables. Altogether, 35 parameters were measured, although at most 23 parameters were relevant to any one Sweet or Coarse call. The Sweet and Coarse calls were compared, for each parameter common to both and without regard to island of origin, by means of frequency tabulations and t-tests. The data were then separated into two groups, comprising 155 Sweet and 165 Coarse calls. All subsequent analyses of vocalisation data were made separately on these two groups. Using t-tests, we compared the mean of each parameter in the 000 syllable with the corresponding parameter in the FOT and SOT syllables, for each island sample and for the overall sample. One purpose of these tests was to determine which parameters (if any) of the 000 syllable matched corresponding parameters in the FOT and SOT syllables. The intention here was to maximise the sample sizes for further multivariate analysis, by pooling calls beginning with the 000 with calls beginning with the FOT. Because the FOT and SOT syllables are components of the same call, we applied paired t-tests to compare corresponding parameters of these syllables. We applied one-way ANOVA to each of 23 parameters measured in the Sweet calls, and to each of the 23 parameters relevant to the Coarse calls, to test for differences among the four island samples. We include calls beginning withh the 000 syllable in these analyses, by identifying the 000 parameters with the equivalent SOT parameters. The many significant results obtained in the ANOVAs for both Sweet and Coarse groups suggested that trial discriminant analyses might separate the four island subpopulations. As many cases were deficient in some parameter measurements, multivariate analysis using all variables as predictors was impractical. For each group, we had to choose a subset of the parameters that would give good discriminantion and at the same time provide enough cases for satisfactory analysis. For the Sweet calls we chose as predictors nine
 of the maximum of the split, and T3, the duration of the split, were measured. For the DRONE, five parameters were recorded.")
14 parameters that had all been recorded in 90 of the 155 calls. These were F1(000/SOT), T1(000/SOT), T2(000/SOT), Fl(DRONE), Tl(DRONE), TZ(DRONE), Fl(FINAL), T2(FINAL) and Hl(F1NAL). For the Coarse calls, we used five parameters in the discriminant analysis: F2(000/SOT), Tl(DRONE), T4(DRONE), F 1 (FINAL) and H2(FINAL). These had all been recorded in only 37 of the 165 Coarse calls. For comparison purposes, we referred to recordings and prepared sonagrams of calls of other members of the P. hasitata superspecies held in the Library of Natural Sounds (LNS) at Cornell University. RESULTS Breeding phenology The time of year at which Dark-rumped Petrels bred in Galapagos varied greatly among islands and within islands (Fig. 4). Laying dates on Santa Cruz averaged 4 July (SE 2.0 days) in 1978 and 5 July (SE 2.4 days) in 1979, and were highly clumped. Laying on Santiago was less synchronised, and the average laying date in 1979 was 7 May (SE 4.0). On Floreana, eggs were laid continually from January to June. However, laying dates were associated with a geographical separation of the breeding colonies. We estimated dates for 22 eggs in a colony on Cerro Pajas (HAB), and for another 21 eggs on Cerro Alerie and Cerro Verde (LAB), which are both lower than Cerro Pajas. The average laying date for Floreana HAB in 1979 was 18 March (SE 4.1 days). For Floreana LAB it was 8 May (SE 4.8 days), significantly later (t = 8.14,41 d.f., P<0.001). Cerro Alerie is only 400 m from Cerro Pajas. F. and J. Cruz (pers. comm.) noted a similar range of laying dates in 1982 and 1983, and that laying on Cerro Verde and Cerro Alerie was about 1 month later than on Cerro Pajas. On San Cristobal estimated laying dates extended from November to August; however, the pattern appeared to be bimodal (Fig. 4). We estimated that eggs were laid from 1 November to 10 March, and from 7 April to 20 June; two eggs (estimated 12 August) were presumed to belong in the second group. Thus there appeared to be two peaks: the average laying date of the first group was 9 January, and of the second group, 1 June In the statistical test for bimodality, the minimum variance sum statistic computed for the observed data was less than those similarly computed for 99.2% of randomly generated uniform distributions. The separation date for which the minimum variance sum occurred for the observed data corresponded to the period 10 March to 7 April. One group of birds breeds at the end of the year (EOY), and the other in the middle of the year (MOY). Differences among the mean sample dates were highly significant (P~0.001). For the six populations identified here, all mean sample dates differed from each other (a posteriori contrast tests, Least Significant Difference, P<0.01), except those for Santiago and Floreana LAB. Morphology and weight Very highly significant (P<0.001) differences among the six Galapagos population samples were indicated by the one-way ANOVAs for the mensural variables bill depth, tarsus length, toe length, wing length and tail length;
 at Cornell University.")
15 1991 DARK-RUMPED PETRELS 15 TABLE 1 - One -way ANOVAs of morphology and plumage measurements indicate significant differences among population samples within Galapagos. The mean, standard deviation and number of birds in each sample are shown. All lengths are in mm. and weight in g. Culmen Length Bill Depth Tarsus Length Toe Length Wing Length Tail Length Volume Index (x 0.001) Weight Santa CNZ - X 33.2 SD 1.2 N 47 - X 11.2 SD 0.6 N 47 - X 39.2 SD 1.3 N 45 x 39.2 SD 2.0 N 45 - X 307 SD 7 N 42 - X 141 SD 5 N 41 - X 160 SD 10 N 40 x 389 SD 40 N 37 Forehead X 6.2 SD 3.0 N 35 Collar - X 5.6 SD 2.8 N 27 San Cristobal Santiago m% ANOVA MOY EOY 7.1 Fj,los= Not Signif. 5.3 F,,,8= Not Signif.

16 and highly significant (P<0.01) differences for culmen length and weight (Table 1). These differences were considerably larger than the differences between the sexes for comparable characters measured by Gifford (in Loornis 1918) for the Molokai population in Hawaii, where males appeared to be slightly larger than females. Birds in Galapagos were first measured throughout the breeding season, and there is no reason to suspect that birds of one sex were encountered more frequently than the other: thus we do not expect any sex-related bias in morphology and weight measurements. TABLE 2 - Summary of comparisons of six mensural variables among population samples, using a posteriori contrast tests following one-way ANOVAs. Values indicate the number of times that the mean for one population sample (shown at left) was significantly less than the corresponding mean for another sample (shown at top) San Cristobal Floreana MOY EOY Santiago LAB HAB Santa Cnu (I)* San Cristobal MOY San Cristobal EOY Santiago 3 3 Horeana LAB 0 The mean bill depth for Santa Cruz was significantly larger than the mean bill depth for San Cristobal MOY A posteriori contrast tests between the sample means for each mensural variable strongly suggested that an ordering could be made based on size. For each of the six variables, we made 15 pair-wise comparisons among the six samples. From these 90 a posterion' contrast tests at the 0.05 probability level, four or five apparently significant differences between means would normally be expected to occur by chance. In our tests, 41 significant differences existed. Table 2 shows the number of times that a sample mean for one population was significantly less than the corresponding sample mean for another population. No significant differences were indicated between the two Floreana samples, and only one significant difference was found among San Cristobal MOY, San Cristobal EOY and Santiago. However, the means of all six variables for the Santa Cruz sample were significantly smaller than those for both Floreana samples, and were often significantly less than those for San Cristobal EOY and Santiago. Similarly, the means of both San Cristobal samples and the Santiago sample were often significantly less than those for the Floreana samples. A posren'ori contrast tests indicated that the San Gistobal MOY sample means for toe and volume were significantly less than those for San Cristobal EOY. As no morphological differences were found between the Floreana LAB and HAB samples, we pooled these before discriminant analysis. Following the results of the ANOVAs, we used a sample of 1 16 cases having no missing

17 1991 DARK-RUMPED PETRELS 17 TABLE 3 - Summary of discriminant analysis using five mensural variables to separate five populations within Galapagos Standardised Coefficients Population Centroids Function 1 2 Function 1 2 Bill Depth Santa Cruz Tarsus Length San Cristobal MOY Toe Length San Cristobal EOY Wing Length Santiago Tail Length Floreana Eigenvalue % of Variance values for the variables bill depth, tarsus, toe, wing length and tail length. Two discriminant functions explained 94.7% of the total between-samples variability (Table 3), and these were used in a subsequent classification of cases. The overall Wilks' lambda for the analysis was 0.427, with a corresponding chi-squared statistic of 93.7 (20 DF, P<0.001). The sample centroids given by the first discriminant function tend to separate the samples into three groups: Santa Cruz and San Cristobal MOY, with low values; San Cristobal EOY and Santiago, moderate values; and Floreana, high values. These coarse groupings can be directly perceived in the sainple means for tarsus and toe, and to a lesser extent for wing length and tail length. Thus the first function relates to the size of the birds. Inspection of the discriminant function coefficients and the pooled withinsamples correlation coefficients indicates that it is these four variables that load most strongly on the first discriminant function. Good separation between the Santa Cruz and San Cristobal MOY samples is given by the second discriminant function, which is related to differences in shape. The dominant contribution to this function is from bill depth, for which the San Cristobal MOY sample has the lowest mean, and for which the Santa Cruz sample has the second highest mean, after Floreana. Further separation of the Santa Cruz sample from the other four is gained by the negatively loaded variable tail length. The mean tail length for Santa Cruz is less than that for all other samples. A sudsequent classification of the 116 birds into sample groups, based on the two discriminant functions, achieved a classification rate of 58% (Table 4). This compares well with the a priori probability of correct classification of 20%. The 15 incorrectly classified birds from Santiago sample were distributed uniformly across the other samples: Santa Cruz (3), San Cristobal MOY (3), San Cristobal EOY (9, and Floreana (4).

18 TABLE 4 - Results of classification of birds into source populations following discriminant analysis Sample Size Santa Cruz 40 San Cristobal MOY 5 San Cristobal EOY 14 Santiago 20 Floreana 37 Total 116 Correctly Classified Percentage Correct TABLE 5 - Student's t-tests of morphology measurements indicate significant differences between Galapagos and Hawaiian population samples. The mean, standard deviation and number of birds in each sample are shown. All lengths are mm Galapagos Hawaii Student's t-test Culmen Length Bill Depth Tarsus I~ngth Toe Length Wing Length Tail Length Volume Index - P < < 0.01 < N.S. < < 0.05 < The results of comparing the Hawaiian and combined Galapagos samples are shown in Table 5. For each measurement, the mean for Hawaii was less than that for Galapagos. The differences were very highly significant (P<0.001) for culmen length, tarsus, wing length and notional volume; highly significant (P<0.01) for bill depth; significant (P(0.05) for tail length; and not significant for toe. For all measurements except toe, the Hawaii mean was less than the smallest of the Galapagos means. Eggs Significant differences (Pc0.05) existed among the mean breadths and volumes of eggs taken from the four islands (Table 6). No significant difference was found among mean lengths. A posteriori contrast tests indicated that eggs from San Cristobal were significantly smaller than those from Santiago and Floreana; eggs from Santa Cruz were significantly smaller those from Floreana. Thus differences in egg size corresponded approximately with the patterns apparent in bird size. Comparisons of the

19 1991 DARK-RUMPED PETRELS 19 lengths and breadths of eggs from Hawaii (Simons 1985) and Galapagos showed significant differences (P<0.001, Table 7). Hawaiian eggs were on average 5% longer and 6% broader than Galapagos eggs, implying an 18% larger volume. TABLE 6 - Resultsof one-way ANOVAs comparing egg dimensions (mm) among Galapagos populations. The mean, standard deviation and number of eggs are shown for each sample Santa Cruz Length - X SD 2.18 N 18 - Breadth X SD 1.37 N 18 - Volume X Index SD 8.3 (X 0.001) N 18 San c,.ktobal Santiago Floreana ANOVA F3,5, = Not Signif. TABLE 7 - Student's t-tests comparing the dimensons (mm) of Galapagos and Hawaiian eggs. The mean, standard deviation and number of eggs are shown for each sample Galapagos Hawaii Student's t-test - - X SD N X SD N t df P Length <0.001 Breadth <0.001 Plumage ANOVA indicated no significant plumage differences among population samples (Table 1); nor was the Pearson correlation coefficient between forehead and collar significant (r = for 83 birds). There seems to be very little variation in the almost white forehead (i.e. score of 1 in Fig. 5) in Dark-rumped Petrels from Hawaii (Henshaw 1902; Baldwin & Hubbard 1949, Fig. 43; Richardson & Woodside 1954, Fig. 3; Pratt et el. 1987; Berger 1983). Researchers at the Bishop Museum in Honolulu reached the same conclusion (Anon 1908). Little information about collar patterns in Hawaiian birds is available.
 of Galapagos and Hawaiian eggs.")
20 20 TOMKINS & MlLNE NOTORNIS 38 TABLE 8 - Results of t-tests comparing parameters common to Sweet (putative male) and Coarse (putative female) calls. The mean, standard deviation and number of calls are shown for each sample 000 FOT SOT DRONE FINAL Sweet Calls - X SD N Student's t-test t df P < < N.S N.S N.S < N.S in < o m < ~0.01 <0.001 N.S. N.S. < < 0.05 N.S. < < < 0.05

Global Seasonal Phase Lag between Solar Heating and Surface Temperature
 Global Seasonal Phase Lag between Solar Heating and Surface Temperature Summer REU Program Professor Tom Witten By Abstract There is a seasonal phase lag between solar heating from the sun and the surface
10. Analysis of Longitudinal Studies Repeat-measures analysis
 Research Methods II 99 10. Analysis of Longitudinal Studies Repeat-measures analysis This chapter builds on the concepts and methods described in Chapters 7 and 8 of Mother and Child Health: Research methods.
DESCRIPTIVE STATISTICS. The purpose of statistics is to condense raw data to make it easier to answer specific questions; test hypotheses.
 DESCRIPTIVE STATISTICS The purpose of statistics is to condense raw data to make it easier to answer specific questions; test hypotheses. DESCRIPTIVE VS. INFERENTIAL STATISTICS Descriptive To organize,
Multivariate Analysis of Ecological Data
 Multivariate Analysis of Ecological Data MICHAEL GREENACRE Professor of Statistics at the Pompeu Fabra University in Barcelona, Spain RAUL PRIMICERIO Associate Professor of Ecology, Evolutionary Biology
Week 4: Standard Error and Confidence Intervals
 Health Sciences M.Sc. Programme Applied Biostatistics Week 4: Standard Error and Confidence Intervals Sampling Most research data come from subjects we think of as samples drawn from a larger population.
Descriptive Statistics
 Descriptive Statistics Primer Descriptive statistics Central tendency Variation Relative position Relationships Calculating descriptive statistics Descriptive Statistics Purpose to describe or summarize
Optiffuser. High-performance, high bandwidth lightweight 1D diffuser.
 Optiffuser High-performance, high bandwidth lightweight 1D diffuser. General product information The Optiffuser comes in packs of four panels. Two positives and two negatives (see page 5) per package.
How To Check For Differences In The One Way Anova
 MINITAB ASSISTANT WHITE PAPER This paper explains the research conducted by Minitab statisticians to develop the methods and data checks used in the Assistant in Minitab 17 Statistical Software. One-Way
Business Statistics. Successful completion of Introductory and/or Intermediate Algebra courses is recommended before taking Business Statistics.
 Business Course Text Bowerman, Bruce L., Richard T. O'Connell, J. B. Orris, and Dawn C. Porter. Essentials of Business, 2nd edition, McGraw-Hill/Irwin, 2008, ISBN: 978-0-07-331988-9. Required Computing
Northumberland Knowledge
 Northumberland Knowledge Know Guide How to Analyse Data - November 2012 - This page has been left blank 2 About this guide The Know Guides are a suite of documents that provide useful information about
II. DISTRIBUTIONS distribution normal distribution. standard scores
 Appendix D Basic Measurement And Statistics The following information was developed by Steven Rothke, PhD, Department of Psychology, Rehabilitation Institute of Chicago (RIC) and expanded by Mary F. Schmidt,
DISCRIMINANT FUNCTION ANALYSIS (DA)
") DISCRIMINANT FUNCTION ANALYSIS (DA) John Poulsen and Aaron French Key words: assumptions, further reading, computations, standardized coefficents, structure matrix, tests of signficance Introduction Discriminant
DISCRIMINANT FUNCTION ANALYSIS (DA) John Poulsen and Aaron French Key words: assumptions, further reading, computations, standardized coefficents, structure matrix, tests of signficance Introduction Discriminant
Additional sources Compilation of sources: http://lrs.ed.uiuc.edu/tseportal/datacollectionmethodologies/jin-tselink/tselink.htm
 Mgt 540 Research Methods Data Analysis 1 Additional sources Compilation of sources: http://lrs.ed.uiuc.edu/tseportal/datacollectionmethodologies/jin-tselink/tselink.htm http://web.utk.edu/~dap/random/order/start.htm
STATISTICA. Clustering Techniques. Case Study: Defining Clusters of Shopping Center Patrons. and
 Clustering Techniques and STATISTICA Case Study: Defining Clusters of Shopping Center Patrons STATISTICA Solutions for Business Intelligence, Data Mining, Quality Control, and Web-based Analytics Table
Simple Linear Regression Inference
 Simple Linear Regression Inference 1 Inference requirements The Normality assumption of the stochastic term e is needed for inference even if it is not a OLS requirement. Therefore we have: Interpretation
IBM SPSS Statistics 20 Part 4: Chi-Square and ANOVA
 CALIFORNIA STATE UNIVERSITY, LOS ANGELES INFORMATION TECHNOLOGY SERVICES IBM SPSS Statistics 20 Part 4: Chi-Square and ANOVA Summer 2013, Version 2.0 Table of Contents Introduction...2 Downloading the
THE SELECTION OF RETURNS FOR AUDIT BY THE IRS. John P. Hiniker, Internal Revenue Service
 THE SELECTION OF RETURNS FOR AUDIT BY THE IRS John P. Hiniker, Internal Revenue Service BACKGROUND The Internal Revenue Service, hereafter referred to as the IRS, is responsible for administering the Internal
NCSS Statistical Software Principal Components Regression. In ordinary least squares, the regression coefficients are estimated using the formula ( )
") Chapter 340 Principal Components Regression Introduction is a technique for analyzing multiple regression data that suffer from multicollinearity. When multicollinearity occurs, least squares estimates
Chapter 340 Principal Components Regression Introduction is a technique for analyzing multiple regression data that suffer from multicollinearity. When multicollinearity occurs, least squares estimates
January 26, 2009 The Faculty Center for Teaching and Learning
 THE BASICS OF DATA MANAGEMENT AND ANALYSIS A USER GUIDE January 26, 2009 The Faculty Center for Teaching and Learning THE BASICS OF DATA MANAGEMENT AND ANALYSIS Table of Contents Table of Contents... i
COMPARISONS OF CUSTOMER LOYALTY: PUBLIC & PRIVATE INSURANCE COMPANIES.
 277 CHAPTER VI COMPARISONS OF CUSTOMER LOYALTY: PUBLIC & PRIVATE INSURANCE COMPANIES. This chapter contains a full discussion of customer loyalty comparisons between private and public insurance companies
(262) SONG-THRUSH NOBLE ROLLIN
 SONG-THRUSH NOBLE ROLLIN") (262) SONG-THRUSH BY NOBLE ROLLIN SONG SOME aspects of Song-Thrush (Turdus e. ericetorwm) song are dealt with below under the following headings: total output for the day, portion of day used, hour to
(262) SONG-THRUSH BY NOBLE ROLLIN SONG SOME aspects of Song-Thrush (Turdus e. ericetorwm) song are dealt with below under the following headings: total output for the day, portion of day used, hour to
February 25, 2015. Scott Fretz, Ph.D ESRC Chairman. Subject: March 31, 2015 ESRC meeting SunEdison Hawaii HCP Post-Intensive Monitoring
 February 25, 2015 Scott Fretz, Ph.D ESRC Chairman Subject: March 31, 2015 ESRC meeting SunEdison Hawaii HCP Post-Intensive Monitoring The following summarizes the results of intensive downed wildlife monitoring
Association Between Variables
 Contents 11 Association Between Variables 767 11.1 Introduction............................ 767 11.1.1 Measure of Association................. 768 11.1.2 Chapter Summary.................... 769 11.2 Chi
WILLOCHRA BASIN GROUNDWATER STATUS REPORT 2009-10
 WILLOCHRA BASIN GROUNDWATER STATUS REPORT 2009-10 SUMMARY 2009-10 The Willochra Basin is situated in the southern Flinders Ranges in the Mid-North of South Australia, approximately 50 km east of Port Augusta
Data Exploration Data Visualization
 Data Exploration Data Visualization What is data exploration? A preliminary exploration of the data to better understand its characteristics. Key motivations of data exploration include Helping to select
4.1 Exploratory Analysis: Once the data is collected and entered, the first question is: "What do the data look like?"
 Data Analysis Plan The appropriate methods of data analysis are determined by your data types and variables of interest, the actual distribution of the variables, and the number of cases. Different analyses
http://www.jstor.org This content downloaded on Tue, 19 Feb 2013 17:28:43 PM All use subject to JSTOR Terms and Conditions
 A Significance Test for Time Series Analysis Author(s): W. Allen Wallis and Geoffrey H. Moore Reviewed work(s): Source: Journal of the American Statistical Association, Vol. 36, No. 215 (Sep., 1941), pp.
www.rmsolutions.net R&M Solutons
 Ahmed Hassouna, MD Professor of cardiovascular surgery, Ain-Shams University, EGYPT. Diploma of medical statistics and clinical trial, Paris 6 university, Paris. 1A- Choose the best answer The duration
STATS8: Introduction to Biostatistics. Data Exploration. Babak Shahbaba Department of Statistics, UCI
 STATS8: Introduction to Biostatistics Data Exploration Babak Shahbaba Department of Statistics, UCI Introduction After clearly defining the scientific problem, selecting a set of representative members
Course Text. Required Computing Software. Course Description. Course Objectives. StraighterLine. Business Statistics
 Course Text Business Statistics Lind, Douglas A., Marchal, William A. and Samuel A. Wathen. Basic Statistics for Business and Economics, 7th edition, McGraw-Hill/Irwin, 2010, ISBN: 9780077384470 [This
IBM SPSS Statistics for Beginners for Windows
 ISS, NEWCASTLE UNIVERSITY IBM SPSS Statistics for Beginners for Windows A Training Manual for Beginners Dr. S. T. Kometa A Training Manual for Beginners Contents 1 Aims and Objectives... 3 1.1 Learning
DATA INTERPRETATION AND STATISTICS
 PholC60 September 001 DATA INTERPRETATION AND STATISTICS Books A easy and systematic introductory text is Essentials of Medical Statistics by Betty Kirkwood, published by Blackwell at about 14. DESCRIPTIVE
CONSERVATION MEASURES FOR ELEONORA S FALCON IN GREECE LAYMAN S REPORT
 CONSERVATION MEASURES FOR ELEONORA S FALCON IN GREECE LAYMAN S REPORT JANUARY 2008 2 Eleonora s Falcon Eleonora s Falcon is one of the most characteristic birds of the Aegean Sea. It is a migrating falcon
Removal fishing to estimate catch probability: preliminary data analysis
 Removal fishing to estimate catch probability: preliminary data analysis Raymond A. Webster Abstract This project examined whether or not removal sampling was a useful technique for estimating catch probability
11. Analysis of Case-control Studies Logistic Regression
 Research methods II 113 11. Analysis of Case-control Studies Logistic Regression This chapter builds upon and further develops the concepts and strategies described in Ch.6 of Mother and Child Health:
GMAC. Curriculum Variation in MBA Programs: Executive MBA Programs Magnified
 GMAC Curriculum Variation in MBA Programs: Executive MBA Programs Magnified Sabeen Sheikh GMAC Research Reports RR-07-06 March 7, 2007 Abstract Business schools differentiate by offering prospective students
Sexual Dimorphism in the Tooth-Crown Diameters of the Deciduous Teeth
 Sexual Dimorphism in the Tooth-Crown Diameters of the Deciduous Teeth THOMAS K. BLACK 111 Museum ofanthropology, The university of Michigan, Ann Arbor, Michigan 48109 KEY WORDS Deciduous dentition criminant
Introduction to Statistics and Quantitative Research Methods
 Introduction to Statistics and Quantitative Research Methods Purpose of Presentation To aid in the understanding of basic statistics, including terminology, common terms, and common statistical methods.
GMAC. Which Programs Have the Highest Validity: Identifying Characteristics that Affect Prediction of Success 1
 GMAC Which Programs Have the Highest Validity: Identifying Characteristics that Affect Prediction of Success 1 Eileen Talento-Miller & Lawrence M. Rudner GMAC Research Reports RR-05-03 August 23, 2005
How To Study The Horned Guan
 Distribution, Density and Population Status of the Horned Guan in México. Fernando González-García y Alejandro Abundis First report (Abril 1, 2005) INTRODUCTION The horned guan (Oreophasis derbianus) is
Recall this chart that showed how most of our course would be organized:
 Chapter 4 One-Way ANOVA Recall this chart that showed how most of our course would be organized: Explanatory Variable(s) Response Variable Methods Categorical Categorical Contingency Tables Categorical
On Correlating Performance Metrics
 On Correlating Performance Metrics Yiping Ding and Chris Thornley BMC Software, Inc. Kenneth Newman BMC Software, Inc. University of Massachusetts, Boston Performance metrics and their measurements are
GREAT BARRIER REEF. Climate Change Action Plan
 GREAT BARRIER REEF Climate Change Action Plan 2007 2011 Climate change is now recognised as the greatest long-term threat to the Great Barrier Reef. The Great Barrier Reef is internationally renowned as
Vulnerability Assessment of New England Streams: Developing a Monitoring Network to Detect Climate Change Effects
 Vulnerability Assessment of New England Streams: Developing a Monitoring Network to Detect Climate Change Effects National Water Quality Monitoring Council 2012 Meeting Britta Bierwagen, National Center
MARCH OF THE PENGUINS
 MARCH OF THE PENGUINS S C I E N C E M O V I E N I G H T The Academic Support Center @ Daytona State College (Science 127 Page 1 of 33) The Academic Support Center @ Daytona State College (Science 127 Page
Name That Adaptation. Background: Link to the Plan Read Section 5 (Whooping Crane Ecology and Biology) in the Management Plan
 in the Management Plan") Summary Students will explore structural, physiological, and behavioral adaptations of whooping cranes. Objectives: Students will be able to: Define an adaptation Describe several whooping crane adaptations
Summary Students will explore structural, physiological, and behavioral adaptations of whooping cranes. Objectives: Students will be able to: Define an adaptation Describe several whooping crane adaptations
Chapter 7. One-way ANOVA
 Chapter 7 One-way ANOVA One-way ANOVA examines equality of population means for a quantitative outcome and a single categorical explanatory variable with any number of levels. The t-test of Chapter 6 looks
Woodland caribou (Rangifer tarandus caribou) in the Far North of Ontario: Background information in support of land use planning
 in the Far North of Ontario: Background information in support of land use planning") Woodland caribou (Rangifer tarandus caribou) in the Far North of Ontario: Background information in support of land use planning The Far North Caribou Project (FNCP) was initiated in 2008 to support land
Woodland caribou (Rangifer tarandus caribou) in the Far North of Ontario: Background information in support of land use planning The Far North Caribou Project (FNCP) was initiated in 2008 to support land
Class 19: Two Way Tables, Conditional Distributions, Chi-Square (Text: Sections 2.5; 9.1)
") Spring 204 Class 9: Two Way Tables, Conditional Distributions, Chi-Square (Text: Sections 2.5; 9.) Big Picture: More than Two Samples In Chapter 7: We looked at quantitative variables and compared the
Spring 204 Class 9: Two Way Tables, Conditional Distributions, Chi-Square (Text: Sections 2.5; 9.) Big Picture: More than Two Samples In Chapter 7: We looked at quantitative variables and compared the
A POPULATION MEAN, CONFIDENCE INTERVALS AND HYPOTHESIS TESTING
 CHAPTER 5. A POPULATION MEAN, CONFIDENCE INTERVALS AND HYPOTHESIS TESTING 5.1 Concepts When a number of animals or plots are exposed to a certain treatment, we usually estimate the effect of the treatment
Activity Report on the Dutch Caribbean Nature Alliance Sea Turtle Satellite Tracking Project 2006
 Activity Report on the Dutch Caribbean Nature Alliance Sea Turtle Satellite Tracking Project 2006 Dr Emma Harrison Sea Turtle Programme Co-ordinator St Eustatius National Parks Foundation Gallows Bay St
Simple linear regression
 Simple linear regression Introduction Simple linear regression is a statistical method for obtaining a formula to predict values of one variable from another where there is a causal relationship between
Introduction to Regression and Data Analysis
 Statlab Workshop Introduction to Regression and Data Analysis with Dan Campbell and Sherlock Campbell October 28, 2008 I. The basics A. Types of variables Your variables may take several forms, and it
CHAPTER 3. The sun and the seasons. Locating the position of the sun
 zenith 90 summer solstice 75 equinox 52 winter solstice 29 altitude angles observer Figure 3.1: Solar noon altitude angles for Melbourne SOUTH winter midday shadow WEST summer midday shadow summer EAST
Crotophaga ani (Smooth-billed Ani)
") Crotophaga ani (Smooth-billed Ani) Family: Cuculidae (Cuckoos and Anis) Order: Cuculiformes (Cuckoos, Anis and Turacos) Class: Aves (Birds) Fig. 1. Smooth-billed ani, Crotophaga ani. [http://www.hoteltinamu.com/wp-content/uploads/crotophaga-ani-garrapatero-piquiliso-smooth-billed-ani-
Crotophaga ani (Smooth-billed Ani) Family: Cuculidae (Cuckoos and Anis) Order: Cuculiformes (Cuckoos, Anis and Turacos) Class: Aves (Birds) Fig. 1. Smooth-billed ani, Crotophaga ani. [http://www.hoteltinamu.com/wp-content/uploads/crotophaga-ani-garrapatero-piquiliso-smooth-billed-ani-
Analysing Questionnaires using Minitab (for SPSS queries contact -) Graham.Currell@uwe.ac.uk
 Graham.Currell@uwe.ac.uk") Analysing Questionnaires using Minitab (for SPSS queries contact -) Graham.Currell@uwe.ac.uk Structure As a starting point it is useful to consider a basic questionnaire as containing three main sections:
Analysing Questionnaires using Minitab (for SPSS queries contact -) Graham.Currell@uwe.ac.uk Structure As a starting point it is useful to consider a basic questionnaire as containing three main sections:
VOLATILITY AND DEVIATION OF DISTRIBUTED SOLAR
 VOLATILITY AND DEVIATION OF DISTRIBUTED SOLAR Andrew Goldstein Yale University 68 High Street New Haven, CT 06511 andrew.goldstein@yale.edu Alexander Thornton Shawn Kerrigan Locus Energy 657 Mission St.
Connected Experience: Evolution and the Galápagos Tortoise
 Connected Experience: Evolution and the Galápagos Tortoise GRADE LEVELS 6 th -8 th ; California Content Standards for 7 th and High School Biology Objectives SUBJECTS Life Sciences DURATION Pre-Visit:
Assessing Measurement System Variation
 Assessing Measurement System Variation Example 1: Fuel Injector Nozzle Diameters Problem A manufacturer of fuel injector nozzles installs a new digital measuring system. Investigators want to determine
Chapter 9. Two-Sample Tests. Effect Sizes and Power Paired t Test Calculation
 Chapter 9 Two-Sample Tests Paired t Test (Correlated Groups t Test) Effect Sizes and Power Paired t Test Calculation Summary Independent t Test Chapter 9 Homework Power and Two-Sample Tests: Paired Versus
Carnivore, omnivore or herbivore?
 Carnivore, omnivore or herbivore? Physical adaptations of the giant panda Student booklet (ST) October 2010 panda_st_student.doc Context The Giant Panda is a species that is faced with extinction. It is
http://rcin.org.pl An analysis of the recovery distribution based on finding probabilities Wojciech K a n ia and Przemysław B usse
 ACTA ORNITHOLOGICA Vol. 23 (1987) No. 1 Wojciech K a n ia and Przemysław B usse An analysis of the recovery distribution based on finding probabilities Kania W., Busse P. 1987. An analysis of the recovery
Introduction to Analysis of Variance (ANOVA) Limitations of the t-test
 Limitations of the t-test") Introduction to Analysis of Variance (ANOVA) The Structural Model, The Summary Table, and the One- Way ANOVA Limitations of the t-test Although the t-test is commonly used, it has limitations Can only
Introduction to Analysis of Variance (ANOVA) The Structural Model, The Summary Table, and the One- Way ANOVA Limitations of the t-test Although the t-test is commonly used, it has limitations Can only
2.3 Spatial Resolution, Pixel Size, and Scale
 Section 2.3 Spatial Resolution, Pixel Size, and Scale Page 39 2.3 Spatial Resolution, Pixel Size, and Scale For some remote sensing instruments, the distance between the target being imaged and the platform,
Woodcock Ringing Guide Owen Williams
 Woodcock Ringing Guide Owen Williams All bird ringing in the UK is controlled by the British Trust for Ornithology. Ringing is only allowed by those granted a permit by the BTO or who are undergoing training
American Association for Laboratory Accreditation
 Page 1 of 12 The examples provided are intended to demonstrate ways to implement the A2LA policies for the estimation of measurement uncertainty for methods that use counting for determining the number
Local outlier detection in data forensics: data mining approach to flag unusual schools
 Local outlier detection in data forensics: data mining approach to flag unusual schools Mayuko Simon Data Recognition Corporation Paper presented at the 2012 Conference on Statistical Detection of Potential
Attitudes Toward Science of Students Enrolled in Introductory Level Science Courses at UW-La Crosse
 Attitudes Toward Science of Students Enrolled in Introductory Level Science Courses at UW-La Crosse Dana E. Craker Faculty Sponsor: Abdulaziz Elfessi, Department of Mathematics ABSTRACT Nearly fifty percent
Introduction to Principal Components and FactorAnalysis
 Introduction to Principal Components and FactorAnalysis Multivariate Analysis often starts out with data involving a substantial number of correlated variables. Principal Component Analysis (PCA) is a
 There are three kinds of people in the world those who are good at math and those who are not. PSY 511: Advanced Statistics for Psychological and Behavioral Research 1 Positive Views The record of a month
What roundabout design provides the highest possible safety?
 What roundabout design provides the highest possible safety? In Sweden, as in several other countries, the number of roundabouts is on the increase. According to a study recently carried out by the VTI,
Biology 1406 - Notes for exam 5 - Population genetics Ch 13, 14, 15
 Biology 1406 - Notes for exam 5 - Population genetics Ch 13, 14, 15 Species - group of individuals that are capable of interbreeding and producing fertile offspring; genetically similar 13.7, 14.2 Population
MULTIPLE CHOICE. Choose the one alternative that best completes the statement or answers the question.
 Final Exam Review MULTIPLE CHOICE. Choose the one alternative that best completes the statement or answers the question. 1) A researcher for an airline interviews all of the passengers on five randomly
The Influence of Session Length On Student Success
 The Influence of Session Length On Student Success Ruth Logan Research Associate Santa Monica College Peter Geltner, Ph.D. Dean of Institutional Research Santa Monica College Abstract Do compressed courses
Columbia River Project Water Use Plan. Monitoring Program Terms of Reference LOWER COLUMBIA RIVER FISH MANAGEMENT PLAN
 Columbia River Project Water Use Plan LOWER COLUMBIA RIVER FISH MANAGEMENT PLAN CLBMON-45 Lower Columbia River Fish Indexing Surveys 31 August 2007 1.0 OVERVIEW LOWER COLUMBIA RIVER FISH MANAGEMENT PLAN
Owls. Choose words from the list at the end of the page to fill in the blank spaces.
 Owls Choose words from the list at the end of the page to fill in the blank spaces. Owls are _ of prey. A bird of prey is one that catches its food in its Owls hunt for their at night. A bird that hunts
2013 MBA Jump Start Program. Statistics Module Part 3
 2013 MBA Jump Start Program Module 1: Statistics Thomas Gilbert Part 3 Statistics Module Part 3 Hypothesis Testing (Inference) Regressions 2 1 Making an Investment Decision A researcher in your firm just
Geography affects climate.
 KEY CONCEPT Climate is a long-term weather pattern. BEFORE, you learned The Sun s energy heats Earth s surface unevenly The atmosphere s temperature changes with altitude Oceans affect wind flow NOW, you
Chapter 5: Analysis of The National Education Longitudinal Study (NELS:88)
") Chapter 5: Analysis of The National Education Longitudinal Study (NELS:88) Introduction The National Educational Longitudinal Survey (NELS:88) followed students from 8 th grade in 1988 to 10 th grade in
Chapter 5: Analysis of The National Education Longitudinal Study (NELS:88) Introduction The National Educational Longitudinal Survey (NELS:88) followed students from 8 th grade in 1988 to 10 th grade in
Measuring the response of students to assessment: the Assessment Experience Questionnaire
 11 th Improving Student Learning Symposium, 2003 Measuring the response of students to assessment: the Assessment Experience Questionnaire Graham Gibbs and Claire Simpson, Open University Abstract A review
BASIC STATISTICAL METHODS FOR GENOMIC DATA ANALYSIS
 BASIC STATISTICAL METHODS FOR GENOMIC DATA ANALYSIS SEEMA JAGGI Indian Agricultural Statistics Research Institute Library Avenue, New Delhi-110 012 seema@iasri.res.in Genomics A genome is an organism s
Multivariate Analysis of Variance. The general purpose of multivariate analysis of variance (MANOVA) is to determine
 is to determine") 2 - Manova 4.3.05 25 Multivariate Analysis of Variance What Multivariate Analysis of Variance is The general purpose of multivariate analysis of variance (MANOVA) is to determine whether multiple levels
2 - Manova 4.3.05 25 Multivariate Analysis of Variance What Multivariate Analysis of Variance is The general purpose of multivariate analysis of variance (MANOVA) is to determine whether multiple levels
Plate Tectonics. Introduction. Boundaries between crustal plates
 Plate Tectonics KEY WORDS: continental drift, seafloor spreading, plate tectonics, mid ocean ridge (MOR) system, spreading center, rise, divergent plate boundary, subduction zone, convergent plate boundary,
CLOUD COVER IMPACT ON PHOTOVOLTAIC POWER PRODUCTION IN SOUTH AFRICA
 CLOUD COVER IMPACT ON PHOTOVOLTAIC POWER PRODUCTION IN SOUTH AFRICA Marcel Suri 1, Tomas Cebecauer 1, Artur Skoczek 1, Ronald Marais 2, Crescent Mushwana 2, Josh Reinecke 3 and Riaan Meyer 4 1 GeoModel
Basic Concepts in Research and Data Analysis
 Basic Concepts in Research and Data Analysis Introduction: A Common Language for Researchers...2 Steps to Follow When Conducting Research...3 The Research Question... 3 The Hypothesis... 4 Defining the
Statistics Review PSY379
 Statistics Review PSY379 Basic concepts Measurement scales Populations vs. samples Continuous vs. discrete variable Independent vs. dependent variable Descriptive vs. inferential stats Common analyses
Data Analysis Tools. Tools for Summarizing Data
 Data Analysis Tools This section of the notes is meant to introduce you to many of the tools that are provided by Excel under the Tools/Data Analysis menu item. If your computer does not have that tool
A STUDY OF WHETHER HAVING A PROFESSIONAL STAFF WITH ADVANCED DEGREES INCREASES STUDENT ACHIEVEMENT MEGAN M. MOSSER. Submitted to
 Advanced Degrees and Student Achievement-1 Running Head: Advanced Degrees and Student Achievement A STUDY OF WHETHER HAVING A PROFESSIONAL STAFF WITH ADVANCED DEGREES INCREASES STUDENT ACHIEVEMENT By MEGAN
UNDERSTANDING THE TWO-WAY ANOVA
 UNDERSTANDING THE e have seen how the one-way ANOVA can be used to compare two or more sample means in studies involving a single independent variable. This can be extended to two independent variables
The correlation coefficient
 The correlation coefficient Clinical Biostatistics The correlation coefficient Martin Bland Correlation coefficients are used to measure the of the relationship or association between two quantitative
Other forms of ANOVA
 Other forms of ANOVA Pierre Legendre, Université de Montréal August 009 1 - Introduction: different forms of analysis of variance 1. One-way or single classification ANOVA (previous lecture) Equal or unequal
This article presents a simple framework
 Net flows in the U.S. labor market, 990 200 Except in the most recent recession, net flows were from unemployment to employment (even in previous recessions), from employment to not in the labor force
Lesson 3: Fish Life Cycle
 Lesson 3: Fish Life Cycle Activity: Diagram fish life cycle. Grade level: 4-8 Subjects: Science, social studies Setting: Classroom Duration: 50 minutes Key Terms: Fry, life cycle, life history, spawn,
Sexual selection in night singing insects Harsha Kumar, Satish Bodakuntla, Harpreet Singh Kalsi, Akilandeswari B, Rohit Krishnan H.
 Sexual selection in night singing insects Harsha Kumar, Satish Bodakuntla, Harpreet Singh Kalsi, Akilandeswari B, Rohit Krishnan H. IISER PUNE Animal behavior report 2 27 March 14 1 Night singing insects
An analysis of the 2003 HEFCE national student survey pilot data.
 An analysis of the 2003 HEFCE national student survey pilot data. by Harvey Goldstein Institute of Education, University of London h.goldstein@ioe.ac.uk Abstract The summary report produced from the first
Interactive comment on Total cloud cover from satellite observations and climate models by P. Probst et al.
 Interactive comment on Total cloud cover from satellite observations and climate models by P. Probst et al. Anonymous Referee #1 (Received and published: 20 October 2010) The paper compares CMIP3 model
THE ECOSYSTEM - Biomes
 Biomes The Ecosystem - Biomes Side 2 THE ECOSYSTEM - Biomes By the end of this topic you should be able to:- SYLLABUS STATEMENT ASSESSMENT STATEMENT CHECK NOTES 2.4 BIOMES 2.4.1 Define the term biome.
EFFECTS OF AUDITORY FEEDBACK ON MULTITAP TEXT INPUT USING STANDARD TELEPHONE KEYPAD
 EFFECTS OF AUDITORY FEEDBACK ON MULTITAP TEXT INPUT USING STANDARD TELEPHONE KEYPAD Sami Ronkainen Nokia Mobile Phones User Centric Technologies Laboratory P.O.Box 50, FIN-90571 Oulu, Finland sami.ronkainen@nokia.com
REVIEW UNIT 10: ECOLOGY SAMPLE QUESTIONS
 Period Date REVIEW UNIT 10: ECOLOGY SAMPLE QUESTIONS A. Sample Multiple Choice Questions Complete the multiple choice questions to review this unit. 1. All of the following are density-dependent factors