EDUCATION: Springboard to Employment and Higher Earnings. Introduction. What you should know about this brief. A 2010 Census Analytical Brief
|
|
|
- Primrose Strickland
- 7 years ago
- Views:
Transcription
1
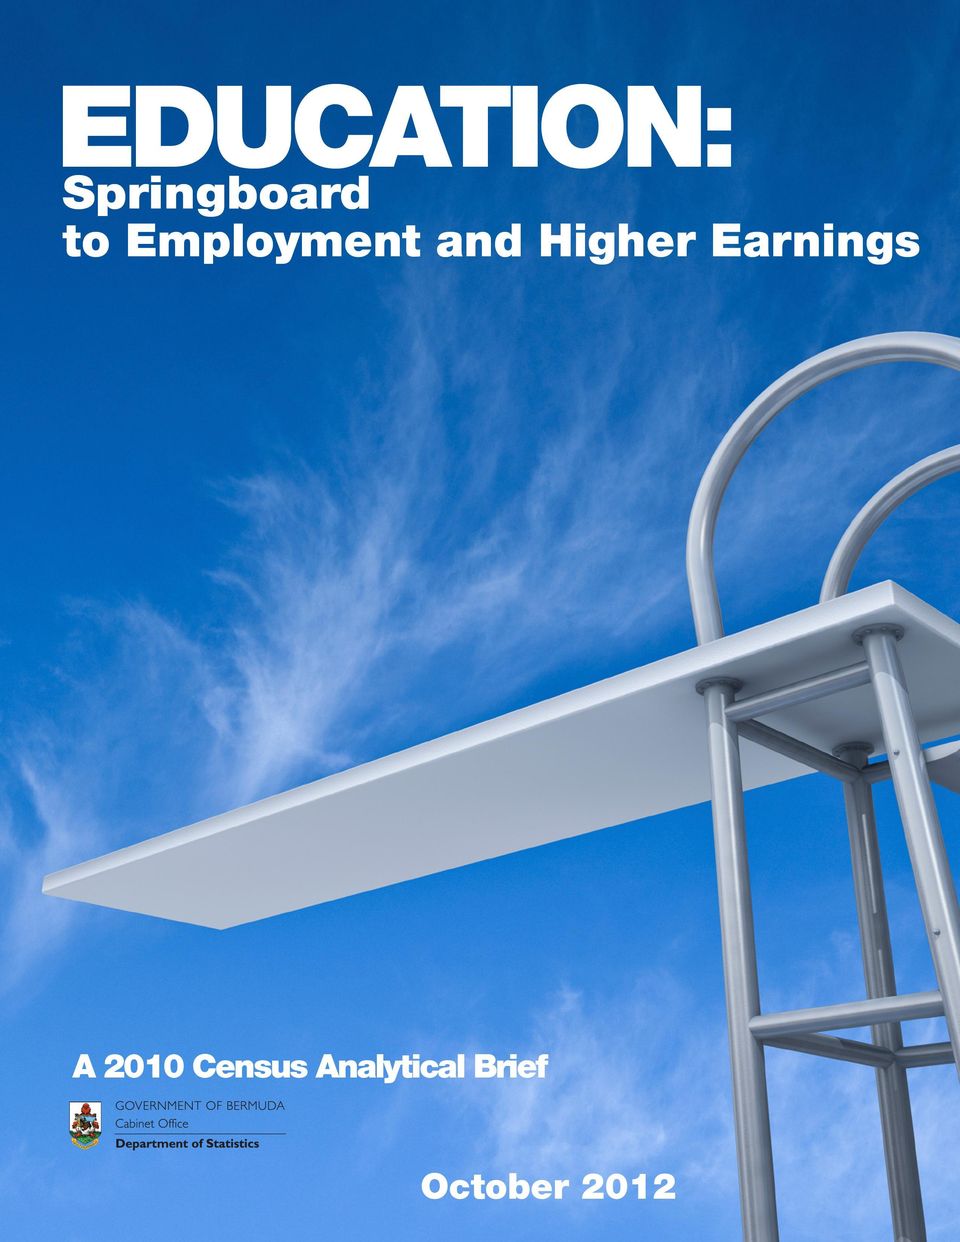
2 EDUCATION: Springboard to Employment and Higher Earnings A 200 Census Analytical Brief Introduction Between July and August 202, more than 0,000 athletes from 204 countries participated in over 300 events at the 30 th Olympiad in London, England. Bermuda sent eight athletes to compete in the following events: equestrianism, long jump, sailing, swimming and triathlon. After years of training, commitment and sacrifices, these athletes were able to participate on the world stage. For many of the Olympic medalists, returning home has provided a heroes welcome and the opening of doors of opportunities with social, economic and financial benefits. Using an analogy, success gained at the Olympics by athletes is like attaining academic certificates after years of dedication and hard work. Similarly, higher academic qualifications can also be a springboard to more employment options and higher earnings. The level of educational attainment is one of the most important factors influencing socioeconomic well-being. One s level of education can influence the types of occupations available to him/her and ultimately the amount of income that could potentially be earned. Although Bermuda s residents have made progress in educational attainment, significant differences remain as it relates to geographical location, age, race, and gender, for example. The 200 Census counted 38,277 Bermuda residents aged between 25 and 64 years, up from 36,726 in 2000 (See below What you should know about this brief ). This brief presents the findings of the census questions that relate to the highest level of academic qualifications/educational attainment and title of degree across selected demographic characteristics of this particular population group. In the Bermuda 200 Census, educational attainment was gathered for the population aged 6 years and over. However, many young persons aged 6 to 24 years are still enrolled in an academic institution. Therefore, their current level of education would understate the qualifications that they would bring to the labour force. Consequently, this analytical brief on education focuses primarily on the academic attainment of the population aged 25 to 64 years. From a life cycle point of view, this age group is old enough to obtain a university degree and young enough to work. What you should know about this brief At the end of Bermuda s 200 Population and Housing Census data collection period, there were roughly 4,400 outstanding households for which data had not been obtained. To address this undercount, and in alignment with statistical best practices, administrative data sources were utilized to impute important demographic data items, such as age, sex, date of birth, Bermudian status, employment and race. Therefore, census records for,06 households comprising 2,55 persons were imputed for these demographic variables. 2

3 This imputation reduced the undercount of outstanding households and resulted in the Department of Statistics successfully obtaining a rate of 96% coverage of households during the 200 Census. However, education data was not imputed and therefore the education tables within this brief will show non-response for the,609 persons 25 to 64 years of age for whom data was not collected. The findings in this report are based on self-reported data collected in the 200 Population and Housing Census. Occasionally, comparisons are made with the 2000 Census data. Also, note that professional degrees/designations such as Certified Public Accountant are excluded from the analysis of academic qualifications. Note: Percentages may not add to 00% due to rounding. For supporting data referenced in this analytical brief but not displayed in a table or graph, please contact the Social Division at the Department of Statistics. 200 Census highlights for the population aged 25 to 64 years In 200, 5% of Bermuda s population 25 to 64 years of age had no academic certificates. Bermuda ranked 20 th amongst the 34 OECD countries as 3% of 25 to 64 year olds had achieved a university degree. The total number of persons with a university degree increased by 29% from 2000 to 200. In 200, 45% of the white population 25 to 64 years had a university degree compared to 22% of the black population. In 200, 47% of non-bermudians had completed a university degree compared to 25% of Bermudians. As educational attainment increases, median income from main job rises. Persons who possessed a university degree and worked as senior officials or managers earned the highest median income of $7,866. Of the persons that became parents while a teenager, 29% had no academic certificates and were employed primarily as clerks. The unemployment rate for persons with no academic qualifications reached 6.7% in 200. Profile of Bermuda s level of educational attainment Nearly one in every six persons had no academic certificates Figure shows the geographic distribution of the 5,683 persons aged 25 to 64 years who had not received any formal academic certificates/ 3 qualifications across Bermuda s 245 census districts. The map shows that the largest concentrations of persons with no academic qualifications were in north-eastern City of Hamilton and eastern Pembroke.

4 Across Bermuda, almost one in six people (5%) had no academic qualifications in 200 down from 22% in 2000 (Table ). At the parish level, Pembroke and St. George s had the greatest proportion of persons without any academic qualifications at 20% in 200 whereas Paget had the least at 0%. Figure Population Aged Years with No Academic Certificates by Census District, 200 Town of St. George Legend dot = person with no academic certificates Note: dot placement is random within each census district. ST. GEORGE S HAMILTON SANDYS PEMBROKE DEVONSHIRE HAMILTON SMITH'S City of Hamilton PAGET N WARWICK SOUTHAMPTON Source: Population and Housing Census, 200 More than half of adults had completed post-secondary education The 200 Census data shows that for the first time a majority of the prime working-age population (25 to 64 years) had post-secondary/tertiary certificates. Their share rose marginally from 50% in 2000 to 52% in 200 (Table ) and stood at 9,7 persons by 200. Between 2000 and 4 200, there were variations across the levels of post-secondary qualifications. For example, the proportion of the population aged 25 to 64 with at least a bachelor s degree climbed from 24% in 2000 to 3% by 200. The share of diploma/ associate degree holders also increased during the decade from 8% to 0%. In contrast, the proportion of technical/vocational certificate holders dropped from 8% in 2000 to % in 200.

5 Table Population aged years by highest academic qualification, Bermudian status and sex, 200 and Highest academic qualification Number Total Bermudian % % % % % % Non- Bermudian Number Total Bermudian Non- Bermudian Percentage change 5 Both sexes Total 38, , Non-tertiary 6, , None 5, , High school certificate 0, , Tertiary 9, , College degree (2 years) 7, , Technical/ vocational certificate 4, , Diploma/ associate degree 3, , University degree (4 years), , Bachelor s degree 8, , Master s degree 2, , Doctorate degree ** +42 Other/ Not stated, Total 7, , ** Non-tertiary 8, , None 3, , High school certificate 5, , Tertiary 8, , College degree (2 years) 3, , Technical/ vocational certificate 2, , Diploma/ associate degree, , University degree (4 years) 4, , Bachelor s degree 3, , Master s degree, Doctorate degree Other/ Not stated Men Women Total 8, , ** Non-tertiary 7, , None 2, , High school certificate 5, , Tertiary 0, , College degree (2 years) 4, , Technical/ vocational certificate 2,07 3, Diploma/ associate degree 2, , University degree (4 years) 6, , Bachelor s degree 4, , Master s degree degree, , Doctorate degree ** ** +77 Other/ Not stated Total includes,609 persons for which there is no data. Source: Population and Housing Censuses, 2000 and The denominator for the percentage distribution is 36,668 (38,277 -,609). ** Less than %
,3 3 25 47 8,787 24 8 40 +29 Bachelor s degree 8,7 22 7 35 6,509 8 3 30 +26 Master s degree 2,860 8 7 0 2,08 6 4 9 +37")
6 Greater proportion of women had university degrees The total number of university degree holders increased by 29% over the decade 2000 to 200 (Table ). The proportion of men and women with university degrees was equal in 2000 at 24%. However, by 200, women had the higher proportion with degrees (34%) compared to men (27%). 25 to 64 years were degree holders compared to 52% of non-bermudian women. At the opposite end of the academic ladder, non-bermudian men were twice as likely (6%) to have no academic certificates compared to their female colleagues (8%). Whites are twice as likely to have a university degree than blacks Bermudians trail non-bermudians in proportion with university degrees In 200, the proportion of the Bermudian population aged 25 to 64 years without a high school certificate (7%) was 5 percentage points higher than the proportion of the non- Bermudian population (2%) (Table ). In contrast, nearly half or 47% of non-bermudians had completed a university degree compared to 25% of Bermudians. The higher percentage of non-bermudian degree holders reflects directly the recruitment of workers from overseas to fill positions at the professional, senior official and managerial levels. Although non-bermudians were nearly twice as likely to have a university degree as Bermudians in 200, Bermudians made equal proportional gains (7 percentage points) as non-bermudians from 2000 to 200. Also, the proportion of Bermudians with no academic certificates decreased by 8 percentage points compared to one percentage point for non-bermudians over the decade. Of the Bermudian population, 22% of men aged 25 to 64 years were without a high school certificate in comparison to only 3% of Bermudian women in the same age group (Table ). On the other hand, 2% of Bermudian men had attained a university degree while 28% of their female counterparts had acquired the same certification. In contrast, 42% of non-bermudian men aged 6 In 200, 8% of the black population 25 to 64 years had no academic qualifications (Figure 2). This was 6 percentage points higher than whites and 2 percentage points higher than persons of mixed and other races. Almost half, or 45%, of the white population had a university degree compared with less than one-quarter or 22% of blacks and a third of persons of mixed and other races. Between 2000 and 200, each race increased their proportion of having attained at the degree level and decreased their proportion at the no academic certificate level. An analysis by race and Bermudian status shows that in 200 only 36% of white Bermudians had degrees compared to 55% of white non- Bermudians. Similarly, black Bermudians with a degree (20%) trailed black non-bermudian degree holders (32%). Persons 25 to 34 years most likely to have university degrees As age increases, the proportion of persons holding a university degree declines. Figure 3 shows that the population 25 to 34 years was twice as likely to have a university degree than persons 55 to 64 years. Additionally, 0% of persons 25 to 34 years had no academic qualifications compared with 26% of persons 55 to 64 years. Also, note that the academic profiles of 25 to 34
 to have no academic certificates compared to their female colleagues (8%).")
7 year olds and 35 to 44 year olds are similar, with the younger age group slightly more likely to have a university degree. Close to 30% of persons aged 25 to 64 years had a high school certificate. This finding was consistent throughout the ten-year age groups. The percentage of young men 25 to 34 years without any qualifications was more than three times (6%) the young women without qualifications (5%). However, irrespective of the age group, a higher proportion of women had attained a college or university degree in 200 than men. The most significant difference in educational attainment occurred in the 25 to 34 age group where nearly half of all women (48%) had a university degree compared to close to a third (32%) of men. Figure 2 Figure 3 Percentage Population aged years by highest academic qualification and age group, years years years years None High school certificate Tech./voc. certificate Diploma/associate degree University degree Excludes other/ not stated qualifications. Source: Population and Housing Census, 200 7

8 Bermuda ranks 20 th amongst OECD countries with 3% holding a university degree The Organization for Economic Co-operation and Development (OECD) comprises 34 member countries that span the globe. The OECD provides an annual comparison of academic achievement for its member countries. In 200, Bermuda tied with the OECD average of 3% of the population aged 25 to 64 years with a university degree. Therefore, as seen in Table 2 below, this placed Bermuda twentieth when compared with the OECD average of 3%. Note that the figures for all OECD countries and Bermuda include the foreign-born population. However, when only the Bermudian population is analysed, the proportion of Bermuda s population aged 25 to 64 years that held a university degree slipped to 25%. Earnings Persons with high level of education earn more from main job The 200 Census data revealed that persons with higher levels of education earned more income from their main job in the form of salaries, wages, tips, bonuses, commissions and net earnings from self employment. Table 3 displays the median annual income persons earned from their main Table 2 Proportion of the population aged 25 to 64 with a university academic degree for the top 0 OECD countries and Bermuda University degree Rank Country Percentage. Canada 5 2. Israel Japan United States of America New Zealand 4 6. Korea Australia Finland United Kingdom Norway Ireland Bermuda 3 Note: The OECD definition of tertiary education does not include trade or vocational certification. Source: Organization for Economic Co-operation and Development (OECD). Education at a Glance 202, [cited October, 202].(see table A.3a) 8

9 job for full-time (35 hours or more per week) workers aged 25 to 64 years. In 200, persons with no academic qualifications, a high school certificate or a technical/vocational certificate all earned less than half as much as doctorate degree holders at 40%, 46% and 49%, respectively. Furthermore, persons with diploma/ associate degrees earned nearly three quarters or 74% as much as persons with bachelor s degrees, two thirds or 65% as much as master s degree holders and 54% as much as doctorate degree holders. These figures indicate that there is a significant increase in earning power for persons who obtain a university degree. Demographic analysis by income from main job Highest earnings for older persons with doctorate degrees Persons in each age group reported higher annual incomes as their educational attainment increased. The data revealed that persons with doctorate degrees earned higher incomes. In contrast, persons with no academic qualifications earned the least across every age group (Table 3). Table 3 Working population aged years by median annual income from main job, demographic characteristics and highest academic qualification, 200 Highest academic qualification Demographic characteristics Total None High school certificate Tech./ voc. certificate Diploma/ associate degree Bachelor s degree Master s degree Doctorate degree Other/ not stated Total $64,960 $47,356 $55,367 $58,689 $65,64 $87,522 $00,686 $9,647 $7,24 Age group 25 to 34 years old $6,053 $46,000 $49,275 $50,88 $58,867 $77,536 $89,700 $00,000 $64, to 44 years old $69,529 $48,667 $57,066 $57,424 $68,087 $93,086 $02,932 $0,82 $80,8 45 to 54 years old $66,664 $48,842 $57,528 $63,405 $67,306 $95,292 $06,30 $24,286 $72, to 64 years old $60,560 $45,790 $57,325 $60,764 $62,704 $95,753 $03,435 $46,400 $7,57 Sex Men $65,238 $49,92 $56,390 $59,84 $66,76 $99,930 $22,02 $40,400 $72,36 Women $64,697 $4,762 $54,326 $57,345 $64,203 $80,763 $93,578 $09,09 $70,4 Race Black $60,005 $45,76 $53,872 $57,366 $63,822 $80,640 $95,333 $4,36 $60,667 White $82,205 $54,560 $67,583 $70,98 $72,835 $05,753 $5,09 $36,000 $9,385 Mixed and other $54,42 $42,726 $47,34 $45,628 $60,546 $70,632 $95,86 $8,500 $57,000 Bermudian status Bermudian $63,05 $47,862 $55,889 $60,94 $64,944 $84,752 $96,746 $07,077 $66,327 Non-Bermudian $70,762 $46,22 $52,52 $55,330 $66,500 $9,623 $3,243 $50,857 $79,029 For persons working full time (i.e. 35 hours or more per week). Source: Population and Housing Census, 200 9

10 Both the lowest and highest earnings, on average, were reported in the 55 to 64 year age group. Doctorate degree holders in the 55 to 64 year age group earned more than three times the amount of persons in the same age group with no academic qualifications. Interestingly, persons 55 to 64 years of age with high school certificates, technical/vocational certificates, bachelor s degrees and master s degrees all earned more than persons aged 25 to 34 years who had attained one educational level higher. For example, master s degree holders years earn more than doctorate degree holders 25 to 34 years. This trend does not hold true for persons aged 55 to 64 years with no academic qualifications and diploma/associate degrees. The former could possibly be explained by persons being compensated more for promotion based on experience than educational attainment. The latter may reflect that it is educational attainment rather than experience that pays more. Earnings gap narrows between men and women In both 200 and 2000, men earned more from their main job than women at every level of educational attainment (Table 3). The difference in income declined significantly from a 3% gap in 2000 to % in 200. This can be attributed to the fact that in 200, men with no university degrees earned 7% more than women with no university degrees, compared to 8% more in However, men with university degrees earned 28% more than women with university degrees in 200, an increase of percentage point from Women with no academic qualifications earned the lowest and male doctorate degree holders earned the most at more than three times the amount. Male university degree holders earned 08% more than male non-university degree holders. The difference was less prominent for women, as university degree holders earned 74% more than those without a university degree. 0 Earnings gap widens between whites and blacks The earnings gap between whites and blacks widened during the intercensal period. Whites earned 3% more in 2000 compared to 37% more in 200. This is largely a result of a 9 percentage point increase in earnings for white university degree holders over black university degree holders from 2000 to 200. The difference in income level was less significant between nonuniversity degree holders, as whites earned 4 percentage points more than blacks over the same time period. White doctorate degree holders earned the most from their main job and those with no academic qualifications of mixed and other races earned the least. In total, persons of mixed and other races earned two-thirds as much as whites, while blacks earned nearly three-quarters as much as whites. Whites with an academic qualification one level less than blacks and persons of mixed and other races earned more, on average, in every instance with the exception of at the bachelor degree level for blacks and the doctorate degree level for mixed and other races. Whites, blacks and persons of mixed and other races with a university degree earned 75%, 79% and 94% more respectively than persons without a university degree. Bermudians earn more at lower educational levels Bermudians who possessed lower academic qualifications or none at all earned more from their main job, on average, than non-bermudians (Table 3). In contrast, non-bermudians who had attained a diploma/associate degree or higher qualification earned more. The earnings gap narrowed slightly over the intercensal period, as non-bermudians earned 2% more than Bermudians in 200 compared to 3% in Non-Bermudian university degree holders earned 20 percentage points more than Bermudian university degree holders in 200. However, at the non-university degree level, the level of earnings

11 for Bermudians compared with non-bermudians increased by only 3 percentage points. Bermudian university degree holders earned 68% more than Bermudian non-university degree holders, demonstrating again the additional earning power of possessing a university degree. However, non-bermudian university degree holders fared even better, earning 5% more than their non-bermudian counterparts who did not have a university degree. University graduates earn more in white-collar occupations The data thus far in this brief has demonstrated that average income from main job increases as a person s level of education increases when analyzing the data by age, sex, race or Bermudian status. However, a higher level of educational attainment does not always result in a higher median income for certain occupational groups. Table 4 shows that the median annual income for university degree holders was higher in every instance than persons with lower educational qualifications in white-collar occupations such as senior officials and managers, professionals, technicians/associate professionals and clerks. However, in some instances, persons with lower educational qualifications earned more than university degree holders in blue-collar occupations such as service and sales workers, skilled agricultural and fishery workers, craft and related trades workers, and plant, machinery operators and assemblers. White-collar workers with university degrees received higher earnings than those with lower levels of education. However, blue-collar workers with university degrees were not the highest earners; some workers with lower levels of education earned more, on average. This data perhaps reflects that there are non-university degree holders compensated based on skills and experience; and, there are university degree holders underemployed due to the economic downturn, thus, earning less. Overall, Table 4 shows that persons with a university degree working at the senior official or managerial level earned the highest at $7,866. On the other hand, service and sales workers with no academic qualifications earned the least at $36,703. Regardless of educational attainment, the median annual income for persons 25 to 64 years old was $64,960.

12 Table 4 Working population aged years by median annual income from main job, occupational group and highest academic qualification, 200 Occupational group 2 Total None Highest academic qualification High Tech./ voc. school certificate certificate Diploma/ University Other/ not associate degree stated degree Total $64,960 $47,356 $55,367 $58,689 $65,64 $87,522 $7,24 Senior officials and managers $87,864 $62,82 $70,825 $78,304 $79,736 $7,866 $9,500 Professionals $85,284 $54,000 $66,923 $69,39 $68,848 $90,22 $89,760 Technicians and associate professionals $78,20 $62,857 $70,730 $68,94 $7,833 $04,069 $78,600 Clerks $56,424 $46,57 $54,023 $58,269 $60,506 $67,34 $55,909 Service workers and shop/ market sales workers Skilled agricultural and fishery workers $40,94 $36,703 $4,303 $43,39 $46,966 $4,089 $37,74 $45,5 $44,302 $44,943 $46,500 $55,000 $48,000 $5,000 Craft and related trades workers $54,256 $52,925 $52,836 $57,000 $59,063 $55,05 $54,600 Plant and machine operators and assemblers $47,666 $44,673 $49,62 $48,968 $49,765 $43,500 $5,000 Elementary occupations $46,336 $45,088 $46,339 $49,000 * * * For persons working full time (i.e. 35 hours or more per week). Source: Population and Housing Census, Excludes Armed forces category with 2 persons. * Represents less than 5 observations. Persons with law degrees earn higher income levels from main job In 200, the most commonly selected fields of study reported by persons with associates, bachelor s, master s and doctorate degrees were business (24%), accounting (9%), and education (9%). Figure 4 shows the median income for the top 0 most studied degree titles. According to the 200 Census data, persons who studied law earned the most from their main job ($7,480). The median income from one s main job for the population aged years with a degree was $87,80. Persons with degrees in information technology and education received earnings below the median income level. Apart from the top 0 most studied fields, technology degree holders had the lowest median earnings at $53,200 followed by art degree holders at $67,846. Note that degree holders may not be employed in their field of study; however, it does give an indication as to which types of degrees lead to higher earnings from the job chosen by the degree holder. 2

13 Figure 4 Working population aged years by median income from main job and top 0 degree titles obtained, 200 Law $7,480 Economics $22,000 Accounting Engineering Business Social sciences Humanities Science Information technology Education $02,33 $00,643 $00,448 $98,975 $95,6 $93,955 $85,625 $75,29 $0 $20,000 $40,000 $60,000 $80,000 $00,000 $20,000 $40,000 $60,000 $80,000 $200,000 For persons working full time (i.e. 35 hours or more per week). Source: Population and Housing Census, 200 Employment Greatest proportion of university degree holders in white-collared occupations occupation types. Figure 5 shows that close to three-quarters or 74% of persons holding degrees were in the higher paying senior official and managerial positions or professional occupations compared with only 5% of persons with no academic certificates. The Bermuda Standard Classification of Occupations aligns with international classifications that require minimum levels of education for differing Figure 5 Population aged years by highest academic qualification and occupational group, 200 University degree Diploma/associate degree Tech./voc. certificate High school certificate None % 0% 20% 30% 40% 50% 60% 70% 80% 90% 00% Senior official and managerial Professional Technicians/associate professional Clerks Service, shop and market sales Agricultural and fishery Craft and related trades Plant/machine operators/assemblers Elementary occupations Excludes the Armed forces and other and not stated qualifications. Source: Population and Housing Census, 200 3

14 University degree holders more likely to be senior officials or managers University degree holders were the most likely to hold the highest paying senior official/managerial jobs (29%) and least likely to be employed in the lowest paying group of service workers and shop/ sales workers (2%) (see Figure 5 and Table 4). Conversely, persons with no academic certificates were the least likely to be employed as senior officials or managers (3%) and most likely to be employed as service workers and shop/sales workers (26%). In 200, 74% of the working population comprised Bermudians and 26% non-bermudians. Bermudians with a university degree (29%) were more likely to hold the highest paying senior official/ managerial jobs than non-bermudian degree holders (28%). However, non-bermudians were nearly three times as likely to be employed in the lowest paying group of service workers and shop/ sales workers. The rates peaked at 7.6% for the male population who reported having no certificates. Inversely, the female population experienced the lowest unemployment rates at all education levels, with the exception of at the degree level. When comparing by race, blacks had higher unemployment rates than whites at every level of education attainment. Unemployment rates for the white population with no formal qualifications topped off at 3.0%, while the black population was nearly triple the amount at 8.7% and persons of mixed and other races was at 4.8%. It is particularly noteworthy that the unemployment rate (0.7%) for black men with no certificates was nearly four times that of white men (2.7%) with the same academic standing. This is an area that may require further study to explain the stark difference. Unemployment rates highest for people with no academic certificates The 200 Census counted,072 unemployed persons aged 25 to 64 years, up from 69 in In 200, unemployment rates were highest for persons with no academic qualifications and lowest for persons holding degrees. This suggests that a higher education can be a springboard to employment. Table 5 shows that the unemployment rate amongst persons with no academic qualifications measured 2.7 percentage points higher than persons who graduated from high-school, and 5.0 percentage points higher than degree holders. The total unemployment rate for persons aged 25 to 64 years was 3.3%. 4
. In 200, 74% of the working population comprised Bermudians and 26% non-bermudians.")
15 Table 5 Unemployment rates for the population aged years by highest academic qualification, sex and race, 200 Race Highest Mixed and academic qualification Total Black White other Both sexes Total None High school certificate Tech./voc. certificate Diploma/associate degree University degree Other Not stated Men Total None High school certificate Tech./voc. certificate Diploma/associate degree University degree Other Not stated Women Total None High school certificate Tech./voc. certificate Diploma/associate degree University degree Other Not stated Includes not stated Source: 200 Census of Population and Housing 5

16 Educational and financial benefits of delayed parenting Of the population aged 25 to 64 years, 3,7 or 0% persons became parents during their teenage years. Of these persons, 40% had attained high school certificates, 29% had no certificates, 22% had achieved a technical/vocational/diploma/ associate degree and 7% possessed a university degree compared with,3 or 3% of the total population in this age group. Twenty-eight percent of persons who became teenage parents held jobs as clerks while 25% were service/sales workers. Only 25% worked as professionals or senior officials/managers compared with 42% of the total population, demonstrating the knock-on effect of receiving a lower education than the total population. As with the total population, teenage parents with higher levels of educational attainment led to a higher income from their main job, with university degree holders earning 85% more on average than those with no academic qualifications. Conclusion This brief examined the academic improvements made over the past decade, compared the academic standing between subpopulations and explored differences in occupations and earnings based on the highest academic qualification achieved. Between 2000 and 200, Bermuda s prime working population aged 25 to 64 years made significant progress towards achieving a higher level of educational attainment. During the decade, the proportion of university graduates grew and this was offset by a contraction of the proportion of persons with no certificates and technical/vocational certificates. The census data showed that university graduates were more likely to be high-income earners working as senior officials, managers or professionals. Cedar Park Centre, 48 Cedar Avenue, Hamilton HM P.O. Box HM 305, Hamilton HM MX, Bermuda Tel: (44) Fax: (44) statistics@gov.bm Website: Designed by The Department of Communication and Information 6

Matti Kyrö. International comparisons of some features of
 Matti Kyrö International comparisons of some features of Finnish education and training International comparisons of some features of the Finnish education and training system The education system DOCTORAL
TRADE UNION MEMBERSHIP 2014. Statistical Bulletin JUNE 2015
 TRADE UNION MEMBERSHIP 2014 Statistical Bulletin JUNE 2015 Contents Contents... 2 Introduction... 3 Key findings... 5 1. Long Term Trends... 6 2.Private and Public Sectors. 12 3. Personal and job characteristics...
Education at a Glance 2008. OECD Technical Note For Spain
 Education at a Glance 2008 NO MEDIA OR WIRE TRANSMISSION BEFORE 9 SEPTEMBER 2008, 11:00 PARIS TIME OECD Technical Note For Spain Governments are paying increasing attention to international comparisons
SalarieS of chemists fall
 ACS news SalarieS of chemists fall Unemployment reaches new heights in 2009 as recession hits profession hard The economic recession has taken its toll on chemists. Despite holding up fairly well in previous
How Does Educational Attainment Affect Participation in the Labour Market?
 Indicator How Does Educational Attainment Affect Participation in the Labour Market? In all countries, individuals with a tertiary-level degree have a greater chance of being employed than those without
Educational Attainment in the United States: 2015
 Educational Attainment in the United States: 215 Population Characteristics Current Population Reports By Camille L. Ryan and Kurt Bauman March 216 P2-578 This report provides a portrait of educational
Secondary Analysis of the Gender Pay Gap. Changes in the gender pay gap over time
 Secondary Analysis of the Gender Pay Gap Changes in the gender pay gap over time March 2014 Department for Culture, Media & Sport Department for Culture, Media & Sport 3 Contents Chapter 1: Introduction...
Employment and Wages for Alberta Workers with a Post-Secondary Education
 Employment and Wages for Alberta Workers with a Post-Secondary Education Abstract Between 2013 and 2017, Alberta s economy is expected to add approximately 163,000 new jobs. 1 In addition, approximately
The Training Needs of Older Workers
 The Training Needs of Older Workers Katrina Ball, Josie Misko and Andrew Smith National Centre for Vocational Education Research ABSTRACT The nature of work has been the subject of significant change in
Access to meaningful, rewarding and safe employment is available to all.
 Home Previous Reports Links Downloads Contacts The Social Report 2002 te purongo oranga tangata 2002 Introduction Health Knowledge and Skills Safety and Security Paid Work Human Rights Culture and Identity
2. THE ECONOMIC BENEFITS OF EDUCATION
 2. THE ECONOMIC BENEFITS OF EDUCATION How much more do tertiary graduates earn? How does education affect employment rates? What are the incentives for people to invest in education? What are the incentives
Full report - Women in the labour market
 Full report - Women in the labour market Coverage: UK Date: 25 September 2013 Geographical Area: UK Theme: Labour Market Key points The key points are: Rising employment for women and falling employment
Analysis of Income Disparity in Hong Kong
 Analysis of Income Disparity in Hong Kong Background This note aims at providing Members with an analysis of the income disparity situation in Hong Kong, in response to the request made by the Hon Emily
By Melissa S. Kearney, Brad Hershbein, and Elisa Jácome The Hamilton Project
 PROFILES OF CHANGE: EMPLOYMENT, EARNINGS, AND OCCUPATIONS FROM 1990-2013 April 20, 2015 By Melissa S. Kearney, Brad Hershbein, and Elisa Jácome The Hamilton Project There has been tremendous focus in recent
Under embargo until 11 September, at 11:00 am Paris time
 COUNTRY NOTE Education at a Glance: OECD Indicators 2012 UNITED STATES Under embargo until 11 September, at 11:00 am Paris time Questions can be directed to: Andreas Schleicher, Advisor to the Secretary-General
Public and Private Sector Earnings - March 2014
 Public and Private Sector Earnings - March 2014 Coverage: UK Date: 10 March 2014 Geographical Area: Region Theme: Labour Market Theme: Government Key Points Average pay levels vary between the public and
QuickStats About Auckland Region
 QuickStats About Population/ Dwellings Number of people counted Total population 1,303,068 people usually live in. This is an increase of 144,177 people, or 12.4 percent, since the 2001 Census. Its population
Educational Attainment. Five Key Data Releases From the U.S. Census Bureau
 Educational Attainment Five Key Data Releases From the U.S. Census Bureau 100% 90% 80% 70% Educational Attainment of the Population 25 Years and Older: 2011 30 percent 1% 2% 8% 19% Doctorate degree Professional
How To Earn More Money In The United States
 Education at a Glance 2011 OECD Indicators DOI: http://dx.doi.org/10.1787/eag-2011-en OECD 2011 Under embargo until 13 September, at 11:00 Paris time COUNTRY NOTE UNITED STATES Questions can be directed
Degrees of Difference: The Employment of University-qualified Immigrants in New Zealand
 Degrees of difference: The employment of university-qualified immigrants in New Zeal Degrees of Difference: The Employment of University-qualified Immigrants in New Zeal i Degrees of difference: The employment
What It s Worth: Field of Training and Economic Status in 2009
 What It s Worth: Field of Training and Economic Status in 2009 Household Economic Studies Issued February 2012 P70-129 INTRODUCTION The relationship between educational attainment and economic outcomes
Country note China. More than 255 million people in OECD and G20 countries have now attained tertiary education (Table A1.3a).
.") Education at a Glance 2011 OECD Indicators DOI: http://dx.doi.org/10.1787/eag-2011-en OECD 2011 Under embargo until 13 September, at 11:00 Paris time Education at a Glance 2011 Country note China Questions
Education at a Glance 2011 OECD Indicators DOI: http://dx.doi.org/10.1787/eag-2011-en OECD 2011 Under embargo until 13 September, at 11:00 Paris time Education at a Glance 2011 Country note China Questions
Bachelor s graduates who pursue further postsecondary education
 Bachelor s graduates who pursue further postsecondary education Introduction George Butlin Senior Research Analyst Family and Labour Studies Division Telephone: (613) 951-2997 Fax: (613) 951-6765 E-mail:
Women s Earnings and Income
 Earnings and Income of U.S. Women and Men The median annual earnings for full-time, year-round women workers in 2010 was $36,931 compared to men s $47,715. 1 In 2011, the median weekly earnings for full-time
THE CAYMAN ISLANDS LABOUR FORCE SURVEY REPORT SPRING 2015
 THE CAYMAN ISLANDS LABOUR FORCE SURVEY REPORT SPRING 2015 Published September 2015 Economics and Statistics Office i CONTENTS SUMMARY TABLE 1. KEY LABOUR FORCE INDICATORS BY STATUS... 1 SUMMARY TABLE 2.
Analyst HEALTH AND HEALTH CARE IN SAN JOAQUIN COUNTY REGIONAL
 SPRING 2016 HEALTH AND HEALTH CARE IN SAN JOAQUIN COUNTY San Joaquin County Health Care s Rapid Growth Creates Critical Shortages in Key Occupations. Health care has been changing rapidly in the United
e-brief The Payoff: Returns to University, College and Trades Education in Canada, 1980 to 2005
 e-brief August 4, 010 EDUCATION PAPERS The Payoff: Returns to University, College and Trades Education in Canada, 80 to 005 I N D E P E N D E N T R E A S O N E D R E L E V A N T By Daniel Boothby and Torben
Educational Attainment
 Educational Attainment Five Key Data Releases From the U.S. Census Bureau Media Webinar February 23, 2012 Webinar access information Toll free number: 888 790 3288 Passcode: CENSUS URL: https://www.mymeetings.com/nc/join/
Family Net Worth in New Zealand
 Reproduction of material Material in this report may be reproduced and published, provided that it does not purport to be published under government authority and that acknowledgement is made of this source.
Under embargo until 11 September, at 11:00 am Paris time
 COUNTRY NOTE Education at a Glance:OECD Indicators 2012 Under embargo until 11 September, at 11:00 am Paris time CANADA Questions can be directed to: Andreas Schleicher, Advisor to the Secretary-General
Income Sustainability through Educational Attainment
 Journal of Education and Training Studies Vol. 3, No. 1; January 2015 ISSN 2324-805X E-ISSN 2324-8068 Published by Redfame Publishing URL: http://jets.redfame.com Income Sustainability through Educational
UNIVERSITY WORKS. 2014 employment report
 UNIVERSITY WORKS 2014 employment report Empirical data shows Ontario university graduates have the best labour market outcomes. A university education leads to success. UNIVERSITY grads get jobs University
AMERICA'S YOUNG ADULTS AT 27: LABOR MARKET ACTIVITY, EDUCATION, AND HOUSEHOLD COMPOSITION: RESULTS FROM A LONGITUDINAL SURVEY
 For release 10:00 a.m. (EDT) Wednesday, March 26, 2014 USDL-14-0491 Technical information: (202) 691-7410 nls_info@bls.gov www.bls.gov/nls Media contact: (202) 691-5902 PressOffice@bls.gov AMERICA'S YOUNG
CLOSE THE GAP WORKING PAPER GENDER PAY GAP STATISTICS. April 2015 INTRODUCTION WHAT IS THE GENDER PAY GAP? ANNUAL SURVEY OF HOURS AND EARNINGS
 CLOSE THE GAP 14 WORKING PAPER GENDER PAY GAP STATISTICS April 2015 This paper is an updated version of Working Paper 11 Statistics published in 2014.It provides the latest gender pay gap statistics for
RR887. Changes in shift work patterns over the last ten years (1999 to 2009)
") Health and Safety Executive Changes in shift work patterns over the last ten years (999 to 009) Prepared by Office for National Statistics for the Health and Safety Executive 0 RR887 Research Report Crown
Health and Safety Executive Changes in shift work patterns over the last ten years (999 to 009) Prepared by Office for National Statistics for the Health and Safety Executive 0 RR887 Research Report Crown
Young Black America Part Four: The Wrong Way to Close the Gender Wage Gap
 Issue Brief August 2015 Young Black America Part Four: The Wrong Way to Close the Gender Wage Gap By Cherrie Bucknor* Young blacks in America have had significant improvements in educational attainment
COUNTRY NOTE GERMANY
 Education at a Glance 2011 OECD Indicators DOI: http://dx.doi.org/10.1787/eag-2011-en OECD 2011 Under embargo until 13 September, at 11:00 Paris time COUNTRY NOTE GERMANY Questions can be directed to:
1. TRENDS IN INTERNATIONAL MIGRATION
 1. TRENDS IN INTERNATIONAL MIGRATION This chapter provides a brief overview of global and regional patterns and trends in international migration since 199. It also describes selected characteristics of
The table Key facts for Brazil in Education at a Glance 2015 presents a summary of figures for Brazil and the OECD average.
 Education at a Glance: OECD Indicators is the authoritative source for information on the state of education around the world. It provides data on the structure, finances and performance of education systems
Immigrant Workers and the Minimum Wage in New York City
 Immigrant Workers and the Minimum Wage in New York City Prepared by the Fiscal Policy Institute for the New York Immigration Coalition Fiscal Policy Institute 275 Seventh Avenue, 6 th floor New York, NY
Mexico. While 15-year-old Mexicans are doing better in school. enrolment rates for 15-19year-olds remain very low.
 Education at a Glance: OECD Indicators is the authoritative source for accurate and relevant information on the state of around the world. It provides data on the structure, finances, and performance of
UK application rates by country, region, sex, age and background. (2014 cycle, January deadline)
") UK application rates by country, region, sex, age and background (2014 cycle, January deadline) UCAS Analysis and Research 31 January 2014 Key findings Application rates for 18 year olds in England, Wales
UK application rates by country, region, sex, age and background (2014 cycle, January deadline) UCAS Analysis and Research 31 January 2014 Key findings Application rates for 18 year olds in England, Wales
Ohio African Americans
 Ohio African Americans Ohio s African American community is comprised of nearly 1.6 million people, accounting for 13.7 percent of the state s total population. According to the 2013 American Community
Men in Nursing Occupations
 Men in Nursing Occupations American Community Survey Highlight Report Issued February 2013 Introduction Healthcare is one of the fastest growing industries. 1 The aging of our population fuels an increasing
Parental Occupation Coding
 Parental Occupation Coding A report submitted to the Performance Measurement and Reporting Taskforce of the Ministerial Council on Education, Employment Training and Youth Affairs by Dr Roger Jones Quantitative
employment status major occupation groups public and private sectors occupation sub-groups residential qualification educational attainment
 Chapter 6: Employment Economic Activity employment status activity rates Occupation Industry major occupation groups by gender public and private sectors occupation sub-groups residential qualification
Age, Demographics and Employment
 Key Facts Age, Demographics and Employment This document summarises key facts about demographic change, age, employment, training, retirement, pensions and savings. 1 Demographic change The population
EUROPE 2020 TARGET: TERTIARY EDUCATION ATTAINMENT
 EUROPE 2020 TARGET: TERTIARY EDUCATION ATTAINMENT Low tertiary or equivalent education attainment levels create skills bottlenecks in knowledgeintensive economic sectors and hamper productivity, innovation
Statistical Bulletin. Annual Survey of Hours and Earnings, 2014 Provisional Results. Key points
 Statistical Bulletin Annual Survey of Hours and Earnings, 2014 Provisional Results Coverage: UK Date: 19 November 2014 Geographical Areas: Country, European (NUTS), Local Authority and County, Parliamentary
Trends in part-time and temporary work
 Trends in part-time and temporary work This analysis has been carried out using the latest available quarterly data from the Labour Force Survey. This was used to examine trends in temporary and part-time
Aboriginal People and the Labour Market: Estimates from the Labour Force Survey, 2008-2010
 Catalogue no. 71-588-X, no. 3 ISSN 1919-1200 ISBN 978-1-100-19433-2..Research paper... The Aboriginal Labour Force Analysis Series Aboriginal People and the Labour Market: Estimates from the Labour Force
Who Is Working For Minimum Wage In Ontario? By Sheila Block
 Who Is Working For Minimum Wage In Ontario? By Sheila Block October, 2013 The Wellesley Institute engages in research, policy and community mobilization to advance population health. Copies of this report
Prepared by: Andrew Sum Ishwar Khatiwada With Sheila Palma. Center for Labor Market Studies Northeastern University
 The Employment Experiences and College Labor Market Job Characteristics of Young Adult Associate Degree and Bachelor Degree Recipients in Massachusetts and the U.S. Prepared by: Andrew Sum Ishwar Khatiwada
COLLEGE ENROLLMENT AND WORK ACTIVITY OF 2014 HIGH SCHOOL GRADUATES
 For release 10:00 a.m. (EDT) Thursday, April 16, 2015 USDL-15-0608 Technical information: (202) 691-6378 cpsinfo@bls.gov www.bls.gov/cps Media contact: (202) 691-5902 PressOffice@bls.gov COLLEGE ENROLLMENT
Choosing a Career: A Look at Employment Statistics. Student Activities: Choosing a Career: A Look at Employment Statistics
 Lynda R. Wiest College of Education University of Nevada, Reno October 2002 Choosing a Career: A Look at Employment Statistics Suggested Grade Levels: 7 and up Possible Subject Area(s): Occupational Education;
Country note - Greece
 Education at a Glance 2011 OECD Indicators DOI: http://dx.doi.org/10.1787/eag-2011-en OECD 2011 Under embargo until 13 September at 11:00 Paris time Country note - Greece Questions can be directed to:
Labour Market Outcomes of Young Postsecondary Graduates, 2005 to 2012
 Catalogue no. 11-626-X No. 050 ISSN 1927-503X ISBN 978-0-660-03237-5 Economic Insights Labour Market Outcomes of Young Postsecondary Graduates, 2005 to 2012 by Kristyn Frank, Marc Frenette, and René Morissette
Women, Wages and Work A report prepared by the UNC Charlotte Urban Institute for the Women s Summit April 11, 2011
 A report prepared by the UNC Charlotte Urban Institute for the Women s Summit April 11, 2011 A report prepared for the Women s Summit by the UNC Charlotte Urban Institute 1 Table of Contents Table of Contents...
Women s Participation in Education and the Workforce. Council of Economic Advisers
 Women s Participation in Education and the Workforce Council of Economic Advisers Updated October 14, 214 Executive Summary Over the past forty years, women have made substantial gains in the workforce
Every Mäori Counts. Ko Te Tatau i a Ngäi Mäori
 TE IRA TANGATA L I F E Q U A L I T Y PÄRONGO F A C T S H E E T : 0 2 1 2 0 1 2 Ko Te Tatau i a Ngäi Every Counts Why do leave New Zealand and move to another country to live? Which countries do they settle
Foreword. End of Cycle Report 2014. Applicants
 Foreword The End of Cycle Report is our most comprehensive analysis to date of recruitment to full time undergraduate courses in the UK. It provides a rich picture of demand and outcomes for higher education
College: A Necessity Priced as a Luxury
 College: A Necessity Priced as a Luxury Six Facts on College and the Middle Class May 2014 A Middle Class Job Does Not Get a Middle Class Life v Today, a middle class job increasingly does not support
The Gender Wage Gap by Occupation 2014
 IWPR # C431 April 2015 The Gender Wage Gap by Occupation 2014 and by Race and Ethnicity Women s are lower than men s in nearly all s, whether they work in s predominantly done by women, s predominantly
The Path Forward. International Women s Day 2012 Global Research Results
 The Path Forward International Women s Day 2012 Global Research Results Research objectives Accenture conducted its global research study, The Path Forward for release on International Women s Day to gain
Under embargo until 11 September, at 11:00 am Paris time
 COUNTRY NOTE Education at a Glance: OECD Indicators 2012 PORTUGAL Under embargo until 11 September, at 11:00 am Paris time Questions can be directed to: Andreas Schleicher, Advisor to the Secretary-General
Doctors and romance: Not only of interest to Mills and Boon readers
 Doctors and romance: Not only of interest to Mills and Boon readers Paul Callister PhD (Social Policy); 1 Juthika Badkar MPH; 2 Robert Didham PhD (Asian Studies) 3 ABSTRACT Introduction: Internationally
CENTER FOR LABOR MARKET STUDIES
 The Complete Breakdown in the High Schoolto Work Transition of Young, Non College Enrolled High School Graduates in the U.S.; The Need for an Immediate National Policy Response Prepared by: Andrew Sum
Young Italians difficulties in finding work threaten to undermine investment in education.
 Education at a Glance: OECD Indicators is the authoritative source for accurate and relevant information on the state of education around the world. It provides data on the structure, finances, and performance
How s Life in Ireland?
 October 2015 How s Life in Ireland? Additional information, including the data used in this country note, can be found at: www.oecd.org/statistics/hows-life-2015-country-notes-data.xlsx HOW S LIFE IN IRELAND
College Enrollment by Age 1950 to 2000
 College Enrollment by Age 1950 to 2000 Colleges compete with the labor market and other adult endeavors for the time and attention of young people in a hurry to grow up. Gradually, young adults drift away
Under embargo until 13 September, at 11:00 Paris time. Country note Brazil
 Education at a Glance 2011 OECD Indicators DOI: http://dx.doi.org/10.1787/eag-2011-en OECD 2011 Under embargo until 13 September, at 11:00 Paris time Country note Brazil Questions can be directed to: Andreas
USUAL WEEKLY EARNINGS OF WAGE AND SALARY WORKERS FIRST QUARTER 2015
 For release 10:00 a.m. (EDT) Tuesday, April 21, USDL-15-0688 Technical information: (202) 691-6378 cpsinfo@bls.gov www.bls.gov/cps Media contact: (202) 691-5902 PressOffice@bls.gov USUAL WEEKLY EARNINGS
Undergraduate Degree Completion by Age 25 to 29 for Those Who Enter College 1947 to 2002
 Undergraduate Degree Completion by Age 25 to 29 for Those Who Enter College 1947 to 2002 About half of those who start higher education have completed a bachelor's degree by the ages of 25 to 29 years.
Science and Engineering PhDs - A Legitimate Market in Canada
 Catalogue no. 11-621-MIE No. 063 ISSN: 1707-0503 ISBN: 978-0-662-47045-8 Analytical Paper Analysis in Brief Science and Engineering PhDs: A Canadian Portrait by Michael McKenzie Science, Innovation and
Educational Attainment of Veterans: 2000 to 2009
 Educational Attainment of Veterans: to 9 January 11 NCVAS National Center for Veterans Analysis and Statistics Data Source and Methods Data for this analysis come from years of the Current Population Survey
Chapter 5: Financial Wealth, Wealth in Great Britain 2010-12
 Chapter 5: Financial Wealth, Wealth in Great Britain 201012 Coverage: GB Date: 15 May 2014 Geographical Area: Region Theme: Economy Key points Aggregate net financial wealth for all private households
Marriage and divorce: patterns by gender, race, and educational attainment
 ARTICLE OCTOBER 2013 Marriage and divorce: patterns by gender, race, and educational attainment Using data from the National Longitudinal Survey of Youth 1979 (NLSY79), this article examines s and divorces
Sydney West and Blue Mountains
 Slide 1 Sydney West and Blue Mountains Priority Employment Area 9 May 2014 Presenter: Ivan Neville Branch Manager Labour Market Research and Analysis Branch www.employment.gov.au Slide 2 Sydney West and
Minnesota s Registered Nurse Workforce, 2011-2012
 Office of Rural Health and Primary Care P.O. Box 64882 St. Paul, MN 55164-0882 651-201-3838 Minnesota s Registered Nurse Workforce, 2011-2012 The Minnesota Department of Health (MDH), in cooperation with
Rural America At A Glance
 United States Department of Agriculture Rural America At A Glance 2014 Edition Overview While the U.S. economy is now in its sixth year of recovery from the Great Recession of 2007-09, its performance
Who are the Other ethnic groups?
 Article Who are the Other ethnic groups? Social and Welfare David Gardener Helen Connolly October 2005 Crown copyright Office for National Statistics 1 Drummond Gate London SW1V 2QQ Tel: 020 7533 9233
2. Incidence, prevalence and duration of breastfeeding
 2. Incidence, prevalence and duration of breastfeeding Key Findings Mothers in the UK are breastfeeding their babies for longer with one in three mothers still breastfeeding at six months in 2010 compared
Economic inequality and educational attainment across a generation
 Economic inequality and educational attainment across a generation Mary Campbell, Robert Haveman, Gary Sandefur, and Barbara Wolfe Mary Campbell is an assistant professor of sociology at the University
2011 Project Management Salary Survey
 ASPE RESOURCE SERIES 2011 Project Management Salary Survey The skills we teach drive real project success. Table of Contents Introduction... 2 Gender... 2 Region... 3 Regions within the United States...
Regional characteristics of foreignborn people living in the United Kingdom
 Regional characteristics of foreignborn people living in the United Kingdom By Alice Reid and Caroline Miller, Office for National Statistics Abstract This article examines the characteristics of foreign-born
Poverty among ethnic groups
 Poverty among ethnic groups how and why does it differ? Peter Kenway and Guy Palmer, New Policy Institute www.jrf.org.uk Contents Introduction and summary 3 1 Poverty rates by ethnic group 9 1 In low income
Percentage of women in U.S. labor force. Percentage of women in U.S. labor force. Population of adult women in the United States
 Factsheet: Women and Gender Inequality in the U.S. Labor Force Since the 1970s the role of women in the U.S. work has changed tremendously - more women have entered the work, they are increasingly holding
Selected Socio-Economic Data. Baker County, Florida
 Selected Socio-Economic Data African American and White, Not Hispanic www.fairvote2020.org www.fairdata2000.com 5-Feb-12 C03002. HISPANIC OR LATINO ORIGIN BY RACE - Universe: TOTAL POPULATION Population
Chapter 2. Education and Human Resource Development for Science and Technology
 Chapter 2 Education and Human Resource Development for Science and Technology 2.1 Evironment for Basic Human Resource Development... 53 2.1.1 Science education in primary and secondary schools... 53 2.1.2
UK application rates by country, region, constituency, sex, age and background. (2015 cycle, January deadline)
") UK application rates by country, region, constituency, sex, age and background () UCAS Analysis and Research 30 January 2015 Key findings JANUARY DEADLINE APPLICATION RATES PROVIDE THE FIRST RELIABLE INDICATION
UK application rates by country, region, constituency, sex, age and background () UCAS Analysis and Research 30 January 2015 Key findings JANUARY DEADLINE APPLICATION RATES PROVIDE THE FIRST RELIABLE INDICATION
How s Life in the United States?
 October 2015 How s Life in the United States? Additional information, including the data used in this country note, can be found at: www.oecd.org/statistics/hows-life-2015-country-notes-data.xlsx HOW S
Study into the Sales of Add-on General Insurance Products
 Study into the Sales of Add-on General Insurance Quantitative Consumer Research Report Prepared For: Financial Conduct Authority (FCA) March, 2014 Authorised Contact Persons Frances Green Research Director
CITY OF MILWAUKEE POLICE SATISFACTION SURVEY
 RESEARCH BRIEF Joseph Cera, PhD Survey Center Director UW-Milwaukee Atiera Coleman, MA Project Assistant UW-Milwaukee CITY OF MILWAUKEE POLICE SATISFACTION SURVEY At the request of and in cooperation with
SOCIETY OF ACTUARIES THE AMERICAN ACADEMY OF ACTUARIES RETIREMENT PLAN PREFERENCES SURVEY REPORT OF FINDINGS. January 2004
 SOCIETY OF ACTUARIES THE AMERICAN ACADEMY OF ACTUARIES RETIREMENT PLAN PREFERENCES SURVEY REPORT OF FINDINGS January 2004 Mathew Greenwald & Associates, Inc. TABLE OF CONTENTS INTRODUCTION... 1 SETTING
Demographic Profile of Wichita Unemployment Insurance Beneficiaries Q3 2015
 Demographic Profile of Wichita Unemployment Insurance Beneficiaries Q3 2015 The Bureau of Labor Statistics defines an unemployed person as one 16 years and older having no employment and having made specific
While a large proportion of adults in the United States have universitylevel
 Education at a Glance: OECD Indicators is the authoritative source for accurate and relevant information on the state of education around the world. It provides data on the structure, finances, and performance
Patterns of Pay: Estimates from the Annual Survey of Hours and Earnings, UK, 1997 to 2013
 Patterns of Pay: Estimates from the Annual Survey of Hours and Earnings, UK, 1997 to 2013 Author Name(s): David Bovill, Office for National Statistics Abstract Patterns of Pay describes trends in UK earnings.
BRIEFING. Characteristics and Outcomes of Migrants in the UK Labour Market. www.migrationobservatory.ox.ac.uk
 BRIEFING Characteristics and Outcomes of Migrants in the UK Labour Market AUTHOR: CINZIA RIENZO PUBLISHED: 12/11/2014 NEXT UPDATE: 12/11/2015 3rd Revision www.migrationobservatory.ox.ac.uk This briefing
THE EDUCATIONAL ATTAINMENT OF THE WORKFORCE
 THE EDUCATIONAL ATTAINMENT OF THE WORKFORCE March 2016 Dennis Hoffman, Ph.D. Professor, Department of Economics; Director, L. William Seidman Research Institute; and Director, Office of the University
Salaries 2014. Analysis of the American Chemical Society's 2014 Comprehensive Salary and Employment Status Survey
 Salaries 2014 Analysis of the American Chemical Society's 2014 Comprehensive Salary and Employment Status Survey Prepared by: Steve and Clint Marchant Data Based Insights, Inc. on behalf of the ACS Department