InternatIonal Polar Year canadian ScIence report: highlights. Canadian Polar Commission Commission canadienne des affaires polaires
|
|
|
- Thomasina Hunt
- 8 years ago
- Views:
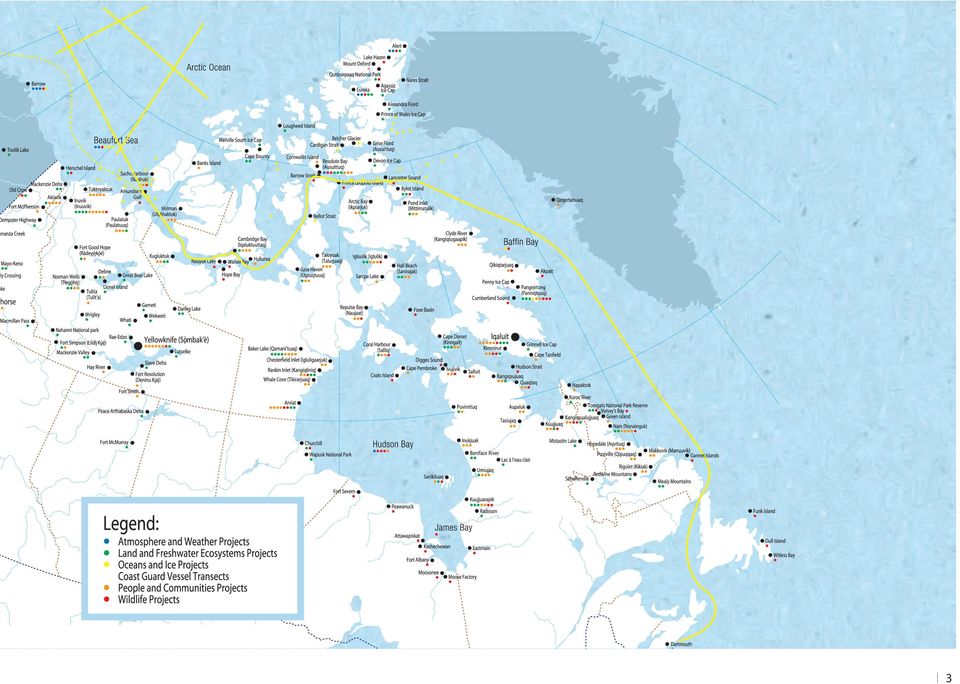
Transcription

1 InternatIonal Polar Year canadian ScIence report: highlights Canadian Polar Commission Commission canadienne des affaires polaires

2 Information contained in this publication or product may be reproduced, in part or in whole, and by any means, for personal or public non-commercial purposes, without charge or further permission, unless otherwise specified. You are asked to: Exercise due diligence in ensuring the accuracy of the materials reproduced; Indicate both the complete title of the materials reproduced, as well as the author organization; and Indicate that the reproduction is a copy of an official work that is published by the Government of Canada and that the reproduction has not been produced in affiliation with, or with the endorsement of the Government of Canada. Commercial reproduction and distribution is prohibited except with written permission from the Government of Canada s copyright administrator, Public Works and Government Services of Canada (PWGSC). For more information, please contact PWGSC at: or at: droitdauteur.copyright@tpsgc-pwgsc.gc.ca. Published by: Canadian Polar Commission Suite 1710, Constitution Square 360 Albert Street Ottawa, Ontario K1R 7X7 Canada 2012 Canadian Polar Commission pdf, English Catalogue No R104-3/2012E-PDF ISBN The electronic version of this report is available on our website: Cette publication est aussi disponible en français sous le titre : Rapport scientifique sur l Année polaire internationale faits saillants canadiens

3 3
4 Message from the Minister Aboriginal Affairs and Northern Development As Minister of Aboriginal Affairs and Northern Development, I am pleased to welcome the 2012 International Polar Year (IPY) From Knowledge to Action conference to Canada. Our government s vision for Canada s North is clear we must exercise our Arctic sovereignty, and pursue environmentally sustainable economic and social development in the North, while improving and devolving Northern governance. This is laid out in our government s Northern Strategy, which was announced by Prime Minister Harper in 2008, and has been a guiding set of principles for our government. A major national and international achievement has been our involvement in the IPY program, which has led to a commitment for construction of a state-of-the-art High Arctic research station. We are proud to be hosting the third and final IPY Conference in April 2012, in Montreal, which will serve as an opportunity to highlight the latest polar research and discuss how this new knowledge can be used to advance programs and policies. I would like to acknowledge the Canadian Polar Commission s role in communicating Canada s polar research results at home and abroad since Their contributions have been instrumental in the success of IPY. The theme of this final conference, From Knowledge to Action, places a timely focus on our need to adapt to our changing world and prosper from the opportunities offered by the North. We will be bringing together a broad range of key players from around the world to share evidence-based knowledge, and discuss innovative ways of further incorporating the North into the world economy. Canada is proud to be hosting the final conference, which will build on the momentum of the 2010 conference in Oslo, and which will be a pivotal milestone in Northern relations, global decisions, policies and outcomes moving forward. Canada s North is a fundamental part of our national identity and of the world s economic future. Our government continues to work with territorial and Aboriginal leaders, Northerners, and international partners to ensure that our North remains a prosperous and secure region within a strong and sovereign Canada. Through our Northern Strategy, we are working to unlock the resource potential of the North, and to ensure long-term, sustainable benefits for Northerners and for all of Canada. The Honourable John Duncan 4 INTERNATIONAL POLAR YEAR CANADIAN SCIENCE REPORT: HIGHLIGHTS

5 Message from the Chairperson Canadian Polar Commission The Canadian Polar Commission is pleased to have been a major proponent of International Polar Year (IPY), and I would like to acknowledge my predecessors at the Commission for their contributions to Canada s resounding IPY success. International Polar Year represents the pinnacle of nearly 130 years of progress in Canadian polar research. Our country was only 15 years old when International Polar Year began in Some foreign scientists did research here, but few Canadians. The second IPY, in , saw young Canadian atmospheric physicists launching research balloons and kites over Chesterfield Inlet, unaware that just a few years later, during IPY (International Geophysical Year), their expertise would enable them to help usher in the space age. Fifty years later, International Polar Year constituted a massive research effort with hundreds of Canadian scientists working closely with international colleagues and, notably, with northern indigenous peoples and communities. Unlike earlier polar years, IPY included major research activities related directly to the human dimension of the Arctic. This report offers you a glimpse of their discoveries, which will set the course of polar research and inform policy choices for decades. Much lies unseen behind research findings: the sometimes gruelling work, the day-to-day field challenges that build experience and understanding, the exhilaration of discovery; the new perspectives gained by northerners looking at their homeland through the lens of research, the new partnerships, networks and friendships; that pivotal moment when a student catches the polar research bug. These too are important results of IPY. In the years between each IPY, major events, discoveries and innovations have rearranged the human world. We can expect more. This IPY has boosted our knowledge of the Arctic and Antarctic Earth s least understood and fastest changing regions and will help humanity negotiate the challenges, known and unknown, of the coming decades. Congratulations to all participants on their magnificent achievement. Bernard W. Funston About the Canadian Polar Commission Established in 1991, the Canadian Polar Commission has responsibility for: monitoring, promoting and disseminating knowledge of the polar regions; contributing to public awareness of the importance of polar science to Canada; enhancing Canada s international profile as a circumpolar nation; and recommending polar science policy direction to government. In carrying out its mandate, the Commission hosts conferences and workshops, publishes information on subjects of relevance to polar research and works closely with other governmental and non-governmental agencies to promote and support Canadian study of the polar regions. 5

6 Introduction Why IPY? The Arctic and Antarctic are the fastest and among the most dramatically changing regions of the planet. Far-reaching global environmental issues such as climate change, rising sea levels and the storage and release of carbon all trace back to what is now happening in the polar regions. As barometers of environmental change and archives of what Earth was like in the past, the Arctic and Antarctic are hard to beat. For good reason, there was a sense of urgency and purpose to the fourth International Polar Year (IPY). As the largest international scientific collaboration to study the polar regions, IPY brought together tens of thousands of researchers from more than 60 nations. Supported jointly by the World Meteorological Organization and the International Council for Science, IPY consisted of more than 200 research projects in the biological, geophysical and social sciences. The projects involved archaeological excavations, surveys of the biodiversity of polar ecosystems, studies of ocean chemistry and analyses of how climate change will affect polar communities. IPY continued a 125-year-old tradition of international scientific collaboration. The first International Polar Year, held in , united various independent expeditions to the far reaches of the planet into an international effort to study meteorology, earth magnetism and the aurora. The theme of international cooperation prevailed in the second IPY in and in the IPY-inspired International Geophysical Year (IGY) in , which set in motion the signing of the Antarctic Treaty to protect the continent from military activities. IPY was timed to coincide with the 125th anniversary of the first IPY, the 75th anniversary of the second IPY and the 50th anniversary of IGY. IPY was a timely effort to understand how the effects of climate change in the Arctic and Antarctic would affect the rest of the planet. It set the stage for continued studies of the polar regions and offered a platform for early career scientists to launch their research. As part of its legacy, IPY continues to offer open-access data from its monitoring and research activities. Canada played an important role in IPY. After all, nearly one-quarter of the Arctic falls within Canada s boundaries; more than half of our coastline is in the Arctic. Canada s IPY program took place between March 2007 and March 2009, allowing for two field campaigns of intensive activity by more than 1,750 researchers from government agencies, universities and northern communities. 6 INTERNATIONAL POLAR YEAR CANADIAN SCIENCE REPORT: HIGHLIGHTS
.")
7 The Government of Canada Program for IPY dedicated $150 million to support 45 research projects. In addition, the Natural Sciences and Engineering Research Council of Canada (NSERC) funded 11 IPY projects. Four of the projects received funding from both the Government of Canada Program and NSERC, bringing the total to 52 science projects. Researchers in the field worked at more than 100 sites across Canada s North and aboard five Canadian Coast Guard icebreakers. They focused on two key areas: climate change impacts and adaptation, and the health and well-being of northern communities. Researchers were encouraged to use interdisciplinary approaches and to meld traditional knowledge and science. Each Canadian research project was required to be relevant to the needs of northern communities, involve Northerners in planning and implementing the research and include an element of capacity building for students and communities. Indeed, unlike previous IPYs, IPY included people from the circumpolar world in the planning and execution of research projects, a recognition that local populations in the circumpolar world now have more control over their lives through land claim settlements and self government. The Canadian Polar Commission was instrumental in establishing Canada as a major player in IPY It sought input from the polar research community and northern communities on how Canada should participate in IPY. The Polar Commission also established and supported the National IPY Committee and Secretariat to receive research proposals and oversee the projects. These efforts will continue to bear fruit for Canadians in the North and South as the scientific results of Canada s IPY projects will inform policy, programs and practices and contribute to a better understanding of the state of the polar regions. Sections ATMOSPHERE 8 OCEAN 12 SEA ICE 16 CRYOSPHERE 20 MARINE ECOSYSTEMS 24 TERRESTRIAL ECOSYSTEMS 28 WILDLIFE 32 COMMUNITY WELL-BEING 36 HUMAN HEALTH 40 IPY by the Numbers 228 projects were undertaken through IPY , with 170 dedicated to science and 57 to education and outreach $156 million of funding were provided by the Government of Canada and the Natural Sciences and Engineering Research Council of Canada for IPY ,000 previously unknown marine species were discovered through IPY research. Of these, around 25 percent were found to be common to both polar regions 1,800 Northerners and 215 students from Canada s North contributed to IPY projects as researchers, technicians and field guides 8 science projects were led by Northerners 240 international researchers from 23 countries were involved in Canadian IPY projects 8 international IPY research networks were led by Canadians 9 delegates attended the first International Polar Conference held in Germany in 1879 to plan the first International Polar Year 2,500 delegates are expected to participate in the IPY conference From Knowledge to Action in Montreal in April 2012 INTRODUCTION 7

8 Atmosphere The case of the missing mercury and other polar mysteries During springtime, something strange happens in the Arctic sky: the chemical element mercury disappears from the atmosphere, only to return when the sun falls below the horizon. Spring also happens to be the time of year when low-level ozone, a greenhouse gas, depletes. What do these events mean for the Arctic environment? Canadian scientists on the IPY OASIS (Ocean-Atmosphere-Sea Ice-Snowpack) project set out to better understand the processes behind the seasonal disappearance of mercury and ozone. OASIS was one of several ambitious IPY atmosphere and weather projects that gathered year-round data and studied everything from the pollution pathways in the Arctic to the impact of severe Arctic storms on the upper ocean and coastal zones. In the case of OASIS, there is an urgency to understand how and where mercury, a powerful neurotoxin, travels in the Arctic, whether in the atmosphere, on the snow pack or in the ocean. If it disappears in the spring, where does it go? Key Findings Large-scale ozone and mercury depletion over the Arctic Ocean was confirmed. Global warming may cause pollutants embedded in the Arctic environment to be released, undermining efforts to reduce environmental and human exposure to toxic chemicals. Frost flowers salty ice crystals that grow on newly-formed Arctic sea ice in cold, windless weather influence chemical interactions between the ocean and the atmosphere. When spring arrives in the Arctic, mercury disappears from the atmosphere. Much more deposited mercury appears to be retained over sea ice than over land-based snowpack. 8 INTERNATIONAL POLAR YEAR CANADIAN SCIENCE REPORT: HIGHLIGHTS

9 OOTI and O-buoy Thanks to earlier observations at Alert, Nunavut, the world s most northerly atmospheric observatory, scientists know that ozone and mercury disappear in the atmosphere with the arrival of the polar spring; subsequent research indicated that these events are related to chemical reactions with bromine that comes from sea salt. Bromine reacts differently with ozone and mercury. Bromine atoms destroy ozone molecules, but combine with mercury to create a different chemical state of mercury that readily deposits on snow and ice surfaces. Many of the details of the chemical processes at play, however, are not well understood, and this was not helped by the scarcity of on-site measurements far out over the Arctic Ocean. The OASIS team set out to determine whether these springtime events, already observed at inland snowpacks, differed on the sea ice and close to ice leads. To do that, they had to be resourceful. The scientists developed OOTI (Out on the Ice), a miniature atmospheric chemistry and physics laboratory, mounted on a sled for rapid deployment by snowmobile, and O-buoys, an icetethered buoy equipped with ozone and carbon dioxide gauges. Processing the volumes of data collected, the scientists found that there is significantly more mercury in the atmosphere over the sea ice than is generally observed inland. Models estimating the contribution of mercury from the atmosphere to the Arctic Ocean and the Arctic as a whole may need to be reevaluated. As for ozone, the scientists did observe springtime depletion over the Arctic Ocean, and in many instances there seemed to be a link with bromine levels. But the evidence was conflicting: ozone was not always destroyed in the presence of very high bromine levels. Scientists are also unsure whether or how these events may be linked to either high pressure systems or temperature. Another Canadian IPY project, Intercontinental Atmospheric Transport of Anthropogenic Pollutants to the Arctic (INCATPA), took a closer look at data relating to mercury depletion in the atmosphere that were collected at Alert between 1995 and INCAPTA scientists found that these events have been occurring earlier in the spring in recent years. Polluted air masses from the south take only a few days to reach the central Arctic. Scientists install a weather station on the Devon Ice Cap, Ellesmere Island. ATMOSPHERE 9

10 Contaminant pathways to the Arctic. At the PEARL research station, scientists took year-round measurements of the entire atmospheric column, from ocean surface to stratosphere. Pathways of pollution How might climate change affect the distribution of pollutants, such as polychlorinated biphenyls (PCBs), in the North? The atmosphere is considered the primary and most rapid pathway of pollutants migrating to the Arctic. Polluted air masses can take only a few days to travel from source regions into the central Arctic region. Once deposited, toxic chemicals such as PCBs, organochlorine pesticides and mercury can be deposited onto the Arctic s surfaces and accumulate in wildlife, country foods and northern people, which may result in negative health impacts. Scientists speculate that when the Arctic warms and sea ice retreats, previously deposited pollutants may be freed from snow, ice and soil back into the atmosphere. Mercury in meltwater may enter Arctic lakes and oceans where it can be converted to methylmercury and bioaccumulate through the food chain. Indeed, IPY researchers did detect this phenomenon over open water in Hudson Bay and the Beaufort Sea, where mercury re-circulated. Trying to predict how pollution may track through the Arctic atmosphere in the future requires robust models that incorporate many factors. To a large degree, these models are being built with data harvested from the Polar Environment Atmospheric Research Laboratory (PEARL), located on Ellesmere Island at Eureka, Nunavut. PEARL is considered a whole atmosphere laboratory. At PEARL, scientists can take year-round measurements of the entire atmospheric column from ocean surface to stratosphere, probing its physical states and composition, including the presence of ozone and related gases. At PEARL, IPY scientists tracked the spread of smoke and pollution from the lower part of the atmosphere to the upper part, where particles can affect weather and climate. This is important because, at present, there is only a generic understanding of the sources and nature of the complex patterns that develop when aerosols are transported into [ 18 research stations in Canada s North received $5 million in IPY funding to improve equipment and facilities and to provide training. 10 INTERNATIONAL POLAR YEAR CANADIAN SCIENCE REPORT: HIGHLIGHTS

11 the Arctic. During IPY, detection of plumes over PEARL originating from fires at more southern latitudes proved the case. Scientists, for example, tracked a pan-arctic smoke plume as it travelled from southeast Russia to Eureka in about five days. Sophisticated sensing instruments captured the plume as it passed over Eureka at altitudes of between 5 and 9 kilometres and were able to establish that it consisted of Russian smoke particles. What s next? From long-term atmospheric monitoring data, scientists have observed the impacts of climate change on the environmental fate of toxic chemicals such as mercury in the Arctic. But climate change occurs on decades-long time scales, while models relating to toxic chemicals in the atmosphere are typically based on fewer than 20 years of information. To understand how climate change will affect the transport and behaviour of pollutants in the environment, measurements must be continued to establish trends spanning similar time scales as climate change observations. Future research will also try to tease out the connections between an increase in storm activity across the Arctic and changing sea ice conditions and sea surface temperatures. Knowing more about storm activity will help researchers build realistic models of possible impacts along the Beaufort and related archipelago coasts. And the OOTI and O-buoy technologies, developed during IPY, will be refined in the coming years to operate autonomously for even longer periods. They promise to become important tools for tomorrow s Arctic scientists. Canadian IPY Research in this Area OASIS-CANADA: Understanding Ozone and Mercury in the Air Over the Arctic Ocean ; Project leaders: Ralf Staebler and Jan Bottenheim, University of Toronto INCATPA: Intercontinental Atmospheric Transport of Anthropogenic Pollutants to the Arctic ; Project leader: Hayley Hung, Environment Canada The PEARL near the Pole Atmospheric Research in the High Arctic ; Project leader: James Drummond, University of Toronto Impacts of Severe Arctic Storms and Climate Change on Coastal Areas ; Project leader: William Perrie, Fisheries and Oceans Canada Ocean Production of Trace Gases in the Arctic and their Impact on Climate, Project leader: Maurice Levasseur, Université Laval Arctic Weather and Environmental Prediction Initiative ; Project leader: Ayrton Zadra, Environment Canada The Circumpolar Flaw Lead System Study ; Project leader: David Barber, University of Manitoba Structure and Evolution of the Polar Atmosphere ; Project leader: Theodore Shepherd, University of Toronto Understanding the Dehydration-greenhouse Feedback Process in the Arctic ; Project leader: Jean-Pierre Blanchet, Université du Québec à Montréal Developed during IPY, OOTI is a miniature atmospheric chemistry and physics laboratory, mounted on a sled for rapid deployment by snowmobile. ATMOSPHERE 11

12 Ocean Tracking the drivers of the Arctic Ocean Land meets sea in dramatic fashion at Gibbs Fiord on Baffin Island. Canada s Arctic Ocean is a key element in the global climate system, but its characteristics are most strongly influenced by its interaction with adjacent areas of the Pacific and Atlantic oceans. These patterns of circulation are complex. High mountains along the eastern side of the Pacific trap evaporated water in the region, raising sea level 80 centimetres above the North Atlantic and 40 centimetres above the Beaufort Sea. These swollen seas flow downhill : north through the Bering Strait, out into the Arctic over saltier Atlantic water moving across from the Eurasian side, east across Canada s Arctic shelf to Baffin Bay and out into the Labrador Sea. Arctic currents are restricted by the Canadian Arctic Archipelago to a few specific pathways. Canada s IPY researchers made the first comprehensive observations of this interchange of water in the Ocean Currents of Arctic Canada (CATs) study, which mapped water volume, current speed and the effects of wind through channels in the Eastern Arctic. CATs determined that the fast-moving streams do not take up the width of the ocean straits but are surprisingly narrow about 10 Key Findings Many of the recent changes in the properties and circulation of Canadian Arctic waters are linked to changes in wind patterns and strength. Cores of sediment reveal that climate fluctuations in the Canadian Arctic since the last ice age have been asymmetric: warm intervals with less ice in the west occurred simultaneously with cool intervals and more ice in the east, and vice versa. Freshwater accumulation in the Canada Basin increased during the last decade, reducing the supply of nutrients to plankton in the sun-penetrated upper ocean. The acidity of Canadian Arctic waters is increasing due to absorption of carbon dioxide and lowering of salinity. High acidity now hinders some species use of calcium carbonate to form protective shells. Arctic storms generate hazardous winds, waves and surges when sea ice is far from shore. From the opposite perspective, wide ice-free expanses of warm water promote storm development. Both aspects are consequences of summertime ice retreat from Arctic coastlines. 12 INTERNATIONAL POLAR YEAR CANADIAN SCIENCE REPORT: HIGHLIGHTS

13 Canada s three oceans are interconnected dynamically, chemically and biologically. kilometres wide and are often at the mercy of strong winds that blow through the passages. As opposed to drift ice, landfast ice tends to impede the movement of ocean currents due to friction and the sheltering effects of the wind. Message in a gyre In the Southern Hemisphere where Antarctica is the core, only the atmosphere can carry environmental influences rapidly to the highest latitudes. In the Arctic, the ocean also has a say in what gets transported. Arctic ice, the ocean and ecosystems interact relatively strongly with the Pacific and Atlantic oceans via both air flow and currents. The Canada s Three Oceans (C3O) project, a two-year study involving two icebreakers and 200 researchers, examined these interactions. It looked at how the influx of freshwater from sources such as the Pacific, sea ice melt and massive Arctic rivers is stored and how marine ecosystems are affected. The best example of such a freshwater storage reservoir is the Beaufort Gyre, a vast, anti-cyclonic Studies during IPY revealed the fingerprint of a changing atmosphere on a changing ocean. These maps show surface air pressure during winter (left) and summer (right). Wind circulates clockwise around high pressure, and its speed increases as the spacing of colours decreases. The panels show conditions during the two IPY years, (middle pair) and (bottom pair), and averaged over the last 30 years (top pair). OCEANS 13

14 Left: CCGS Henry Larsen, support vessel for IPY ocean projects, navigates Alex Fiord. Right: Doppler sonars, used for underwater measurements, are stored on deck. (clockwise-swirling) ocean current west of the Arctic Archipelago. Beneath a mixture of ice-melt, precipitation and river water are layers of Pacific and Atlantic inflow of increasing salinity. Canadian IPY researchers documented a higher accumulation of freshwater in the gyre during the last decade, with a peak in freshwater storage during 2008, IPY s second year of study. This finding has ecological implications, as freshwater floats over saltier ocean water and tends not to mix, thus preventing the transport of important plankton-feeding nutrients to the ocean s surface. Shell-bearing plankton and other marine organisms that rely on calcium carbonate concentrations to form shells are at further risk due to the increasing acidification of the Arctic Ocean. One-third of the carbon dioxide emissions produced by humankind have been absorbed by oceans and converted into carbonic acid. Northern oceans are at the greatest risk, for two reasons: cold water dissolves gas more efficiently and more acidic sea ice is melting into the water at a faster rate during the summers. Findings from IPY studies point to damage to calcifying organisms and, by extension, all Arctic marine ecosystems. Taking the long view of the carbon cycle Described by Canadian IPY researchers as a harbinger of change in the Arctic Ocean, the Atlantic inflow has warmed by as much as 0.5 degree Celsius in the last decade. Warmer layers of summer water have also penetrated from the Pacific side. One consequence of warming temperatures is that Arctic storms seem to be growing in intensity if not frequency. Just as currents and northern ocean coasts are adversely impacted by these storms, Canadian researchers found that the intensity of storms are influenced by expanses of open water, such as those that appear during summer and early autumn. Summer ice retreat in the northwest, from expanses of the Chukchi Sea and the Alaskan coast, opens long tracts of water. Northwest storm winds generate larger and more energetic waves and violent surges that can flood and erode the Canadian Beaufort shoreline and affect coastal communities. Climate predictions for the Arctic can be made in relation to only a few decades of observations, and records of marine systems are shortest of all. To develop a long-range picture, Canadian IPY scientists studied ocean sediment samples to produce a new picture of the life-supporting carbon cycle, climate [ Canadian IPY projects were undertaken in Nunavut (29), the Northwest Territories (21), Nunavik (16), Yukon (14) and Newfoundland and Labrador (11). 14 INTERNATIONAL POLAR YEAR CANADIAN SCIENCE REPORT: HIGHLIGHTS

15 variation and sea ice cover that has occurred over the last several thousand years. Their research has shown that a cooling period began in the east of Canada some 6,000 years ago, while Arctic seas to the west were warmer, producing much less ice cover than in modern times. This synopsis of the past is a valuable tool, especially for linking changes in climate to marine environments and modern human influences. Knowledge of the ocean s physical and chemical environment is fundamental to ecosystem-based ocean management. The basic properties of the ocean (ice cover, temperature, salinity, density structure, dissolved oxygen, nutrients, iron) and the processes that maintain these properties (freezing, thawing, transports, inflows, outflows, mixing, energy balance) are key determinants of the life existing within it. Variation in the Arctic marine ecosystem is clearly linked to variations in the physical and geo-chemical characteristics of the ocean. There is no consensus yet, however, on whether pan-arctic marine production will increase or decrease with reduced ice cover. Models developed during IPY will make it easier to forecast storm surges and shoreline erosion, benefitting northern coastal communities such as Salluit. What s next? Canadian IPY projects developed predictive computer models to accurately reproduce the dynamic exchange of water and ice across the Canadian Arctic, and to forecast storm surges and potential flooding and shoreline erosion in the region. These models will provide important information to at-risk coastal communities, and can be adapted by weather forecasters and those planning search and rescue missions. Scientists say it is crucial that the comprehensive approach adopted during IPY be sustained to better detect signs of progressive change in the Arctic Ocean environment that can vary dramatically from year to year. Canadian IPY Research in this Area C3O: Canada s Three Oceans ; Project leader: Eddy Carmack, Fisheries and Oceans Canada Ocean Currents of Arctic Canada ; Project leader: Humfrey Melling, Fisheries and Oceans Canada Investigation of the Effect of Climate Change on Nutrient and Carbon Cycles in the Arctic Ocean ; Project leader: Roger Francoise, University of British Columbia Impacts of Severe Arctic Storms and Climate Change on Coastal Areas ; Project leader: William Perrie, Fisheries and Oceans Canada The Circumpolar Flaw Lead System Study ; Project leader: David Barber, University of Manitoba Ocean Production of Trace Gases in the Arctic and their Impact on Climate ; Project leader: Maurice Levasseur, Université Laval The Carbon Cycle in the Canadian Arctic and Sub-Arctic Continental Margin ; Project leader: Charles Gobeil, Université du Québec OCEANS 15

16 Sea Ice The Arctic sea icescape is blowing in the wind As predicted 30 years ago, the Arctic is experiencing the strongest signs of global warming, but at a much faster rate than was forecast. Satellite data confirm that the area of ocean covered by ice in the circumpolar region has been shrinking since the late 1970s. It declined a remarkable 65 percent in 2007 and again in What happens to sea ice is of major concern, since it is an engine of change. Sea ice plays a central role in how the Arctic marine system responds to, and affects, climate change; it regulates the exchange of heat, moisture and gas among the ocean, ice and atmosphere. It also controls the distribution and timing of light to nutrient-rich waters in the upper levels of the ocean. And dramatic loss of sea ice cover significantly affects the balance between incoming and outgoing solar radiation. That is because sea ice typically reflects up to 50 percent of sunlight, up to 90 percent if snow-covered, whereas the dark surface of the ocean absorbs 90 percent of sunlight. The Canadian IPY program provided scientists with an unprecedented Key Findings In the Amundsen Gulf, at the western end of the Northwest Passage, open water persists longer than normal and winter sea ice is thinner and more mobile. Cyclones play an important role in sea ice growth and decay. They delay the formation of new ice, reduce the growth of multi-year ice and break up multi-year ice in the late summer. Conditions associated with climate change could bring nutrientrich waters from deep in the Pacific Ocean to nutrient-poor surface waters along the Arctic coast, affecting local food webs. The ice edges bordering flaw leads regions of open water between pack ice and land-fast ice are areas of high biological productivity. Sea ice is an engine of change in the Arctic. The Beaufort sea ice gyre (rotating ocean currents) used to rotate clockwise throughout most of the year but now reverses directions regularly. This contributes to a reduction in sea ice thickness and extent. 16 INTERNATIONAL POLAR YEAR CANADIAN SCIENCE REPORT: HIGHLIGHTS

17 access to the Arctic. The Circumpolar Flaw Lead Study (CFL), based in the southern Beaufort Sea, marked the first time a fully outfitted research icebreaker overwintered in the Arctic, allowing scientists to study the evolution of sea ice, from formation to decay. It also allowed the year-round observation of many age classes of sea ice, leading to significant improvements in the ability to detect the geophysical (such as salinity, brine volume, thickness) and thermodynamic (such as surface temperature and profile) states of sea ice. The scientists confirmed that cyclones (and anticyclones in the winter) play an important role in the dynamics and evolution of sea ice. These weather phenomena, characterized by powerful inward spiraling winds, gain energy over the open water between pack ice and land-fast ice, and tend to steer along the interface between open water and sea ice. While cyclones in the Arctic Basin do not seem to be occurring more frequently, they are becoming more intense. Cyclones generate waves that move the ice pack, and they may help trigger larger than usual storm swells. Scientists with the CFL study noted that even the thickest ice floes, weakened by warm summer temperatures, are susceptible to fracturing from these swells. Storehouse of pollutants and carbon Canada s IPY researchers also analyzed weekly ice charts from 1960 to 2008, seeking trends and variability in summer sea ice. They found that ice cover had decreased the most in Hudson Bay, approximately 11 percent per decade. In Baffin Bay, it disappeared at a rate of 8.9 percent per decade; in the Beaufort Sea, 5.2 percent; and in the Canadian Arctic Archipelago, 2.9 percent. Researchers uncovered evidence that the increasing surface-air temperatures in the Arctic will continue to reduce summer sea ice and facilitate navigation through the Canadian North in the near future. Once largely inaccessible to freighters, the Northwest Passage has been seasonally ice-free since Due to warm spring temperatures and increased loss of multi-year ice, the Passage experienced a record reduction in sea ice in August This has important implications for seasonal shipping and Canadian Arctic sovereignty. An increasingly fragile sea ice cover, associated with the loss of multi-year ice, is accelerating change in the Arctic. CCGS Amundsen was the first research icebreaker to overwinter in the Arctic. SEA ICE 17
 and")
18 by a factor of three, suggesting that the brine ecosystem has been, and continues to be, the most exposed to HCHs. CCGS Amundsen s facilities and sophisticated equipment make it a versatile research platform for oceanographers, geologists, terrestrial ecologists and epidemiologists. The implications for global climate change are significant as well. A recent scientific review, for example, reinforced the idea that the waters of high-latitude continental shelves are generally undersaturated in carbon dioxide relative to the atmosphere. That would suggest that the Arctic acts as a carbon sink, storing atmospheric carbon dioxide. IPY researchers caution, however, that not enough is known about the processes associated with sea ice that may or may not affect the uptake of carbon dioxide. Scientists do know, however, that polar regions are particularly susceptible to the effects of chemical contaminants. As if traveling on a conveyor belt, contaminates from lower latitudes are transported through ocean and atmospheric currents into the Arctic, where they enter the food chain. During IPY, several studies looked at the linkages between sea ice and the transport of contaminants. In one, augered boreholes in the ice were studied to tease out the relationship between organochlorine pesticides such as HCH (hexachlorocyclohexane) and the physical and thermodynamic characteristics of sea ice. The scientists determined that levels of HCH in the brine exceeded the under-ice water concentrations New rules for northern residents In addition to their scientific observations, IPY- CFL researchers turned to the people of the Arctic to tap their traditional knowledge and observations of sea ice. Inuvialuit (Inuit living in the western Canadian Arctic) in Paulatuk, Sachs Harbour and Ulukhaktok, in the Northwest Territories, were asked to document their knowledge of the sea ice. The most common observation reported by interviewees from all communities was the presence of less sea ice and more open water. In particular, there are larger and increased areas of open water throughout the winter that would, in previous years, typically remain frozen. Open water is being found closer to shore as well. Community members from Sachs Harbour noted that freeze-up occurs about one month later than it did 20 to 30 years ago. They also told IPY researchers that it was no longer safe to travel far out into Amundsen Gulf on the sea ice. An increasing amount of rubble ice, rough ice and open water is the new reality for residents across Canada s Arctic. They will be forced to change well-established travel routes or abandon travel on the ice altogether. [ The first International Polar Year took place from 1882 to 1883, and was the first series of coordinated international expeditions to the polar regions ever undertaken. 18 INTERNATIONAL POLAR YEAR CANADIAN SCIENCE REPORT: HIGHLIGHTS

19 Seemingly working in a lily-pad world, scientists collect samples of sea ice. What s next? The findings from the IPY sea ice studies will keep scientists and policy makers across Canada very busy. The results can be incorporated in modeling studies that monitor sea ice circulation, and be used to assess the impact of an increasingly mobile ice cover on the presence of nutrients and pollutants in the Beaufort Sea region. This may have implications for non-renewable and renewable resource development, navigation and Arctic sovereignty. And what will the reduction of existing sea ice and ice thickness mean to northern coastal communities? An increase in storm surges can speed up coastal erosion, thereby affecting fishing and harvesting activities. Changes in when seasonal sea ice freezes and breaks up will impact the safety and efficiency of transportation by residents and hunters. Northern communities will need to identify adaptation strategies. Canadian IPY Research in this Area The Circumpolar Flaw Lead System Study ; Project leader: David Barber, University of Manitoba Ocean Production of Trace Gases in the Arctic and their Impact on Climate ; Project leader: Maurice Levasseur, Université Laval The Carbon Cycle in the Canadian Arctic and Sub-Arctic Continental Margin ; Project leader: Charles Gobeil, Université du Québec Impacts of Severe Arctic Storms and Climate Change on Coastal Areas ; Project leader: William Perrie, Fisheries and Oceans Canada Investigation of the Effect of Climate Change on Nutrient and Carbon Cycles in the Arctic Ocean ; Project leader: Roger Francoise, University of British Columbia Ocean Currents of Arctic Canada ; Project leader: Humfrey Melling, Fisheries and Oceans Canada C3O: Canada s Three Oceans ; Project leader: Eddy Carmack, Fisheries and Oceans Canada Natural Climate Variability and Forcings in Canadian Arctic and Arctic Oceans ; Project leader: André Rochon, Université du Québec å Rimouski SEA ICE 19

20 Cryosphere What happens when permafrost loses its frost? As the climate warms, a Baffin Island glacier is in retreat. From ice cores to satellite images, studies show that the Arctic is losing the very features that make the region so distinctive. The snow, ice shelves, glaciers and permafrost of the North are all wilting in the face of climate change. There is no mistaking it: the Arctic is warming. In the past 20 years, the average annual temperatures in the frozen ground of the High Arctic have risen by nearly 1 C every decade. Less snow now covers the ground in spring and early summer; since 1967, snow cover in June has dropped by nearly half. Yukon glaciers are shrinking because of longer, warmer summers. Entire ice shelves floating platforms of ice that can be up to 50 metres thick have disappeared off the coast of Ellesmere Island. Canadian IPY research focused on creating a current snapshot of the cryosphere in order to understand past changes and as a baseline for tracking future changes. One of the main components of the Arctic ecosystem, the cryosphere consists of any frozen surface, including sea and freshwater ice, glaciers, ice sheets, snow and permafrost. In terms of total mass and heat capacity, Key Findings For the Arctic cryosphere (areas of snow, ice and frozen ground), the IPY period marked an acceleration of trends that began in previous decades: warming permafrost, reduction in snow cover extent and duration, reduction in summer sea ice extent, increased mass loss from glaciers and thinning and break-up of the remaining Canadian ice shelves. Arctic snow cover is gradually decreasing because snow is melting earlier in the spring. Since 1967, June snow cover extent across the Arctic has dropped by 46 percent. Permafrost has warmed across northern Canada with mean annual ground temperature increasing by up to 0.2 C per decade since the mid-1980s in the Mackenzie Valley, 0.8 C per decade since the early 1970s across the western Arctic and about 1 C per decade since the 1990s in the eastern and High Arctic. Model simulations predict earlier dates for ice and snow melt in the spring and later dates for ice formation in the fall. 20 INTERNATIONAL POLAR YEAR CANADIAN SCIENCE REPORT: HIGHLIGHTS

FRENCH ARCTIC INITIATIVE SCIENTIFIC PRIORITIES
 FRENCH ARCTIC INITIATIVE SCIENTIFIC PRIORITIES J.J. Pangrazi / Biosphoto J.J. Pangrazi / Biosphoto Conference audience Edouard Bard introductory lecture Dr. Denis-Didier Rousseau (CNRS Senior Research
Chapter Overview. Seasons. Earth s Seasons. Distribution of Solar Energy. Solar Energy on Earth. CHAPTER 6 Air-Sea Interaction
 Chapter Overview CHAPTER 6 Air-Sea Interaction The atmosphere and the ocean are one independent system. Earth has seasons because of the tilt on its axis. There are three major wind belts in each hemisphere.
Jessica Blunden, Ph.D., Scientist, ERT Inc., Climate Monitoring Branch, NOAA s National Climatic Data Center
 Kathryn Sullivan, Ph.D, Acting Under Secretary of Commerce for Oceans and Atmosphere and NOAA Administrator Thomas R. Karl, L.H.D., Director,, and Chair of the Subcommittee on Global Change Research Jessica
The concepts developed in this standard include the following: Oceans cover about 70% of the surface of the Earth.
 Name Date Grade 5 SOL 5.6 Review Oceans Made by SOLpass - www.solpass.org solpass100@comcast.net Reproduction is permitted for SOLpass subscribers only. The concepts developed in this standard include
Teacher s Guide For. Glaciers and Ice Caps The Melting
 Teacher s Guide For Glaciers and Ice Caps The Melting For grade 7 - College Program produced by Centre Communications, Inc. for Ambrose Video Publishing, Inc. Executive Producer William V. Ambrose Teacher's
Climate Change: A Local Focus on a Global Issue Newfoundland and Labrador Curriculum Links 2010-2011
 Climate Change: A Local Focus on a Global Issue Newfoundland and Labrador Curriculum Links 2010-2011 HEALTH Kindergarten: Grade 1: Grade 2: Know that litter can spoil the environment. Grade 3: Grade 4:
Ms Chairman and distinguished guests,
 Ms Chairman and distinguished guests, On behalf of the Ministry of the Environment, I am honored to open this conference that brings together scientists, policymakers and civil society from the Barents
IPY and Network Marketing in North America
 Canadian National Overview Challenges and Opportunities 2 nd SAON Workshop April 9, 2008 Russel Shearer, Indian and Northern Affairs Canada Indian and Northern Affairs Canada Affaires indiennes et du Nord
Geography affects climate.
 KEY CONCEPT Climate is a long-term weather pattern. BEFORE, you learned The Sun s energy heats Earth s surface unevenly The atmosphere s temperature changes with altitude Oceans affect wind flow NOW, you
Orbital-Scale Climate Change
 Orbital-Scale Climate Change Climate Needed for Ice Age Warm winter and non-frozen oceans so lots of evaporation and snowfall Cool summer so that ice does not melt Ice Age Model When ice growing ocean
Data Sets of Climate Science
 The 5 Most Important Data Sets of Climate Science Photo: S. Rahmstorf This presentation was prepared on the occasion of the Arctic Expedition for Climate Action, July 2008. Author: Stefan Rahmstorf, Professor
CANADA AND THE NORTH INSUFFICIENT SECURITY RESOURCES THEN AND NOW
 CANADA AND THE NORTH INSUFFICIENT SECURITY RESOURCES THEN AND NOW Prepared by: Colonel (Retired) Pierre Leblanc 9 August 2011 BACKGROUND In the late 1990 s I was the Commander of the Canadian Forces in
2. The map below shows high-pressure and low-pressure weather systems in the United States.
 1. Which weather instrument has most improved the accuracy of weather forecasts over the past 40 years? 1) thermometer 3) weather satellite 2) sling psychrometer 4) weather balloon 6. Wind velocity is
Therefore, this is a very important question, which encourages consideration of the current management of the resource.
 Aalisarnermut, Piniarnermut Nunalerinermullu Naalakkersuisoqarfik Department of Fisheries, Hunting and Agriculture Finn's speech to NAFMC Climate change in the North Atlantic has become a reality which
California Standards Grades 9 12 Boardworks 2009 Science Contents Standards Mapping
 California Standards Grades 912 Boardworks 2009 Science Contents Standards Mapping Earth Sciences Earth s Place in the Universe 1. Astronomy and planetary exploration reveal the solar system s structure,
12.5: Generating Current Electricity pg. 518
 12.5: Generating Current Electricity pg. 518 Key Concepts: 1. Electrical energy is produced by energy transformations. 2. Electrical energy is produced from renewable and non-renewable resources. 4. Electrical
Graphing Sea Ice Extent in the Arctic and Antarctic
 Graphing Sea Ice Extent in the Arctic and Antarctic Summary: Students graph sea ice extent (area) in both polar regions (Arctic and Antarctic) over a three-year period to learn about seasonal variations
climate science A SHORT GUIDE TO This is a short summary of a detailed discussion of climate change science.
 A SHORT GUIDE TO climate science This is a short summary of a detailed discussion of climate change science. For more information and to view the full report, visit royalsociety.org/policy/climate-change
The Oceans Role in Climate
 The Oceans Role in Climate Martin H. Visbeck A Numerical Portrait of the Oceans The oceans of the world cover nearly seventy percent of its surface. The largest is the Pacific, which contains fifty percent
Chapter 3 Communities, Biomes, and Ecosystems
 Communities, Biomes, and Ecosystems Section 1: Community Ecology Section 2: Terrestrial Biomes Section 3: Aquatic Ecosystems Click on a lesson name to select. 3.1 Community Ecology Communities A biological
PMEL Press Releases and NOAA News Stories FY09- FY14
 PMEL Press Releases and NOAA News Stories FY09- FY14 PMEL WIDE Oceanographer named to head NOAA s Seattle research laboratory http://www.noaanews.noaa.gov/stories2011/20111018_pmel.html CLIMATE THEME most
The Earth System. The geosphere is the solid Earth that includes the continental and oceanic crust as well as the various layers of Earth s interior.
 The Earth System The atmosphere is the gaseous envelope that surrounds Earth. It consists of a mixture of gases composed primarily of nitrogen, oxygen, carbon dioxide, and water vapor. The atmosphere and
FACTS ABOUT CLIMATE CHANGE
 FACTS ABOUT CLIMATE CHANGE 1. What is climate change? Climate change is a long-term shift in the climate of a specific location, region or planet. The shift is measured by changes in features associated
Name Period 4 th Six Weeks Notes 2015 Weather
 Name Period 4 th Six Weeks Notes 2015 Weather Radiation Convection Currents Winds Jet Streams Energy from the Sun reaches Earth as electromagnetic waves This energy fuels all life on Earth including the
Where Will the Polar Bears Go?
 Service Stewardship Where Will the Polar Bears Go? Courtesy Kaathy Crane, NOAA Arctic Research Office Science Protect the Earth The Arctic is one of the least explored places on earth, and is changing
Climate Change on the Prairie:
 Climate Change on the Prairie: A Basic Guide to Climate Change in the High Plains Region - UPDATE Global Climate Change Why does the climate change? The Earth s climate has changed throughout history and
Office of Climate Change, Energy Efficiency and Emissions Trading. Business Plan
 Office of Climate Change, Energy Efficiency and Emissions Trading Business Plan April 1, 2011 - March 31, 2014 Table of Contents Message from the Premier...3 1.0 OVERVIEW...4 2.0 MANDATE...5 3.0 LINES
Seasonal & Daily Temperatures. Seasons & Sun's Distance. Solstice & Equinox. Seasons & Solar Intensity
 Seasonal & Daily Temperatures Seasons & Sun's Distance The role of Earth's tilt, revolution, & rotation in causing spatial, seasonal, & daily temperature variations Please read Chapter 3 in Ahrens Figure
CARBON THROUGH THE SEASONS
 DESCRIPTION In this lesson plan, students learn about the carbon cycle and understand how concentrations of carbon dioxide (CO 2 ) in the Earth s atmosphere vary as the seasons change. Students also learn
http://video.nationalgeographic.com/video/oceans narrated by sylvia earle/oceans overview 71% is covered by the Earth's Ocean
 Chapter 13 Exploring the Oceans Section 1 Earth's Ocean List the major divisions of the global ocean. Describe the history of Earth's oceans Identify the properties of ocean water. Describe the interactions
email: info@arcticeider.com
 Dr. Joel Heath has an extensive background in interdisciplinary studies including a Ph.D. in sea ice ecology and postdoctoral expertise in mathematical biology. He was project leader for one of Canada
Station #1 Interpreting Infographs
 Energy Resources Stations Activity Page # 1 Station #1 Interpreting Infographs 1. Identify and explain each of the energy sources (5) illustrated in the infograph. 2. What do the white and black circles
II. Related Activities
 (1) Global Cloud Resolving Model Simulations toward Numerical Weather Forecasting in the Tropics (FY2005-2010) (2) Scale Interaction and Large-Scale Variation of the Ocean Circulation (FY2006-2011) (3)
AP ENVIRONMENTAL SCIENCE 2010 SCORING GUIDELINES
 AP ENVIRONMENTAL SCIENCE 2010 SCORING GUIDELINES Question 4 (a) Based on the rate cited above, calculate the expected increase in sea level, in meters, during the next 50 years. One point can be earned
The Polar Climate Zones
 The Polar Climate Zones How cold is it in the polar climate? Polar areas are the coldest of all the major climate zones The Sun is hardly ever high enough in the sky to cause the plentiful ice to melt,
Biomes An Overview of Ecology Biomes Freshwater Biomes
 Biomes An Overview of Ecology Ecology is the scientific study of the interactions between organisms and their environments. Ecology can be divided into four increasingly comprehensive levels: Organismal
How Do Oceans Affect Weather and Climate?
 How Do Oceans Affect Weather and Climate? In Learning Set 2, you explored how water heats up more slowly than land and also cools off more slowly than land. Weather is caused by events in the atmosphere.
New Brunswick s Flood Risk Reduction Strategy. Province of New Brunswick PO 6000, Fredericton NB E3B 5H1. www.gnb.ca
 New Brunswick s Flood Risk Reduction Strategy i New Brunswick s Flood Risk Reduction Strategy Province of New Brunswick PO 6000, Fredericton NB E3B 5H1 2014 www.gnb.ca ISBN 978-1-4605-0533-5 (print edition)
Climate Change Long Term Trends and their Implications for Emergency Management August 2011
 Climate Change Long Term Trends and their Implications for Emergency Management August 2011 Overview A significant amount of existing research indicates that the world s climate is changing. Emergency
Marine Protected Areas POLICY
 Marine Protected Areas POLICY Canada March 1999 Published by: Canada Marine Ecosystems Conservation Branch Oceans Directorate Ottawa, ON K1A 0E6 DFO / 5870 Minister of Public Works and Government Service
8.5 Comparing Canadian Climates (Lab)
") These 3 climate graphs and tables of data show average temperatures and precipitation for each month in Victoria, Winnipeg and Whitehorse: Figure 1.1 Month J F M A M J J A S O N D Year Precipitation 139
These 3 climate graphs and tables of data show average temperatures and precipitation for each month in Victoria, Winnipeg and Whitehorse: Figure 1.1 Month J F M A M J J A S O N D Year Precipitation 139
Ocean Floor Continental Slope Begins at the Continental Shelf Very sharp drop to depths over 2 miles Covered with thick layers of sand, mud, and rocks
 Ocean Floor Continental Shelf Begins at the shoreline Gently slopes underwater Average depth of 430 feet Thick layers of sand, mud, and rocks The beach is part of the Continental Shelf Ocean Floor Continental
USING BIG DATA, SCENARIOS DEVELOPMENT, AND GAME THEORY TO MONITOR, UNDERSTAND AND ADAPT TO CLIMATE CHANGE IN THE CIRCUMPOLAR ARCTIC
 USING BIG DATA, SCENARIOS DEVELOPMENT, AND GAME THEORY TO MONITOR, UNDERSTAND AND ADAPT TO CLIMATE CHANGE IN THE CIRCUMPOLAR ARCTIC Magdalena A K Muir 1 1. Introduction Adaptation to climate change in
1) Summary of work performed and progress made during preceding month
 Summary of work performed and progress made during preceding month") Mapping and Characterization of Recurring Spring Leads and Landfast Ice in the Chukchi and Beaufort Seas, Coastal Marine Institute Project (NOFA MMS09HQPA0004T) Monthly progress report, June 2010 1) Summary
Mapping and Characterization of Recurring Spring Leads and Landfast Ice in the Chukchi and Beaufort Seas, Coastal Marine Institute Project (NOFA MMS09HQPA0004T) Monthly progress report, June 2010 1) Summary
Offshore development benefits. www.shell.us/alaska
 8 C H A P T E R E i g h t: Offshore development benefits www.shell.us/alaska Barrow, Alaska The Ripples of Offshore Development Benefits Energy production has done much for Alaskans previously, and by
Safety Challenges in the Arctic
 Safety Challenges in the Arctic International Conference on Integrated Operations in the Petroleum Industry Trondheim, 25.09.13 Børre Johan Paaske, DNV GL Agenda Defining the Arctic Safety and environmental
Global Water Resources
 Global Water Resources Highlights from assessment activities over the past two decades, which are used to establish present and future water trends, reveal that: 1. Freshwater resources are unevenly distributed,
Generating Current Electricity: Complete the following summary table for each way that electrical energy is generated. Pros:
 P a g e 1 Generating Current Electricity: Complete the following summary table for each way that electrical energy is generated. Generating Electrical Energy Using Moving Water: Hydro-Electric Generation
WEATHER AND CLIMATE practice test
 WEATHER AND CLIMATE practice test Multiple Choice Identify the choice that best completes the statement or answers the question. 1. What role does runoff play in the water cycle? a. It is the process in
6 th Grade Science Assessment: Weather & Water Select the best answer on the answer sheet. Please do not make any marks on this test.
 Select the be answer on the answer sheet. Please do not make any marks on this te. 1. Weather is be defined as the A. changes that occur in cloud formations from day to day. B. amount of rain or snow that
SECTION 3.2 CLIMATE AND PRECIPITATION
 SECTION 3.2 CLIMATE AND PRECIPITATION Ulster County Climate Data A preliminary analysis of the Preserve s weather data shows that the average temperature has risen about two degrees over the past 114 years.
Inuvialuit Settlement Region Community-Based Monitoring Program (ISR-CBMP): Community-Driven Monitoring of Locally Important Natural Resources
: Community-Driven Monitoring of Locally Important Natural Resources") Inuvialuit Settlement Region Community-Based Monitoring Program (ISR-CBMP): Community-Driven Monitoring of Locally Important Natural Resources Submitted to the Arctic Observing Summit 2013 Vancouver, Canada
Inuvialuit Settlement Region Community-Based Monitoring Program (ISR-CBMP): Community-Driven Monitoring of Locally Important Natural Resources Submitted to the Arctic Observing Summit 2013 Vancouver, Canada
CLIMATE ACTION IN BRITISH COLUMBIA 2014 PROGRESS REPORT
 CLIMATE ACTION IN BRITISH COLUMBIA 2014 PROGRESS REPORT B.C. is continuing to work towards an economy that is prepared for climate change, and helping to reduce greenhouse gas emissions on a global scale.
Southern AER Atmospheric Education Resource
 Southern AER Atmospheric Education Resource Vol. 9 No. 5 Spring 2003 Editor: Lauren Bell In this issue: g Climate Creations exploring mother nature s remote control for weather and Climate. g Crazy Climate
Geoscientists follow paths of exploration and discovery in quest of solutions to some of society's most challenging problems.
 Page 1 of 5 Geoscientists follow paths of exploration and discovery in quest of solutions to some of society's most challenging problems. Predicting the behavior of Earth systems and the universe. Finding
Communities, Biomes, and Ecosystems
 Communities, Biomes, and Ecosystems Before You Read Before you read the chapter, respond to these statements. 1. Write an A if you agree with the statement. 2. Write a D if you disagree with the statement.
WEATHERING, EROSION, AND DEPOSITION PRACTICE TEST. Which graph best shows the relative stream velocities across the stream from A to B?
 NAME DATE WEATHERING, EROSION, AND DEPOSITION PRACTICE TEST 1. The diagram below shows a meandering stream. Measurements of stream velocity were taken along straight line AB. Which graph best shows the
Facts on Arctic Climate Change
 Facts on Arctic Climate Change A Summary of the Arctic Climate Impact Assessment ARCTIC CLIMATE CHANGE will not only affect local people and ecosystems but also the rest of the world, because the Arctic
Fresh Ideas, New Frontiers
 Fresh Ideas, New Frontiers Center for Earth System Research and Sustainability at Universität Hamburg Preface Core Issues and Research Program 2020 Fresh Ideas, New Frontiers Thinking outside the box to
Straits of Mackinac Contaminant Release Scenarios: Flow Visualization and Tracer Simulations
 Straits of Mackinac Contaminant Release Scenarios: Flow Visualization and Tracer Simulations Research Report for the National Wildlife Federation Great Lakes Regional Center By David J. Schwab, Ph.D.,
CHAPTER 5 Lectures 10 & 11 Air Temperature and Air Temperature Cycles
 CHAPTER 5 Lectures 10 & 11 Air Temperature and Air Temperature Cycles I. Air Temperature: Five important factors influence air temperature: A. Insolation B. Latitude C. Surface types D. Coastal vs. interior
STATE UNIVERSITY OF NEW YORK COLLEGE OF TECHNOLOGY CANTON, NEW YORK COURSE OUTLINE ESCI 101 - INTRODUCTION TO ENVIRONMENTAL SCIENCE
 STATE UNIVERSITY OF NEW YORK COLLEGE OF TECHNOLOGY CANTON, NEW YORK COURSE OUTLINE ESCI 101 - INTRODUCTION TO ENVIRONMENTAL SCIENCE Prepared By: Rajiv Narula, Ph.D. SCHOOL OF SCIENCE, HEALTH, AND CRIMINAL
GETTING TO THE CORE: THE LINK BETWEEN TEMPERATURE AND CARBON DIOXIDE
 DESCRIPTION This lesson plan gives students first-hand experience in analyzing the link between atmospheric temperatures and carbon dioxide ( ) s by looking at ice core data spanning hundreds of thousands
CHAPTER 2 Energy and Earth
 CHAPTER 2 Energy and Earth This chapter is concerned with the nature of energy and how it interacts with Earth. At this stage we are looking at energy in an abstract form though relate it to how it affect
Georgia Performance Standards Framework for Natural Disasters 6 th Grade
 The following instructional plan is part of a GaDOE collection of Unit Frameworks, Performance Tasks, examples of Student Work, and Teacher Commentary. Many more GaDOE approved instructional plans are
Phosphorus and Sulfur
 Global Change Instruction Program Phosphorus and Sulfur The Important Nutrient Phosphorus Phosphorus is a key nutrient, fueling organic productivity on land and in water. A portion of its cycle is shown
Clouds and the Energy Cycle
 August 1999 NF-207 The Earth Science Enterprise Series These articles discuss Earth's many dynamic processes and their interactions Clouds and the Energy Cycle he study of clouds, where they occur, and
6.4 Taigas and Tundras
 6.4 Taigas and Tundras In this section, you will learn about the largest and coldest biomes on Earth. The taiga is the largest land biome and the tundra is the coldest. The taiga The largest land biome
Future needs of remote sensing science in Antarctica and the Southern Ocean: A report to support the Horizon Scan activity of COMNAP and SCAR
 Future needs of remote sensing science in Antarctica and the Southern Ocean: A report to support the Horizon Scan activity of COMNAP and SCAR Thomas Wagner (thomas.wagner@nasa.gov) Charles Webb NASA Cryospheric
Climate of Illinois Narrative Jim Angel, state climatologist. Introduction. Climatic controls
 Climate of Illinois Narrative Jim Angel, state climatologist Introduction Illinois lies midway between the Continental Divide and the Atlantic Ocean, and the state's southern tip is 500 miles north of
Energy Outlook: U.S. Arctic Outer Continental Shelf
 Alaska OCS Region Energy Outlook: U.S. Arctic Outer Continental Shelf 5th Symposium on the Impacts of an Ice-Diminishing Arctic on Naval and Maritime Operations July 16-18, 2013 Washington, D. C. Sharon
Solar Flux and Flux Density. Lecture 3: Global Energy Cycle. Solar Energy Incident On the Earth. Solar Flux Density Reaching Earth
 Lecture 3: Global Energy Cycle Solar Flux and Flux Density Planetary energy balance Greenhouse Effect Vertical energy balance Latitudinal energy balance Seasonal and diurnal cycles Solar Luminosity (L)
Amherst County Public Schools. AP Environmental Science Curriculum Pacing Guide. College Board AP Environmental Science Site
 Amherst County Public Schools AP Environmental Science Curriculum Pacing Guide College Board AP Environmental Science Site REV: 8/12 1 st 9 weeks AP Objectives Energy Resources and Consumption A. Energy
The Water Cycle Now You See It, Now You Don t
 The Water Cycle Now You See It, Now You Don t Unit: Salinity Patterns & the Water Cycle l Grade Level: Elementary l Time Required: Introduction - 30 min. - Activity as groups 45min Wrap Up 20 min l Content
Communities, Biomes, and Ecosystems
 Chapter Test A CHAPTER 3 Communities, Biomes, and Ecosystems Part A: Multiple Choice In the space at the left, write the letter of the term or phrase that best answers each question Part B: Matching 1
THE SOLAR SYSTEM - EXERCISES 1
 THE SOLAR SYSTEM - EXERCISES 1 THE SUN AND THE SOLAR SYSTEM Name the planets in their order from the sun. 1 2 3 4 5 6 7 8 The asteroid belt is between and Which planet has the most moons? About how many?
SIXTH GRADE WEATHER 1 WEEK LESSON PLANS AND ACTIVITIES
 SIXTH GRADE WEATHER 1 WEEK LESSON PLANS AND ACTIVITIES WATER CYCLE OVERVIEW OF SIXTH GRADE WATER WEEK 1. PRE: Evaluating components of the water cycle. LAB: Experimenting with porosity and permeability.
Gray Whales on the Move
 Gray Whales on the Move Students trace the migration route of a gray whale and discover the gray whale s natural history. Subjects Science GRADE LEVEL Grades 6 8 TIME 60 minutes OBJECTIVES Students will
Costs of Global Warming for Alaska s Public Infrastructure
 Costs of Global Warming for Alaska s Public Infrastructure CONTEXT A warming climate results in: Thawing ground Undermining foundations of buildings, roads and runways Retreating sea ice Increasing coastal
The Ice Age By: Sue Peterson
 www.k5learning.com Objective sight words (pulses, intermittent, isotopes, chronicle, methane, tectonic plates, volcanism, configurations, land-locked, erratic); concepts (geological evidence and specific
ATM S 111, Global Warming: Understanding the Forecast
 ATM S 111, Global Warming: Understanding the Forecast DARGAN M. W. FRIERSON DEPARTMENT OF ATMOSPHERIC SCIENCES DAY 1: OCTOBER 1, 2015 Outline How exactly the Sun heats the Earth How strong? Important concept
Coral Reefs Lecture Notes
 Coral Reefs Lecture Notes (Topic 10D) page 1 Coral Reefs Lecture Notes Corals Polyps & Zooxanthellae Coral Polyps Are coral polyps algae or animals? Description (What do coral polyps look like? Make a
It s hard to avoid the word green these days.
 Going green : Environmental jobs for scientists and engineers Alice Ramey Alice Ramey is an economist in the Office of Occupational Statistics and Employment Projections, BLS. She is available at (202)
Section 1 The Earth System
 Section 1 The Earth System Key Concept Earth is a complex system made up of many smaller systems through which matter and energy are continuously cycled. What You Will Learn Energy and matter flow through
Earth Sciences -- Grades 9, 10, 11, and 12. California State Science Content Standards. Mobile Climate Science Labs
 Earth Sciences -- Grades 9, 10, 11, and 12 California State Science Content Standards Covered in: Hands-on science labs, demonstrations, & activities. Investigation and Experimentation. Lesson Plans. Presented
Creating the Economy of Tomorrow
 Creating the Economy of Tomorrow JUNE 2009 Creating the Economy of Tomorrow JUNE 2009 Government of Canada Gouvernement du Canada Her Majesty the Queen in Right of Canada (2009) All rights reserved All
Fundamentals of Climate Change (PCC 587): Water Vapor
: Water Vapor") Fundamentals of Climate Change (PCC 587): Water Vapor DARGAN M. W. FRIERSON UNIVERSITY OF WASHINGTON, DEPARTMENT OF ATMOSPHERIC SCIENCES DAY 2: 9/30/13 Water Water is a remarkable molecule Water vapor
Fundamentals of Climate Change (PCC 587): Water Vapor DARGAN M. W. FRIERSON UNIVERSITY OF WASHINGTON, DEPARTMENT OF ATMOSPHERIC SCIENCES DAY 2: 9/30/13 Water Water is a remarkable molecule Water vapor
CLIMATE, WATER & LIVING PATTERNS THINGS
 CLIMATE, WATER & LIVING PATTERNS NAME THE SIX MAJOR CLIMATE REGIONS DESCRIBE EACH CLIMATE REGION TELL THE FIVE FACTORS THAT AFFECT CLIMATE EXPLAIN HOW THOSE FACTORS AFFECT CLIMATE DESCRIBE HOW CLIMATES
THE ECOSYSTEM - Biomes
 Biomes The Ecosystem - Biomes Side 2 THE ECOSYSTEM - Biomes By the end of this topic you should be able to:- SYLLABUS STATEMENT ASSESSMENT STATEMENT CHECK NOTES 2.4 BIOMES 2.4.1 Define the term biome.
Reflection of Sunlight by Snow: Contribution to Earth s Energy Budget. Stephen Warren University of Washington, Seattle
 Reflection of Sunlight by Snow: Contribution to Earth s Energy Budget Stephen Warren University of Washington, Seattle Presentation to Congressional delegation, Ilulissat, Greenland, 20 July 2007 Sunlight
Chapter 6: Cloud Development and Forms
 Chapter 6: Cloud Development and Forms (from The Blue Planet ) Why Clouds Form Static Stability Cloud Types Why Clouds Form? Clouds form when air rises and becomes saturated in response to adiabatic cooling.
Integrated Ocean Management Plan for the Beaufort Sea: 2009 and beyond
 Integrated Ocean Management Plan for the Beaufort Sea: 2009 and beyond Beaufort Sea Partnership Integrated Ocean Management Plan (IOMP) for the Beaufort Sea: 2009 and Beyond 2009 Beaufort Sea Planning
Adaptive Management Measures under the Canadian Environmental Assessment Act
 Operational Policy Statement Adaptive Management Measures under the Canadian Environmental Assessment Act Purpose This operational policy statement (OPS) provides best practice guidance on the use of adaptive
Changing Clouds in a Changing Climate: Anthropogenic Influences
 Changing Clouds in a Changing Climate: Anthropogenic Influences Joel Norris Assistant Professor of Climate and Atmospheric Sciences Scripps Institution of Oceanography Global mean radiative forcing of
Chapter 18 Introduction to. A f r i c a
 Chapter 18 Introduction to A f r i c a Ch. 18:1 Landforms & Resources 1. Africa s shape & landforms are the result of its location in the southern part of the ancient supercontinent of. Pangaea Over thousands
Conclusions Based on 3-Years of Tropospheric Ozone Measurements Co-located at AWS Sites
 Conclusions Based on 3-Years of Tropospheric Ozone Measurements Co-located at AWS Sites Mark W. Seefeldt Cooperative Institute for Research in Environmental Sciences (CIRES) University of Colorado Boulder
Why Demographic Data are not Up to the Challenge of Measuring Climate Risks, and What to do about it. CIESIN Columbia University
 UN Conference on Climate Change and Official Statistics Oslo, Norway, 14-16 April 2008 Why Demographic Data are not Up to the Challenge of Measuring Climate Risks, and What to do about it CIESIN Columbia
Larry Hartig Commissioner Alaska Department of Environmental Conservation February 26, 2008
 Larry Hartig Commissioner Alaska Department of Environmental Conservation February 26, 2008 Arctic average temperature has risen at almost twice the rate as the rest of the world in the past few decades.
Climate Lingo Bingo. Climate Discovery: Climate Future. http://.eo.ucar.edu. Teacher s Guide. National Science Content Standards Addressed:
 Climate Discovery: Climate Future Climate Lingo Bingo Teacher s Guide http://.eo.ucar.edu Subject Focus: Earth Science Environmental Science Political Science and Social Studies Materials & Preparations:
Basics. this is a form of solar energy, as the sun drives water evaporation from the ocean and winds carry the moisture overland
 Hydropower Basics this is a form of solar energy, as the sun drives water evaporation from the ocean and winds carry the moisture overland largest form of alternative energy used today (but only 2% of