London Avenue Canal I-Wall Load Test
|
|
|
- Teresa Simpson
- 3 years ago
- Views:
Transcription
1 /ETL pdf The Corps is performing additional evaluation of the I-walls along the 17 th, Orleans and London outfall canals to address the 2011 ETL. As of June 11, 2013, the new evaluation reports have not been finalized. Any reference to this report should include this notice.
2 US Army Corps of Engineers LAKE PONTCHARTRAIN AND VICINITY HURRICANE PROTECTION PROJECT LONDON AVENUE CANAL ORLEANS PARISH, LOUISIANA MOWL for London Avenue Canal Prepared for: Hurricane Protection Office (HPO) U.S. Army Corps of Engineers Prepared by: ECM-GEC Joint Venture In association with Black & Veatch Special Projects Corporation Ray E. Martin, LLC Revised Final March, 2011
3 TABLE OF CONTENTS 1.0 EXECUTIVE SUMMARY INTRODUCTION HURRICANE KATRINA THE OUTFALL CANALS PURPOSE OF REPORT ENHANCED QA/QC OF SUPPORTING DATA AND PEER REVIEW OF THIS REPORT HISTORY OF OUTFALL CANALS STANDARD PROJECT HURRICANE AND DESIGN TOP OF FLOOD WALLS OUTFALL CANAL FAILURES POST HURRICANE KATRINA ACTIONS IPET Findings Interim Safe Water Elevations Interim Closure Structures Design Of Outfall Canals To Withstand A SWE Of El 8 NAVD PROJECT GUIDELINES AND METHODOLOGY SHEAR STRENGTH VERSUS DEPTH RELATIONSHIPS SURVEYS CANAL BASE CONDITIONS MAXIMUM SAFE WATER ELEVATIONS Guideline Methodology I-WALLS - HEIGHT, MINIMUM SHEET PILE PENETRATION, AND MINIMUM SHEET PILE PENETRATION RATIO Guidelines Methodology I-WALLS - GAP ANALYSIS Guidelines Methodology I-WALLS - GLOBAL STABILITY Guidelines Methodology I-WALLS - FAILURE PLANE THROUGH SHEET PILE Guidelines Methodology I-WALLS - WALL STABILITY Guidelines Methodology March 2011 LAKE PONTCHARTRAIN AND VICINTY HURRICANE PROTECTION PROJECT Pg. 1
4 4.10 I-WALLS-PIEZOMETRIC SURFACE Guidelines Methodology T-WALLS-EMBANKMENT STABILITY Guidelines Methodology PIPING ANALYSIS Guidelines Methodology GEOLOGY PHYSIOGRAPHY REGIONAL AND LOCAL GEOLOGY GEOTECHNICAL CONSIDERATIONS EXISTING STRUCTURES AND GROUND SURFACE GRADES Floodwall Top Grades And Levee Crest Grades Sheet Pile Tip Elevations Pump Stations Canal, Levees And Protected Side Grades GEOTECHNICAL INVESTIGATIONS Pre-Katrina Investigations Post Katrina Investigations Borings Cone Penetration Tests Vane Shear Tests SUBSURFACE CONDITIONS Recent Canal Sediments Fill Clays M a r s h C l a ys Intradelta Silts and Sands and Prodelta Clays Barrier Beach Sands Bay Sound Clays Pleistocene Clays SOIL AND GEOLOGIC PROFILES AND CROSS SECTIONS LABORATORY AND IN-SITU TESTING Design Memorandum 19a Recent Laboratory and In-situ Testing Grain Size And Moisture Contenet Permeability Shear Strenghts And Unit Weights DESIGN PERMEABILITY VALUES March 2011 LAKE PONTCHARTRAIN AND VICINTY HURRICANE PROTECTION PROJECT Pg. 2
5 6.6.1 Validation Of ERDC Permeability Recommendations London Avenue Canal Pump Test Permeability Data For Poorly Graded Sand London Avenue Canal Pemability Of Poorly Graded Sand On Correlations With Grain Size Data London Avenue Load Test In Site Falling Head Permability Test for Silty Sand London Avenue In Situ Falling Head Permability Test for Silty Sand London Avenue Canal Permeability Of Sily Sand Based On Correlations Grain Size Data London Avenue Canal Permeability Of Canal Bottom Sediments Based On Correlations With Grain Size Data DESIGN SHEAR STRENGTH AND UNIT WEIGHT VALUES LONDON AVENUE CANAL I-WALL LOAD TEST Load Test Description And Preliminary Results Recent Analyses Of London Load Test Results POST KATRINA STABILITY AND SEEPAGE ANALYSES PROCEDURES LEVEE REACHES Reach Definitions Reach Geometry And Geotechnical Properties EXISTING SAFE WATER CONDITIONS EXISTING SAFE WATER CONDITIONS ANALYSIS Global Stability Gap Analysis I-Wall Rotation T-Wall and L-Wall Stability Pump Station Wall Stability Pump Station Sliding Stability Seepage Analysis Canal Bottom Sediments Analysis Canal Piezometer Seepage Analysis Canal Seepage Analysis SUMMARY OF MOWL IMPACT TO CURRENT OPERATIONS REFERENCES GENERAL REFERNCES US ARMY CORPS OF ENGINEERS PUBLICATIONS SOFTWARE OTHER REFERENCES March 2011 LAKE PONTCHARTRAIN AND VICINTY HURRICANE PROTECTION PROJECT Pg. 3
6 APPENDICES APPENDIX A Subsurface Exploration Data, Reach Geotechnical Data, Subsurface Exploration Plans, Profiles, Cross Sections, and Survey Cross Sections APPENDIX A.1 London Avenue Canal Subsurface Exploration Locations Table A.1-1 Boring Locations Table A.1-2 Cone Penetration Test Locations Table A.1-3 Vane Shear Test Locations APPENDIX A.2 London Avenue Canal Base Sampling Data Table A.2-1 Summary of Canal Base Stratigraphy and Laboratory Testing APPENDIX A.3 London Avenue Canal Reach Data APPENDIX A.4 PLATES Plates 1 thru 10 London Avenue Canal Plan and Reach Locations Plates 11 through 30 East Bank Geologic Profiles Plates 31 through 50 West Bank Geologic Profiles Plates 51 through 60 Canal Centerline Profiles Plates 61 through 72 Soil and Geologic Cross-Sections Plates 73 through 90 Survey Cross Sections APPENDIX B Soil Strengthlines Plots APPENDIX C 2010 Topographic Survey Calculations APPENDIX D SWE Calculations APPENDIX D.1 MOP Global Stability APPENDIX D.2 MOP Gap Analysis Stability Adjustments to MOP Stability Analysis to Accommodate the New Gap Analysis Procedures APPENDIX D.3 SLOPE/W and SEEP/W Analyses APPENDIX D.4 Existing SWE T-Walls and L-Wall March 2011 LAKE PONTCHARTRAIN AND VICINTY HURRICANE PROTECTION PROJECT Pg. 4
7 T-Wall Replacement at South Breach near Mirabeau Ave T-Wall Replacement at North Breach near Robert E. Lee Blvd. L-Wall Replacement at North Deflected Section near Robert E. Lee Blvd APPENDIX D.5 Existing SWE Pump House Walls APPENDIX D.6 Pump Station Stability APPENDIX D.7 CWALSHT Analyses APPENDIX D.8 Open Canal Seepage Analysis Figures D.8-1 through D.8-9 APPENDIX E SSI Gap Analysis APPENDIX F References (See DVD) APPENDIX G Canal East and West Side Baseline Coordinates APPENDIX H Reach Comparisons APPENDIX I Potential Impacts of Future Activities March 2011 LAKE PONTCHARTRAIN AND VICINTY HURRICANE PROTECTION PROJECT Pg. 5
8 TABLES Table 1-1 LEVEE REACH LOCATIONS Table 1-2 REACH MOWL VALUES FOR I-WALLS AND EARTH LEVEES Table 1-3 REACH MOWL VALUES FOR T-WALLS, L-WALL., DPS3 AND DPS Table 6-1 ORIGINAL "AS-BUILT" REACHES [11] Table 6-2 DISTRIBUTION OF TEST BORINGS Table 6-3 DISTRIBUTION OF CONE PENETRATION AND VANE SHEAR TEST Table 6-4 ERDC RECOMMENDED LONDON AVENUE CANAL MATERIAL PERMEABILITIES Table 6-5 AVERAGE PERMABILITY VALUES OBTAINED IN SILTY SAND STRATUM FROM IN-SITU FALLING HEAD TESTS Table 6-6 LEVEE REACH LOCATIONS Table 7-1 GLOBAL STABILITY MOWLS AND FACTORS OF SAFETY FOR I WALLS WITHIN LEVEES AND FOR LEVEES WITHOUT I-WALLS Table 7-2 GAP STABILITY MOPWLS AND FACTORS OF SAFETY FOR I-WALLS Table 7-3 LONDON AVENUE CANAL WALL STABILITY Table 7-4 CWALSHT STABILITY ANALYSIS OF I-WALLS, CASE "A" Table 7-5 STABILITY MOWLS AND FACTORS OF SAFETY T WALLS AND L-WALL Table 7-6 CANAL SEMI-IMPERVIOUS BLANKET THICKNESS AND RANGE OF FINES CONTENT Table 7-7 BEACH SAND PIEZOMETER LOCATIONS Table 7-8 CANAL BOTTOM SEEPAGE EVALUATION Table 7-9 SEEPAGE ANALYSIS RESULTS Table 7-10 LANE WEIGHTED CREEP RATIO FOR T-WALLS OR L-WALL Table 7-11 REACH MOWL VALUES FOR I-WALLS AND EARTH LEVEES Table 7-12 REACH MOWL VALUES FOR T-WALLS, L-WALLS, DPS3 AND DPS March 2011 LAKE PONTCHARTRAIN AND VICINTY HURRICANE PROTECTION PROJECT Pg. 6
9 FIGURES Figure 2-1 LOCATION OF OUTFALL CANALS [1] Figure 3-1 LOCATIONS OF LONDON AVENUE OUTFALL CANAL FAILURES Figure 4-1 SHEET PILE PENETRATION CRITERIA DEFINITIONS Figure 5-1 PINE ISLAND BARRIER BEACH AND BAYOU SAVAGE (METAIRIE) DISTRIBUTARY CHANNEL WITH LONDON AVENUE CANAL FAILURE AREAS SHOWN AS BLUE BOXES [1] Figure 5-2 HOLOCENE DELTAS OF THE MISSISSIPPI RIVER (14) Figure 6-1 Figure 6-2 Figure 6-3 Figure 6-4 ESTIMATED PERMEABILITY VALUES- POORLY GRADED BEACH SAND (SP) FROM LEVEE AND PROTECTED SIDE TOE BORINGS ESTIMATED PERMEABILITY VALUES- POORLY GRADED BEACH SAND (SP) FROM CANAL BORINGS ESTIMATED PERMEABILITY VALUES- SILTY BEACHES SAND (SM) FROM LEVEE AND PROTECTED SIDE TOE BORINGS ESTIMATED PERMEABILITY VALUES- CANAL BOTTOM SEDIMENTS FROM CANAL BORINGS Figure 6-5 LONDON AVENUE I-WALL LOAD CROSS SECTION [11] Figure 7-1 SEEPAGE MOWL LONDON AVENUE CANAL EAST BANK Figure 7-2 STABILITY MOWL LONDON AVENUE CANAL EAST BANK Figure 7-3 PENETRATION RATIO MOWL LONDON AVENUE CANAL EAST BANK Figure 7-4 HEIGHT OF WATER ON WALL MOWL LONDON AVENUE CANAL EAST BANK Figure 7-5 OVERALL MOWL LONDON AVENUE CANAL EAST BANK Figure 7-6 SEEPAGE MOWL LONDON AVENUE CANAL WEST BANK Figure 7-7 STABILITY MOWL LONDON AVENUE CANAL WEST BANK Figure 7-8 PENETRATION RATIO MOWL LONDON AVENUE CANAL WEST BANK Figure 7-9 HEIGHT OF WATER ON WALL MOWL LONDON AVENUE CANAL WEST BANK Figure 7-10 OVERALL MOWL LONDON AVENUE CANAL WEST BANK March 2011 LAKE PONTCHARTRAIN AND VICINTY HURRICANE PROTECTION PROJECT Pg. 7
10 1.0 EXECUTIVE SUMMARY Some of the most severe flooding in the City of New Orleans in the aftermath of Hurricane Katrina was caused by the failure of the parallel protection systems on two of the three major outfall canals that discharge the City s storm water. These open canals connect pump stations located several miles inland to Lake Pontchartrain to the north of the City. Because the outfall canals were open to Lake Pontchartrain, the design of the canals had to consider the water levels in the Lake. Each canal consists of a combination of earthen levees and/or floodwalls that rise above the surrounding protected ground surface to accommodate a high water level in the canal during pumping and during high-water events in the Lake. The storm surge from Hurricane Katrina moved up the canals and the resulting high water levels ultimately caused structural failure of the floodwalls on the 17 th Street Canal and the London Avenue Canal. The third outfall canal, the Orleans Avenue Canal, did not experience failure. Immediately following Katrina, the U.S. Army Corps of Engineers (Corps) commenced the design and construction of Interim Closure Structures at the mouths of each of the three outfall canals to essentially isolate water levels in the canals from water levels in the Lake. To permit the City s storm water removal system to continue to function, pumps were added at the interim closure structures to pump water from the canals into the Lake. The interim closure system, therefore, currently requires double pumping storm water is pumped into the canals by the City s original pump stations and subsequently pumped from the canals into the Lake by the interim pump stations installed after Hurricane Katrina Because it is believed that sustained high water levels in the canals ultimately contributed to the failure of the flood protection system, concerns by all stakeholders remained regarding the safe water level that the canal walls could sustain during interim pumping. As a result of preliminary technical analysis of the repaired floodwalls, the Corps established interim Maximum Operating Water Levels (MOWLs) for each canal. For the London Avenue Canal, the MOWL was established at El 4 North America Vertical Datum 1988 (NAVD88). It is generally believed that this elevation could be exceeded if the pump stations were operated at or near capacity. At the same time, it was recognized that if the pumping systems were not operated at full capacity, there was a distinct danger that the City would flood. In response to this dilemma, the Corps New Orleans District, Hurricane Protection Office (HPO) requested a study for the London Avenue Canal to determine a MOWL that could be sustained for the flood control levees/floodwalls along both sides of the canal from Drainage Pump Station 3 (DPS 3) north to the Interim Control Structure (ICS) near Lake Pontchartrain. This report was prepared using Corps design and analysis procedures, specifically those based on the gap stability analysis methodology titled, Stability Analysis of I-walls Containing Gaps between the I-wall and Backfill Soils [7], and the Hurricane and Storm Damage Risk Reduction System Design Guidelines (HSDRRSDG) [4]. March 2011 LAKE PONTCHARTRAIN AND VICINTY HURRICANE PROTECTION PROJECT Pg. 8
11 The London Avenue Canal parallel protection system consists of low earthen levees with floodwalls to provide additional protection. In the northern reaches of the Canal, high earthen levees without floodwalls are used. Floodwalls consist of I-walls along the reaches of the canal defined in Table 1-1. The floodwall and earthen levee reaches along the London Avenue Canal are defined in Table 1-1. Along the London Avenue Canal, two areas of I-walls failed and one was distressed during Hurricane Katrina. All three of these I-wall sections were replaced using T-walls and an L-wall. The locations of these replacement walls are identified in Table 1-1. The MOWL for each reach is tabulated in Table 1-2 and is compared to design criteria using each of the following individual analysis protocols: 1) stability using Spencer s Method; 2) stability using the Method of Planes; 3) minimum sheet pile penetration; 4) sheetpile penetration ratio; 5) maximum water level on exposed wall; 6) sheetpile wall stability; and 7) seepage The elevations in bold identify the controlling criteria in areas where the calculation results were below El 10 NAVD88. The lowest MOWLs were identified in areas where the semi-impervious canal sediments are either thin or the underlying beach sand stratum is exposed to direct hydraulic connection with the canal water. The seepage-related MOWLs below El 10 NADV88 are influenced by the gap penetrating through the marsh clay stratum into the underlying beach sand stratum. The maximum allowable water height of 4 feet on the I-wall controls the remaining MOWLs, except in two reaches in which the maximum allowable water height is controlled by stability. Table 1-3 provides a summary of the factors of safety and deflections for the T-walls, L-wall and DPS 3 and DPS 4. Figures 7-1 through 7 5 in the body of the text provide the calculated MOWLs for each criterion along east bank of the canal. Figures 7-6 through 7-10 in the body of the text provides calculated MOWLs for each criterion along the west bank of the canal. March 2011 LAKE PONTCHARTRAIN AND VICINTY HURRICANE PROTECTION PROJECT Pg. 9
12 WEST REACH WALL TYPE OR LEVEE TABLE 1-1 LEVEE REACH LOCATIONS WEST BASELINE APPROXIMATE STATION EAST REACH WALL TYPE OR LEVEE EAST BASELINE APPROXIMATE STATION 1 I-wall 2+44 to I-wall 1+57 to I-wall to I-wall 6+30 to GENTILLY BRIDGE to I-wall to I-wall to GENTILLY BRIDGE to I-wall to I-wall to I-wall to I-wall to I-wall to I-wall to A I-wall to I-wall to B I-wall to A I-wall to I-wall to B I wall to I-wall to I-wall to MIRABEAU BRIDGE to I-wall to I-wall to MIRABEAU BRIDGE to I-wall to I-wall to I-wall to T-wall to FILMORE BRIDGE to I-wall to A I-wall to I-wall to B I-wall to FILMORE BRIDGE to I-wall to I-wall to I-wall to I-wall to I wall to I-wall to I-wall to PUMPING STATION NO to T-wall to A I-wall to I wall to B I-wall to ROBERT E LEE BRIDGE to L-wall to A Levee to ROBERT E LEE BRIDGE to B Levee to I-wall to LEON C SIMON BRIDGE to LEON C. SIMON BRIDGE to Levee to Levee to March 2011 LAKE PONTCHARTRAIN AND VICINTY HURRICANE PROTECTION PROJECT Pg. 10
13 WEST REACH TABLE 1-2 REACH MOWL VALUES FOR I-WALLS AND EARTH LEVEES STATION MAXIMUM SPENCER S MOP SLOPE SHEET PILE 4 FT METHOD MINIMUM STABILITY PENETRATION WATER SLOPE SHEET PILE CWALSHT FOS >1.3 RATIO DEPTH ON STABILITY PENETRATION MOWL MOWL D/H FOS >1.4 D> 10 FEET 1 = 3/1 I-WALL NAVD88 NAVD88 MOWL MOWL NAVD88 NAVD to Yes to Yes to Yes to Yes to Yes A to Yes B to Yes to Yes to Yes to Yes to Yes to Yes A to Yes B to Yes SEEPAGE MOWL NAVD to Yes to Yes to Yes to Yes T-Wall to NA NA NA to Yes A to Yes NA NA B to Yes NA NA to Yes NA NA March 30, 2011 LAKE PONTCHARTRAIN AND VICINTY HURRICANE PROTECTION PROJECT Pg. 11
14 MAXIMUM SPENCER S MOP SLOPE MINIMUM SHEET PILE 4 FT METHOD EAST STABILITY SHEET PILE PENETRATION WATER CWALSHT SEEPAGE STATION SLOPE REACH FOS >1.3 PENETRATION RATIO DEPTH ON MOWL MOWL STABILITY MOWL D> 10 FEET D/H FOS >1.4 1 = 3/1 I WALL NAVD88 NAVD88 NAVD88 MOWL MOWL NAVD88 NAVD to Yes to Yes to Yes to Yes to Yes to Yes A to Yes B to Yes to Yes to Yes to Yes T-Wall to NA NA NA to Yes to Yes to Yes to Yes to Yes A to Yes B to Yes L-Wall to NA NA NA NA to Yes to NA NA NA Notes: D = Depth of sheet pile below the crest of the lowest levee embankment crest. H = Height of water above the crest of the protected side embankment crest. Reaches in Bold have semi-impervious canal sediments less than 2 feet thick or beach sand in the bottom of the canal March 30, 2011 LAKE PONTCHARTRAIN AND VICINTY HURRICANE PROTECTION PROJECT Pg. 12
15 WALL TYPE T-Wall T-Wall L-Wall TABLE 1-3 REACH MOWL VALUES FOR T-WALLS, L-WALL, DPS3 AND DPS4 CANAL SIDE West East East STATION to to to MOWL NAVD88 SPENCER S METHOD FOS MOP FOS DEFLECTION (IN) < < <0.1 DPS3 South DPS4 East to Note: MOWL at DPS 3 is controlled by the top of a wall separating the discharge basin from the bypass canal. March 30, 2011 LAKE PONTCHARTRAIN AND VICINTY HURRICANE PROTECTION PROJECT Pg. 13
16 The analyses in this report indicate that some reaches along the London Avenue Canal have MOWL values lower than the present MOWL of El 5 NAVD88. Any reach with a MOWL below El 8 NAVD88 will be remediated expeditiously based on the most stringent criteria and will follow rigorous methods of analysis. The remainder of this report goes into significant detail to explain the technical aspects of the analyses performed and how engineering judgment was applied as needed. In the next phase, the Corps will pursue further analyses to ensure that the solution selected for the improved levee section fully meets all necessary requirements. March 2011 LAKE PONTCHARTRAIN AND VICINTY HURRICANE PROTECTION PROJECT Pg. 14
17 2.0 INTRODUCTION 2.1 HURRICANE KATRINA Hurricane Katrina (Katrina) moved over the New Orleans (City) area in the early morning hours on Monday, August 29, The storm surge, in advance of the hurricane, caused the water level in Lake Pontchartrain (Lake) to ultimately rise 10 to 12 feet [1] above the normal level of El 1.0 NAVD88. All elevations in this report reference the North American Vertical Datum of 1988 ( ) (NAVD88) unless the National Geodetic Vertical Datum of 1929 (NVGD) is indicated. It is noted that El 0 NAVD88 is equivalent to El 1.5 NGVD. Prior to Katrina, the maximum surge level recorded on the south shore of the Lake was about El 4.0 NAVD88. The maximum rainfall from Katrina was 14 inches over a 24 hour period along the south shore of the Lake. The largest previously recorded rainfall during a 24 hour period was 7 inches [1]. References cited in this report are included in Section THE OUTFALL CANALS Three outfall canals, the London Avenue Canal, the 17 th Street Canal, and the Orleans Avenue Canal, provide discharge of surface water collected from the City storm-runoff systems. The City has been subsiding for many years and continues to subside due to: 1) confinement of the Mississippi River by levees, thus eliminating river sedimentation during high river flows; and 2) pumping of ground water. Since much of the City is now located below sea level, precipitation that falls on the City must be pumped up into the canals for discharge to the Lake. Flow of water from the City is initiated towards the Lake by gravity as the pumping causes the hydraulic grade line to rise. The canals were designed as open canals at the north end along the Lake at the time Katrina occurred. Because of the increase in Lake water level during Katrina, the fact that the canals were open allowed the storm surge to flow into the canals, causing the water levels to rise to levels that had not previously been experienced. The locations of the three outfall canals are shown on Figure 2-1. A general description of the outfall canals follows. 17th Street Outfall Canal The 17th Street Canal is located in Jefferson Parish immediately west of the boundary with Orleans Parish. The canal extends north about 2.2 miles from Drainage Pump Station No. 6 (DPS 6), located near Interstate March 2011 LAKE PONTCHARTRAIN AND VICINTY HURRICANE PROTECTION PROJECT Pg. 15

18
19 Lake. The parallel protection system consists of a low levee and an I-wall on both sides of the canal. The I-walls that breached during Katrina were replaced with T-walls and the I-wall that failed as the result of excessive deflection was replaced with an L-wall. 2.3 PURPOSE OF REPORT This report was prepared to reevaluate existing conditions and to identify areas in need of rehabilitation. This report is intended to provide a basis to pursue required improvements to the I-walls (or other components of the parallel protection system) along the London Avenue Canal. The purpose of this report is to document the methodology and conclusions of actions taken to determine the Maximum Operating Water Level (MOWL) for the existing floodwalls and levees of the London Avenue Canal in accordance with the criteria and methods of the guidance documents of the U.S. Army Corps of Engineers (Corps) developed specifically for the Hurricane and Storm Damage Risk Reduction System (HSDRRS). The MOWL was formerly termed the Safe Water Elevation (SWE) in other Corps documents. The MOWL is defined as the elevation of water in the canal where the canal levees and floodwalls meet the stability requirements, sheet pile penetration requirements, and seepage control requirements identified in the project criteria. 2.4 ENHANCED QA/QC OF SUPPORTING DATA AND PEER REVIEW OF THIS REPORT In some cases, additional field and laboratory testing was performed to support the calculations presented in this report. Enhanced quality assurance and quality control (QA/QC) of field and laboratory test procedures were performed for the new data developed for this report. Rigorous internal and external peer review of analyses supporting this report and of the report text and appendices were performed by the Independent Technical Review (ITR) Team consisting of personnel from the following organizations. Geotechnical Engineers from the Mississippi Valley Division (MVD) including some members of the MVD Geotechnical Criteria Applications Team (GCAT); Geotechnical Engineers from the State of Louisiana Office of Coastal Restoration (OCPR); and Geotechnical Engineers representing the Southeast Louisiana Flood Protection Authority East (SLFPA E). Most of the reviewers have been associated with the intensive investigations and evaluations in the aftermath of Katrina and brought significant experience and expertise to the review process. March 2011 LAKE PONTCHARTRAIN AND VICINTY HURRICANE PROTECTION PROJECT Pg. 17
20 This report and appendices were initially prepared for the Corps by ECM-GEC, a Joint Venture and subconsultant Black and Veatch Special Projects Corporation (B&V). The report was edited by ECM-GEC with the assistance of Ray Martin, Ph.D., P.E., of Ray Martin, LLC and Robert Bachus, Ph.D., P.E., of Geosyntec Consultants for the HPO. The analyses performed by B&V, included in the Appendices of the edited report, were not reviewed in detail by Drs. Martin and Bachus and they are therefore not responsible for the content of these appendices except to the extent covered in peer review process by the ITR Team where spot checks of the data and analyses were performed. March 2011 LAKE PONTCHARTRAIN AND VICINTY HURRICANE PROTECTION PROJECT Pg. 18
21 3.0 HISTORY OF OUTFALL CANALS An 1878 map [15] of the City indicates all three canals were in existence by that time. In 1915 and 1947 the low levees along the canals were raised in response to overtopping by hurricanes and settlement of the canals [3]. The storm surge along the south shore of the Lake was estimated at El 4.0 NGVD88 for the 1947 hurricane. In 1955 the Congress authorized the Corps to study methods of containing hurricane storm surge such that it would not overtop the outfall canals and the Lake front levees. In 1960 the Corps proposed installing gates at the location of the discharge of each canal into the Lake. The Orleans and Jefferson Parish Levee Boards and the Sewerage & Water Board of New Orleans were partners with respect to funding of these projects and were also responsible for the operation of the canals. Opposition delayed this proposed modification [3]. In 1965 the Corps warned that the levees flanking the outfall canals were inadequate in terms of grade and stability. Finally, in 1985 the Corps was authorized to study two alternative approaches to provide hurricane storm surge protection for the outfall canals. The alternatives were to provide: 1) gated structures at the canal entrances; and 2) a parallel protection system consisting of flood walls. After an extended debate between the various parties to the project, Congress mandated construction of the parallel protection s ys t em alternative in 1992 [1]. 3.1 STANDARD PROJECT HURRICANE AND DESIGN TOP OF FLOOD WALLS The 1959 Standard Project Hurricane (SPH) [1] parameters, which were based on historic hurricanes covering a period of 57 years from 1900 to 1956, were used by the Corps to design the Lake Pontchartrain and Vicinity project including the outfall canals. This SPH was considered to have a recurrence interval of 100 years [1]. The Corps developed the criteria for design of the outfall canals after authorization by Congress in the Flood Control Act of The design water surface for each canal was established based on the 1959 SPH. The SPH indicated that the Lake water surface on the south shore would be El 10.0 NAVD88. Beginning with this Lake water level, the Corps used the HEC-2 Water Surface Program [1] to calculate the water levels in the three outfall canals. Waves were not considered a significant issue due to the canal entrance conditions. The design tops of flood walls were set between El 11.5 and 13.5 NAVD88, based on this analysis [1]. After Katrina the top elevations of the I-walls were found to be up to 1 to 2 feet lower than the original elevations at which they were constructed, resulting in less protection than had been planned [1]. March 2011 LAKE PONTCHARTRAIN AND VICINTY HURRICANE PROTECTION PROJECT Pg. 19
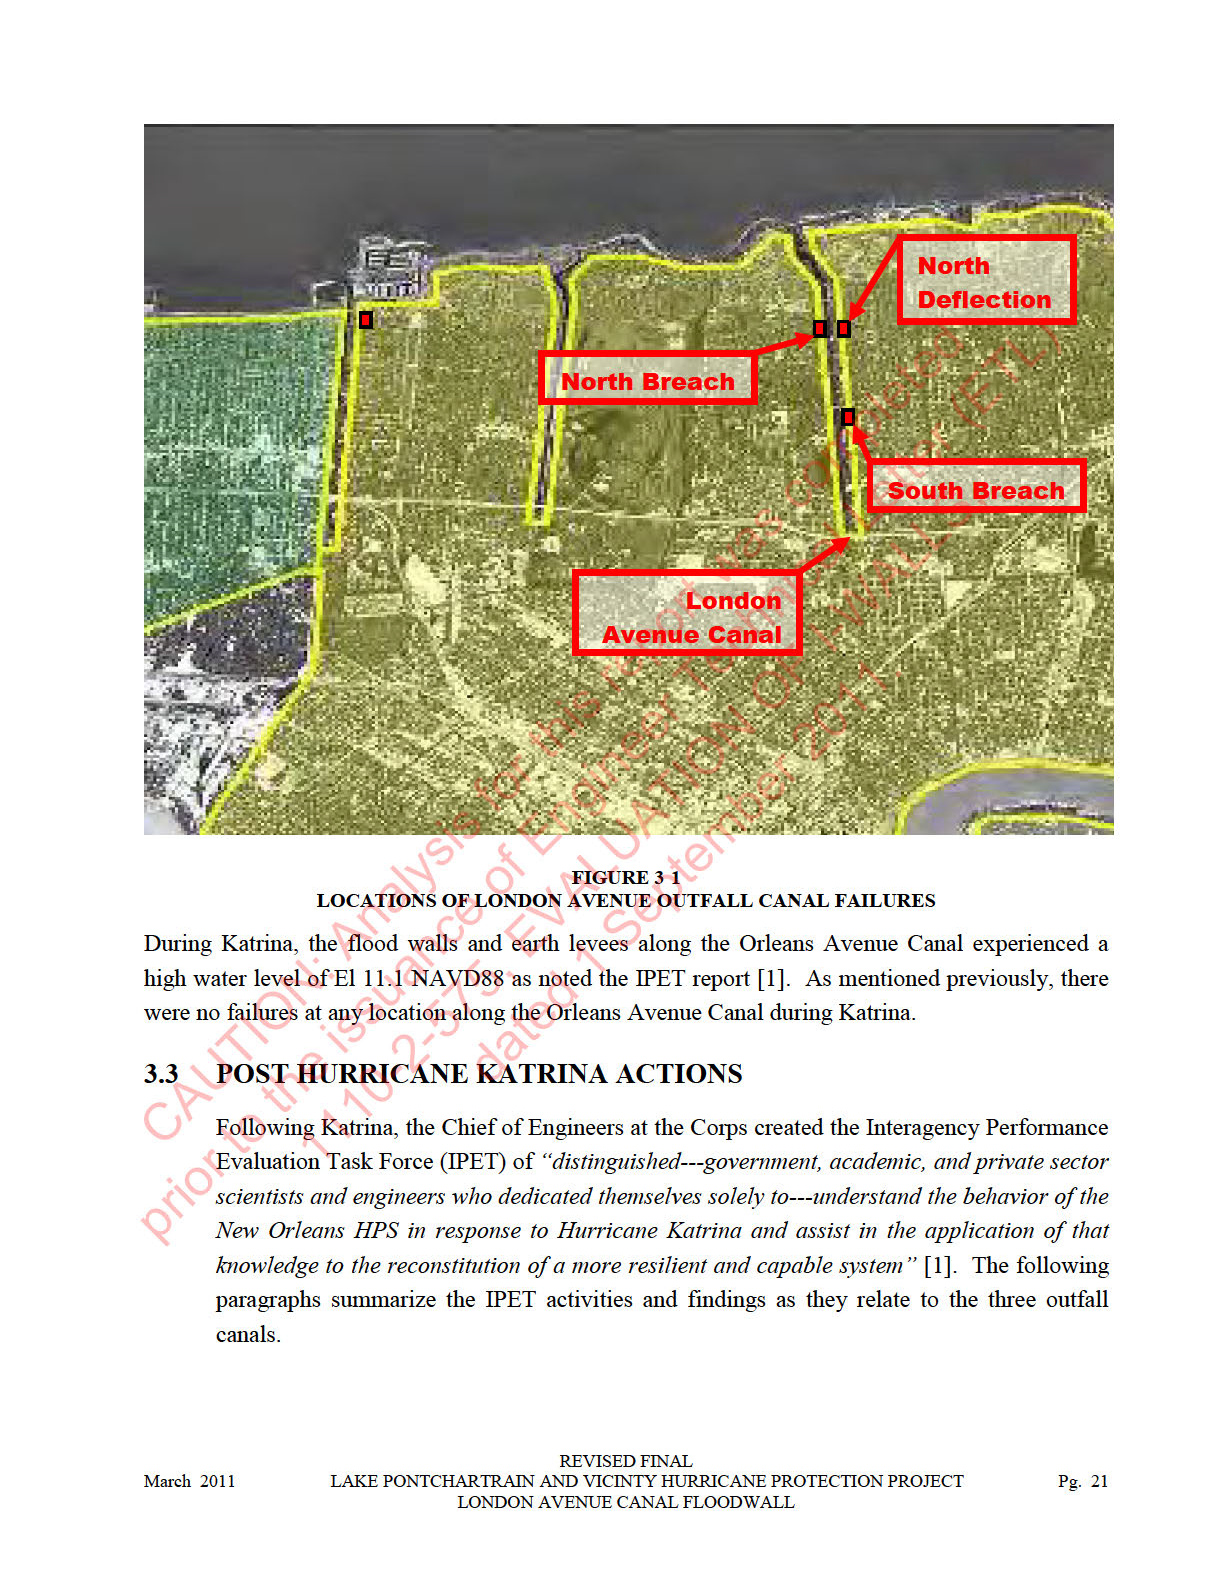
22 3.2 OUTFALL CANAL FAILURES The storm surge from Katrina caused one failure along the 17 th Street Canal and two failures along the London Avenue Canal. Figure 3-1 illustrates the locations of the outfall canal failures. The Orleans Avenue Canal levees and flood walls did not fail. The 17 th Street Canal failed south of the Old Hammond Road Bridge near the north end of the canal between about 6:00 and 9:00 AM on August 29, 2005 [1]. A 400-ft long section of the east I-wall failed between Stations and when the water level in the canal was at about El 7 NAVD88, or about 5.5 feet below the top of the I-wall at the time of failure. The water level in the canal prior to Katrina was about El 3.0 NAVD88 and it ultimately rose to a maximum level of about El 9 NAVD88 during Katrina. It is believed that the failure occurred when a gap formed between the sheet pile wall, supporting the I wall, and levee soil on the flood side of the I-wall. This gap allowed canal water to fill the space between the sheet pile and the levee soil down to the tip of the sheet pile. Ultimately, a shear failure developed below the tip of the I-wall in the soft clay foundation soils. Figure 3-1 illustrates the locations of the outfall canal failures. The London Avenue Canal failed in two locations between 6 and 8 AM on August 29, The first failure occurred between 6 and 7 AM along the east I-wall north of Mirabeau Avenue and has been designated the south breach. This breach was about 60 feet long, but the I-wall deflected outward over a length of about 210 feet between Stations and Based on estimates of the storm surge, the water level in the canal was rising during the failure and ranged from about El 7 NAVD88 initially to about El 8 NAVD88 when this failure was complete. The second failure occurred between about 7 and 8 AM south of Robert E. Lee Avenue along the west I-wall and was designated the north breach. This breach was about 410 feet long and occurred between Stations and Based on estimates of the storm surge, the water level was at about El 8 NAVD88 when this failure initiated and was at about El 9 5 NAVD88 when the failure was complete. The east I-wall opposite the north breach tilted significantly but did not breach between about Stations and It is believed that these failures were also caused by the formation of a gap along the flood side of the sheet pile walls. The tips of the sheet pile walls along the London Avenue Canal are underlain by a sand layer. When the gap extended to the sand layer the water pressure from the canal caused uplift failure in the marsh layer overlying the sand layer beyond the levee and catastrophic failure ensued. March 2011 LAKE PONTCHARTRAIN AND VICINTY HURRICANE PROTECTION PROJECT Pg. 20
23
24 The IPET was established by the Corps in October 2005 and consisted of 150 world class engineers and scientists. The IPET conducted an intensive investigation that helped to understand the performance of the New Orleans levees, floodwalls, and other system components during Hurricane Katrina. The IPET helped identify lessons learned from the failures so that these lessons could be used in the rapid repairs to the system and the repairs included in the long-term improvements. These lessons are also being incorporated into Corps policy and guidance. The IPET investigation is recorded in the IPET Final Report, Volumes I IX which was issued June 1, 2007 [1]. The report was titled Performance Evaluation of the New Orleans and Southeast Louisiana Hurricane Protection System. Volume V of the report was subtitled The Performance - Levees and Floodwalls, and discusses the forensic investigations conducted following Katrina necessary to fully understand the failure mechanisms and address professional differences of opinion related to the London Avenue Canal I-wall failures. Two other panels were established to review the work of the IPET. The Corps requested that the American Society of Civil Engineers (ASCE) establish an External Review Panel of equally distinguished individuals to provide continuous peer review of the IPET work and to provide a summary report. The report of findings was published by ASCE [16, 17]. The second panel was requested by the Assistant Secretary of the Army for Civil Works and was established under the auspices of National Academy of Engineering - National Research Council (NRC). The NRC established the Committee on New Orleans Regional Hurricane Protection Projects. The purpose was to provide strategic oversight of the IPET and to make recommendations concerning hurricane protection in New Orleans. [1] The ASCE published various papers authored by others in a special ASCE Geotechnical and Geoenvironmental Engineering Journal issue dedicated to the performance of the flood protection structures during Katrina [2]. Other professional groups, including the Independent Levee Investigation Team from the University of California at Berkeley (ILIT) [3], performed investigations and submitted reports to the Corps Ipet Findings One of the most surprising elements of the failures along the 17 th Street and London Avenue Canals was that they occurred before water overtopped the I-walls during the rise in canal water levels resulting from the hurricane surge on the Lake. Volume V of the Final IPET Report [1] dated June 1, 2006 discusses the investigations conducted following Katrina to develop an understanding of the failure mechanisms. The IPET attributed the failures along these canals to the following specific causes: March 2011 LAKE PONTCHARTRAIN AND VICINTY HURRICANE PROTECTION PROJECT Pg. 22
25 As the water levels rose above the crest of the levees in the canals, gaps formed between the sheet piles supporting the I-walls and the soils on the flood side of the levee embankments. Water filled these gaps, increasing the water loads on the walls and reduced the stability factor of safety of the I-walls. The formation of the gap was observed in centrifuge model tests and finite element soil-structure interaction analyses. The marsh clay foundation soils were essentially normally consolidated beneath the levee slopes and beyond the toes of the levees. In these areas, the undrained shear strength of the clays was lower than under the crest of the levee which had been loaded to higher effective stresses as the result of the levee embankment fill. This variation in undrained shear strength was found to be an important factor in the evaluation of the stability of the levees. Failure to account for this shear strength variation in the marsh cl a ys likely resulted in the failure of the I-wall along the 17 th Street Canal. Where the I-wall sheet pile penetrated through the marsh clays into the sands, the open gap on the canal side of the sheet pile allowed the full hydrostatic head of the canal water to pressurize the sands. This resulted in high uplift pressures, increased hydraulic exit gradients at the ground surface, and the potential for piping at the toe of the levees on the protected side. Failure to account for this pressurizing of the sand layer likely resulted in the failures and tilt of the I-walls on the London Avenue Canal. Following Katrina, the Corps took several actions to protect the outfall canals against future storm surges until a final plan could be developed to correct any remaining deficiencies of the HPS. These measures are described in the following paragraphs Interim Safe Water Elevations Following the failures along the 17 th Street Canal and the London Avenue Canal, the Corps established interim MOWL for each of the three outfall canals: London Avenue Canal: El 5 NAVD88; Orleans Avenue Canal: El 8 NAVD88; and 17 th Street Canal: El 6 NAVD88 These restrictions were intended to limit canal operating water elevations on the parallel protection structures (i.e., levees and I-walls) until further engineering studies could be completed to establish the MOWL for each canal Interim Closure Structures The Corps also decided to construct Interim Closure Structures (ICSs) on the outfall canals at their confluence with the Lake to protect the canals against storm surges during tropical March 2011 LAKE PONTCHARTRAIN AND VICINTY HURRICANE PROTECTION PROJECT Pg. 23
26 and extra-tropical events. Each ICS included gates and pump stations. The interim pump stations were sized with sufficient capacity to provide continuity of operations with the interior drainage pump stations for each canal. The ICSs for the London Avenue Canal was completed on June 1, Design Of Outfall Canals To Withstand A Maximum Operating Water Level Of El 8 NAVD88 In 2010 the MVN Corps made the decision that the I-wall levee parallel protection systems along each of the canals would be remediated to withstand a MOWL of El 8 NAVD88. This is a much more desirable MOWL from an operational perspective than the interim safe water levels on the London Avenue and the 17 th Street Canals. This decision was made given that permanent closure structures and pump stations are planned to replace the existing ICS at the mouth of the canals. The permanent pump stations will operate in tandem with the existing local drainage pump stations. The closure structures will remain open under normal weather conditions; however, during significant tropical and extra-tropical events the gates will be closed, and the canals will function as conduits for the flow of runoff pumped from the city. Design of the improvements to the parallel protection systems for all canals to achieve a MOWL of El 8 NAVD88 is presently underway. March 2011 LAKE PONTCHARTRAIN AND VICINTY HURRICANE PROTECTION PROJECT Pg. 24
27 4.0 PROJECT GUIDELINES AND METHODOLOGY The changes incorporated into the analyses of the parallel protection systems for each canal have been modified since Katrina, based on lessons learned from the canal failures. Concurrent with the IPET investigation, and assisted by several IPET members, the Corps developed a series of design guidelines [4] to: 1) provide consistency for the new designs, 2) enhance the current engineering criteria, and 3) incorporate the most current engineering standards and analysis guidelines related to use of state-of-the-practice methods of analysis. Spencer s Method for slope stability analyses and finite element seepage analyses are now routinely used by the Corps, as a result of the IPET findings and recommendations. The required FOS for use with Spencer s Method was also increased from 1.3 to 1.4. The new guidelines are intended to be integrated into process that will result in parallel protection systems that are both resilient and robust. Evaluations of the current MOWL of the London Avenue Canal I-wall levee and T-wall levee parallel protection system utilize the methodologies specified in the Hurricane and Storm Damage Risk Reduction System Design Guidelines (HSDRRSDG) [4] A second document titled Stability Analysis of I-Walls Containing Gaps between the I Wall and Backfill Soils [7] modifies the method previously specified in the Interim HSDRRSDG for: 1) determining the I-wall gap depth; and 2) performing the Spencer s Method stability analysis. The application of the guidance documents to analysis of the I-walls, T-walls and L-wall for this project were reviewed at various meetings attended by B&V, the ITR Team and the Corps during 2007 through These meetings were held to refine the guidance to this specific project, to reconcile differences in the application of the guidance to analyses performed and to review comments on draft reports. Specific parts of the recently revised guidelines identified, discussed, and agreed to by the Corps related to the gap propagation, piping analyses and modification of the heave analysis when finite element seepage analyses are performed. A detailed description of each guideline and how it was applied to this project is discussed in subsequent sections of this report. 4.1 SHEAR STRENGTH VERSUS DEPTH RELATIONSHIPS For the purpose of this report shear strength versus depth relationships are termed strengthlines. These relationships are used for the analysis of individual reaches. The data used to develop strengthlines were obtained from the following references. Design Memorandum 19A, General Design, London Avenue Outfall Canal [6] includes investigations performed through 1985; March 2011 LAKE PONTCHARTRAIN AND VICINTY HURRICANE PROTECTION PROJECT Pg. 25
28 IPET Report, Volume 5 [1] includes data developed in vicinity of failure areas; and Additional investigations [10] performed by the Corps in 2005 through 2010 as described herein. 4.2 SURVEYS Surveys of the canal were performed from December 2009 through March 2010 [12, 13]. These consisted of bathymetric and topographic surveys on the east and west sides of the canal from DPS 3 at the south end of the canal to the ICS at the north end of the canal. 4.3 CANAL BASE CONDITIONS Eighty vibrotube samples were obtained during February and March 2010 to determine the presence or absence and thickness of canal bottom sediments. These sediments, consisting of silty sand or sandy silt, could reduce the flow of canal water to the underlying beach sands. 4.4 MAXIMUM SAFE WATER ELEVATIONS Guideline It was agreed during a meeting with the Corps on May 4, 2009 that MOWLs up to El 10 NAVD88 were to be evaluated As referenced previously, the term MOWL is intended to replace the Safe Water Elevation (SWE) Methodology Where analysis results for existing I-walls meet or exceed the El 10 NAVD88 criteria, no additional effort was to be made to determine the MOWL. Where analysis results for the existing I-walls indicate that a reach does not meet the El 10 NAVD88 criterion, the critical MOWL for that reach was reported along with the controlling criteria (e.g., stability, sheet pile penetration, seepage, etc.). The maximum water level in the canal will be controlled by the operation of the pump stations and gates. The analysis results presented in this report indicate that some reaches along the London Avenue Canal have MOWL values lower than the present MOWL of El 5 NAVD88. Any reach with a MOWL below El 8 NAVD88 will be remediated. March 2011 LAKE PONTCHARTRAIN AND VICINTY HURRICANE PROTECTION PROJECT Pg. 26
29
30 4.6 I-WALLS - GAP ANALYSIS Guidelines The GCAT document Stability Analysis of I-Walls Containing Gaps between the I-Wall and Backfill Soils [7] provides a methodology for the determination of the gap depth. This new method supersedes the methodology described in the HSDRRSDG. The depth of the gap determined using this methodology is relatively insensitive to the elevation of the water in the canal. The full potential gap depth was assumed to develop for both seepage and slope stability analyses when the canal water level exceeded the flood side levee crest by any amount. The GCAT methodology does not provide guidance on the condition where the calculated gap depth approaches the top of the beach sand layer. The HSDRRSDG [4], Article , recommends the following: If the computed gap is within 5 feet of the aquifer [e.g., beach sand layer], the crack shall be assumed to extend to the aquifer. For specific cases where the geology of the foundation is well known and the designer is confident that the strata is more than 2.0 feet below the tip of the sheet pile, the crack shall extend only to the depth calculated. A well known geology shall have field investigations spaced closer than 100 feet. The GCAT guidelines suggest that the piezometric surface be determined from a finite element analysis assuming the maximum depth of the gap Methodology Discussions were held between the Corps and the ITR team at a meeting on October 7, 2009 to define the procedure to be used when the calculated gap depth approaches the top of the beach sand layer. Based on the results of that meeting it was decided to extend the calculated gap depth to the top of the beach sand layer if the calculated gap depth was within 3 feet of the top of the beach sand layer and is, therefore, more conservative than recommendations made by the GCAT. 4.7 I-WALLS - GLOBAL STABILITY Guidelines Table 3.1, Article of the HSDRRSDG [4] provides guidelines for the stability of I- walls. This table provides a requirement that Spencer s Method [5] of analysis is to be used March 2011 LAKE PONTCHARTRAIN AND VICINTY HURRICANE PROTECTION PROJECT Pg. 28
31 as the primary analysis method and that the MOP [42] is to be used as a check. The HSDRRSDG assumes that the water level is at the top of the I-wall Methodology The Corps required that the existing I-wall levee parallel protection system for each reach be analyzed using both Spencer s Method and the MOP during a meeting held on May 4, The GEO-SLOPE program SLOPE/W, Version 7.16 [41] was used to perform the Spencer s Method of analysis. The minimum factor of safety (FOS) for Spencer s Method was established as 1.4 and for the MOP as 1.3. For the analyses presented herein, the maximum canal water surface elevation will be limited to El 10 NAVD88, not top of the wall as stated in the HSDRRSDG. 4.8 I-WALLS - FAILURE PLANE THROUGH SHEET PILE Guidelines No guidelines were provided in the HSDRRSDG [4] as to where, or if, potential failure surfaces in a stability analysis can pass through the sheet pile. The GCAT guidelines do not allow penetration of a potential failure surface through the sheet pile for the gap analysis Methodology During a meeting held with the Corps on May 4, 2009 it was agreed that penetration of a potential failure surface through the sheet pile would not be permitted in the gap analyses. All potential failure surfaces in the gap analysis will be initiated at the sheet pile tip. To be consistent with the gap analyses, the sheet pile will be included in the global analyses. However, the Corps required that potential failure surfaces in the global analyses be allowed to penetrate through the bottom 5 feet of the sheet pile. While these two requirements are inconsistent, it is conservative to allow potential failure surfaces in the global analyses to penetrate through the bottom 5 feet of the sheet pile and both criteria were used for the analyses of the canal. 4.9 I-WALLS WALL STABILITY Guidelines Article of the HSDRRSDG specifies the use of the Corps software CWALSHT to determine the required sheet pile tip penetration. Two cases using Q shear strengths are required: Case a cantilever wall and Case b bulkhead wall. One S shear strength March 2011 LAKE PONTCHARTRAIN AND VICINTY HURRICANE PROTECTION PROJECT Pg. 29
32 case is required, and this is for the Case b bulkhead wall. This case is only performed on I-walls with differential fill depths on either side of the I-wall of greater than 2 feet Methodology Cases a and b were performed using the CWALSHT. Case a was evaluated using the MOWL of El 10 NAVD88 for deflection away from the canal, and case b was performed using the low water level of El -1 NAVD88 for deflection towards the canal. In all cases the analyses were performed by applying a FOS of 1.5 to the active and passive soil strengths. In accordance with Corps instructions, the CWALSHT analysis was performed using the design mode. Analyses were performed using the Fixed Surface Wedge Method and Sweep Search Wedge Method. The method producing the deeper design tip was then compared to the as-built tip elevations to evaluate suitability of the sheet pile penetrations I-WALLS - PIEZOMETRIC SURFACE Guidelines The HSDRRSDG [4] require that the piezometric surface used in the stability calculation be in accordance with Corps Publications EM [28] and DIVR [31]. The GCAT guidelines suggest that the piezometric surface be determined from a finite element analysis considering the maximum calculated depth of the gap Methodology The seepage analyses were performed using the GEO-SLOPE program SEEP/W, Version 7.16 [41]. The piezometric surface is critical to the stability analysis, especially in areas where a shallow sand layer may be exposed at the base of the canal on the flood side or when a gap is introduced. Piezometric surfaces obtained from these analyses were used for both the global and gap stability analyses and conservatively included the presence of a gap for both cases T-WALLS EMBANKMENT STABILITY Guidelines Table 3.1, Article , of the HSDRRSDG [4] provides a methodology for the analysis of T-wall stability. The procedures require that the analyses consider two water levels in the canal: the design water surface elevation and water at the top of the T-wall. This methodology uses a Spencer s Method [5] of analysis and the transfer of unbalanced loads onto support piles. March 2011 LAKE PONTCHARTRAIN AND VICINTY HURRICANE PROTECTION PROJECT Pg. 30
33 Methodology The existing T-walls were not designed using the new T-wall criteria. The analyses included herein used the new T-wall criteria. The as-built drawings of the new walls were provided by the Corps. The as-built pile configuration was analyzed using ENSOFT Group 7 Software [43], a program for the analysis of piles in a group. The unbalanced load was determined using Spencer s Method of analysis utilizing the GEO- SLOPE program SLOPE/W, Version 7.16 [41]. The guidance document specifies that a global stability analysis be performed on the T-wall cross-section, with the assumption that the horizontal water load on the concrete portion of the T-wall be assumed to be supported by the T-wall foundation piles and not be part of the stability analysis. According to the HSDRRSDG [4] a FOS greater than 1.5 will not apply any soil loads to the T-wall foundation piles. T-walls constructed after Katrina to replace failed I-walls were evaluated for a MOWL up to El 10 NAVD PIPING ANALYSIS Guidelines The piezometric surface used in piping analyses will be determined from a finite element analysis that is based on the gap analysis. The FOS to be used for underseepage/piping will be 1.6, in accordance with Article , Table 3.5(a) of the HSDRRSDG [4]. In discussions with the IRT team at a May 2010 meeting, it was agreed that the analysis for heave in accordance with Article of the HSDRRSDG was no longer required, based on guidance developed by GCAT and approved by the Corp Methodology The seepage analyses were performed using the GEO-SLOPE program SEEP/W, Version 7.16 [41] March 2011 LAKE PONTCHARTRAIN AND VICINTY HURRICANE PROTECTION PROJECT Pg. 31
34 5.0 GEOLOGY The geology of the London Avenue Canal area is very complex [1, 6, 14]. The near surface soils were deposited during Holocene time as the ocean rose after the last ice age. The following paragraphs present a brief description of regional and local geology. 5.1 PHYSIOGRAPHY The London Avenue Canal is located on the Mississippi River Delta Alluvial Plain which is the southernmost part of the Mississippi River Alluvial Plain. Specifically, the project is located on the southern edge of the Lake Pontchartrain Basin and east of the Mississippi River. The highest ground surface elevations in the area are located along the natural levees adjacent to Bayou Sauvage (also described as Bayous Metairie and Gentilly) which crosses the south end of the canal and along the Mississippi River. Elevations along the Bayou Sauvage natural levees are near -1.5 NAVD88 and along the Mississippi River natural levees vary from approximately El 8.5 to 13 5 feet NAVD88 In the lowest swamp and marsh areas the ground surface is as low as El -8.5 NAVD REGIONAL AND LOCAL GEOLOGY At the close of the Pleistocene epoch, about 15,000 to 12,000 years before present, the sea level was approximately 360 to 400 feet below present sea level and the Mississippi River was entrenched into the old Pleistocene sediments that underlie the coastal Louisiana area. The elevation of the Pleistocene surface under the London Avenue Canal varies from about El -60 to -70 NAVD88. At the end of the Pleistocene epoch the ancestral Mississippi River valley was to the west of New Orleans in the area of Morgan City, LA and the Gulf of Mexico shoreline was located much farther to the south than it is today. Massive deposition of fluvial sediments occurred during the Holocene sea level rise in the broad alluvial valley of the ancestral Mississippi River. The local sediment deposition process included the following specific stages. The Holocene bay sound clays were deposited on top of the old Pleistocene surface as the sea level began to rise rapidly and inundated the New Orleans area. The Pine Island barrier beach sand formation was deposited above the bay sound clays about 4,000 to 5,000 years before present when the sea level was about 10 to 15 feet below current elevations. Figure 5-1 illustrates the estimated surface contours of the barrier beach in the area of the London Avenue Canal. Note the surface of this barrier beach sand deposit is about El -10 NAVD88 at its highest elevation. Contours shown on Figure 5-1 are difficult to read, but are all below current sea level. The barrier beach formed a shoreline before the March 2011 LAKE PONTCHARTRAIN AND VICINTY HURRICANE PROTECTION PROJECT Pg. 32

35
36 FIGURE 5-2 HOLOCENE DELTAS OF THE MISSISSIPPI RIVER (14) The surficial clays and peat that make up the marsh and swamp deposits which overlie the Pine Island barrier beach sands and the older intradelta and prodelta deposits are part of the St Bernard delta complex. These sediments were deposited as recently as 800 years [23] ago mostly by the Bayou Sauvage distributary channel. A distributary channel originates from the main river channel and distributes water and sediment to the delta area thus expanding the delta. This distributary channel was located along the southern edge of the old Pine Island Barr er Beach Natural levees developed on both sides of Bayou Sauvage as water flowed over the banks of the distributary channel during flooding. The natural levees in the Bayou Sauvage area consist of silts and lean and fat clays. Finer grained sediments were deposits beyond the natural levees in the marsh areas and are termed interdistributary deposits. Below the marsh deposits and natural levees are older intradelta and prodelta deposits. Intradelta deposits are typically more coarse grained higher energy deposits that formed when the distributary system was young. The prodelta deposits formed at the delta front and were laid down beneath the water surface before the distributary system fully developed. The stratigraphy shown on the Soil and Geologic Profiles and Cross Sections included in Appendix A.4, Plates 11 through 72, illustrate the formations described above. March 2011 LAKE PONTCHARTRAIN AND VICINTY HURRICANE PROTECTION PROJECT Pg. 34
37 6.0 GEOTECHNICAL CONSIDERATIONS The geotechnical data used in this study were obtained from Design Memorandum No. 19A [6] (DM 19A), the IPET Report [1], and through additional investigations and laboratory testing performed in , 2009, and 2010 [10]. The existing structures are presented first followed by a discussion of the geotechnical investigations. The subsurface conditions are then presented along with development of soil and geologic profiles and cross sections. This is followed by discussion of laboratory and in situ testing data, design permeability values, and design shear strength and unit weight values. Results of the London Avenue Canal I-wall Load Test (London Load Test) are discussed next. Finally, the levee reaches developed from assessment of these data conclude this section. 6.1 EXISTING STRUCTURES AND GROUND SURFACE GRADES The existing structures under consideration in this study include the various types of floodwalls, the tip elevations of the underlying sheet pile cutoff walls, pump stations and bridges. The existing ground surface grades of the canal levees and canal bottom and of the adjacent protected areas on both sides of the canal levees are also an integral part of the project. The following paragraphs briefly describe these features Floodwall Top Grades And Levee Crest Grades The existing I-walls along the levee crests were constructed in the early 1990 s to improve the parallel protection system and reduce the potential for flooding during hurricane events which cause the level of the water in the Lake to rise. After the I-wall failures occurred during Katrina, the failed and distressed I-wall sections were replaced with T-walls or L- walls. A new pile supported T-wall was installed at the south breach between Stations and for a total length of 363 feet. A new pile supported T-wall was also installed at the north breach between Stations and for a total length of 640 feet. A new pile supported L-wall was installed between Stations and for a total length of 467 feet across from the north breach to replace the distressed I-wall. The top of the I-wall grades vary between El 12.7 and 13.1 NAVD88 throughout the length of the canal. The earth levees without I-walls have crest grades ranging from 10.7 to 11.6 NAVD88. These walls and levees were analyzed for an MOWL of El 10 NAVD 88, the maximum MOWL considered in this study. March 2011 LAKE PONTCHARTRAIN AND VICINTY HURRICANE PROTECTION PROJECT Pg. 35
38 6.1.2 Sheet Pile Tip Elevations The I-walls, T-walls, and L-wall are each connected to subsurface sheet pile cutoff walls which are embedded in the base of the various wall types. The tip elevations of these sheet pile walls vary along the length of the canal due to variations in subsurface conditions. The sheet pile tip elevations and locations where they apply were obtained from as-built drawings [11] of the canal provided in Corps documents. Table 6-1 provides a summary of the original sheet pile tip elevations for the west and east sides of the canal. The table is arranged according to the original reaches defined in the as built drawings based on variations in sheet pile tip elevations. The T-walls and L-wall that were added after Katrina are not included in Table 6-1. The tip elevations of the existing I-wall sheet piles are plotted on the centerline soil and geologic profiles provided in Appendix A.4 WEST BASELINE APPROXIMATE STATION TABLE 6-1 ORIGINAL AS-BUILT REACHES [11] PROTECTED SIDE LEVEE CREST ELEVATION SHEET PILE TIP ELEVATION. (FT) NAVD88 EAST BASELINE APPROXIMATE STATION PROTECTED SIDE LEVEE CREST ELEVATION (FT) NAVD88 SHEET PILE TIP ELEVATION. (FT) NAVD to to to to Gentilly Blvd. Gentilly Blvd to to to to to to to to Mirabeau Avenue Mirabeau Avenue to to Filmore Avenue Filmore Avenue to to to DPS to to Robert Lee Ave to Robert Lee Ave to March 2011 LAKE PONTCHARTRAIN AND VICINTY HURRICANE PROTECTION PROJECT Pg. 36
39 6.1.3 Pump Stations Drainage Pump Station No. 3 (DPS 3) is located at the south end of the London Avenue Canal. The foundations of the original building consisted of mass brick walls founded on piles. A reinforced concrete addition was added in the 1930s and this was also founded on piles. It was assumed that, during a storm event, all discharge pipes from DPS 3 would empty into the London Avenue Canal. A reinforced concrete wall separates two discharge pipes from the other discharge pipes in the discharge basin. This wall was not considered in the MOWL analysis because the wall will have equal hydraulic head on both sides. Likewise, the retaining walls on either side of the discharge basin will have nearly equal loading on both sides of the walls under high canal water levels and therefore were not considered in the MOWL analysis. On the east side of DPS 3, a wall with top grade El 5 NAVD88 separates the discharge basin from a bypass canal. Flooding has been observed in the past at this section of the pump station and the current MOWL at DPS 3 based on the top of this wall is El 5.0 NAVD88. Drainage Pump Station No. 4 (DPS 4) is located near the north end of the London Avenue Canal between east base line Stations to The building foundation consists of a reinforced concrete slab and walls founded on piles. The top of the foundation wall and a reinforced concrete retaining floodwall and gate structure are located at the same grade as the top of the adjacent I-walls, El 12.9 NAVD88. These walls were analyzed for a MOWL of El 10 NAVD 88, the maximum MOWL considered in this study. The ICS consists of gated structures that are used to block surge from tropical storms and hurricanes, as well as other events that cause the level of Lake Pontchartrain to rise, from the canals and pumps that allow the S&WB to continue to pump water from the city from the rain event that will likely accompany a surge event. These structures were constructed to prevent failures of the floodwalls similar to those that occurred on the 17 th Street and London Avenue Canals during Katrina. The ICS and pump station in the London Avenue canal consists of eleven 11 x wide gates with a flow-rate capacity of 12,500 cubic feet per second. There are two stages of pumps used at the ICS; the phase 1 pumps consist of 12 MWI pumps with the power unit located on the engine platforms, and phase 2 consists of 6 MWI pumps with the power units located on the pump platform Canal, Levees And Protected Side Grades Surveys of the canal were performed from December 2009 through March Levee cross sections were taken approximately every 100 feet along the baselines on each side of the canal. Ground surface elevations were obtained along each cross-section at approximately 20-foot intervals and at all abrupt changes in grade. The cross-sections were March 2011 LAKE PONTCHARTRAIN AND VICINTY HURRICANE PROTECTION PROJECT Pg. 37
40 generally extended 50 feet beyond the protected side toe of the levees on each side of the canal. Within the canal the cross section grades were obtained from multi-beam bathemetry contours. The survey was performed using a combination of geodetic levels and the Real- Time-Kinematic (RTK) Global Positioning System (GPS). The survey report is included in Appendix C and the coordinates of the east and west canal baselines are included in Appendix G. The average canal bottom width is about 60 feet and varies between about 50 and 80 feet. The top width of the canal averages about100 feet and varies between 90 and 120 feet. The canal bottom grade is relatively consistent across each section and ranges from about El -6 NAVD at the south end of the canal near DPS 3 to about El -13 NAVD near the ICS. Areas of scour have developed in the vicinity of the Fillmore Avenue Bridge and north of DPS 4. The critical cross-section grades for each original reach were created by enveloping the lowest elevations for all of the 100-foot cross sections within each original reach. The analyses cross section grades for each original reach were compared to determine where consistent differences in cross section grades existed. Where differences existed within an original reach, the reach was subdivided into two reaches with relatively consistent cross section grades. The survey cross sections are included in Appendix A.4 on Plates 73 through GEOTECHNICAL INVESTIGATIONS The Corps initiated the field investigations along the London Avenue Canal beginning in with the completion of five borings. From May 1984 through December 1985, a total of 110 borings were drilled for the development of DM 19A [6] which included the addition of I-walls to increase the parallel protection along the canal levees. Following the I-wall failures in August 2005 additional borings, cone penetration tests (CPTs), and laboratory tests were performed for: 1) evaluation of the failures; 2) design of the London Load Test; 3) determination of MOWL and reaches in need of repair; and 4) design of remedial repairs. ITR Team and of the Technical Team for the London Load Test recommended additional subsurface exploration and in-situ testing be performed to evaluate the MOWL along the London Avenue Canal. Additional test borings, CPTs, vane shear tests (VSTs) and laboratory tests were performed. The following paragraphs describe these investigations Pre-Katrina Investigations A total of 97 test borings were drilled for preparation of DM19A within reaches under consideration in this report. The distribution of these borings along the canal is illustrated in March 2011 LAKE PONTCHARTRAIN AND VICINTY HURRICANE PROTECTION PROJECT Pg. 38
41 Table 6-2. Only three borings were drilled along the protected sides of the levees and one on the flood side. A total of 32 borings were drilled along the centerline of the crest of both the west and east levees, respectively. The average spacing was thus about 450 feet between borings. Within the reaches under consideration, 27 borings were drilled in the canal beginning at about baseline Station northward, and the average spacing between borings was also about 450 feet. The baseline refers to both west and east baselines, which are relatively in the same positions on both sides of the canal. In 1994 two additional borings were drilled on the protected side at DPS 4. The ground surface elevations shown on the boring logs for the older borings may not agree with current ground surface elevations due to subsidence or grading work that has occurred at the borings locations. The ground surface elevations at the locations of the recent borings discussed below generally agree with the ground surface elevations obtained during the recent survey performed for this study Post Hurricane Investigations Following the I-wall failures in August 2005, 178 test borings, 164 CPTs, and 33 VSTs were performed to evaluate the subsurface conditions along and within the canal Borings A total of 10 borings were drilled in October 2005 at the request of the IPET investigators to fill in the data gaps for their analyses Three borings were drilled on the protected side at the south breach on the east side of the canal Four borings were drilled at the north breach along the west side of the canal, two on the centerline and two on the protected side. One boring was drilled on the centerline at the deflected area across from the north breach along the east levee Two borings were drilled north of the Leon C. Simon Drive Bridge along the east and west levees respectively, both on the protected side. March 2011 LAKE PONTCHARTRAIN AND VICINTY HURRICANE PROTECTION PROJECT Pg. 39
42 WEST AND EAST BASELINE STATIONS TABLE 6-2 DISTRIBUTION OF TEST BORINGS WEST SIDE PROTECTED SIDE PRE-KATRINA POST KATRINA BORINGS PRE-KATRINA INVESTIGATION LOCATIONS CREST POST KATRINA BORINGS PRE-KATRINA BORINGS CANAL POST VIBRACORES KATRINA PRE-KATRINA CREST POST EAST SIDE KATRINA BORINGS PRE-KATRINA BORINGS PROTECTED SIDE to to to to to to to to South Breach to to to Load Test to No. Breach/Deflect POST BORINGS KATRINA DIRECT PUSH to to TOTALS Notes: 1 Two borings drilled at DPS 4 in Borings located on Flood Side March 2011 LAKE PONTCHARTRAIN AND VICINTY HURRICANE PROTECTION PROJECT Pg. 40
43 During the London Load Test in 2007, 16 borings were drilled to define the stratigraphy. Six borings were drilled along the east levee crest and six borings were drilled on the protected sided toe area and beyond. In addition four vibrocore borings were drilled within the canal. An additional 54 borings were drilled during 2006 and 2007 beyond the IPET investigation areas and the London Load Test area to evaluate the subsurface conditions and to obtain samples for laboratory testing. A total of 10 borings were drilled along the protected side toe of the west levee and seven borings were drilled along the levee crest. On the east levee, five borings were drilled along the crest and 23 borings were drilled along the protected side toe. One additional boring was drilled along the flood side levee toe. Eight vibracore borings were also drilled within the canal. The excavation required for construction of the canal removed a significant portion of the marsh clay deposits and in some areas exposed the underlying barrier beach sands. During design of the I-wall parallel protection system for the canal, 27 shallow borings were drilled along the center line of the canal to obtain data on the soils in the base of the canal. Deposition of soils in the base of the canal and scour of the canal bottom likely caused changes to the conditions which prevailed in 1985 at the base of the canal. The potential for a direct hydraulic connection between the canal water and the beach sands at the bottom of the canal was raised as a concern during this study. During 2010 an additional 80 vibracore borings were drilled within the canal north of Station to evaluate the canal bottom condition. Twelve vibracore borings had previously been completed in 2007 but these borings were clustered near Stations 45+00, to 55+00, 76+00, to and the London Load Test area Stations to 110. The sampling locations for the 2010 borings were about 150 feet apart from Station to about Station North of Station to about Station a total of 35 vibracore borings were drilled. The borings were about the same distance apart but in some locations two borings were performed across the canal to provide additional data. Table A.2-1 in Appendix A2 provides a summary of the soils encountered in the canal bottom at each boring location. An additional 18 direct push tube samples (DPTs) were also obtained in 2010 north of Station along the east levee protected side toe. The distribution of these borings is also summarized below in Table 6-2. A complete list of the 275 borings considered in this MOWL study is included in Appendix A.1, Table A.1-1. The boring locations are also plotted on Plates 1 through 10 of Appendix A4. March 2011 LAKE PONTCHARTRAIN AND VICINTY HURRICANE PROTECTION PROJECT Pg. 41
44 Cone Penetration Tests A total of 164 CPTs were performed in between 2005 and Twenty-two CPTs were completed for the IPET investigation in An additional 5 CPTs were completed for the London Avenue Load Test in During 2009 and 2010 a total of 137 CPTs were completed for this study. A total of 70 CPTs were performed on the protected side toe of the west levee including 6 CPTs performed for the IPET investigation. These CPTs averaged about 120 feet apart. Along the protected side toe of the east levee 73 CPTs were advanced including six for the IPET investigation and 11 CPTs for the London Avenue Canal I-wall Load Test. These CPTs were not as uniformly spaced but also averaged about one test every 120 feet. Eleven tests were performed along the crest of the west levee including six for the IPET investigation and 10 along the crest of the east levee including one for the IPET investigation and one for the load test. The investigations completed for this MOWL study were performed in areas where previous test boring coverage was judged to be insufficient to define the subsurface conditions. The distribution of these CPT locations is summarized in Table 6-3. A complete list of CPT locations is included in Appendix A.1, Table A.1-2. The CPT locations are also plotted on Plates 1 through 10 of Appendix A Vane Shear Tests VSTs were also completed in 2009 as part of this study These tests were performed in the very soft to soft consistency marsh clays to estimate the undrained shear strength of these soils. A total of 33 tests were performed north of about Station along the protected side toes of both the east and west levees. Sixteen tests were performed along the west levee and 17 tests along the east levee. The distribution of these VST locations is summarized below in Table 6-3 A complete list of VST locations is included in Appendix A.1, Table A.1-3 The VST locations are also plotted on Plates 1 through 10 of Appendix A.4. The field investigation logs, for the entire data set used in development of this study, are provided in Appendix F. March 2011 LAKE PONTCHARTRAIN AND VICINTY HURRICANE PROTECTION PROJECT Pg. 42
45 WEST AND EAST BASELINE STATIONS TABLE 6 3 DISTRIBUTION OF CONE PENETRATION AND VANE SHEAR TESTS WEST SIDE PROTECTED SIDE CPTs VSTs INVESTIGATION LOCATIONS CPTs CREST VSTs CANAL CPTs VSTs CREST CPTs VSTs EAST SIDE PROTECTED SIDE to to to to to to to to South Breach to to to Load Test to No. Breach/Deflect to to TOTALS SUBSURFACE CONDITIONS The following paragraphs provide a discussion of the subsurface conditions found throughout the length of the canal under consideration in this study. The information is presented beginning with the youngest and progressing to the oldest strata. CPTs VSTs March 2011 LAKE PONTCHARTRAIN AND VICINTY HURRICANE PROTECTION PROJECT Pg. 43
46 6.3.1 Recent Canal Sediments The recent canal sediments consist of silty sands, sandy silts with some lean clays and fat clays. The thickness of these materials is difficult to assess. Borings performed in the canal bottom do not differentiate between recent canal sediments and older marsh clays. It is likely that the soils classified SM and ML represent the recent canal sediments. The poorly graded sands likely represent barrier beach sands Fill Clays Fill materials are present on both sides of the canal including the constructed levees and beyond the protected side toes. The depth of fill is greater south of about Station and north of Station In the southern area, the fill varies from about 10 to 20 feet in thickness along the crests of the levees to about 1 to 7 feet thick at the levee toes. In the central area, fill depths range from about 4 to 8 feet in thickness under the crest of the levees to about 1 to 4 feet thick at the toes. The fill depth is variable at the north end of the canal. The thicknesses typically vary from about 8 to 15 feet at the crests of the levees to 2 to 23 feet at the toes. Fill material consists of fat and lean clay with some organic matter and artificial fill materials Marsh Clays Underlying the fill materials are swamp and marsh deposits. These materials have been identified herein as the marsh clay stratum. The marsh thickness varies from about 4 to 17 feet, but typically thicknesses range from about 6 to 10 feet. The base of the marsh stratum varies from about El -20 NAVD88 in the southern portion of the canal to a high point of about El -8.5 NAVD88 in the central portion of the canal and then declines again to about El -15 NAVD88 in the northern end of the canal. These clays have been compressed by the weight of the fill material used to construct the levees. Thus, they typically have a reduced thickness under the crests of the levees and tend to be thicker at the levee toes, assuming the cross section had a uniform marsh thickness prior to levee construction. The marsh clays are very soft to medium consistency fat clays with high moisture contents and occasional interbedded lenses of soft to very soft consistency lean clay, occasional sand and silt layers, peat and some wood Intradelta Silts And Sands And Prodelta Clays In the southern reaches of the canal, south of Station 37+00, intradelta silts and sands and prodelta soft to medium consistency fat clays underlie the marsh stratum where the surface of the barrier beach sands dips downward. March 2011 LAKE PONTCHARTRAIN AND VICINTY HURRICANE PROTECTION PROJECT Pg. 44
47 6.3.5 Barrier Beach Sands The barrier beach sand stratum underlies the marsh clay stratum throughout the length of the canal under consideration in this report. From the south end of the canal to Station the surface of the beach sands is below about El -40 NAVD88. From Stations to the surface of the sands abruptly rises to about El -10 NAVD88. The surface of the beach sand continues at about this level with some areas rising to a maximum of El -8.5 NAVD88 and then begins a gradual descend from Station northward to Station where the surface is at about El -15 NAVD88. This sand is typically loose to very dense poorly graded sand but at some locations a layer of silty sand has been identified at the top of the beach sand. Occasional clay lenses are also present in this sand layer. The base elevation of the beach sand stratum is generally at about El -45 to -50 NAVD Bay Sound Clays The bay sound clay stratum underlies the barrier beach sands and varies from about 10 to 20 feet in thickness throughout the length of the canal The stratum consists of medium to stiff consistency fat clays and lean clays with some silt and silty sand layers and shells. The base elevation of the bay sound clays varies from about El 60 NADV88 to -70 NAVD Pleistocene Clays The older Pleistocene stratum underlies the younger bay sound clays. This stratum consists of stiff to very stiff consistency oxidized clays interbedded with layers and lenses of silts and dense sands. This is the bearing material for deep foundations in the New Orleans area and the formation extends to El -500 to -600 NAVD SOIL AND GEOLOGIC PROFILES AND CROSS SECTIONS Soil and geologic profiles and cross sections have been developed from the subsurface investigation data set described previously and are included in Appendix A.4. Profiles were developed parallel to the direction of the canal at the toe and center line of the levees and at the canal centerline. Cross sections were developed perpendicular to the direction of the canal to represent the various subsurface conditions along the canal. These profiles and cross sections are provided on the following plates: Plates 11 through 20 - East Bank Centerline Soil and Geologic Profiles; Plates 21 through 30 - East Bank Toe Soil and Geologic Profiles; Plates 31 through 40 - West Bank Centerline Soil and Geologic Profiles; Plates 41 through 50 - West Bank Toe Soil and Geologic Profiles; March 2011 LAKE PONTCHARTRAIN AND VICINTY HURRICANE PROTECTION PROJECT Pg. 45
48 Plates 51 through 60 Canal Centerline Soil and Geologic Profiles; and Plates 61 through 72 Soil and Geologic Cross Sections A-A through L-L. The cross section locations are shown on Plates 1 through 10 in Appendix A.4. The elevation of the top of the boring on the individual plates may not coincide with the levee section shown as the levee elevations vary within the reaches. The tip elevations of the original I-wall sheet piles and replacement T-walls and L-wall are plotted on Plates 11 through 20 and 31 through 40 in Appendix A.4. The strata descriptions used on these plates, ordered from the youngest to oldest deposits, are presented below. Recent Canal Sediments - Silty sands and sandy silts; Fill - Fat and lean clay with some organic matter, brick pieces and other artificial materials; Abandoned Distributary Channel Fill Soft to medium consistency silt, lean clay and fat clay; Distributary Natural Levees Very soft to medium consistency lean clay and fat clay; Marsh Very soft to medium consistency fat clays and peats with occasional sand and silt layers; Intradelta Loose to medium silt and silty sand; Prodelta Soft to medium consistency fat clay; Barrier Beach - Loose to very dense sands and silty sands with shell fragments; Bay Sound Medium to stiff consistency fat clay and lean clay with some silt and silty sand layers and shells; and Pleistocene Stiff to very stiff consistency oxidized clays interbedded with layers and lenses of dense to very dense silts and sands. 6.5 LABORATORY AND IN-SITU TESTING Laboratory testing data were obtained from DM 19A [6], the IPET Report [1], the London Avenue Load Test [8, 9], and recent testing performed for this study [10]. The following paragraphs summarize the information reported in these data sources Design Memorandum 19a During preparation of DM 19A [6] laboratory testing was performed on selected samples obtained along the London Avenue Canal. All collected samples were visually classified. Laboratory tests performed included the following: March 2011 LAKE PONTCHARTRAIN AND VICINTY HURRICANE PROTECTION PROJECT Pg. 46
49 Visual classifications; Moisture content; Atterberg limits; Grain size distribution; Unconfined compression tests; Unconsolidated undrained compression tests; Consolidated undrained compression tests with pore pressure measurements; Consolidated drained compression tests; and Consolidation tests. The results of laboratory testing varied substantially by soil type, location along the canal, and the depth. The values reported in DM 19A are included in Appendix F. The shear strength versus depth plots used in the design are included on Plates 60 and 61 of DM 19A. The shear strength versus depth properties were estimated to be similar within the following four canal reaches: Station 0+00 to Station 21+00; Station to Station 37+00; Station to Station ; and Station to Lake. The shear strength versus depth reaches were modified based on recent laboratory and insitu testing and analyses Recent Laboratory And In-Situ Testing Grain Size And Moisture Content Some of the vibracore samples obtained from the canal bottom were subjected to laboratory sieve and hydrometer testing to evaluate whether the soils in the bottom of the canal would act as a blanket that would restrict flow to the underlying beach sands. Typically, sands with less than about 10 percent fines are generally considered to be clean and have permeability values greater than about 10-3 cm/sec. If these types of soils overlay the beach sands in the bottom of the canal it can be concluded that a retarding blanket does not exist. If soils with greater than 10 percent fines are present at the base of the canal, depending on the thickness, a blanket condition is possible. This criterion was used in this study to identify the two types of soils. Where gradation results were available, the analysis was straight forward. However, gradation testing was not performed on all samples. For samples that were visually classified as poorly graded sands (SP with less than 5 percent March 2011 LAKE PONTCHARTRAIN AND VICINTY HURRICANE PROTECTION PROJECT Pg. 47
50 fines) the percentage of fines was set at less than 10 percent for this analysis. To establish the percentage of fines for visually classified fine grained samples with greater than 50 percent fines, silt (ML), elastic silt (MH), lean clay (CL), or fat clay (CH), a second criterion was applied. The percentage of fines for these visually classified samples was set at greater than 50 percent for this study. A moisture content determination was also made for most of the vibracore samples. Table A.2-1 in Appendix A.2 provides a tabulation of the moisture content and grain size testing data for the vibracore samples Permeability Grain size analyses of samples recovered during the subsurface investigations for this study were used to estimate the permeability of the two barrier beach sand materials, the poorly graded sands and silty sands, and the canal bottom sediments. In-situ falling head tests were also performed in piezometers installed within the upper silty sand layer of the barrier beach sand stratum. These tests were located primarily in the north end of the canal Shear Strengths And Unit Weights Undrained shear strength data were obtained from: 1) the London Load Test data; 2) laboratory testing of undisturbed samples performed during this study; 3) CPT and VST insitu testing performed during this study; and 4) data presented in DM 19A [6]. Unit weight data obtained from laboratory testing of DPT samples was also used to supplement the unit weight data included in DM 19A. The results of the laboratory testing are provided in Appendix F. 6.6 DESIGN PERMEABILITY VALUES The permeability of the barrier beach sands and canal bottom sediments were recognized to be critical parameters that needed to be accurately estimated in order for the seepage analyses of the various reaches of the canal to represent the insitu conditions. Recommended permeability values to be used in this study were provided in a Memorandum [24] dated July 19, 2009 and authored by Noah Vroman of the Corps Engineering Research and Development Center (ERDC). These estimated values are presented in Table 6-4. The recommendations include permeability values for the barrier beach sands and canal bottom sediments and the less critical marsh cl a y and bay sound clay strata, all of which are required for the seepage analyses of the various canal reaches. The sheet pile permeability was assumed set at 3 x10⁻⁹ cm/sec (1x10⁻¹⁰ ft/sec) to represent a relatively impermeable condition. March 2011 LAKE PONTCHARTRAIN AND VICINTY HURRICANE PROTECTION PROJECT Pg. 48
51 TABLE 6-4 ERDC RECOMMENDED LONDON AVENUE CANAL MATERIAL PERMEABILITIES STRATUM SOIL CLASSIFICATION (USCS) PERME- ABILITY (Kx) (cm/sec) PERME- ABILITY (Kx) (ft/sec) PERME- ABILITY RATIO (Kv/Kh) Fill clay (levee) CH, CL 1x x Marsh clay CH with roots, wood 1x x Beach silty sand SP-SM (10% to 15% fines) 7x x Beach sand SP (5% or less fines) 1.5x x Bay sound clay CH, CL 1x x Canal sediments ( if present) SM,ML 1x x Note: Soil classifications are in accordance with the Unified Soil Classification System [26] Validation Of ERDC Permeability Recommendations The ERDC recommended permeability values were validated based on the following data. The permeability of poorly graded barrier beach sand stratum was estimated from the results of a pump test performed near the London Avenue Canal. These results were checked using correlations with grain size data developed by Batool and Brandon [27] and for this study. The permeability of the silty sand layer, which sometimes is present at the top of the poorly graded barrier beach sand stratum, was evaluated by in situ falling head tests at the site of the London Load Test site. Additional falling head tests were performed during this study. These results were also checked using correlations with grain size data developed by Brandon [27] and for this study. Finally, the permeability of the canal bottom sediments were estimated during this study based on correlations with grain size data London Avenue Canal Pump Test Permeability Data For Poorly Graded Sand A pump test [25] was performed adjacent to the London Avenue Canal by the Corps in 2006 to evaluate the permeability of the barrier beach poorly graded sand stratum. The test site was located on the west side of the canal, across from the London Load Test location, south of Robert E. Lee Avenue and north of Filmore Avenue. The screened zone for the test was within sands described as poorly graded sand (SP) or poorly graded sand with silt (SP-SM) according to the Unified Soil Classification System (USCS) [26]. The fines content of the samples obtained within the screened zone ranged from 2.9 to 5.9 percent. The USCS defines poorly graded sands as material with 5 percent or less fines and poorly graded sand with silt as material with a fines content of 5 to 12 percent. The estimated permeability of the beach sand in this test ranged from 1.0 x 10⁻² cm/sec to 2.4 x 10⁻² cm/sec, with an average of about 1.5 x 10⁻² cm/sec. March 2011 LAKE PONTCHARTRAIN AND VICINTY HURRICANE PROTECTION PROJECT Pg. 49
52 London Avenue Canal Permeability Of Poorly Graded Sand Based On Correlations With Grain Size Data The permeability of the barrier beach poorly graded sand stratum at the London Load Test location was also estimated b y Batool and Brandon [27] using correlations with grain size data. Samples of the sand were obtained from borings in the area of the load test and grain size analyzes were performed. Both the Hazen s Formula and the Kozeny-Carman relationship were used to estimate the permeability with the following results. Hazen s Formula 1.16 x 10⁻² cm/sec; and Kozeny-Carman relationship x 10-2 cm/sec. These values compare favorably with the pump test results described above. The ERDC recommended permeability value of the poorly graded beach sand presented in Table 6-4 was consistent with the results of the pump test and grain size correlation analyses presented above. During this study the permeability of the poorly graded sands were further evaluated using the results of the grain size analyses. The permeability of these materials was estimated using the following two methods: Hazen's Formula; and Figure 17 from Corps Technical Memorandum (TM) [32]. The results of the analyses for the poorly graded beach sand samples obtained from the borings along the levees and from below the canal bottom sediments, respectively, are shown in Figures 6-1 and 6-2. The Hazen formula and the TM generally predict permeabilities that are similar to the previous studies discussed above and cluster around the permeability value, k = 1.5 x 10⁻² cm/sec, recommended by ERDC [24] in Table 6-4. This value is shown as the red line in Figures 6-1 and 6-2. The Hazen formula appears to provide more accurate results than the results obtained using the TM for the same grain size data. Based on these results, and the results discussed above, the ERDC recommended value, k = 1.5 x 10⁻² cm/sec, was deemed reasonable and conservative and was used in this study. March 2011 LAKE PONTCHARTRAIN AND VICINTY HURRICANE PROTECTION PROJECT Pg. 50
53
54 London Avenue Load Test In Situ Falling Head Permeability Tests for Silty Sand The presence of a silty sand (SM) overlying the poorly graded barrier beach sand (SP) was not known at the time the London Load Test site was selected. This layer was about 9 feet thick and by definition had more than 12 percent fines. The impact of the difference in permeability of these two sands was illustrated during the performance of the London Load Test discussed below. The silty sands significantly reduced the flow from the I-wall gap to the underlying poorly graded sands and provided significant head loss which reduced the uplift forces on the base of the protected side marsh clay layer and thus improved the stability of the I-wall levee embankment and foundation and the potential for excessively high ground surface exit gradients. The permeability of the silty sand layer was estimated by performing a series of in-situ falling head or slug tests in piezometers installed for the London Load Test and were evaluated by Batool and Brandon [27]. The results of nine tests ranged from 2.68 x 10⁻³ to 0.27 x 10⁻³ cm/sec and the average value was 1.59 x 10⁻³ cm/sec or about an order of magnitude lower than for the poorly graded sand stratum located below this silty sand layer London Avenue Canal In Situ Falling Head Permeability Tests For Silty Sand Additional in-situ falling head tests were performed in piezometers installed within the upper silty sand stratum in These tests were located primarily in the north end of the canal adjacent to the CPTs shown in Table 6-5. Six of seven test resulted in a range of permeability values from 2.42 x 10⁻³ to 3.46 x 10⁻³ cm/sec and appear to support the previous results from the London Load Test where the average permeability value was 1.59 x 10⁻³ cm/sec. The value recommended by ERDC was 7 x 10⁻⁴ cm/sec. TABLE 6-5 AVERAGE PERMEABILITY VALUES OBTAINED IN SILTY SAND STRATUM FROM IN-SITU FALLING HEAD TESTS PIEZOMETER NUMBER ADJACENT CPT STATION AVERAGE PERMEABILITY K (CM/SEC) LCEP-1 LECPT-41PT East 2.42 x 10⁻³ LCEP-2 LECPT-43PT East 3.18 x 10⁻³ LCEP-3 LECPT-45PT East 3.46 x 10⁻³ LCWP-1 LWCPT-88PT West 3.20 x 10⁻³ LCWP-2 LWCPT-89PT West 2.79 x 10⁻³ LCWP-3 LWCPT-91PT West 3.43 x 10⁻³ LCWP-4 LWCPT-93PT West 5.78 x 10⁻⁴ COMPLETED IN 2010 March 2011 LAKE PONTCHARTRAIN AND VICINTY HURRICANE PROTECTION PROJECT Pg. 52
55 London Avenue Canal Permeability Of Silty Sand Based On Correlations With Grain Size Data The permeability of this layer was also estimated by Batool and Brandon [27] on the basis of grain size data from samples obtained in borings in the area of the London Load Test with the following results. Hazen s Formula 2.79 x 10⁻³ cm/sec; and Kozeny-Carman relationship x 10-3 cm/sec. These values compare favorably with results obtained from the in-situ falling head tests. The ERDC recommended permeability of the silty sands, k = 7 x 10⁻⁴, was about 50 percent lower than the average value obtained in the in-situ falling head tests and grain size correlation analyses. To validate the ERDC recommended permeability value for silty sand an additional correlation analysis was performed using grain size data for samples collected during this study from below the levees and protected side marsh clays. The permeabilities of these materials were estimated using the same two methods described above: Hazen's Formula; and Figure 17 from Corps Technical Memorandum (TM) [32]. Both of these methods were developed for use with sands with low fines contents, such as poorly graded sands (SP). They were not developed for use with sands containing significant amounts of fines The silty sands evaluated in this study typically contained 10 to 15 percent fines (SP-SM or SM) and the methods are considered suitable for use with these types of materials. The estimated permeability values for the silty sands cluster between about 3 x 10⁻³ and 9 x 10⁻³ cm/sec and are about an order of magnitude higher than the ERDC recommended permeability value of 7 x 10⁻⁴ cm/sec as shown by the green line in Figure 6-3. March 2011 LAKE PONTCHARTRAIN AND VICINTY HURRICANE PROTECTION PROJECT Pg. 53
56
57
58 test data were inadequate. In accordance with the above referenced HSDRRSDG guidance, Q-tests, as well as CPTs and VSTs, were given more weight than UCTs when estimating shear strengths. Q-tests are typically performed at three different confining pressures and are more representative of in-situ undrained strengths whereas UCTs are not confined and typically exhibited lower strength values than the Q-tests. Vane shear tests represent in situ undrained strengths. Shear strengths were developed from CPT data based on the following relationship: S u = q c /N c ; where N c = 20. The N c value was assumed based on the Corps historical knowledge of the soils in the New Orleans area. Typically the Corps has found that undrained shear strengths obtained from this relationship are equivalent to or lower than undrained shear strengths obtained from VSTs. The shear strength verses depth relationships recommended in DM 19A [6] for design of the I-walls south of Station were adopted for use in this study. These reaches were not considered critical from a stability perspective Throughout the remainder of the canal north of Station along both west and east levees the shear strengths used in the analyses were based on values obtained from DM 19A, the IPET Report [1] London Avenue Load Test [8, 9] and from borings, CPTs and VSTs completed for this study [10]. The undrained shear strengths of the Marsh clays under the centerline of the levees were estimated from data included in DM 19A [6] or more recent laboratory testing on samples obtained below the crest of the levees or from CPT [10] data obtained along the crest of the levees. During this MOWL study, lower undrained strengths were used for the marsh clays at and beyond the levee toes as recommended by the IPET Report [1]. The undrained shear strength of the Marsh clays at the toes of the levees was based on recent laboratory testing on samples obtained below the levee toes or from CPT and VST data [10] where data were available. In no case were undrained shear strength values selected that were greater than 95 percent of the centerline undrained shear strength values. If only DM 19A [6] data were available from the centerline, the toe shear strengths values were reduced 5 percent to account for reduced vertical stress at the toes of the levees. There were no laboratory, CPT, or VST data available for evaluation of the undrained shear strengths of the marsh clays on the flood side toes of the levees, the undrained strengths of these soils were assumed to be the same as for the protected side toes. These strengths had little effect on the global stability analyses and they did not impact the gap analyses. March 2011 LAKE PONTCHARTRAIN AND VICINTY HURRICANE PROTECTION PROJECT Pg. 56
59 The shear strength properties of the beach sand stratum were assumed to be the same as used in the IPET Report [1] analyses. The undrained shear strength of the bay sound clays were obtained from DM 19A [6] and post Katrina laboratory testing [10] and CPT testing [10]. If no undrained shear strength data were available, the undrained shear strength versus depth relationship was estimated by the c/p ratio discussed above. The averages of unit weights for the marsh clay and bay sound clay strata were obtained from DM 19A [6] and post Katrina laboratory testing [10]. These data represented the values from under the centerlines of the levees. Average unit weight values for these strata along the protected side toes and flood side toes of the levees were assumed to be the same as reported for the centerline except along the east levee toe. Unit weights of the marsh clay stratum north of about Station along the east levee toe were obtained from laboratory testing of DPT samples [10]. The unit weight of the underlying beach sand stratum was assumed to be the same value used in the IPET Report analyses [1] of the London Avenue Canal failures. Graphs summarizing the water contents, unit weights and shear strengths versus depth for each canal reach were plotted to evaluate the properties. The selected design relationship between soil strength and depth and unit weight and depth for each reach are included on these graphs which may be found in Appendix B. A summary of the canal reach data including shear strength and unit variations with depth is include in Appendix A LONDON AVENUE CANAL I-WALL LOAD TEST A full-scale I-wall load test was conducted on the London Avenue Canal (London Load Test) in the summer of 2007 to evaluate the MOWL at a specific location along the 3.2-mile long canal with the intent to then extrapolate the results to estimate the MOWL for the entire canal. The load test was conducted on the east side of the canal south of Robert E. Lee Avenue near the intersection of Warrington Drive and Burbank Drive between Stations and This site is located south of the I-wall section that tilted during Katrina. The tilted section of I-wall was located across the canal from the north breach Load Test Description And Preliminary Results The test section was selected based on a study [18] of existing subsurface data along the canal by the Mississippi Valley Division (MVD) Corps Technical Team selected to develop criteria for the load test. This team consisted of Noah Vroman, with the Corps Engineering Research and Development Center (ERDC), Neil Schwanz, with the Mississippi Valley March 2011 LAKE PONTCHARTRAIN AND VICINTY HURRICANE PROTECTION PROJECT Pg. 57
60 Saint Paul District (MVP) Corps, and Tom Brandon a professor at the Virginia Polytechnic Institute and State University (Virginia Tech). The crest of the levee at the test section was at about El +2 NAVD88 and the protected side toe grade was about El -5.7 NAVD88. A cross section of the test section is included as Figure 6-5 [11]. The test section consisted of five 30-foot long I-wall panels. These panels were isolated from the canal by the construction of a rectangular shaped sheet pile cofferdam extending from the I-wall, north and south of the test section, about 25 feet into the canal. The cofferdam extended to approximately to the flood side levee embankment toe of slope The test site was instrumented with a variety of piezometers, extensometers, inclinometers, and other instrumentation, to assess the behavior of the wall and foundation soils as the hydraulic load on the wall was incrementally increased by filling the cofferdam. FIGURE 6-5 LONDON AVENUE I-WALL LOAD CROSS SECTION [11] The stratigraphy in the load test area consisted of the parallel levee fills to the east and west of the canal itself, overlying in order, marsh clay, barrier beach sand, and bay sound clay. The levee consisted of stiff to very stiff consistency fat clay (CH) with sand pockets, wood fragments, and roots. The levee fill extends from the ground surface at about El -4 to -6 NAVD88 for a total thickness of approximately 6 to 8 feet. The marsh clay consisted of very soft to soft consistency clay (CH) with wood fragments and roots. These clays March 2011 LAKE PONTCHARTRAIN AND VICINTY HURRICANE PROTECTION PROJECT Pg. 58
61 extended to about El -8 to -12 NAVD88 for a total thickness of about 3 to 8 feet. Recent canal sediments and marsh clays were present in the canal bottom and were about 0.5 to 3 feet thick in most locations, but in one area the underlying beach sands were exposed. The beach sand stratum consisted of silty sand (SM) overlying poorly graded sands (SP) and extended to about El NAVD88 for a total thickness of about 30 to 35 feet. The stiff consistency bay sound stratum fat clays (CH) underlie the sand layer. Soil classifications symbols represented herein are in accordance with the Unified Soil Classification System [26] The test simulated two canal bottom conditions which were present in the canal bottom beyond the lateral extent of the cofferdam. The first condition assumed that the recent canal sediments and possibly a thin marsh clay layer were present, overlying the beach sand. The second assumed that the beach sand was present at the base of the canal. Wells were drilled through the toe of the levee, within the cofferdam, into the beach sand stratum to simulate the second condition. Casings were installed within these wells and were capped to prevent water in the cofferdam from flowing into the sands during the first stage loading. The load test was performed in two stages. During the first stage of the test the water level was raised from El 0 to El 7 NADV88 in increments of 0.5 feet. Each increment of load was held until the instrumentation indicated that equilibrium had been reached with respect to pore pressure response on the protected side and wall deflection had ceased. During the second stage, water in the cofferdam was allowed to flow down through the wells into the sand layer underlying the marsh deposit and thus increasing the piezometric pressure in the sand as compared to the first condition. The same sequence of loading was performed for the second stage as was used in the first stage of the test. During this stage the piezometric pressure in the sand was directly impacted by the water level in the cofferdam During the test the piezometric pressures in the beach silty sand layer were monitored by flood side and protected side piezometers. The piezometric response decreased with increasing distance from the cofferdam for both loading stages. The piezometric response was linear until the water level in the cofferdam exceeded El 5.5 NAVD88 for the first stage loading which simulated semi-impervious sediments and/or marsh clay in the canal. The higher piezometric measurements beyond the linear response were an indication of the beginning of gap formation. Such a gap would cause the flow path to shorten, resulting in less head loss and higher piezometric pressures in the beach silty sand layer. The piezometric measurements obtained during the second stage loading reflected increased piezometric response in the underlying beach silty sand. The piezometric response was March 2011 LAKE PONTCHARTRAIN AND VICINTY HURRICANE PROTECTION PROJECT Pg. 59
62 increased compared to the first stage loading results. The piezometric data indicate an initial linear trend, followed by an increasing upward trend when water level in the cofferdam exceeded El 5.5 NAVD88. The average slope of data in this stage was about 1.7 times the average slope of the corresponding first stage loading. During the first stage loading to El 7.0 NAVD88 the maximum pore pressure in beach silty sand rose to about El -6.8 NAVD88 or about 1-foot below the protected side toe ground surface. The static water level was at about El -7.8 NAVD88 or about 2.1 feet below the ground surface prior to the test. The seepage factor of safety (FOS) was about 1.7. The seepage FOS is defined as the critical exit gradient divided by calculated exit gradient. The starting static water level prior to the second stage loading was at about El -6.7 NAVD88. During the second stage loading the maximum pore pressure in beach silty sand rose to about El -4.6 NAVD88 or about 1 foot above the ground surface. Only on the final increment of loading to El 7.0 NAVD88 were concerns raised about stability. The seepage FOS was and about 0.8 for the final loading increment. Heave monitoring instrumentation reported no appreciable heave during either test. After all monitoring readings stabilized the water level was lowered to the starting level and the test was terminated. The maximum measured top-of wall movements increased from approximately 0.5 inch with 4 feet of water depth loading the I-wall to 1 5 inches at 6 feet of water depth during the second stage loading. August 2008 the Corps issued a summary report describing the load test and results [9]. (Summary Report) This contains the data collected during the load test; however, a detailed analysis of the data was not performed. The limitations of the test include: Although the test was 150 feet long, extending across five monoliths of the canal I-wall, it did not represent a plane strain loading condition because of the end restraints of the attached unloaded I-walls to the north and south. The seepage regime was impacted by end effects due to the lack of continuous water loading beyond the ends of the test. The load test provided data for the specific test section site, which is similar to, but not the same as, other locations along the canal. Although the general stratigraphy along the length of the canal is relatively consistent there are variations in: 1) the top grade of the beach sand and whether a silty sand (SM) layer is present above the more common poorly graded sand (SP) of this stratum; 2) the thickness and composition of the marsh clays; 3) the depth of penetration of the sheet pile cutoff wall into the top of the beach sands and whether the silty sand layer is present; and 4) the March 2011 LAKE PONTCHARTRAIN AND VICINTY HURRICANE PROTECTION PROJECT Pg. 60
63 hydraulic connection of canal water directly to the surface of the beach sand or through recent canal sediments overlying the beach sand in the bottom of the canal. Variations in any of these factors can change the response of the I-wall to canal hydraulic loading. Subsequent to the test, an assessment of the London Load Test results was performed by the Corps and the interim MOWL for operation of the canal was revised from El 4 to El 5 NAVD88. This revised interim MOWL is discussed in a report [19] titled London Avenue Safe Water Elevation 5.0. The report indicated that the water level in the canal would not be allowed to exceed El 5 NAVD88, until further analyses demonstrated that a higher MOWL could be safely accommodated. After the London Load Test an independent technical peer review team concluded [20], The extensive analyses developed prior to the load test using assumed subsurface conditions should be calibrated to the actual conditions at the site. ---a detailed subsequent analysis will provide a comprehensive confirmation regarding the performance of the I-wall and levee system under sustained loading--- but --- will also confirm and identify other potentially critical conditions along the Canal. Seepage and stability analyses using state of the art analytical tools should be used in the analyses of the canal to expand the results of the load test to other sections of the canal. The detailed analysis of the load test has not been completed as of the date of this report. All data collected during the test has been provided to the HQUSACE Team developing the Corps wide guidance and criteria for I-walls for their consideration Recent Analyses Of London Load Test Results The Corps performed a simplified Soil Structure Interaction (SSI) analysis [21] to evaluate the progression of the gap at the site of the London Load Test. A conservative interpretation of the SSI results for the load test site indicated that the gap should not form until the canal water level was greater than 1.5 ft above the flood-side embankment. The same restrictions apply to extrapolation of the results of this analysis to other I-wall locations along the canal as was described above to extrapolation of the load test results to other sections of the canal. The results of the SSI analysis are provided in Appendix E. The assumption used in this MOWL report, that the gap forms when the canal water level is equal to the flood-side embankment crest elevation is most likely conservative based on this SSI analysis. The Corps also commissioned a finite element seepage analysis of London Load Test [27] piezometric data. A two dimensional analyses was initially performed and failed to March 2011 LAKE PONTCHARTRAIN AND VICINTY HURRICANE PROTECTION PROJECT Pg. 61
64 adequately model the field piezometric measurements. A three dimensional analysis was then performed and was calibrated to the load test results. The greatest uncertainty factors in establishing the model were: 1) the permeability of the silty sand layer underlying the marsh clay at the top of the beach sand stratum; 2) the location of the protected side constant head boundary; and 3) the value of the head at this boundary. An optimization procedure was used to evaluate these uncertainty values and ultimately it was possible to define them such that the model correctly predicted the centerline pore pressures measured during the second stage of the load test. The test validated the assumptions used in this study with respect the location of the protected side constant head boundary at 110 feet from the I-wall and the value of the head at this boundary at two (2) feet below the ground surface. 6.9 POST KATRINA STABILITY AND SEEPAGE ANALYSES PROCEDURES Prior to Hurricane Katrina, MVN utilized the Method of Planes (MOP) stability analysis method [42] to design the original I-wall levee parallel protection systems. This stability analysis method is a wedge method which only satisfies horizontal equilibrium. It considers the soil mass above a slip surface and consists of three wedges the active, the neutral and the passive. It has been demonstrated [22] that the MOP is generally conservative and that the factors of safety it produces are lower than more modern analysis methods that do satisfy all conditions of static equilibrium. Following Hurricane Katrina, it was agreed to use the universally accepted Spencer s Method [5], which satisfies all of the conditions of equilibrium for future stability analyses as the primary method of analysis and MOP used as a check. It was also agreed to use finite element seepage analysis when specific projects dictate this level of analysis LEVEE REACHES The canal was originally divided into several reaches along both the east and west levees in DM No. 19A [6] and was modified during construction as indicated by the as built drawings [11] provided by the Corps. The as built reaches were identified in Table 6-1. Extensive additional subsurface investigations and topographic and bathymetric surveys have provided additional information to characterize in greater detail the conditions along the canal. This information was used during this study to further divide the east and west floodwalls into a larger number of reaches than originally existed Reach Definition To define the new reaches, the floodwalls along the canal were initially divided into two general areas based on the elevation of the top of the underlying barrier beach sand stratum. March 2011 LAKE PONTCHARTRAIN AND VICINTY HURRICANE PROTECTION PROJECT Pg. 62
65 The beach sand stratum is deeper south of about Station 35+00, where the top of the stratum varies between about El -40 to -45 NAVD88. Between about Stations and the beach sand stratum slopes up to about El -10 NAVD88. North of about Station 40+00, the top of the beach sand stratum varies between a high of about El -8.5 NAVD88 and a low of about El -15 NAVD88. The canal was further subdivided into the reaches based on I-wall sheet pile cutoff wall tip elevations. Finally, the geotechnical properties, ground surface grades of the embankment and canal, and the possibility that there was a direct hydraulic connection between the bottom of the canal and the underlying beach sand stratum were used to further subdivide the canal and additional reaches were added. Specifically, the canal reaches referenced in this study were developed based on the following four criteria. I-wall Sheet Pile Tip Elevations - The tip elevations of the sheet pile cut off walls below the I-walls vary along the canal alignment on both banks The reaches were selected such that the sheet pile tip elevations are consistent throughout an individual reach. Stratigraphy, Soil Strength, and Unit Weights The reaches were selected such that the undrained shear strengths and unit weights of the clays thickness of the marsh clays and the top of the beach sand are relatively consistent throughout an individual reach. Ground Surface Elevations - The cross section of the levees vary along the canal alignment. The lowest protected side crest and toe ground surface grades were selected for each reach and these grades were used throughout an individual reach. Reaches were then selected based on similar ground surface elevations. Direct Connections between the Canal Water and Beach Sand Deposit - The areas along the canal where a direct hydraulic connection to the beach sand was estimated to exist were designated separate reaches. The canal was divided into 37 reaches, 19 on the west bank and 18 on the east bank, based on these criteria as shown in Table 6-6. Reaches 18A, 18B, 19 and 37 include only earth levees. Three additional reaches contain either a T-wall or an L-wall and have been excluded from the numbering system in this analysis. The reach locations are shown on Plates 1 through 10 included in Appendix A.4. The bridges were also excluded from the reaches. The footprint width of the bridge abutment embankment is at least 2 to 3 times the I-wall levee embankment footprint, and therefore, seepage and stability is not an issue at these locations. The formation of gaps between the flood side soils and the sheet pile cutoff walls below the bridge abutments are precluded from occurring since they are pile supported. Any remediation that is ultimately March 2011 LAKE PONTCHARTRAIN AND VICINTY HURRICANE PROTECTION PROJECT Pg. 63
66 recommended adjacent to a bridge abutment must be analyzed for wrap-around underseepage if the sheet pile cutoff wall under the abutment has a higher tip elevation than the proposed remediation sheet pile cut-off wall Reach Geometry And Geotechnical Properties A summary of the design data used to evaluate each reach is included in Appendix A.3. This summary provides a brief description of the following items for each reach. How the station limits were established for each reach; How the field investigation data were used to develop the stratigraphy for the reach; and The elevations of the following critical components within each reach; o Top of floodwall; o Flood side levee crest; o Protected side levee crest; o Protected side levee toe; and o Sheet pile cutoff wall tip. Four reaches included only levees. The crests of these levees are above El 10.0 NAVD88, the maximum MOWL considered in this study. The existing elevations of the tops of the floodwalls and the other features were obtained from the recent surveys. The cross sections developed from these survey data that were used to evaluate each reach are included in Appendix A.4 on Plates 73 through 92. The survey cross sections include the original design ground surface cross sections and the revised design ground surface cross sections used in this MOWL Study. Plates 1 through 10 in Appendix A.4 provide an aerial view of the canal alignment. The reach locations are indicated on these plates. March 2011 LAKE PONTCHARTRAIN AND VICINTY HURRICANE PROTECTION PROJECT Pg. 64
67 TABLE 6-6 LEVEE REACH LOCATIONS WEST EAST REACH WALL BASELINE WALL BASELINE TYPE APPROXIMATE REACH TYPE APPROXIMATE STATION STATION 1 I-wall 2+44 to I-wall 1+57 to I-wall to I-wall 6+30 to GENTILLY AVENUE to I-wall to I-wall to GENTILLY AVENUE to I-wall to I-wall to I-wall to I wall to I-wall to I-wall to A I-wall to I-wall to B I-wall to A I-wall to I-wall to B I-wall to I-wall to I-wall to MIRABEAU AVENUE to I wall to I-wall to MIRABEAU AVENUE to I-wall to I-wall to I-wall to T-wall to FILMORE AVENUE to I-wall to A I-wall to I-wall to B I-wall to FILMORE AVENUE to I-wall to I-wall to I-wall to I-wall to I-wall to I-wall to I-wall to PUMPING STATION to NO. 4 T-wall to A I-wall to I Wall to B I-wall to ROBERT E LEE AVENUE to L-wall to A Levee to ROBERT E LEE AVENUE to B Levee to I-wall to LEON C. SIMON LEON C SIMON AVENUE to to AVENUE 19 Levee to Levee to March 2011 LAKE PONTCHARTRAIN AND VICINTY HURRICANE PROTECTION PROJECT Pg. 65
68 7.0 EXISTING SAFE WATER CONDITIONS The majority of the reaches along the east and west banks of the London Avenue Canal are adjacent to residential neighborhoods. The University of New Orleans is also located along the east bank of the canal, north of Leon C. Simon Boulevard. As the city has grown, single and multi-unit homes, apartments, condominiums, businesses, infrastructure, roads, bridges, and other urban developments have been constructed in proximity to the canal and, in some cases, have encroached nearly to the toes of the levees. This development has the potential to adversely impact the MOWL due to the conditions on the protected side of the levee. The following section discusses the analysis procedures and results used to evaluate the existing MOWL along the canal. 7.1 EXISTING SAFE WATER CONDITIONS ANALYSIS The existing MOWL along the London Avenue Canal were evaluated. The following four potential failure modes were analyzed for each I-wall reach: Global stability; Gap analysis - only applicable to I-walls; Wall rotation; and Seepage The stability of the T-walls, L-wall, pump station walls and the pump stations was also evaluated. Global stability is the overall stability of the levee and floodwall at high water with no formation of a gap on the flood side face of the I-wall. The critical failure surfaces for global stability are deep-seated, where the entire levee and floodwall system slides in the landside direction. The pore pressures from the gap analyses were used in the global stability analyses as recommended by the Technical Review Team (TRT). Both the Spencer s Method [5] and the Method of Planes (MOP) [42] analyses were used to evaluate slope stability in accordance with the methodology identified in Section 4.7 of this report. The program SLOPE/W Version 7.16 [41] was used in the analyses. The subsurface conditions at each reach of the London Avenue Canal were evaluated for both a block and a circular failure. The critical failure surface identified was further optimized by the internal methodology included in the SLOPE/W software. March 2011 LAKE PONTCHARTRAIN AND VICINTY HURRICANE PROTECTION PROJECT Pg. 66
69 The gap analysis was based on the formation of a gap on the flood side of the I-wall. A gap condition does not occur for T-walls or L-walls because they are both supported by batter piles to substantially reduce deflection during loading. The formation of a gap results in several major impacts on the MOWL evaluation. The full hydrostatic pressure is introduced to the base of the gap; The length of the critical failure surface is reduced; and The length of the seepage path is potentially reduced. By introducing hydrostatic head from the canal to a point below the top of the marsh clay stratum in the barrier beach sands causes a reduction in the length of the seepage path. The reduced head loss due to a reduced seepage path length also increases uplift pressures below the marsh clay stratum which could result in rupture. The increase in pore pressures in the sand also reduces the shear strength of the sand and increases the exit gradient at the toe of the levee. The depth of the gap was estimated in accordance with the methodology identified in Section 4.6 of this report. This procedure was used to calculate the maximum gap that could develop based on the undrained shear strength of the levee clay and marsh clay. The calculated maximum gaps were used in the stability and seepage analyses. During the computation of the gap depths, it was determined that the methodology was relatively insensitive to the water height on the flood side of the floodwall. Based on this methodology, any water height on the I-wall above the levee crest will result in the same calculated gap depth. The piezometric surface for each reach was developed using the SEEP/W Version 7.16 [41], which allows direct transfer of soil pore water pressures into SLOPE/W Wall rotation is controlled by the ability of the floodwall system to resist movement toward the protected side The potential for movement is controlled by the depth of sheet pile penetration, the deformation properties of the supporting soil on the protected side, and the stiffness of the wall member. The embedded I-wall sheet pile sections, as indicated on the as built drawings [11] are PZ 22, Sypro SPZ-22, Casteel CZ-101, and Arbed AZ-18. The potential for wall rotation was estimated based on sheet pile penetration and penetration ratio. The potential seepage failure mode involves active seepage forces that are capable of displacing and transporting subsurface material due to high ground surface exit gradients. The erosion occurs from the ground surface back towards the source of seepage. This type March 2011 LAKE PONTCHARTRAIN AND VICINTY HURRICANE PROTECTION PROJECT Pg. 67
70 of erosion is called piping and it can result in ultimate failure of the levee embankment. Three conditions are required to achieve a piping failure mode: Sufficient exit gradient; Unfiltered exit; and Erodible material. At the London Avenue Canal, all three conditions exist for a potential piping seepage failure. The exit gradient is increased by formation of a gap adjacent to the I wall and the ground surface along the canal levees where piping could initiate is unfiltered. The marsh clays are not particularly erodible but the beach sand below the clay is erodible. In locations where the marsh clays are thin, or lenses of sand exist within the clays, the potential for piping is increased. Where the marsh clays are thin, the potential for soil rupture due to the high uplift pressures at the base of the clay could also facilitate piping. An additional concern is a direct seepage path from the base of the canal under the sheet pile tips within the beach sands. This can occur when the bottom of the canal penetrates the top of the beach sand stratum. For T-walls, or L-walls an additional condition that may occur is roofing caused by settlement of the soil below the pile-supported wall base slab. This condition is mitigated by the continuous sheet pile anchored in the base slab that will cut off any void below the base slab. The minimum embedment of the sheet pile into the concrete base slab is 9 inches. A steel reinforcement bar is also required to be placed through the sheet pile and then anchored into the concrete base slab Because the MOWL is controlled by specific failure modes, the FOS for each failure mode is reported for each reach Global Stability The global stability analyses were performed under the condition potential failure surfaces could penetrate up to 5 feet above the tip of the I-wall sheet pile. The sheet pile was assigned a high shear strength above 5 ft from the sheet pile tip to restrict the SLOPE/W program from identifying a controlling failure surface from penetrating the sheet pile above this level. This requirement is conservative compared to the guidelines discussed in Section 4.8 of this report for the I-wall gap analysis where potential failure surfaces are required to pass below the sheet pile tip. The effect is to cause the global stability analyses to yield lower factors of safety than would be the case if the potential failure surfaces were restricted to below the sheet pile tips. March 2011 LAKE PONTCHARTRAIN AND VICINTY HURRICANE PROTECTION PROJECT Pg. 68
71 The piezometric surfaces determined from the gap analyses were conservatively used in the global stability analyses as recommended by the TRT. In several reaches, sheet piles from previous floodwalls remained in place on the protected side of the I-walls after the I-walls were constructed. The older sheet piles were located based on the as-built drawings [11] and were included in the global stability analyses. However, since they have higher tip elevations than the I-wall sheet piling they did not impact the overall global stability analyses. The MOWL was first determined by the Spencer s Method [5] of analysis and was checked using the MOP [42] methodology. The MOP analysis is performed in two steps. In the first step the MOP program was allowed to identify the most critical active wedge If the critical active wedge did not intercept the sheet pile at a height greater than 5 feet above the sheet pile tip, the analysis was continued using this active wedge location If the critical active wedge found in this first step intercepted the sheet pile at a height greater than 5 feet above the sheet pile tip, the active wedge was restrained at the most critical active wedge that penetrated the bottom 5 feet of the sheet pile. The results of the global stability analysis, including the global MOWLs and FOSs are presented in Table 7-1. The MOP input, output, and plots of each reach are presented in Appendix D.1. The Spencer s Method analyses are located in Appendix D.3 along with input and output reports Executable input files are located in Appendix F. In Reaches 27, 34, and 35A, the MOP stability analysis controlled the MOWL Gap Analysis In contrast to the global stability analyses, all potential failure surfaces for the gap analyses were initiated at the I-wall sheet pile tip. For the SLOPE/W analyses, the full length of the sheet pile was assigned a high shear strength to restrict the program from identifying a controlling failure surface through the sheet pile. The piezometric surfaces determined from the Seep/W seepage analyses that considered a gap were used in the gap stability analyses. In several reaches, sheet piles from previous floodwalls remained in place on the protected side of the I-walls after the I-walls were constructed as noted above. The location of the piles and the tip elevations were determined from the as-built drawings [11]. They were removed from the models since they were located on the flood side of the existing I-walls. March 2011 LAKE PONTCHARTRAIN AND VICINTY HURRICANE PROTECTION PROJECT Pg. 69
72 TABLE 7-1 GLOBAL STABILITY MOWLS AND FACTORS OF SAFETY FOR I-WALLS WITHIN LEVEES AND FOR LEVEES WITHOUT I-WALLS SPENCER S METHOD MOP SPENCER S METHOD MOP WEST REACH MOWL NAVD88 FOS MOWL NAVD88 FOS EAST REACH MOWL NAVD88 FOS MOWL NAVD88 FOS A B A B A B A B A B Note: 1 MOP MOWL controls (Result is BOLD) The MOWL identified in the Spencer s analysis was checked using the MOP methodology. The MOP analysis was again performed in two steps. In the first step the MOP program was allowed to identify the most critical active wedge. If the critical active wedge did not intercept the sheet pile above the sheet pile tip, the analysis was continued using this active wedge location. If the critical active wedge determined in this first step was found to March 2011 LAKE PONTCHARTRAIN AND VICINTY HURRICANE PROTECTION PROJECT Pg. 70
73 intercept the sheet pile above the sheet pile tip, the active wedge was restrained at the most critical active wedge that did not penetrate the sheet pile. When the MOP stability analysis indicated that the gap penetrated to the tip of a sheet pile, the fully penetrating gap case, the stability analysis was performed with the soil load removed and a hydrostatic water load equivalent to that used in the Spencer s Method analysis applied to the tip of the sheet pile. Below the sheet pile tip, the water pressure previously calculated from the Seep/W analysis, was added for the MOP analysis. When the analysis indicated that the gap only penetrated a portion of the distance to the tip of the sheet pile, the partially penetrating gap case, a force was added to the sheet pile to account for the lateral earth pressure. The stability analysis was performed with the soil removed to the sheet pile tip and a hydrostatic water load, equivalent to that used in the Spencer s Method analysis was applied to the depth of gap penetration Below this level the water pressure previously calculated from the Seep/W analysis was used in the MOP analysis. The modifications to the MOP analysis required for the gap analysis and to calculate the required force to accommodate the partially penetrating gap case are included in Appendix D.2. The results of the gap stability analyses, including the gap MOWLs and FOSs, are presented in Table 7-2. The results of the gap stability analyses are provided in Appendix D.2 for the MOP methodology and D 3 for the Spencer s Method analysis along with input and output reports. Executable input files are included for review in Appendix E. The MOP analysis was the controlling analysis in Reaches 12A, 31, 34, and 35A. The presence of beach sand in the base of the canal in Reaches 31 and 35A had an impact on the stability of these reaches I-Wall Rotation These analyses provided a check of the I-wall sheet pile against minimum criteria presented in Section 4.5. The criterion limits the water height (H 1 ) on the I-wall to 4 feet or less above the protected side levee crest. The minimum penetration depth (D) criterion for the sheet pile wall is 10 feet below the lowest levee crest. This is a straightforward check that does not relate to the water level in the canal. The penetration ratio D/H 1 is required to be at least 3. Table 7-3 provides a summary of the I-wall stability for each canal reach. March 2011 LAKE PONTCHARTRAIN AND VICINTY HURRICANE PROTECTION PROJECT Pg. 71
74 TABLE 7-2 GAP STABILITY MOWLS AND FACTORS OF SAFETY FOR I-WALLS WEST REACH BASE ELEVATION GAP NAVD88 SPENCER S METHOD MOWL NAVD88 FOS ADJUSTED MOP MOWL NAVD88 FOS EAST REACH BASE ELEVATION GAP NAVD88 SPENCER S METHOD MOWL NAVD88 FOS MOWL NAVD88 MOP A B A B A B A B A LEVEE 37 LEVEE 18B LEVEE 19 LEVEE All reaches met the minimum sheet pile penetration depth of 10 feet. The D/H 1 ratio limits the MOWL to slightly below El 10 NAVD88 for Reaches 24, 25, 30, and 36. In every reach, limiting the water depth on the I-walls to 4 feet above the levee crests reduces the MOWL to below El 10 NAVD88. The lowest MOWL, based on this criterion is El 6.2 NAVD88 in Reach 35B and the highest is El. 9.8, in Reach 29. FOS March 2011 LAKE PONTCHARTRAIN AND VICINTY HURRICANE PROTECTION PROJECT Pg. 72
75 TABLE 7-3 LONDON AVENUE CANAL WALL STABILITY WEST REACH PROTECT SIDE CREST ELEVATION NAVD88 FLOOD SIDE CREST ELEVATION NAVD88 SHEET PILE TIP ELEVATION NAVD88 SHEET PILE PENETRATION (D) (FT) MAXIMUM MOWL D/H1 = 3/1 NAVD88 MAXIMUM MOWL - 4 FT WATER ON WALL NAVD88 EAST REACH PROTECT SIDE CREST ELEVATION NAVD88 FLOOD SIDE CREST ELEVATION NAVD88 SHEET PILE TIP ELEVATION NAVD88 SHEET PILE PENETRATION (D) (FT) MAXIMUM MOWL D/H1 = 3/1 NAVD88 MAXIMUM MOWL - 4 FT WATER ON WALL NAVD A B A B A B A B A NA NA NA NA NA NA NA NA 18B NA NA NA NA NA NA NA NA Note: NA indicates not applicable, no I-wall The stability of the I-walls was also evaluated by the CWALSHT program [40] for a MOWL of El 10 NAVD88. All analyses were performed by applying a FOS = 1.5 to the active and passive soil strengths. In accordance with MVN Corps requirements, the CWALSHT runs were made in design mode. Two cases were evaluated. In case a the canal water level was set at El 10 NAVD88 and the analysis considered wall rotation away from canal. In case b the canal water level was set at El -1 NAVD88 and the analysis March 2011 LAKE PONTCHARTRAIN AND VICINTY HURRICANE PROTECTION PROJECT Pg. 73
76 WEST REACH considered wall rotation toward canal. This is termed the bulkhead case. Every reach was run using both the Fixed Surface Wedge Method and Sweep Search Wedge Method. In order for CWALSHT to generate a solution for case a, the strength of the topmost soil stratum (the embankment) was reduced until a successful run could be made. In all cases the reductions are quite large and in every case, the design sheet pile tip was still above the actual installed tip. Case a results are reported in Table 7-4. In every TABLE 7-4 CWALSHT STABILITY ANALYSIS OF I-WALLS, CASE A MODE SWEEP OR FIXED EAST REACH MODE SWEEP OR FIXED LOWES T CALCU- LATED SHEET PILE TIP GRADE NAVD88 AS- BUILT SHEET PILETIP GRADE NAVD88 STRENGTH REDUC- TION (PSF) LOWEST CALCU- LATED SHEET PILETIP GRADE NAVD88 AS- BUILT SHEET PILE TIP GRADE NAVD8 8 STRENGTH REDUC- TION (PSF) Sweep Sweep Fixed Sweep Fixed Sweep Sweep Sweep Fixed Sweep A Sweep Sweep B Sweep A Sweep Fixed B Sweep Fixed Sweep Sweep Sweep Fixed Sweep Sweep Sweep A Fixed Fixed B Fixed Fixed Fixed Sweep Fixed Sweep Fixed A Sweep Sweep B Sweep Sweep Sweep A NA NA NA NA 37 NA NA NA NA 18B NA NA NA NA 19 NA NA NA NA Note: NA indicates not applicable, no I-wall March 2011 LAKE PONTCHARTRAIN AND VICINTY HURRICANE PROTECTION PROJECT Pg. 74
77 reach, the resulting sheet pile tip elevation was higher than the actual installed sheet pile tip elevation. Therefore, all reaches have a MOWL greater than El 10 NAVD88 according to the CWALSHT analyses. This analysis is very conservative. For case b the CWALSHT program was not able to generate a meaningful solution for any of the analyzed reaches because the active soil pressures were less than the passive soil pressures and the protected side water level was always less than the canal water level The results of the CWALSHT analyses are included in Appendix D.7. The structural analysis of the sheet piles was performed during the original design and is included in DM 19A [6] T-Wall And L-Wall Stability T-walls and an L-wall were constructed as replacement walls for the two breached I-wall sections and one severely deflected I-wall section that occurred during Katrina. These pilesupported walls were designed in accordance with the Corps guidelines current at the time of their design. An analysis of the as-built [11] wall sections was performed in accordance with the guidelines of Section 4.10 of this report. The subsurface profiles were developed based on the elevation of the soil strata and the soil strengths recommended in the IPET Report [1] and the as-built cross sections. The relevant pages from the IPET Report and as-built drawings are included in Appendix F. The sheet piles for both types of walls extend to El 57 NAVD88 or greater, depending on the subsurface conditions. The sheet piles penetrate through the barrier beach sand stratum and into the bay sound clay stratum. The sheet pile walls were assumed impervious for the seepage analysis as recommended by the TRT. It was assumed that the excess piezometric pressure in the sand layer on the protected side of the walls was negligible because the sheet pile was assumed to be impervious and the wall penetrated into the underlying bay sound clay. The limit equilibrium analysis was performed using the Spencer s Method [5] of analysis with the canal water surface at El 10 NAVD88 and using only a block search routine beneath the T-wall. The analyses were performed assuming that the various T-wall and L- wall pile foundations were present. The FOSs for the three replacement wall sections were greater than 1.5. The MOP FOSs were greater than 1.3. Therefore, there are no unbalanced soil loads acting on the walls and no distributed loads on the foundation pile systems. The slope stability calculations are included in Appendix D.4. The ENSOFT program, Group 7 [43], was used to analyze the pile groups for the T-walls and L-wall. The piles supporting the T-Walls and L-Wall are HP 14 by 89 H. A typical pile March 2011 LAKE PONTCHARTRAIN AND VICINTY HURRICANE PROTECTION PROJECT Pg. 75
78 group layout for one T-Wall monolith was used in the analysis, based on the as-built drawings [11]. Since there was no unbalanced load, only the water load acting on the T- walls and L-wall was applied to the pile group. The water load calculation is included in Appendix D.4. For the T-wall constructed near Mirabeau Avenue, two soil subsurface profiles were generated for the analysis. Soil types cannot be varied horizontally in the program, so both the clay compacted fill that was placed to El-30 NAVD88 and the surrounding beach sand could not be modeled. It was possible to model either the beach sand or the compacted clay fill as a continuous horizontal layer. An analysis was performed for each case, and the results were similar with the sand producing slightly higher capacities. The compacted clay fill profile was used for the final analysis. These output files are included in Appendix D.4 The piles were assumed to be pinned and not fixed in the pile cap. This assumption was conservative and resulted in larger pile head deflections. The S and Q cases of pile capacity analysis relate to the use of S or Q strengths in the analysis [30]. The S strength is obtained from a consolidated drained test or may be estimated from a consolidated undrained test with pore pressure measurements or R test. The Q strength is obtained from unconsolidated undrained tests. It was determined that the Q case produced more conservative end bearing and side friction values. The L-wall constructed near Robert E. Lee Boulevard was analyzed assumed that the PZ 22 sheet pile wall would help take the lateral and axial loading. A continuous sheet pile wall could not be analyzed by the program. Therefore an equivalent pile that was two sheet piles wide was spaced at the same spacing as the H-piles. Structural analysis indicated that the amount of reinforcement in both the walls and the footings was sufficient based on both current HSDRRSDG guidelines and EM , Strength Design for Reinforced Concrete Hydraulic Structures [29]. The pile deflections at the top of the pile were less than 0.1 inch for all three of the wall sections analyzed. The moment and shear forces generated in the piles for all three sections of wall were within the required limits for the pile capacities considered. When all of the various analysis results were considered, the MOWL for the T-walls near Mirabeau Avenue and Robert E. Lee Boulevard and the L-wall near Robert E. Lee Boulevard, are greater than El 10 NAVD88. The T-wall and L-wall calculations are provided in Appendix D.4. Table 7-5 provides a summary of the FOS and deflections for each T-wall and the L-wall. March 2011 LAKE PONTCHARTRAIN AND VICINTY HURRICANE PROTECTION PROJECT Pg. 76
79 WALL TYPE T-Wall T-Wall L-Wall TABLE 7-5 STABILITY MOWLS AND FACTORS OF SAFETY T-WALLS AND L-WALL CANAL SIDE West East East STATION to to to Pump Station Wall Stability MOWL NAVD88 SPENCER S METHOD FOS MOP FOS DEFLECTION (IN) < < <0.1 Several walls at DPS 3 will not be differentially loaded hydrostatically during canal operations, as described previously in Section of this report, and were not evaluated. These walls are: 1) the wall separating the discharge pipes which will have equal hydrostatic load on both sides; and 2) the retaining walls on both sides of the discharge basin which will have nearly equal loading on both sides of the walls. On the east side of DPS 3, a wall separates the discharge basin from the bypass canal. The top of this wall is at El 5.0 NAVD88. Flooding has been observed in the past at this wall. This condition sets the current MOWL at DPS 3 at El 5.0 NAVD88. Foundation walls were assumed to be simply supported between the operating floor and the foundation levels. A structural analysis of the DPS 3 walls indicates that the strength and stability of the walls are sufficient for a MOWL of El 5.0 NAVD88 Structural calculations are included in Appendix D.5. The retaining and flood walls at DPS 4 were previously described in Section of this report. The retaining and floodwalls are the critical wall elements that were analyzed for a MOWL of El 10 NAVD88. The top of these walls are at El 12.9 NAVD88 the same as the top of the adjacent I walls. The retaining walls were analyzed as cantilever walls, fixed at the base. The structural analysis of the DPS 4 walls indicates that the strength and stability of the affected walls are sufficient for an MOWL of El 10 NAVD88. Refer to Appendix D.5 for calculations Pump Station Sliding Stability The overall sliding stability of DPS 3 and DPS 4 was evaluated using SLOPE/W. The pile foundations were not included for this analysis, which is conservative. Gap analysis was not used for this evaluation since the structure is pile supported and the analysis cross section was through the intake of the pump station indicating that there is limited soil on the March 2011 LAKE PONTCHARTRAIN AND VICINTY HURRICANE PROTECTION PROJECT Pg. 77
80 protected side of the pump station. The soil parameters from the reach adjacent to the pump station were used for the analysis. The Spencer s Method FOS values for global stability for DPS 3 and DPS 4 were 1.55 and 2.28, respectively, for a MOWL of El 10 NAVD88. The global stability for DPS 3 and DPS 4 were checked by the MOP and the FOS values were 1.59 and 1.33, respectively. In both cases, these FOS exceeded the minimum requirement. Therefore, there is no unbalanced load to be applied to the piling. The analyses are provided in Appendix D Seepage Analysis The seepage analyses performed for this study assumed that a gap forms along the flood side of the I-wall when the water level in the canal is equal to the embankment crest elevation. If the canal water level was below the crest of the levee, no gap was considered. A constant head boundary was established at a distance of 110 feet from the I-wall based on discussions with the TRT. This constant head boundary was set at 2 feet below ground surface grade. In addition, the sheet pile was considered impermeable for all analyses Canal Bottom Sediments Analysis Borings were performed in the canal to obtain samples of canal bottom sediments and underlying marsh clays or barrier beach sands. Table A.2-1 included in Appendix A.2 provides a summary of the visual classifications, moisture contents and grain size data for these samples. As discussed in Section of this report, samples with greater than 10 percent fines were classified as SM and samples with less than 10 fines were classified as SP. This was done for the purposes of identifying soils that restrict flow from the canal bottom into the underlying beach sands which generally classify as SM or ML according to the USCS [26]. Table A.2-1 identifies, at each sampling location, the intervals where poorly graded sands (SP) were encountered, and where silty sands (SM) or sandy silts (ML) were encountered as canal bottom sediments. In locations where the marsh clays were present below these sediments, some samples classified as lean clays (CL) or fat clays (CH). The thickness of the soils that act to reduce the flow and increase the head loss, silty sands, sandy silts, lean clays and fat clays, were tabulated to identify areas with the potential to act as a semiimpervious blanket and to restrict flow to the beach sands. The areas containing only poorly graded sands (SP) or less than 2 feet of finer grained soils were considered to represent the canal bottom in the beach sands. Alternatively, areas of the canal bottom with greater than 2 feet of finer grained soils were considered sufficient to restrict the flow to the beach sands. March 2011 LAKE PONTCHARTRAIN AND VICINTY HURRICANE PROTECTION PROJECT Pg. 78
81 Boring locations with less than an estimated 2 feet of finer grained soils in the bottom of the canal are highlighted in yellow in Table A.2-1. Table 7-6 provides a tabulation of the minimum and maximum thicknesses of canal semiimpervious blanket for each reach. The minimum and maximum percentages of fines encountered in each reach are also included in the table. Where the canal semi-impervious blanket thickness was less than 2 feet, the thickness is listed as zero. This condition occurs in Reaches 6B, 9, 10, 11, 12A, 13 and 15 on the west bank of the canal and corresponding Reaches 26B/27, 29/T-wall, 30, 31, 32, 33 and DPS 4/35A on the east bank of the canal. The semi-impervious blanket thickness for Reaches 13 and 33 was 2 feet. However, the finer grained materials are separated by a poorly graded sand layer and the semi-impervious blanket was not considered continuous. The semi-impervious blanket thickness was listed as zero for these reaches. Only Reaches 15 and DPS 4/35A, opposite each other indicated the presence of only poorly graded sand in the bottom of the canal. This may be the result of construction or scour Canal Piezometer Seepage Analysis A series of seepage analyses were performed to evaluate the head loss from the bottom of the canal to piezometers located along both east and west protected sides of the canal. The locations of these piezometers are plotted on Plates 1 through 10 of Appendix A.4. The piezometers were located within the barrier beach sand stratum. The stratigraphy used in the analysis was developed from field investigations data in the area of the piezometers. The canal bottom was modeled for two cases. In Case 1 the canal bottom was assumed to be beach sand. In Case 2, the bottom of the canal was assumed to consist of marsh clay or semi-impervious canal sediments. In both cases the canal water level was El 2.5 NAVD88. At this canal level, the water surface is below the crest of the flood side levee embankment for the reaches under consideration. Therefore, there was no potential for a gap to form and thus provide a second seepage path to the beach sands. March 2011 LAKE PONTCHARTRAIN AND VICINTY HURRICANE PROTECTION PROJECT Pg. 79
82 TABLE 7-6 CANAL SEMI-IMPERVIOUS BLANKET THICKNESSES AND RANGE OF FINES CONTENT OPPOSING REACHES THICKNESS SM, ML, CL,CH (FT) RANGE PERCENT FINES WEST EAST MIN MAX MIN MAX >50 26A 6A >50 26B 0 (1) >50 6B 27 0 (1) (1) > > > /T-Wall 0 (1) > (1) 2.8 <10 (1) > (1) 3.5 <10 (1 >50 12A 32 0 (1) 2 0 <10 (1) >50 12B > (1) 3 10 (1) > >50 15 DPS4/35A 0 (1) 0 <10 (1) <10 (1) 16/T-wall 35B >50 17 L-wall A > B > >50 Notes: (1) Less than 2 feet of fine-grained material encountered in base of canal The water level used in the analyses was recorded during Hurricane Gustav in early September The modeled hydraulic heads at the piezometer locations were compared to the actual recorded piezometer responses. The analysis indicated that the piezometer water levels for Case 1 varied from about El -0.7 to -2.9 NAVD88. This indicated an increase of about 6 to 8 feet in the piezometer water level as the result of the elevated canal water level, El 2.5 NAVD88. For Case 2 with clay in the bottom of the canal, the water level in the piezometers ranged from El -2.7 to -8.4 NAVD88. This is a significantly wider range and relates to the individual stratigraphies modeled. The elevated canal water level during Hurricane Gustav, for a four day period, and the individual piezometer responses during that period are plotted in Figures D.8-1 through D.8-9 in Appendix D.8. The locations of these piezometers are provided in Table 7-7. The potential for hydraulic connection is noted in the table based on the previous assessment of whether the canal March 2011 LAKE PONTCHARTRAIN AND VICINTY HURRICANE PROTECTION PROJECT Pg. 80
83 bottom, in the reaches referenced, consisted of a semi-impervious blanket or beach sand. Two of the piezometers are located behind T-walls where the sheet pile cutoff extends through the beach sand stratum and into the bay sound clay stratum. The cutoff wall effectively isolates these piezometers from any direct response of an increase in the canal water level. The results of the seepage analyses are presented in Table 7-8. The calculations are provided in Appendix D.8. The calculated water level elevation at the piezometers for the Case 1 conditions, beach sand in the bottom of the canal, was considerably higher than the readings in these piezometers during Hurricane Gustav, except for Piezometer LP-24. This piezometer is located at the junction between Reaches 10 and 11 on the west bank. The water level measured in this piezometer was approximately equal to the calculated water level. This indicates that only at this one piezometer, beach sand is likely present in the bottom of the canal. Canal bottom sediment analyses summarized in Table 7-6 support this conclusion. This piezometer analysis suggests that the canal bottom sediment analysis described in Section is conservative. Four of the piezometer locations were indicated to have a potential hydraulic connection to the beach sands REACH NUMBER TABLE 7-7 BEACH SAND PIEZOMETER LOCATIONS PIEZOMETER NUMBER PIEZOMETER LOCATION BASELINE STATION SIDE OF CANAL POTENTIAL CONNECTION BASED ON CANAL BOTTOM SAMPLING 5 LP West No 6B LP West Yes 9 LP West Yes 10 & 11 LP West Yes T-Wall LP West No T-Wall LP West No 18B LP-8A West No 26A LP East No 31 LP East Yes 35B LP East No LP East No LP East No March 2011 LAKE PONTCHARTRAIN AND VICINTY HURRICANE PROTECTION PROJECT Pg. 81
84 Canal Seepage Analysis The overall canal seepage analysis was performed using SEEP/W [41]. The exit gradients at the ground surface on the protected side were calculated at three locations: REACH NUMBER PIEZOMETER NUMBER TABLE 7-8 CANAL BOTTOM SEEPAGE EVALUATION CANAL WATER LEVEL ELEVATIO N NAVD88 MEASURED PIEZOMETE R WATER LEVEL ELEVATION NAVD88 CALCULATED PIEZOMETER WATER LEVEL ELEVATION NAVD88 CASE 1 CASE 2 5 LP-20 No evaluation marsh clay in bottom of canal 6B LP LP & 11 LP T-Wall LP-37 No evaluation sheet pile cutoff wall below T-wall T-Wall LP-38 No evaluation sheet pile cutoff wall below T-wall 18B LP-8A A LP LP LP LP LP Note: See Table 7-7 for locations of the piezometers 1) at the protected side of the sheet pile, 2) at the protected side mid-slope, and 3) at the protected side toe. In all cases, the toe location controlled. The minimum seepage FOS,as indicated by the guidelines of Section 4.11, is 1.6. The seepage FOS is defined as the critical exit gradient divided by calculated exit gradient. The uplift pressures below the marsh clay was also calculated for each reach, but a heave analysis was not required for this study due to the use of finite element seepage analyses. The results of the seepage analysis are presented in Table 7-9. The calculation output for the seepage analyses are presented in Appendix D.3 along with input and output reports. Executable input files are located in Appendix F. The results of the seepage analysis were significantly affected by the following. Thickness of the marsh clay stratum; March 2011 LAKE PONTCHARTRAIN AND VICINTY HURRICANE PROTECTION PROJECT Pg. 82
85 Propagation of a full potential gap when the canal water level reaches the crest of the flood side levee embankment; Propagation of the gap through the marsh clay stratum; Low ground surface elevation of the protected side levee toe; Presence or absence of a continuous silty sand layer below the marsh clay stratum at the top of the barrier beach sand stratum; and Presence or absence of semi-impervious canal bottom sediment blanket. WEST REACH GAP BOTTOM ELEVATION NAVD88 TABLE 7-9 SEEPAGE ANALYSIS RESULTS CANAL BOTTOM ASSUMED POORLY GRADED SAND CASE 1 EAST REACH GAP BOTTOM ELEVATION NAVD88 CANAL BOTTOM ASSUMED POORLY GRADED SAND CASE 1 UNDER- SEEPAGE MOWL FOS 1.6 AT LEVEE TOE NAVD88 UNDER- SEEPAGE MOWL FOS 1.6 AT LEVEE TOE NAVD No No No No No No No No No No A No No B Yes A No No B Yes No Yes Yes No Yes Yes Yes Yes A -8.7 Yes Yes B -8.7 No Yes Yes Yes No No Yes A Yes No B No No No A * NA No * NA No B * NA No * NA No 10.0 *No I Wall March 2011 LAKE PONTCHARTRAIN AND VICINTY HURRICANE PROTECTION PROJECT Pg. 83
86 The lowest MOWLs were identified in areas defined as Case 1 in the canal piezometer seepage analysis where the natural semi-impervious canal bottom sediments are thin or the barrier beach sand stratum is exposed in the bottom of the canal. The other MOWL below El 10 NAVD88 was influenced by the gap penetrating through the natural clay blanket into the beach sand stratum. In addition, it is noted that there were no reports of excessive underseepage adjacent to the canal during or after Hurricane Gustav. This observation also supports the relatively conservative nature of the conditions used in this MOWL report. The replacement T-walls and the L-wall were designed with fully penetrating sheet piles through the barrier beach sand stratum into the bay sound clay stratum The suitability of the length of the sheet pile for the T-walls and L-wall was checked using the Lane Weighted Creep Ratio (LWCR) [28]. Since the sheet pile is considered impermeable and fully penetrates into the bay sound clay stratum, the maximum hydraulic head difference (H) between the canal water level and water level on the protected side of the sheet piling was estimated at 16 ft. The LWCR is defined as C= L w /H where L w = weighted seepage length N/3+V and N = horizontal seepage length and V = vertical seepage length. The calculated LWCR values are shown in Table Calculations are provided in Appendix D.4. These values vary from 7.9 to 8.6. Since the sheet piles penetrate through the beach sand deposit and the creep ratio for fine sand is 7, the calculated LWCR values are acceptable. WALL LOCATION TABLE 7-10 LANE WEIGHTED CREEP RATIO FOR T-WALLS OR L-WALL WALL TYPE FOOTING BASE ELEVATIO N NAVD88 SHEET PILE TIP ELEV. NAVD88 (FT) SHEET PILE LENGTH, V (FT) FOOTING WIDTH, N (FT) CHANGE IN HEAD, H (FT) L W (FT) CALCU- LATE LWCR Mirabeau Ave T-Wall Robert E. Lee Ave L-Wall Robert E. Lee Ave T-Wall March 2011 LAKE PONTCHARTRAIN AND VICINTY HURRICANE PROTECTION PROJECT Pg. 84
87 7.2 SUMMARY OF MOWL The MOWL for each reach is tabulated versus each of the individual design criteria in Table The elevations in bold identify the controlling criteria below a MOWL of El 10 NAVD88. The lowest MOWLs for any reaches in the canal were identified in areas where the semi-impervious canal sediments in the base of the canal were thin or the barrier beach poorly graded sand stratum was exposed in the bottom of the canal. The other seepage MOWLs below El 10 NAVD88 were influenced by the gap penetrating through the marsh clay blanket into the beach sand stratum. The maximum water height of 4 feet on the I-wall controlled the remaining MOWLs. Only Reaches 12A and 12B were controlled by stability. Table 7-12 provides a summary of the FOS and deflections for the T-Walls and L-Walls and DPS 3 and DPS 4. Figures 7-1 through 7-5 provides the MOWL for each criterion along east bank of the canal. Figure 7-6 through 7-10 provides the MOWL for each criterion along west bank of the canal. March 2011 LAKE PONTCHARTRAIN AND VICINTY HURRICANE PROTECTION PROJECT Pg. 85
88 WEST REACH TABLE 7-11 REACH MOWL VALUES FOR I-WALLS AND EARTH LEVEES SPENCER S SHEET PILE MOP SLOPE MAXIMUM 4 METHOD MINIMUM PENETRATION STABILITY FT WATER SLOPE SHEET PILE RATIO CWALSHT FOS >1.3 DEPTH ON I- STATION STABILITY PENETRATION D/H MOWL 1 = 3/1 MOWL WALL MOWL FOS >1.4 D>10 FEET MOWL NAVD88 NAVD88 MOWL NAVD88 NAVD88 NAVD to Yes to Yes to Yes to Yes to Yes A to Yes B to Yes to Yes to Yes to Yes to Yes to Yes A to Yes B to Yes SEEPAGE MOWL NAVD to Yes to Yes to Yes to Yes T-Wall to NA NA NA to Yes A to Yes NA NA B to Yes NA NA to Yes NA NA March 2011 LAKE PONTCHARTRAIN AND VICINTY HURRICANE PROTECTION PROJECT Pg. 86
89 SPENCER S MOP SLOPE MINIMUM SHEET PILE MAXIMUM 4 METHOD EAST STABILITY SHEET PILE PENETRATION FT WATER CWALSHT SEEPAGE STATION SLOPE REACH FOS >1.3 PENETRATION RATIO DEPTH ON I- MOWL MOWL STABILITY MOWL D> 10 FEET D/H1 = 3/1 WALL MOWL NAVD88 NAVD88 FOS >1.4 NAVD88 MOWL NAVD88 NAVD to Yes to Yes to Yes to Yes to Yes to Yes A to Yes B to Yes to Yes to Yes to Yes T-Wall to NA NA NA to Yes to Yes to Yes to Yes to Yes A to Yes B to Yes L-Wall to NA NA NA NA to Yes to NA NA NA Notes: D = Depth of sheet pile below the crest of the lowest levee embankment crest. H = Height of water above the crest of the protected side embankment crest. Reaches in Bold have semi-impervious canal sediments less than 2 feet thick or beach sand in the bottom of the canal March 2011 LAKE PONTCHARTRAIN AND VICINTY HURRICANE PROTECTION PROJECT Pg. 87
90 WALL TYPE TABLE 7-12 REACH MOWL VALUES FOR T-WALLS, L-WALL, DPS3 AND DPS4 CANAL SIDE STATION MOWL NAVD88 SPENCER S METHOD FOS March 2011 LAKE PONTCHARTRAIN AND VICINTY HURRICANE PROTECTION PROJECT Pg. 88 MOP FOS DEFLECTION (IN) T-Wall West to <0.1 T-Wall East to <0.1 L-Wall East to <0.1 DPS3 South DPS4 East to Note: MOWL at DPS 3 is controlled by the top of a wall separating the discharge basin from the bypass canal.
91
92
93
94
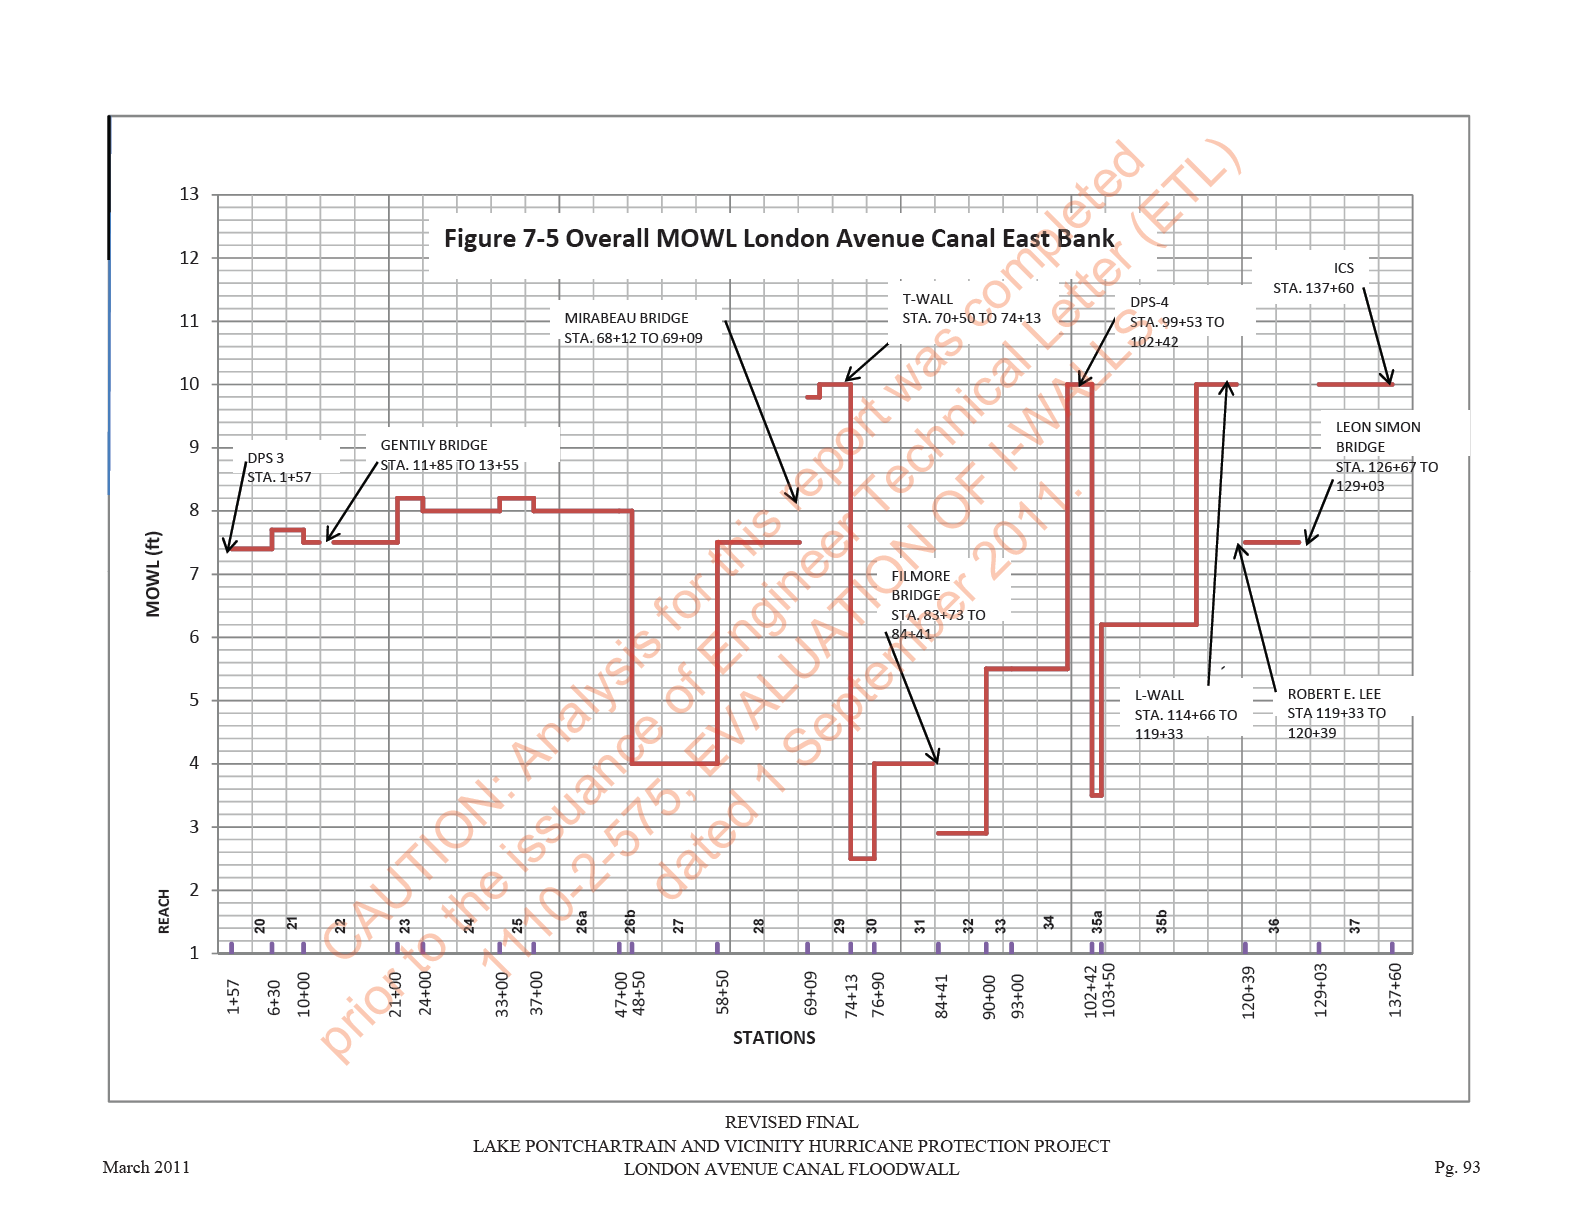
95
Greater New Orleans Hurricane & Storm Damage Risk Reduction System
 Greater New Orleans Hurricane & Storm Damage Risk Reduction System SLFPA-East Update Col. Robert Sinkler, Commander Hurricane Protection Office July 15, 2010 US US Army Army Corps Corps of of Engineers
STRUCTURES. 1.1. Excavation and backfill for structures should conform to the topic EXCAVATION AND BACKFILL.
 STRUCTURES 1. General. Critical structures may impact the integrity of a flood control project in several manners such as the excavation for construction of the structure, the type of foundation, backfill
Greater New Orleans Hurricane and Storm Damage Risk Reduction System
 Greater New Orleans Hurricane and Storm Damage Risk Reduction System Mike Park Chief Task Force Hope Mississippi Valley Division U.S. Army Corps of Engineers March 15, 2011 US Army Corps of Engineers BUILDING
UPDATED 14 JUN 12 3.1 DESIGN PROCEDURE FOR EARTHEN EMBANKMENTS
 3.0 GEOTECHNICAL 3.1 DESIGN PROCEDURE FOR EARTHEN EMBANKMENTS The following represents the typical procedure for the geotechnical design and analysis of levee embankments. The procedures stated herein,
Lower Breton Sound Sediment Diversion Conceptual Engineering Design Presentation
 EXPERT PANEL ON DIVERSION PLANNING AND IMPLEMENTATION Lower Breton Sound Sediment Diversion Conceptual Engineering Design Presentation February 12, 2015 Topics I. Introduction II. Geotechnical Study III.
PART 2 NEW ORLEANS DRAINAGE CANALS
 PART 2 NEW ORLEANS DRAINAGE CANALS The Old Basin drainage canal was excavated in the 1790s.. This shows the systems of drainage ditches and canals established by 1829, leading to Bayou St. John. Cross
DIRECTIONAL DRILLING
 DIRECTIONAL DRILLING 1. General. Installation of pipelines through the levee embankment using directional drilling technology is prohibited. Installation of pipelines through a flood control project foundation
DEPARTMENT OF THE ARMY ETL 1110-2-569 U.S. Army Corps of Engineers CECW-EG Washington, DC 20314-1000
 DEPARTMENT OF THE ARMY ETL 1110-2-569 U.S. Army Corps of Engineers CECW-EG Washington, DC 20314-1000 Technical Letter No. 1110-2-569 1 May 2005 Engineering and Design DESIGN GUIDANCE FOR LEVEE UNDERSEEPAGE
Performance Evaluation of New Orleans and Southeast Louisiana Hurricane Protection System. Report 1 Performance Evaluation Plan and Interim Status
 Performance Evaluation of New Orleans and Southeast Louisiana Hurricane Protection System Report 1 Performance Evaluation Plan and Interim Status Interagency Performance Evaluation Task Force (IPET) Products,
New Orleans Hurricane and Storm Damage Risk Reduction System Managing Risk
 New Orleans Hurricane and Storm Damage Risk Reduction System Managing Risk by Karen Durham-Aguilera, P.E. Director Task Force Hope U.S. Army Corps of Engineers Aug 18, 2008 2 U.S. Army Corps of Engineers
GAO HURRICANE KATRINA. Strategic Planning Needed to Guide Future Enhancements Beyond Interim Levee Repairs. Report to Congressional Committees
 GAO United States Government Accountability Office Report to Congressional Committees September 2006 HURRICANE KATRINA Strategic Planning Needed to Guide Future Enhancements Beyond Interim Levee Repairs
Scour and Scour Protection
 Design of Maritime Structures Scour and Scour Protection Steven A. Hughes, PhD, PE Coastal and Hydraulics Laboratory US Army Engineer Research and Development Center Waterways Experiment Station 3909 Halls
Use of Watermarks for Discerning Hurricane-Induced Flood Levels. Erik L. Nelson, Ph.D., P.E., M. ASCE 1
 Use of Watermarks for Discerning Hurricane-Induced Flood Levels Erik L. Nelson, Ph.D., P.E., M. ASCE 1 1 President & CEO, Nelson Architectural Engineers, Inc., 2740 Dallas Parkway Suite 220, Plano, Texas
2011 Operations, Maintenance, Monitoring and Rehabilitation Plan
 State of Louisiana Coastal Protection and Restoration Authority of Louisiana 2011 Operations, Maintenance, Monitoring and Rehabilitation Plan for East Marsh Island Marsh Creation State Project Number TV-21
Evaluating the Condition of Seawalls/Bulkheads
 Volume 2 Evaluating the Condition of Seawalls/Bulkheads By: Coastal Systems International, Inc. Typical bulkhead under construction Seawalls and bulkheads (walls) provide shoreline stabilization for many
FAILURE OF THE NEW ORLEANS 17 TH STREET CANAL LEVEE & FLOODWALL DURING HURRICANE KATRINA. Robert G. Bea, Ph.D, P.E., F. & Life Member, ASCE 1
 FAILURE OF THE NEW ORLEANS 17 TH STREET CANAL LEVEE & FLOODWALL DURING HURRICANE KATRINA Robert G. Bea, Ph.D, P.E., F. & Life Member, ASCE 1 ABSTRACT: Hurricane Katrina resulted in the single most catastrophic
Prattsville Berm Removal Project. 1.0 Project Location
 Prattsville Berm Removal Project 1.0 Project Location The project site is located between the New York State Route 23 Bridge over the Schoharie Creek and the Schoharie Reservoir. The restoration plan encompassed
Structural Damage Due to Floods
 Structural Damage Due to Floods By Craig D. Rogers, P.E. The Federal Emergency Management Agency (FEMA) reports that each year approximately 90 percent of all disaster-related property damage results from
The success of the hurricane protection around Chevron s refinery at Pascagoula, MS, during Katrina
 The success of the hurricane protection around Chevron s refinery at Pascagoula, MS, during Katrina Dr J.W. van der Meer, Dr C. Cooper, M.J. Warner, H. Adams-Morales and G.J. Steendam Abstract and presentation
Eurocode 7 - Geotechnical design - Part 2 Ground investigation and testing
 Brussels, 18-20 February 2008 Dissemination of information workshop 1 Eurocode 7 - Geotechnical design - Part 2 Ground investigation and testing Dr.-Ing. Bernd Schuppener, Federal Waterways Engineering
New Orleans Hurricane Storm Damage Risk Reduction System Tour March 23 24, 2012
 New Orleans Hurricane Storm Damage Risk Reduction System Tour March 23 24, 2012 Host: Falcolm E. Hull, Vice President/Technical Expert, ARCADIS, U.S. Inc. Attending: Cherie Coffman, Coastal Projection
US Army Corps of Engineers BUILDING STRONG
 Fort Worth District Public Meeting 20 August 2013 US Army Corps of Engineers Lewisville Dam - Authorization Authorized by the River and Harbor Act, approved 2 March 1945 (Public Law 14, 79th Congress,
CIVL451. Soil Exploration and Characterization
 CIVL451 Soil Exploration and Characterization 1 Definition The process of determining the layers of natural soil deposits that will underlie a proposed structure and their physical properties is generally
5.0 OVERVIEW OF FLOOD DAMAGE REDUCTION MEASURES
 5.0 OVERVIEW OF FLOOD DAMAGE REDUCTION MEASURES Flood damage reduction consists of two basic techniques structural and non-structural. Structural methods modify the flood and take the flood away from people
USACE Dam Safety Program Current Approach & Methodology
 USACE Dam Safety Program Current Approach & Methodology Siamac Vaghar, PE, MASCE Chief, Geotechnical Engineering Section Dam Safety Program Manager US Army Corps of Engineers New England District Corps
Emergency Spillways (Sediment basins)
") Emergency Spillways (Sediment basins) DRAINAGE CONTROL TECHNIQUE Low Gradient Velocity Control Short-Term Steep Gradient Channel Lining Medium-Long Term Outlet Control Soil Treatment Permanent [1] [1]
Emergency Spillways (Sediment basins) DRAINAGE CONTROL TECHNIQUE Low Gradient Velocity Control Short-Term Steep Gradient Channel Lining Medium-Long Term Outlet Control Soil Treatment Permanent [1] [1]
BRIDGE RESTORATION AND LANDSLIDE CORRECTION USING STRUCTURAL PIER AND GRADE BEAM
 BRIDGE RESTORATION AND LANDSLIDE CORRECTION USING STRUCTURAL PIER AND GRADE BEAM Swaminathan Srinivasan, P.E., M.ASCE H.C. Nutting/Terracon David Tomley, P.E., M.ASCE KZF Design Delivering Success for
Lighthouse Engineering, L.L.C.
 Registered Engineering Firm (F: 9334) Phone: 214-577-1077 Fax: 214-224-0549 Website: www.lighthouseeng.com Email: Office@LighthouseEng.com Thursday, September 04, 2014 TO: Our Client RE: Initial Engineering
Final Independent External Peer Review Report
 Final Independent External Peer Review Report Independent Peer Review of Greater New Orleans Hurricane and Storm Damage Risk Reduction System Design Guidelines: Aberrant Barge Impact Loads on Hurricane
GEOSYNTHETICS ENGINEERING: IN THEORY AND PRACTICE
 GEOSYNTHETICS ENGINEERING: IN THEORY AND PRACTICE Prof. J. N. Mandal Department of civil engineering, IIT Bombay, Powai, Mumbai 400076, India. Tel.022-25767328 email: cejnm@civil.iitb.ac.in Module - 4
6.0 Results of Risk Analyses
 6. Results of Risk Analyses A risk analysis of the optimized embankment designs for the Salton Sea restoration project was conducted jointly by Kleinfelder and representatives from Reclamation. A risk
Storm tide is the water level rise during a storm due to the combination of storm surge and the astronomical tide.
 INTRODUCTION TO STORM SURGE Introduction to Storm Surge BOLIVAR PENINSULA IN TEXAS AFTER HURRICANE IKE (2008) What is Storm Surge? Inland Extent Storm surge can penetrate well inland from the coastline.
EXPERT REVIEW PANEL ON GREATER NEW ORLEANS HURRICANE AND STORM DAMAGE RISK REDUCTION SYSTEM DESIGN GUIDELINES: Final Report
 EXPERT REVIEW PANEL ON GREATER NEW ORLEANS HURRICANE AND STORM DAMAGE RISK REDUCTION SYSTEM DESIGN GUIDELINES: Final Report May 21, 2014 Produced for and Funded by: Coastal Protection and Restoration Authority
Analysis of the Interstate 10 Twin Bridge s Collapse During Hurricane Katrina
 Analysis of the Interstate 0 Twin Bridge s Collapse During Hurricane Katrina By Genda Chen, Emitt C. Witt III, David Hoffman, Ronaldo Luna, and Adam Sevi The Interstate 0 Twin Span Bridge over Lake Pontchartrain
Managing Our Water Retention Systems
 Managing Our Water Retention Systems 29th Annual USSD Conference Nashville, Tennessee, April 20-24, 2009 Hosted by Corps of Engineers On the Cover Wolf Creek Dam is on the Cumberland River in South Central
SOUTHWEST FLORIDA WATER MANAGEMENT DISTRICT RESOURCE REGULATION TRAINING MEMORANDUM
 SOUTHWEST FLORIDA WATER MANAGEMENT DISTRICT RESOURCE REGULATION TRAINING MEMORANDUM DATE: December 04, 1996 This document is subject to change. If in doubt, verify current status with Technical Services
Storm tide is the water level rise during a storm due to the combination of storm surge and the astronomical tide.
 INTRODUCTION TO STORM SURGE Introduction to Storm Surge National Hurricane Center Storm Surge Unit BOLIVAR PENINSULA IN TEXAS AFTER HURRICANE IKE (2008) What is Storm Surge? Inland Extent Storm surge can
Earth Pressure and Retaining Wall Basics for Non-Geotechnical Engineers
 PDHonline Course C155 (2 PDH) Earth Pressure and Retaining Wall Basics for Non-Geotechnical Engineers Instructor: Richard P. Weber, P.E. 2012 PDH Online PDH Center 5272 Meadow Estates Drive Fairfax, VA
Jackson Gulch Outlet Canal Rehabilitation Project
 Jackson Gulch Outlet Canal Rehabilitation Project Preliminary Budgetary Estimate for Rehabilitation February 2004 Prepared for the Mancos Water Conservancy District Jackson Gulch Reservoir 42888 County
ORDINANCE NO. 2013 -
 ORDINANCE NO. 2013 - AN ORDINANCE OF BREVARD COUNTY, FLORIDA AMENDING CHAPTER 62, LAND DEVELOPMENT REGULATIONS SECTION 62-2891, LOT DRAINAGE, AND CHAPTER 22 BUILDINGS AND BUILDING REGULATIONS, SECTION
How To Prepare A Geotechnical Study For A Trunk Sewer Project In Lincoln, Nebraska
 APPENDIX B Geotechnical Engineering Report GEOTECHNICAL ENGINEERING REPORT Preliminary Geotechnical Study Upper Southeast Salt Creek Sanitary Trunk Sewer Lincoln Wastewater System Lincoln, Nebraska PREPARED
Strength Determination of "Tooth-Paste" Like Sand and Gravel Washing Fines Using DMT
 Strength Determination of "Tooth-Paste" Like Sand and Gravel Washing Fines Using DMT David L. Knott, P.E. and James M. Sheahan, P.E. HDR Engineering, Inc. 3 Gateway Center Pittsburgh, PA 15222-1074 Phone:
New Orleans Hurricane and Storm Damage Risk Reduction System
 New Orleans Hurricane and Storm Damage Risk Reduction System Luis A. Ruiz, P.E. Hurricane Protection Office U.S. Army Corps of Engineers August 27, 2009 US Army Corps of Engineers New Orleans Area Hurricane
Settlement of Precast Culverts Under High Fills; The Influence of Construction Sequence and Structural Effects of Longitudinal Strains
 Settlement of Precast Culverts Under High Fills; The Influence of Construction Sequence and Structural Effects of Longitudinal Strains Doug Jenkins 1, Chris Lawson 2 1 Interactive Design Services, 2 Reinforced
ROSE CREEK WATERSHED HYDROLOGIC, HYDRAULIC, SEDIMENT TRANSPORT, AND GEOMORPHIC ANALYSES TASK 1 EXISTING DATA AND INFORMATION SUMMARY REPORT BACKGROUND
 ROSE CREEK WATERSHED HYDROLOGIC, HYDRAULIC, SEDIMENT TRANSPORT, AND GEOMORPHIC ANALYSES TASK 1 EXISTING DATA AND INFORMATION SUMMARY REPORT BACKGROUND The Rose Creek Watershed (RCW) consists of three planning
NJ650.1404 Interception Drainage
 NJ650.1404 Interception Drainage Interception drainage is used to intercept surface and subsurface water. The investigation, planning, and construction of surface interception drains follow the requirements
Ohio Department of Transportation Division of Production Management Office of Geotechnical Engineering. Geotechnical Bulletin PLAN SUBGRADES
 Ohio Department of Transportation Division of Production Management Office of Geotechnical Engineering Geotechnical Bulletin GB 1 PLAN SUBGRADES Geotechnical Bulletin GB1 was jointly developed by the Offices
Comprehensive Recommendations Supporting the Use of the Multiple Lines of Defense Strategy to Sustain Coastal Louisiana 2008 Report (Version I)
") Comprehensive Recommendations Supporting the Use of the Multiple Lines of Defense Strategy to Sustain Coastal Louisiana 2008 Report (Version I) This report recommends integrated coastal projects and levee
Comprehensive Recommendations Supporting the Use of the Multiple Lines of Defense Strategy to Sustain Coastal Louisiana 2008 Report (Version I) This report recommends integrated coastal projects and levee
CASE STUDY. City of Grand Rapids Stormwater Asset Management Program. City of Grand Rapids. By the Numbers
 United States Environmental Protection Agency CASE STUDY City of Grand Rapids Stormwater Asset Management Program Overview With increasing pressure to meet water quality targets, address population growth,
14.330 SOIL MECHANICS Assignment #4: Soil Permeability.
 Geotechnical Engineering Research Laboratory One University Avenue Lowell, Massachusetts 01854 Edward L. Hajduk, D.Eng, PE Lecturer PA105D Tel: (978) 94 2621 Fax: (978) 94 052 e mail: Edward_Hajduk@uml.edu
AN AEM TOOL FOR THE EVALUATION OF UNDESIGNED WASTE STORAGE FACILITIES
 AN AEM TOOL FOR THE EVALUATION OF UNDESIGNED WASTE STORAGE FACILITIES REFERENCE National Handbook of Conservation Practices Code NY313 Waste Storage Facility. INTRODUCTION CAFO permits require an Agricultural
LAKE OKEECHOBEE and THE HERBERT HOOVER DIKE. A Summary of the Engineering Evaluation of Seepage and Stability Problems at the Herbert Hoover Dike.
 LAKE OKEECHOBEE and THE HERBERT HOOVER DIKE A Summary of the Engineering Evaluation of Seepage and Stability Problems at the Herbert Hoover Dike. The Good Life Lake Okeechobee and the Herbert Hoover Dike
Investigation of Foundation Failure. Step 1 - Data Collection. Investigation Steps
 Foundations on Expansive Clay Soil Part 3 - Investigation of Failed Foundations Presented by: Eric Green, P.E. Structural Engineer Slide 1 Copyright Eric Green 2005 Investigation of Foundation Failure
ENCE 4610 Foundation Analysis and Design
 This image cannot currently be displayed. ENCE 4610 Foundation Analysis and Design Shallow Foundations Total and Differential Settlement Schmertmann s Method This image cannot currently be displayed. Strength
Outlet stabilization structure
 Overview of Sedimentation and Erosion Control Practices Practice no. 6.41 Outlet stabilization structure Erosion at the outlet of channels, culverts, and other structures is common, and can cause structural
Principles of groundwater flow
 Principles of groundwater flow Hydraulic head is the elevation to which water will naturally rise in a well (a.k.a. static level). Any well that is not being pumped will do for this, but a well that is
Lockport Pool Chicago Sanitary & Ship Canal Illinois Waterway
 Presentation to the Inland Waterways Users Board Lockport Pool Chicago Sanitary & Ship Canal Illinois Waterway by Gary Loss, P.E. Rock Island District July 13, 2006 Chicago Sanitary and Ship Canal A
CHAPTER 2 HYDRAULICS OF SEWERS
 CHAPTER 2 HYDRAULICS OF SEWERS SANITARY SEWERS The hydraulic design procedure for sewers requires: 1. Determination of Sewer System Type 2. Determination of Design Flow 3. Selection of Pipe Size 4. Determination
STORMWATER MANAGEMENT CHECKLIST
 STORMWATER MANAGEMENT CHECKLIST *This checklist must be completed and part of the Land Disturbing Permit submittal for review if the acreage disturbed is one (1) acre or more: I. SUPPORTING DATA Narrative
SECTION 5 DRAFTING STANDARDS
 SECTION 5 DRAFTING STANDARDS 1 SECTION FIVE TABLE OF CONTENTS Description Page TABLE OF CONTENTS... 5-2 GENERAL... 5-3 DRAFTING STANDARDS... 5-5 DRAFTING MINIMUM REQUIREMENTS HANDOUT... 5-8 2 GENERAL 1.
Estimation of Compression Properties of Clayey Soils Salt Lake Valley, Utah
 Estimation of Compression Properties of Clayey Soils Salt Lake Valley, Utah Report Prepared for the Utah Department of Transportation Research Division by Steven F. Bartlett, PhD. P.E. Assistant Professor
EXHIBIT A SCOPE OF WORK Montgomery Reservoir Improvements
 EXHIBIT A SCOPE OF WORK Montgomery Reservoir Improvements 1.0 INTRODUCTION Colorado Springs Utilities (Utilities) is requesting proposals to provide final engineering, design, and construction management
Land Disturbance, Erosion Control and Stormwater Management Checklist. Walworth County Land Conservation Department
 Land Disturbance, Erosion Control and Stormwater Management Checklist Walworth County Land Conservation Department The following checklist is designed to assist the applicant in complying with the Walworth
Storm Protection. Storm Protection
 Storm Protection Storm Protection About Skyline Steel A premier steel foundation supplier serving the U.S., Canada, Mexico, the Caribbean, Central America, and Colombia markets, Skyline Steel is a wholly-owned
City of Shelbyville Site Inspection Checklist
 City of Shelbyville Site Inspection Checklist General Information Project Name: KYR10 Permit Number: Date: Project Location: Contractor: Conractor Representative: Inspector's Name: Title: Signature : Weather
Appendix A Sub surface displacements around excavations Data presented in Xdisp sample file
 Appendix A Sub surface displacements around excavations Data presented in Xdisp sample file Notation B1 = lowest level of basement slab c = cohesion E = drained Young s Modulus Eu = undrained Young s Modulus
Flood Emergency Response Planning: How to Protect Your Business from a Natural Disaster RIC005
 Flood Emergency Response Planning: How to Protect Your Business from a Natural Disaster RIC005 Speakers: Tom Chan, CEO, Global Risk Miyamoto Greg Bates, Principal, Global Risk Consultants Learning Objectives
Chapter 4 SUBSURFACE INVESTIGATION GUIDELINES
 Chapter 4 SUBSURFACE INVESTIGATION GUIDELINES Final SCDOT GEOTECHNICAL DESIGN MANUAL August 2008 Table of Contents Section Page 4.1 Introduction...4-1 4.2 Subsurface Investigation...4-2 4.2.1 Preliminary
DEPARTMENT OF THE ARMY MISSISSIPPI VALLEY DIVISION, CORPS OF ENGINEERS P.O. BOX 80 VICKSBURG, MISSISSIPPI39181-0080
 DEPARTMENT OF THE ARMY MISSISSIPPI VALLEY DIVISION, CORPS OF ENGINEERS P.O. BOX 80 VICKSBURG, MISSISSIPPI39181-0080 CEMVD-PD-N REPLY TO A TIENTION OF: 1 2 DEC 2012 MEMORANDUM FOR Commander, New Orleans
Use and Application of Piezocone Penetration Testing in Presumpscot Formation
 Use and Application of Piezocone Penetration Testing in Presumpscot Formation Craig W. Coolidge, P.E. Summit Geoengineering Services, Rockland, Maine ABSTRACT: This paper examines the advantages and limitations
The Verdura Wall check with your local building department
 The Verdura Wall The Verdura Wall by Soil Retention Products, Inc of Carlsbad, California can be constructed as a gravity retaining structure or a geosynthetic reinforced segmental retaining wall, depending
The Impact of Market Demands on Residential Post-Tensioned Foundation Design: An Ethical Dilemma
 The Impact of Market Demands on Residential Post-Tensioned Foundation Design: An Ethical Dilemma Bart B. Barrett, B.S., P.E.1 Kerry S. Lee, M.B.A., P.E., M. ASCE2 Erik L. Nelson, Ph.D., P.E., M. ASCE3
ANNEX D1 BASIC CONSIDERATIONS FOR REVIEWING STUDIES IN THE DETAILED RISK ASSESSMENT FOR SAFETY
 ANNEX D1 BASIC CONSIDERATIONS FOR REVIEWING STUDIES IN THE DETAILED RISK ASSESSMENT FOR SAFETY ANNEX D1: BASIC CONSIDERATIONS FOR REVIEWING STUDIES IN DRA FOR SAFETY D1-1 ANNEX D1 BASIC CONSIDERATIONS
COMPENDIUM OF INDIAN STANDARDS ON SOIL ENGINEERING PART 2
 (PREVIEW) SP 36 (Part 2) : 1988 COMPENDIUM OF INDIAN STANDARDS ON SOIL ENGINEERING PART 2 IS 1893 : 1979 (Reaffirmed 1987) CODE OF PRACTICE FOR SUBSURFACE INVESTIGATION FOR FOUNDATIONS 1.1 This code deals
UNDER DRAINAGE AND FILTER DESIGN
 UNDER DRAINAGE AND FILTER DESIGN Tailings and HLP Workshop 28 April to 1 May 2010 INTRODUCTION The internal drainage is of crucial importance to the reliability and safety of a tailings dam throughout
GUIDELINES FOR GEOTECHNICAL INVESTIGATION OF BRIDGE STRUCTURES. Materials Engineering Report No. 2009-8M (Supersedes Report No.
 GUIDELINES FOR GEOTECHNICAL INVESTIGATION OF BRIDGE STRUCTURES Materials Engineering Report No. 2009-8M (Supersedes Report No. 21) F CHOWDHURY GEOMECHANICS AND STRUCTURAL MATERIALS ENGINEER S REHMAN GEOTECHNICAL
REINFORCED CONCRETE. Reinforced Concrete Design. A Fundamental Approach - Fifth Edition. Walls are generally used to provide lateral support for:
 HANDOUT REINFORCED CONCRETE Reinforced Concrete Design A Fundamental Approach - Fifth Edition RETAINING WALLS Fifth Edition A. J. Clark School of Engineering Department of Civil and Environmental Engineering
Chapter 7 Earthquake Hazards Practice Exam and Study Guide
 Chapter 7 Earthquake Hazards Practice Exam and Study Guide 1. Select from the following list, all of the factors that affect the intensity of ground shaking. a. The magnitude of the earthquake b. Rather
How To Rehabilitate A Dam In A Lake Dike
 Herbert Hoover Dike Rehabilitation Reach 1 Construction Reaches 2 and 3 Major Rehabilitation Report Briefing Purpose Provide a status update of the HHD rehabilitation project and a description of the upcoming
How to Design and Build a Fence/G traverse Bridge or Graffiti Project
 Outline Project Location Project Description Project History Site Constraints Geotechnical Investigation & Soil Profile Foundation Design Process Photos Project Location Project Limits: The Grand River
CHICKASAW COUNTY, MISSISSIPPI, AND INCORPORATED AREAS
 CHICKASAW COUNTY, MISSISSIPPI, AND INCORPORATED AREAS Chickasaw County Community Name Community Number CHICKASAW COUNTY 280269 (UNINCORPORATED AREAS) HOUSTON, CITY OF 280030 NEW HOULKA, TOWN OF 280067
GEOTECHNICAL INVESTIGATION CITY OF HOUSTON SURFACE WATER TRANSMISSION PROGRAM CONTRACT 74A-1 WATERLINE COH WBS NO. S-000900-0109-3 HOUSTON, TEXAS
 GEOTECHNICAL INVESTIGATION CITY OF HOUSTON SURFACE WATER TRANSMISSION PROGRAM CONTRACT 74A-1 WATERLINE COH WBS NO. S-000900-0109-3 HOUSTON, TEXAS Reported To: LAN, Inc. Houston, Texas by Aviles Engineering
PILE FOUNDATIONS FM 5-134
 C H A P T E R 6 PILE FOUNDATIONS Section I. GROUP BEHAVIOR 6-1. Group action. Piles are most effective when combined in groups or clusters. Combining piles in a group complicates analysis since the characteristics
FINAL TECHNICAL MEMORANDUM AWD-00002 FLOWS THROUGH FLOOD DAMAGE REDUCTION AREA July 16, 2012
 FINAL TECHNICAL MEMORANDUM AWD-00002 FLOWS THROUGH FLOOD DAMAGE REDUCTION AREA July 16, 2012 Table of Contents TABLE OF CONTENTS Table of Contents... 1 Executive Summary... 2 1 Objective... 4 2 Study Approach...
U.S. Army Corps of Engineers
 Walla Walla District U.S. Army Corps of Engineers Hurricane Katrina Response Briefer: Joseph Saxon Today s Briefing U.S. Army Corps of Engineers Mission Events leading up to New Orleans flooding Corp s
Evaluation of Open Channel Flow Equations. Introduction :
 Evaluation of Open Channel Flow Equations Introduction : Most common hydraulic equations for open channels relate the section averaged mean velocity (V) to hydraulic radius (R) and hydraulic gradient (S).
Part 7 GEOTEXTILE FILTER FABRICS
 Part 7 GEOTEXTILE FILTER FABRICS Well Screens Slotted casings are normally employed as well screens within the aquifers being taped by water wells. The width of the slots should allow 50 to 60% of the
Designed and Engineered to Perform
 History EARTH CONTACT PRODUCTS, L.L.C., is a family owned company, based in Olathe, Kansas. This company was built upon Don May s U.S. Patented fourth-generation Steel Piering System that has led to the
Module 3. Irrigation Engineering Principles. Version 2 CE IIT, Kharagpur
 Module 3 Irrigation Engineering Principles Lesson 9 Regulating Structures for Canal Flows Instructional objectives On completion of this lesson, the student shall be able to learn: 1. The necessity of
CLIFTY CREEK PLANT MADISON, INDIANA
 2015 DAM AND DIKE INSPECTION REPORT GERS-15-018 CLIFTY CREEK PLANT MADISON, INDIANA PREPARED BY GEOTECHNICAL ENGINEERING AEP SERVICE CORPORATION 1 RIVERSIDE PLAZA COLUMBUS, OHIO Annual Dam and Dike Inspection
720 Contour Grading. General. References. Resources. Definitions
 720 Contour Grading General Contour grading directs water to a desired point, prevents erosion, provides noise deflection, provides visual fit of the facility into the landscape, and protects desirable
Cone Penetration Testing (CPT) Michael Bailey, P.G. U.S. Army Corps of Engineers, Savannah District
 Michael Bailey, P.G. U.S. Army Corps of Engineers, Savannah District") Cone Penetration Testing (CPT) Michael Bailey, P.G. U.S. Army Corps of Engineers, Savannah District Recommended publications ASTM D 5778-07 Standard Test Method for Electronic Friction Cone and Piezocone
Cone Penetration Testing (CPT) Michael Bailey, P.G. U.S. Army Corps of Engineers, Savannah District Recommended publications ASTM D 5778-07 Standard Test Method for Electronic Friction Cone and Piezocone
SPECIFICATIONS FOR PRECAST MODULAR BLOCK RETAINING WALL SYSTEM (revised 11/5/13)
") Page 1 of 7 STONE STRONG SYSTEMS SPECIFICATIONS FOR PRECAST MODULAR BLOCK RETAINING WALL SYSTEM (revised ) PART 1: GENERAL 1.01 Description A. Work includes furnishing and installing precast modular blocks
Page 1 of 7 STONE STRONG SYSTEMS SPECIFICATIONS FOR PRECAST MODULAR BLOCK RETAINING WALL SYSTEM (revised ) PART 1: GENERAL 1.01 Description A. Work includes furnishing and installing precast modular blocks
February 4, 2011. hoffman.stephen@epa.gov. Report Recommendations and NIPSCO Responses. 4.3 Maintaining and Controlling Vegetation Growth
 February 4, 2011 VIA E-MAIL AND CERTIFIED MAIL #7010 0290 0002 0577 6226 Mr. Stephen Hoffman US Environmental Protection Agency (5304P) 1200 Pennsylvania Avenue, NW Washington, DC 20460 hoffman.stephen@epa.gov
Highway 23 Paynesville Richmond Soils Borings, Soils Tests, and Reporting
 Highway 23 Paynesville Richmond Soils Borings, Soils Tests, and Reporting MnDOT Contract No. 1003249 General Project Overview This work is located along Trunk Highway (TH) 23, for State Project (SP) 7305-124.
Oakwood Beach Storm Damage Prevention Project NJDEP-Bureau of Coastal Engineering Glenn Golden, Project Manager U.S. Army Corps Civil Works Programs
 Oakwood Beach Storm Damage Prevention Project NJDEP- Glenn Golden, Project Manager U.S. Army Corps Civil Works Programs Branch Dwight Pakan, Project Manager, Philadelphia District The State of New Jersey
PDHonline Course S151A (1 PDH) Steel Sheet Piling. Instructor: Matthew Stuart, PE, SE. PDH Online PDH Center
 Steel Sheet Piling. Instructor: Matthew Stuart, PE, SE. PDH Online PDH Center") PDHonline Course S151A (1 PDH) Steel Sheet Piling Instructor: Matthew Stuart, PE, SE 2012 PDH Online PDH Center 5272 Meadow Estates Drive Fairfax, VA 22030-6658 Phone & Fax: 703-988-0088 www.pdhonline.org
PDHonline Course S151A (1 PDH) Steel Sheet Piling Instructor: Matthew Stuart, PE, SE 2012 PDH Online PDH Center 5272 Meadow Estates Drive Fairfax, VA 22030-6658 Phone & Fax: 703-988-0088 www.pdhonline.org
SE-10 STORM DRAIN INLET PROTECTION. Objectives
 STORM DRAIN INLET PROTECTION SE-10 Objectives Erosion Control - EC Sediment Control - SE Tracking Control - TC Wind Erosion Control - WE Non-Storm Water Management - NS Waste and Materials Management -
The Mississippi River & Tributaries Project
 The Mississippi River & Tributaries Project The Mississippi River & Tributaries (MR&T) project was authorized by the 1928 Flood Control Act. Following the devastating 1927 flood, the nation was galvanized