Models of dynamically inconsistent time preferences (Strotz, 1956; Laibson, 1997; O Donoghue
|
|
|
- Emil Manning
- 8 years ago
- Views:
Transcription
1
2 ABSTRACT
3 1 Introduction Models of dynamically inconsistent time preferences (Strotz, 1956; Laibson, 1997; O Donoghue and Rabin, 1999) areapillarofmodernbehavioraleconomics,havingaddedgenerallyto economists understanding of the tensions involved in consumption-savings choices, task performance, temptation, and self-control beyond the standard model of exponential discounting (Samuelson, 1937). Given the position of present-biased preferences in the behavioral literature, there is clear importance in testing the model s central falsifiable hypothesis of diminishing impatience through time. Further, testing auxiliary predictions such as individuals potential to restrict future activities through commitment devices can deliver critical prescriptions to policy makers. In this paper we present a test of dynamic inconsistency in consumption and investigate the demand for a meaningfully binding commitment device. To date, a notably large body of laboratory research has been generated focused on identifying the shape of time preferences (for a comprehensive review to the early 2000s, see Frederick, Loewenstein and O Donoghue, 2002). 1 The core of this experimental literature has identified preferences from time-dated monetary payments. A paradigmatic example would have a subject state the monetary payment received today, $X, that makes her indi erent to $50 received in one months time, then would have her state the monetary payment received in one months time, $Y, that makes her indi erent to $50 received in two months time. 2 Non-equivalence in the stated indi erent values is often taken as evidence of dynamic inconsistency, and $X < $Y is taken as evidence of a present-biased shape of discounting. Though conducted experiments differ along many dimensions including payment horizons, methods, subject pools, and potential 1 Though much of the literature has focused on laboratory samples, there is also a growing body of research attempting to identify the shape and extent of discounting from real world choices and aggregate data such as durable goods purchase, annuity choice, and consumption patterns (Hausman, 1979; Lawrance, 1991; Warner and Pleeter, 2001; Gourinchas and Parker, 2002; Cagetti, 2003; Laibson, Repetto and Tobacman, 2003, 2005). 2 A popular methodolgy for eliciting such indi erences is the Multiple Price List technique (Coller and Williams, 1999; Harrison, Lau and Williams, 2002) asking individuals a series of binary choices between time dated payments, identifying intervals in which $X and $Y lie. Psychology has often relied on an alternative method to identify dynamic inconsistency, asking subjects a series of questions involving increasing delay lengths and examining whether the implied discount factors nest exponentially (see, for example Kirby, Petry and Bickel, 1999; Giordano, Bickel, Loewenstein, Jacobs, Marsch and Badger, 2002). 2

4 transaction costs, a stylized fact has emerged that many subjects are dynamically inconsistent and the majority of inconsistencies are in the direction of present bias (Frederick et al., 2002). 3 Several confounds exist for identifying the shape of time preferences from experimental choices over time-dated monetary payments, muddying the strict interpretations of behavior provided above. Critically, issues of payment reliability and risk preference suggest that if information is to be gleaned from such choices, it may be linked to the subject s assessment of the experimenter s reliability. 4 Recent work validates this suspicion. Andreoni and Sprenger (2012a), Gine, Goldberg, Silverman and Yang (2010), and Andersen, Harrison, Lau and Rutstrom (2012) all document that when closely controlling transactions costs and payment reliability, dynamic inconsistency in choices over monetary payments is virtually eliminated on aggregate. Further, when payment risk is added in an experimentally controlled way, nonexpected utility risk preferences deliver behavior observationally equivalent to present bias as described above (Andreoni and Sprenger, 2012b). 5 Beyond these operational issues, there is reason to question the use of potentially fungible monetary payments to identify the parameters of models defined over time-dated consumption. Clear arbitrage arguments exist indicating that nothing beyond the interval of subjects borrowing and lending rates should be revealed in choices over monetary payments. 6 Chabris, 3 For example, Ashraf, Karlan and Yin (2006) find that roughly 47% of their subjects are dynamically inconsistent over hypothetical time-dated monetary payments and around 60% of the inconsistencies are in the direction of present bias. Similarly, Meier and Sprenger (2010) find that roughly 45% of their subjects are dynamically inconsistent over incentivized time dated payments and 80% of the inconsistencies are in the direction of present bias. 4 This point was originally raised by Thaler (1981) who, when considering the possibility of using incentivized monetary payments in intertemporal choice experiments noted Real money experiments would be interesting but seem to present enormous tactical problems. (Would subjects believe they would get paid in five years?) 5 Specifically, Andreoni and Sprenger (2012b) show that when sooner payments are certain while future payments are delivered only with 80%, subjects prefer the certain sooner payment. When payments at both time periods are made uncertain, occurring with 50% sooner and 40% in the future, subjects appear more patient, violating discounted expected utility. The observation that non-expected utility risk preferences generate dynamic inconsistencies was previously thoughtfully analyzed theoretically by Machina (1989). Halevy (2008) makes the link between prospect theory probability weighting and diminishing impatience through time citing psychology experiments conducted by Keren and Roelofsma (1995) and Weber and Chapman (2005) whoshow in an original experiment and a partial reproduction, respectively, that when payment risk is added to binary choices over monetary payments, dynamic inconsistency is reduced in some experimental contexts. 6 This point has been thoughtfully taken into account in some studies. For example, Harrison et al. (2002) explicitly account for potential arbitrage in their calculations of individual discount rates by measuring individual borrowing and saving rates and incorporating these values in estimation. Cubitt and Read (2007) provide 3

5 Laibson and Schuldt (2008) describe the di culty in mapping experimental choices over money to corresponding model parameters, casting skepticism over monetary experiments in general. The model is one of consumption, so falsifying the key prediction of diminishing impatience through time may be more convincing when done in the relevant domain, consumption. 7 There are only a few experimental tests of dynamic inconsistency for consumption. Key contributions include Read and van Leeuwen (1998) whoidentifydynamicinconsistencyinthesurprisereallocations of snack choices, and McClure, Laibson, Loewenstein and Cohen (2007) andbrown, Chua and Camerer (2009), who document dynamic inconsistency in brief intertemporal choices over squirts of juice and soda. In this paper we attempt to move out of the domain of monetary choices and into the domain of consumption, while maintaining a portable design that allows individual parameters of dynamic inconsistency to be estimated. With 102 UC Berkeley Xlab subjects, we introduce asevenweeklongitudinalexperimentaldesignaskingsubjectstoallocateandsubsequently reallocate units of e ort (i.e., negative leisure consumption) over time at various gross interest rates. Subject responses are incentivized by requiring completion of the tasks from either one initial allocation or one subsequent reallocation. Subjects receive a one-time completion bonus of $100 in the seventh week of the experiment, fixing the monetary dimension of their e ort allocation choices. The tasks over which subjects make choices are transcription of meaningless greek texts and completion of partial tetris games. Allocations are made in a convex decision environment permitting identification of both cost function and discounting parameters. Di erences between initial allocations and subsequent reallocations allow for the identification of dynamic inconsistency. The repeated interaction of our seven-week study allows us to complement measures of e ort excellent recent discussion of the arbitrage arguments and other issues for choices over monetary payments. One counterpoint is provided by Coller and Williams (1999), who present experimental subjects with a fully articulated arbitrage argument and external interest rate information and document only a small treatment e ect. 7 Though our objective in the present study is the exploration of present bias separate from issues of fungibility, recent developments in the field have led to another important facet of the debate: why and when do monetary discounting studies deliver measures of present bias with predictive validity despite their potential flaws? This question lies outside the scope of this paper but clearly represents an important avenue for future research. 4
 whoidentifydynamicinconsistencyinthesurprisereallocations of snack choices, and McClure, Laibson, Loewenstein and Cohen (2007) andbrown, Chua and")
6 discounting with measures of monetary discounting taken from Andreoni and Sprenger (2012a) Convex Time Budget (CTB) choices over cash payments received in the laboratory. In these choices, subjects allocate money across time at various gross interest rates. We can compare dynamic inconsistency measured over work and money at both the aggregate and individual level. Finally, once subjects have experienced the tasks for several weeks, we elicit their demand for a commitment device. Specifically, we allow subjects to probabilistically favor their initial allocations over their subsequent reallocations of work. We investigate the aggregate demand for our o ered commitment device and correlate identified dynamic inconsistency over both e ort and money with commitment demand. We document three primary findings. First, in the domain of money we find virtually no aggregate evidence of present bias using immediate in-lab cash payments. Second, in the domain of e ort we find significant evidence of present bias. Allocations of tasks made one week in advance exceed those made on the date of actual e ort by approximately 9%, on average. Corresponding parameter estimates corroborate these non-parametric results. Third, we find that the elicited demand for commitment is limited to price zero, at which price 59% of subjects would prefer a higher likelihood of implementing one of their initial allocations over their subsequent reallocations. More importantly, we show that subjects we identified as present biased choose the commitment device, while others do not. We show that the choice of commitment is binding and meaningful in the sense that initial preferred allocations di er significantly from subsequent reallocations. This provides key validation and support for our experimental measures and well-known theoretical models of present bias. Despite recent negative findings for models of dynamic inconsistency with time-dated payments, we find support for the model s central prediction of diminishing impatience through time in the domain of consumption. Further, the auxiliary predictions of both the potential demand for commitment and the link between commitment demand and present bias are also validated. 5

7 The paper proceeds as follows: Section 2 provides details for our longitudinal experimental design. Section 3 describes identification of intertemporal parameters based on experimental choices over both e ort and money. Section 4 presents results. Section 5 is a discussion and section 6 concludes. 2 Design To examine dynamic inconsistency in real e ort, we introduce a longitudinal experimental design conducted over seven weeks. In the experiment, subjects are asked to allocate, subsequently reallocate and complete tasks for two jobs. If all elements of the experiment are completed satisfactorily, subjects receive a completion bonus of $100 in Week 7 of the study. Otherwise they receive only $10 in Week 7. The objective of the completion bonus is to fix the monetary dimension of subjects e ort choices. Subjects are always paid the same amount for their completed work, the question of interest is when they prefer to exert e ort. Having individuals make intertemporal choices over e ort allows us to circumvent many of the key concerns that plague monetary discounting experiments. First, subjects cannot borrow, save or substitute units of tasks outside of the experiment, removing opportunities of arbitrage. 8 Second, the precise date of consumption is known to both the researcher and the subject at the time of decision, allowing for precise identification of discounting parameters. Third, individuals select into a seven week experiment with a $100 completion bonus in the seventh week, reducing issues of payment reliability. This also separates e ort allocation decisions from payment. And lastly, we implement a minimum work requirement. This equalizes transaction costs over time as subjects are forced to participate and complete minimum e ort on all dates. We present the design in five subsections. First, we describe the Jobs to be completed. Second, we present a timeline of the experiment and the convex decision environment in which allocations were made. The third subsection describes the design of the commitment device 8 Though this removes substitutability of the task at hand, subjects may alter their allocations of other, extra-lab consumption. As a first pass we ignore this possibility and the possibility that subjects subcontract their experimental tasks. Section 6 provides additional discussion. 6

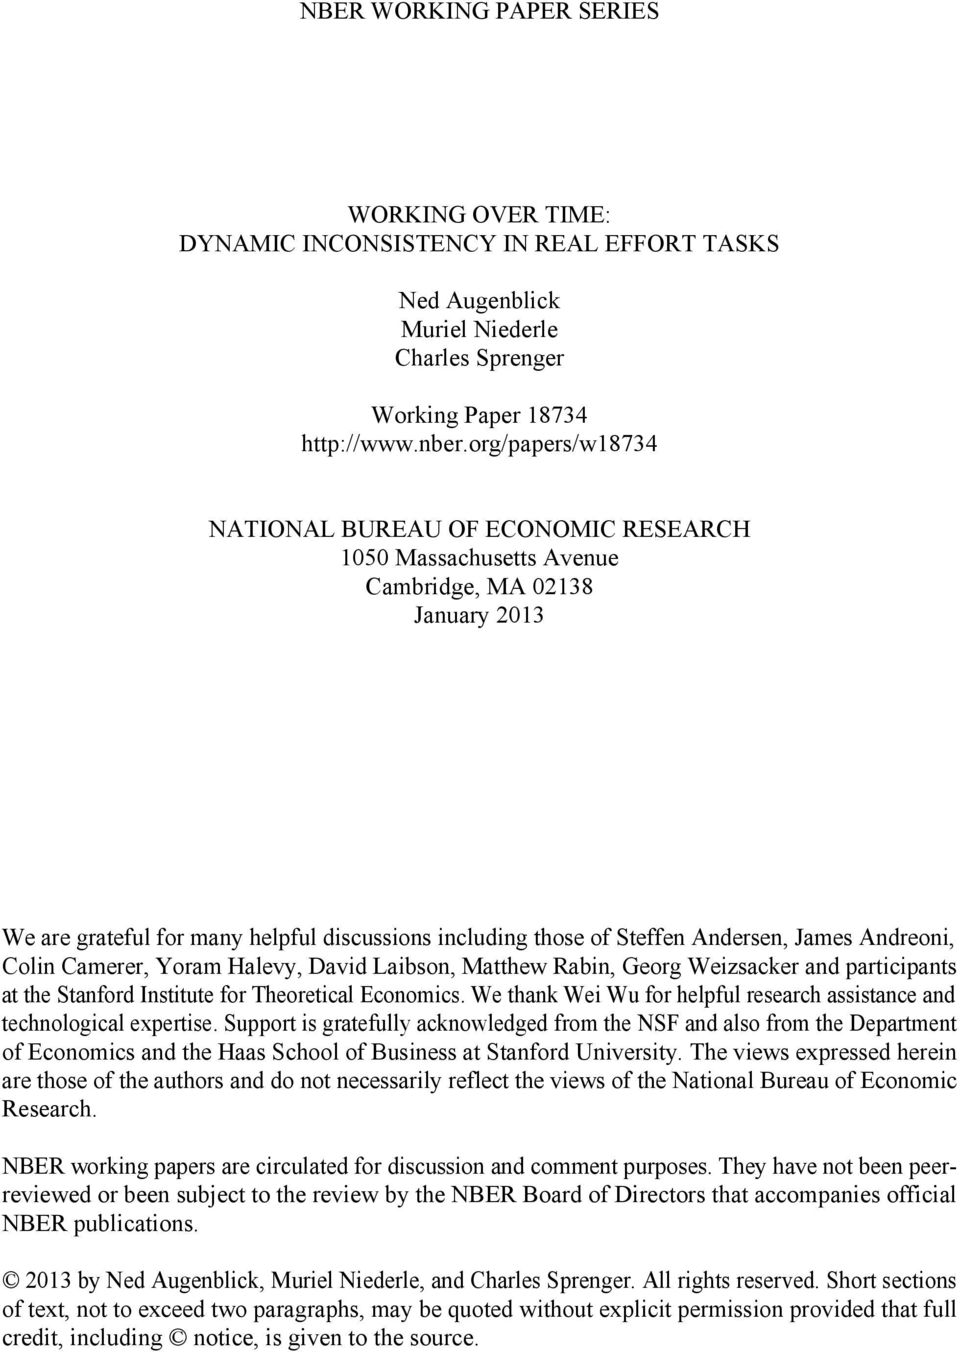
8 for which demand was elicited once subjects had gained experience with the tasks. The fourth subsection addresses design details including recruitment, selection and attrition. The fifth subsection presents the complementary monetary discounting study facilitated by the repeated interaction with subjects during the experiment. 2.1 Jobs The experiment focuses on intertemporal allocations of e ort. Subjects are asked to allocate, subsequently reallocate and complete tasks of two jobs. In Job 1, subjects transcribe a meaningless greek text through a computer interface. Figure 1, Panel A demonstrates the paradigm. Greek letters appear in random order, slightly blurry, in subjects transcription box. By pointing and clicking on the corresponding keyboard below the transcription box, subjects must reproduce the observed series of Greek letters. One task is the completion of one row of Greek text with 80 percent accuracy as measured by the Levenshtein Distance. 9 In the first week, subjects completed a task from Job 1 in an average of 54 seconds. By the final week, the average was 46 seconds. In Job 2, subjects are asked to complete four rows of a standard tetris game. Figure 1, Panel B demonstrates the paradigm. Blocks of random shapes appear at the top of the tetris box and fall at fixed speed. Arranging the shapes to complete a horizontal line of the tetris box is the game s objective. Once a row is complete, it disappears and the shapes above fall into place. One task is the completion of four rows of tetris. If the tetris box fills to the top with shapes before the four rows are complete, the subject begins again with credit for the rows already completed. In the first week, subjects completed a task from Job 2 in an average of 55 seconds. By the final week, the average was 46 seconds. 9 The Levenshtein Distance is commonly used in computer science to measure the distance between two strings and is defined as the minimum number of edits needed to transform one string into the other. Allowable edits are insertion, deletion or change of a single character. As the strings of Greek characters used in the transcription task are 35 characters long our 80 percent accuracy measure is equivalent to 7 edits or less or a Levenshtein Distance apple 7. 7


9 Figure 1: Experimental Jobs Panel A: Job 1- Greek Transcription Panel B: Job 2- Partial Tetris Games 2.2 Experimental Timeline and Allocation Environment Timeline The seven weeks of the experiment are divided into two blocks. Weeks 1, 2, and 3 serve as the first block. Weeks 4, 5, and 6 serve as the second block and mirror the first block with the addition of a commitment decision discussed below. Week 7 occurs in the laboratory and is only used to distribute payment to the subjects. Subjects always participate on the same 8

10 day of the week throughout the experiment. That is, subjects entering the lab on a Monday allocate tasks to be completed on future Mondays. Therefore, the time frame over which e ort choices are made is exactly seven days in all choices. Weeks 1 and 4 occur in the laboratory and subjects are reminded of their study time the night before. Weeks 2, 3, 5, and 6 are completed online. For Weeks 2, 3, 5, and 6, subjects are sent an reminder at 8pm the night before with a (subject-unique) website address. Subjects are required to log in to this website between 8am and midnight of the day in question and complete their work by 2am the following morning. At each point of contact, subjects are first given instructions about the decisions to be made and work to be completed that day, reminded of the timeline of the experiment, given demonstrations of any unfamiliar actions, and then asked to complete the necessary actions. In each week, subjects are required to complete 10 tasks of each Job prior to making allocations decision or completing allocated tasks. The objective of this pair of 10 tasks, which we call minimum work, is two-fold. First, minimum work requires a few minutes of participation at each date, forcing subjects to incur the transaction costs of logging on to the experimental website at each time. 10 Second, minimum work, especially in Week 1, provides experience for subjects such that they have a sense of how e ortful the tasks are when making their allocation decisions. We require minimum work in all weeks before all decisions and provide this information to subjects to control for issues related to projection bias (Loewenstein, O Donoghue and Rabin, 2003). This ensures that subjects have experienced and can forecast having experienced the same amount of e ort when making their allocation decisions at all points in time. 10 A similar technique is used in monetary discounting studies where minimum payments are employed to eliminate subjects loading allocations to certain dates to avoid transaction costs of receiving multiple payments or cashing multiple checks (Andreoni and Sprenger, 2012a). 9

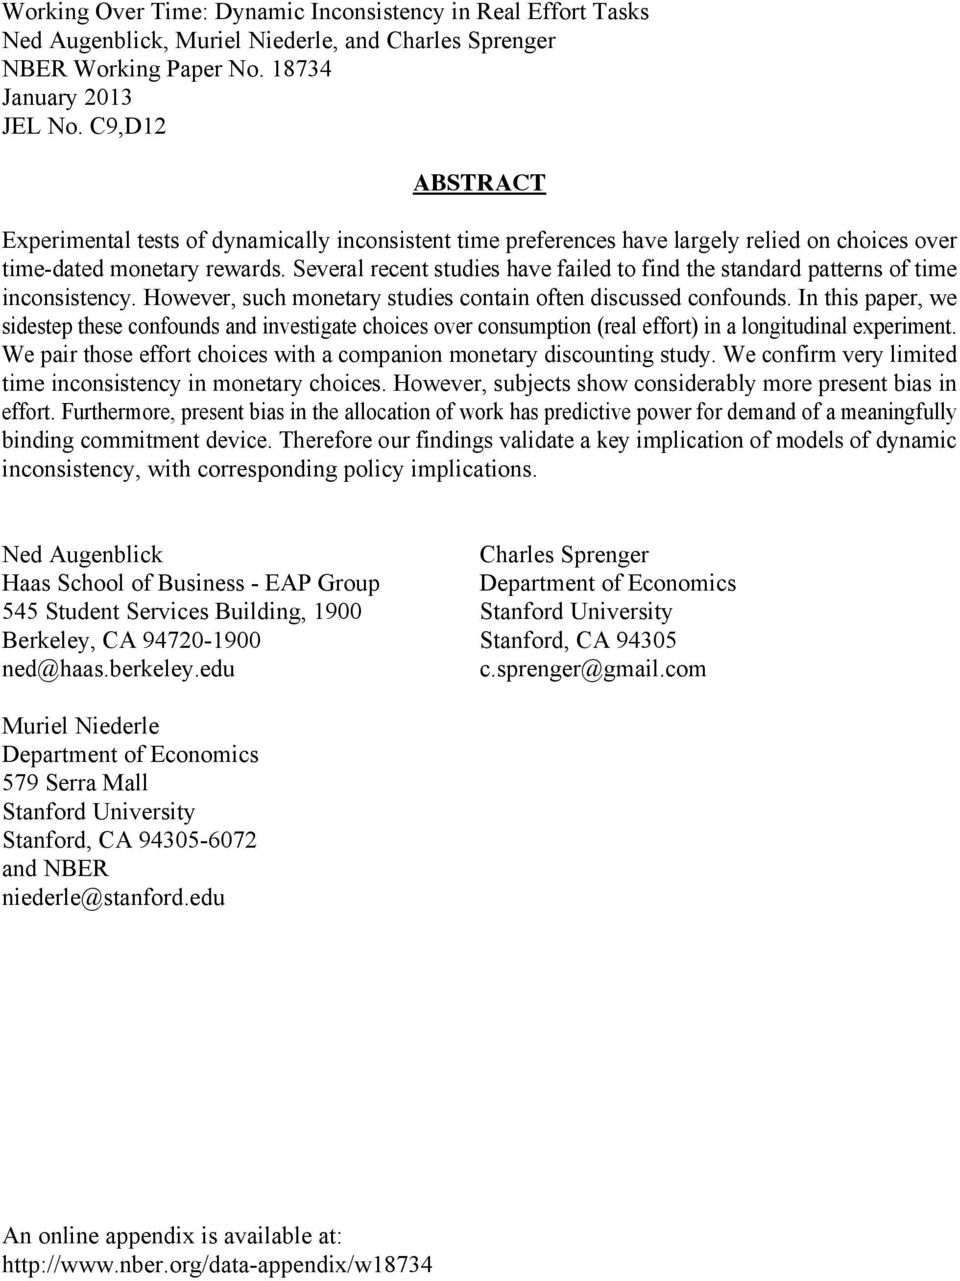
11 2.2.2 Allocation Environment In Week 1, subjects allocate tasks between Weeks 2 and 3. Hence, subjects are choosing how much work to complete at two future dates. In Week 2, subjects also allocate tasks between Weeks 2 and 3. Note that in Week 1 subjects are making decision involving two future dates, whereas in Week 2, subjects are making decisions involving the present and a future date. Before making the choice in Week 1, subjects are told of the Week 2 decisions and are aware that exactly one of all Week 1 and Week 2 allocation decisions will be implemented. 11 Initial allocations and subsequent reallocations for Jobs 1 and 2 are made in a convex decision environment. Using slider bars, subjects allocate tasks to two dates, one earlier and one later, under di erent gross interest rates. 12 Figure 2 provides a sample allocation screen. To motivate the intertemporal tradeo s faced by subjects,decisions are described as having di erent task rates such that every task allocated to the sooner date reduces the number of tasks allocated to the later date by a stated number. For example, a task rate of 1:0.5 implies that each task allocated to Week 2 reduces by 0.5 the number allocated to Week 3. It is important to note that the minimum 10 tasks required for each job detailed in the previous section are separate from this allocation decision and are not counted toward the allocations. The subjects decision can be formulated as allocating tasks e over times t and t + k, e t and e t+k, subject to the present-value budget constraint, e t + 1 p e t+k = m, (1) where 1/p represents the provided task rate. For each task and for each date where allocations were made, subjects faced five task rates, 1/p 2 {0.5, 0.75, 1, 1.25, 1.5}. The number of tasks that subjects could allocate to the sooner date was fixed at fifty such that m =50inevery decision in the experiment. Note that as the task rate falls, the relative cost of a task in Week 11 Subjects were not shown their initial allocations when making their subsequent reallocations. 12 Passive allocations are avoided in the design as the sliders initial location was in the middle of the slider bar and subjects were required to click on every slider before submitting their answers. 10


12 2(theearlierweek)falls,alteringintertemporalincentives. Figure 2: Convex Allocation Environment In Weeks 1 and 2 each subject makes 20 allocation decisions: five for each Job in Week 1 and five for each Job in Week 2. After the Week 2 decisions, one of these 20 allocations is chosen at random as the allocation-that-counts and subjects have to complete the allocated number of tasks to ensure successful completion of the experiment. However, the randomization device probabilistically favors the Week 2 allocations over the Week 1 allocations. In particular, subjects are told (from the beginning) that their Week 1 allocations will count with probability 0.1, while their Week 2 reallocations will count with probability 0.9. Within each week s allocations, every choice is equally likely to be the allocation-that-counts. 13 This randomization process e ectively favors flexibility while maintaining incentive compatibility in a comprehensible manner. This design choice was made for two reasons. First, it increased the chance that subjects experienced their own potentially present-biased reallocations. Second, it provides a greater symmetry to the decisions in the second block of three weeks that elicit demand for commitment. 13 For a complete description of the randomization process please see instructions in Appendix C. 11

13 The second block of the experiment, Weeks 4, 5, and 6, mimics the first block of Weeks 1, 2, and 3, with one exception. In Week 4, subjects are o ered a probabilistic commitment device, which is described in detail in the following subsection. 2.3 Commitment Demand In the second block of the experiment, Weeks 4, 5, and 6, once subjects have gained experience with the tasks and the experimental design, they are o ered a probabilistic commitment device. In the first block of the experiment, the allocation-that-counts is taken from the Week 1 allocations with probability 0.1 and from the subsequent Week 2 reallocations with probability 0.9, favoring the later reallocations. In Week 4, subjects are given the opportunity to choose which allocations will be probabilistically favored. In particular, they can choose whether the allocation-that-counts comes from Week 4 with probability 0.1 (and Week 5 with probability 0.9), favoring flexibility, or from Week 4 with probability 0.9, favoring commitment. This form of commitment device was chosen because of its potential to be meaningfully binding. Subjects who choose to commit and who di er in their allocation choices through time can find themselves constrained by commitment with high probability. In order to operationalize our elicitation of commitment demand, subjects are asked to make 15 multiple price list decisions between two options. In the first option, the allocationthat-counts will come from Week 4 with probability 0.1. In the second option, the allocationthat-counts will come from Week 4 with probability 0.9. In order to determine the strength of preference, an additional payment of between $0 and $10 is added to one of the options for each decision. 14 Figure 3 provides the implemented price list. One of the 15 commitment decisions is chosen for implementation, ensuring incentive compatibility. Subjects are told that the implementation of the randomization for the commitment decisions will occur once they submitted their Week 5 allocation decisions. Our commitment demand decisions, and the second block of the experiment, serve three 14 We chose not to have the listed prices ever take negative values (as in a cost) to avoid subjects viewing paying for commitment as a loss. 12


14 Figure 3: Commitment Demand Elicitation purposes. First, they allow us to assess the demand for commitment and its extent. If individuals demand commitment, it is important to know both how much they are willing to pay for the opportunity to restrict their future activities and to help separate commitment demand from simple decision error. Second, a key objective of our study is to explore the theoretical link, under the assumption of sophistication, between present bias and commitment demand. Are subjects who are present biased comparing initial allocations to subsequent reallocations more likely to demand commitment? With the exception of Ashraf et al. (2006) andkaur, Kremer and Mullainathan (2010) virtuallynoresearchteststhiscriticalimplicationofmodels of dynamic inconsistency. We will compare our results to those papers in subsection 4.4. Finally, a correlation between time inconsistency and commitment validates the interpretation of present bias over other explanations for time inconsistent e ort choices. To summarize our longitudinal e ort experiment, Table 1 contains the major events in each week. 13

15 Table 1: Summary of Longitudinal Experiment Minimum 10 E ort Allocation-That- Complete Commitment Receive Work Allocations Counts Chosen Work Choice Payment Week 1 (In Lab): x x Week 2 (Online): x x x x Week 3 (Online): x x Week 4 (In Lab): x x x Week 5 (Online): x x x x Week 6 (Online): x x Week 7 (In Lab): x 2.4 Design Details 102 subjects from the UC Berkeley Xlab subject pool were initially recruited into the experiment across 4 experimental sessions on February 8th, 9th and 10th, 2012 and were told in advance of the seven week longitudinal design and the $100 completion bonus. 15 Subjects did not receive an independent show up fee. 90 subjects completed all aspects of the working over time experiment and received the $100 completion bonus. The 12 subjects who selected out of the experiment do not appear di erent on either initial allocations, comprehension or a small series of demographic data collected at the end of the first day of the experiment. 16 One more subject completed initial allocations in Week 1, but due to computer error did not have their choices recorded. This leaves us with 89 subjects. One critical aspect of behavior limits our ability to make inference for time preferences based on experimental responses. In particular, if subjects have no variation in allocations in response to gross interest rate changes in some weeks, then attempting to point identify both discounting and cost function parameters is di cult or impossible, yielding imprecise and unstable estimates. Similar to multiple price list experiments, if a subject always chooses a 15 This is a potentially important avenue of selection into the experiment. Our subjects were willing to put forth e ort and wait seven weeks to receive $100. Though we have no formal test, this suggests that our subjects may be a relatively patient selection of those 12 subjects dropped after the first week while the remaining 9 dropped after the second week. Including data for these 9 subjects where available does not qualitatively alter the analysis or conclusions. 14

16 specific option, only one-sided bounds on parameters can be obtained. Here, the problem is compounded by our e orts to identify both discounting and cost function parameters. In our sample, nine subjects have this issue for one or more weeks of the study. For the analysis, we focus on the primary sample of 80 subjects who completed all aspects of the experiment with positive variation in their responses in each week. In Appendix Table A2, we re-conduct the aggregate analysis including these nine subjects and obtain very similar findings. 2.5 Monetary Discounting Subjects were present in the UC Berkeley X-Laboratory in the first, fourth, and seventh weeks of the experiment. This repeated interaction facilitates a monetary discounting study that complements our main avenue of analysis. In Weeks 1 and 4 of our experimental design, once subjects complete their allocation of tasks, they are invited to respond to additional questions allocating monetary payments to Weeks 1, 4, and 7. In Week 1, we implement three Andreoni and Sprenger (2012a) ConvexTimeBudget(CTB)choicesets,allocatingpaymentsacross:1) Week 1 vs. Week 4; 2) Week 4 vs. Week 7 (Prospective); and 3) Week 1 vs. Week 7. Individuals are asked to allocate monetary payments c across the two dates t and t + k, c t and c t+k, subject to the intertemporal budget constraint, r c t + c t+k = m. (2) The experimental budget is fixed at m =$20andfivegrossinterestratesareimplementedin each choice set, r 2 {0.99, 1, 1.11, 1.25, 1.43}. These gross interest rates were chosen for comparison with prior work (Andreoni and Sprenger, 2012a). 17 Such questions permit identification of monetary discounting parameters following Andreoni and Sprenger (2012a). In Week 4, we ask subjects to allocate in a CTB choice set over Week 4 and Week 7 under the same five gross interest rates. We refer to these choices made in Week 4 as Week 4 vs. Week 7 and those made in Week 1 over these two dates as Week 4 vs. Week 7 (Prospective). Hence, subjects complete 17 Additionally, r =0.99 allows us to investigate the potential extent of negative discounting. 15

17 atotaloffourctbchoicesets. The CTBs implemented in Weeks 1 and 4 are paid separately and independently from the rest of the experiment with one choice from Week 1 and one choice from Week 4 chosen to be implemented. Subjects are paid according to their choices. Subjects are not told of the Week 4 choices in Week 1. As in Andreoni and Sprenger (2012a), miniminum payments of $5 at each payment date are enacted to eliminate transaction cost issues similar to those discussed above. Appendix C provides the full experimental instructions. The implemented monetary discounting experiments have two nuances relative to Andreoni and Sprenger (2012a). First, Andreoni and Sprenger (2012a) implementctbswithpayment by check. Our design implements payment by cash with potentially lower transaction costs. Second, Andreoni and Sprenger (2012a) implement CTBs with present payment received only by 5:00 p.m. in a subject s residence mailbox. Here we provide payment immediately in the laboratory limiting arguments about the relevant epoch of the present. In both Weeks 1 and 4, the monetary allocations are implemented after the more central e ort choices. The monetary choices were not announced in advance and subjects could choose not to participate; five did so in either Weeks 1 or 4. In our analysis of monetary discounting, we focus on the 75 subjects from the primary sample with complete monetary choice data. 3 Identification In the intertemporal allocation of e ort and money, discounting and additional parameters can be identified at either the aggregate or individual level under various structural assumptions. In the following two subsections we describe which experimental variation provides identification of specific parameters of interest and lay out methodology for estimation at both the aggregate and individual level. 16
, miniminum payments of $5 at each payment date are enacted to eliminate transaction cost issues similar to those discussed above.")
18 3.1 E ort Discounting In the working over time experiment, subjects allocate e ort to an earlier date, e t, and a later date, e t+k, subject to the intertemporal budget constraint described in (1). Hence, the subject s decision problem is min et,e t+k C(e t,e t+k ) s.t. e t + 1 p e t+k = m, where C(e t,e t+k )isageneralcostfunction,assumedtobegloballyconvexsuchthatstandard constrained optimization yields meaningful first order conditions. We assume that the cost function is time separable, that the instantaneous cost function is stationary and takes an exponential form, and that discounting follows the quasi-hyperbolic form proposed by Laibson (1997). Under these structural assumptions we can write C(e t,e t+k )=(e t +!) + 1 t=0 k (e t+k +!), (3) where > 1representsthestationaryparameterontheconvexinstantaneouscostofe ort function. The present-bias parameter,, activated when the time period t is the present, 1 t=0, captures the extent to which individual s disproportionately discount the future when viewed from the present. The parameter captures the daily discount factor over the k =7daysof each considered allocation. The additive term! in the cost function could be interpreted as astone-gearyminimumorassomebackgroundlevelofrequiredwork. Suchparametersare used in monetary discounting studies (Andersen, Harrison, Lau and Rutstrom, 2008; Andreoni and Sprenger, 2012a), and are either taken from some external data source on background consumption or estimated from experimental choices. For simplicity, we interpret! as the required minimum work of the experiment and set! =10. Minimizing (3) subject to (1) yields the intertemporal Euler equation ( e t +! e t+k +! )( 1) ( 1 (1 t=0 ) k )=p. 17
. Under these structural assumptions we can write C(e t,e t+k )=(e t +!) + 1 t=0 k (e t+k +!")
19 Rearranging and taking logs yields log( e t +! e t+k +! )=log( ) 1 (1 t=0)+ log( ) 1 k +( 1 ) log(p), (4) 1 which is linear in the key experimentally varied parameters of whether allocations involve the present, 1 t=0, and a log transform of the task rate, log(p). From the intertemporal Euler equation above, identification of discounting and the cost function is straightforward. The task rate delivers identification of the cost function, ;the choice being made in the present (Week 2 decision) rather than the future (Week 1 decision) delivers identification of present bias, ; and the delay length gives identification of the discount factor,. 18 In order to estimate discounting and cost function parameters from aggregate data, we assume an additive error structure and estimate the linear regression implied by (4). parameters of interest can be recovered from non-linear combinations of regression coe The cients with standard errors calculated via the delta method. 19 One important issue to consider in the estimation of (4) is the potential presence of corner solutions. We provide estimates from two-limit tobit regressions designed to account for the possibility that the tangency condition implied by (4) does not hold with equality (Wooldridge, 2002). Estimating (4) is easily extended to the study of individual parameters. To begin, (4) can be estimated at the individual level. 20 However, with limited numbers of individual choices it is helpful to consider alternative, more structured approaches. In particular, we allow for heterogeneous discounting across individuals, but assume all individuals have the same cost 18 Of course, with only one delay length of seven days considered in the experiment, we have limited confidence that our estimate of can be extrapolated to arbitrary delay lengths. 19 To be specific, the regression equation is, for k = 7, log( e t +! e t+k +! ) i = 0 k + 1 (1 t=0 ) i + 2 log(p) i + i, and we recover the parameters of interest as ˆ = exp(ˆ 1 /ˆ 2 ) and ˆ =1+1/ˆ 2. Note that ˆ = exp(ˆ 0 /ˆ 2 )is recovered from the constant as only one delay length was used in the experimental design. 20 Broadly similar conclusions are reached when estimating (4) at the individual level, however, parameter precision is greatly reduced and substantial estimate instability is uncovered in some cases. 18
 rather than the future (Week 1 decision) delivers identification of present bias, ;")
20 function. Consider a vector of fixed e ects (1 j ) i which take the value 1 if observation i was contributed by individual j. This leads to the fixed e ects formulation log( e t +! e t+k +! ) i = log( ) 1 k + (log( j) log( )) (1 j ) i k + log( ) 1 1 (1 t=0) i + (log( j) log( )) 1 (1 t=0 ) i (1 j ) i log(p) i, where, refer to sample means, and j, j refer to individual-specific discounting parameters. With an additive error structure this is easily estimable. 21 The individual fixed e ect interacted with the decision being made in the present provides identification of the individualspecific j. In Appendix A we conduct simulation exercises under various correlation structures for the true parameters of interest and document that the implemented estimation methods perform well both at the aggregate and individual level. 3.2 Monetary Discounting Our methods for recovering monetary discounting parameters at both the aggregate and individual level closely follow those for e ort. Following most of the literature, we abstract from standard arbitrage arguments for monetary discounting and assume laboratory administered rates are the relevant ones. 22 In particular, for monetary payments, c t and c t+k, allocated subject to the constraint (2), we assume a quasi-hyperbolic constant relative risk averse utility function, U(c t,c t+k )=(c t +!) + 1 t=0 k (c t+k +!). (5) Here, the utility function is assumed to be concave, < 1, such that first order conditions provided meaningful optima. Here, the parameter! is a background parameter that we take 21 We allow both and to vary across individuals such that the implemented regression is a standard interaction with both level and slope e ects. 22 One prominent exception to this tradition is Harrison et al. (2002), who measure and account for extra-lab borrowing and savings opportunities. 19

Moral Hazard. Itay Goldstein. Wharton School, University of Pennsylvania
 Moral Hazard Itay Goldstein Wharton School, University of Pennsylvania 1 Principal-Agent Problem Basic problem in corporate finance: separation of ownership and control: o The owners of the firm are typically
Charging Myopically Ahead: Evidence on Present-Biased Preferences and Credit Card Borrowing
 Charging Myopically Ahead: Evidence on Present-Biased Preferences and Credit Card Borrowing Stephan Meier Charles Sprenger July, 2008 Abstract Some individuals borrow extensively on their credit cards.
Risk Preferences Are Not Time Preferences
 American Economic Review 2012, 102(7): 3357 3376 http://dx.doi.org/10.1257/aer.102.7.3357 Risk Preferences Are Not Time Preferences By James Andreoni and Charles Sprenger* Risk and time are intertwined.
Fairfield Public Schools
 Mathematics Fairfield Public Schools AP Statistics AP Statistics BOE Approved 04/08/2014 1 AP STATISTICS Critical Areas of Focus AP Statistics is a rigorous course that offers advanced students an opportunity
How To Check For Differences In The One Way Anova
 MINITAB ASSISTANT WHITE PAPER This paper explains the research conducted by Minitab statisticians to develop the methods and data checks used in the Assistant in Minitab 17 Statistical Software. One-Way
Chapter 21: The Discounted Utility Model
 Chapter 21: The Discounted Utility Model 21.1: Introduction This is an important chapter in that it introduces, and explores the implications of, an empirically relevant utility function representing intertemporal
Impatience and Credit Behavior: Using Choice Experiments to Explain Borrowing and Defaulting
 Impatience and Credit Behavior: Using Choice Experiments to Explain Borrowing and Defaulting Stephan Meier Federal Reserve Bank of Boston Charles Sprenger University of California, San Diego January, 2008
Auxiliary Variables in Mixture Modeling: 3-Step Approaches Using Mplus
 Auxiliary Variables in Mixture Modeling: 3-Step Approaches Using Mplus Tihomir Asparouhov and Bengt Muthén Mplus Web Notes: No. 15 Version 8, August 5, 2014 1 Abstract This paper discusses alternatives
Statistics in Retail Finance. Chapter 6: Behavioural models
 Statistics in Retail Finance 1 Overview > So far we have focussed mainly on application scorecards. In this chapter we shall look at behavioural models. We shall cover the following topics:- Behavioural
Increasing for all. Convex for all. ( ) Increasing for all (remember that the log function is only defined for ). ( ) Concave for all.
 Increasing for all (remember that the log function is only defined for ). ( ) Concave for all.") 1. Differentiation The first derivative of a function measures by how much changes in reaction to an infinitesimal shift in its argument. The largest the derivative (in absolute value), the faster is evolving.
1. Differentiation The first derivative of a function measures by how much changes in reaction to an infinitesimal shift in its argument. The largest the derivative (in absolute value), the faster is evolving.
Estimating the Relationship between Economic Preferences: A Testing Ground for Unified Theories of Behavior: Appendix
 Estimating the Relationship between Economic Preferences: A Testing Ground for Unified Theories of Behavior: Appendix Not for Publication August 13, 2012 1 Appendix A: Details of Measures Collected Discount
Descriptive Statistics
 Descriptive Statistics Primer Descriptive statistics Central tendency Variation Relative position Relationships Calculating descriptive statistics Descriptive Statistics Purpose to describe or summarize
business statistics using Excel OXFORD UNIVERSITY PRESS Glyn Davis & Branko Pecar
 business statistics using Excel Glyn Davis & Branko Pecar OXFORD UNIVERSITY PRESS Detailed contents Introduction to Microsoft Excel 2003 Overview Learning Objectives 1.1 Introduction to Microsoft Excel
Savings and Prize-Linked Savings Accounts
 Savings and Prize-Linked Savings Accounts Abstract: Many households have insufficient savings to handle moderate and routine consumption shocks. Many of these financially-fragile households also have the
AP Physics 1 and 2 Lab Investigations
 AP Physics 1 and 2 Lab Investigations Student Guide to Data Analysis New York, NY. College Board, Advanced Placement, Advanced Placement Program, AP, AP Central, and the acorn logo are registered trademarks
IBM SPSS Direct Marketing 22
 IBM SPSS Direct Marketing 22 Note Before using this information and the product it supports, read the information in Notices on page 25. Product Information This edition applies to version 22, release
The Intertemporal Choice Task and Network Marketing
 The Effects of Savings on Risk Attitudes and Intertemporal Choices Leandro S. Carvalho University of Southern California Silvia Prina Case Western Reserve University Justin Sydnor University of Wisconsin
Optimal Paternalism: Sin Taxes and Health Subsidies
 Optimal Paternalism: Sin Taxes and Health Subsidies Thomas Aronsson and Linda Thunström Department of Economics, Umeå University SE - 901 87 Umeå, Sweden April 2005 Abstract The starting point for this
A Primer on Forecasting Business Performance
 A Primer on Forecasting Business Performance There are two common approaches to forecasting: qualitative and quantitative. Qualitative forecasting methods are important when historical data is not available.
Working Paper. 2012-WP-06 June 2012. Credit Card Debt and Payment Use Charles Sprenger and Joanna Stavins
 1 Working Paper 2012-WP-06 June 2012 Credit Card Debt and Payment Use Charles Sprenger and Joanna Stavins This paper was presented at NFI s May 14-15, 2009 conference in Indianapolis, IN entitled Improving
Introduction to Regression and Data Analysis
 Statlab Workshop Introduction to Regression and Data Analysis with Dan Campbell and Sherlock Campbell October 28, 2008 I. The basics A. Types of variables Your variables may take several forms, and it
MULTIPLE REGRESSION AND ISSUES IN REGRESSION ANALYSIS
 MULTIPLE REGRESSION AND ISSUES IN REGRESSION ANALYSIS MSR = Mean Regression Sum of Squares MSE = Mean Squared Error RSS = Regression Sum of Squares SSE = Sum of Squared Errors/Residuals α = Level of Significance
Some Essential Statistics The Lure of Statistics
 Some Essential Statistics The Lure of Statistics Data Mining Techniques, by M.J.A. Berry and G.S Linoff, 2004 Statistics vs. Data Mining..lie, damn lie, and statistics mining data to support preconceived
Normalization and Mixed Degrees of Integration in Cointegrated Time Series Systems
 Normalization and Mixed Degrees of Integration in Cointegrated Time Series Systems Robert J. Rossana Department of Economics, 04 F/AB, Wayne State University, Detroit MI 480 E-Mail: r.j.rossana@wayne.edu
Least Squares Estimation
 Least Squares Estimation SARA A VAN DE GEER Volume 2, pp 1041 1045 in Encyclopedia of Statistics in Behavioral Science ISBN-13: 978-0-470-86080-9 ISBN-10: 0-470-86080-4 Editors Brian S Everitt & David
The primary goal of this thesis was to understand how the spatial dependence of
 5 General discussion 5.1 Introduction The primary goal of this thesis was to understand how the spatial dependence of consumer attitudes can be modeled, what additional benefits the recovering of spatial
UC Berkeley Haas School of Business Economic Analysis for Business Decisions (EWMBA 201A)
") UC Berkeley Haas School of Business Economic Analysis for Business Decisions (EWMBA 201A) The economic agent (PR 3.1-3.4) Standard economics vs. behavioral economics Lectures 1-2 Aug. 15, 2009 Prologue
UC Berkeley Haas School of Business Economic Analysis for Business Decisions (EWMBA 201A) The economic agent (PR 3.1-3.4) Standard economics vs. behavioral economics Lectures 1-2 Aug. 15, 2009 Prologue
Panel Data Econometrics
 Panel Data Econometrics Master of Science in Economics - University of Geneva Christophe Hurlin, Université d Orléans University of Orléans January 2010 De nition A longitudinal, or panel, data set is
IBM SPSS Direct Marketing 23
 IBM SPSS Direct Marketing 23 Note Before using this information and the product it supports, read the information in Notices on page 25. Product Information This edition applies to version 23, release
NCSS Statistical Software Principal Components Regression. In ordinary least squares, the regression coefficients are estimated using the formula ( )
") Chapter 340 Principal Components Regression Introduction is a technique for analyzing multiple regression data that suffer from multicollinearity. When multicollinearity occurs, least squares estimates
Chapter 340 Principal Components Regression Introduction is a technique for analyzing multiple regression data that suffer from multicollinearity. When multicollinearity occurs, least squares estimates
HOW TO WRITE A LABORATORY REPORT
 HOW TO WRITE A LABORATORY REPORT Pete Bibby Dept of Psychology 1 About Laboratory Reports The writing of laboratory reports is an essential part of the practical course One function of this course is to
Data Mining Techniques Chapter 5: The Lure of Statistics: Data Mining Using Familiar Tools
 Data Mining Techniques Chapter 5: The Lure of Statistics: Data Mining Using Familiar Tools Occam s razor.......................................................... 2 A look at data I.........................................................
Algebra 1 Course Information
 Course Information Course Description: Students will study patterns, relations, and functions, and focus on the use of mathematical models to understand and analyze quantitative relationships. Through
Credit Card Market Study Interim Report: Annex 4 Switching Analysis
 MS14/6.2: Annex 4 Market Study Interim Report: Annex 4 November 2015 This annex describes data analysis we carried out to improve our understanding of switching and shopping around behaviour in the UK
Supplement to Call Centers with Delay Information: Models and Insights
 Supplement to Call Centers with Delay Information: Models and Insights Oualid Jouini 1 Zeynep Akşin 2 Yves Dallery 1 1 Laboratoire Genie Industriel, Ecole Centrale Paris, Grande Voie des Vignes, 92290
Income and the demand for complementary health insurance in France. Bidénam Kambia-Chopin, Michel Grignon (McMaster University, Hamilton, Ontario)
") Income and the demand for complementary health insurance in France Bidénam Kambia-Chopin, Michel Grignon (McMaster University, Hamilton, Ontario) Presentation Workshop IRDES, June 24-25 2010 The 2010 IRDES
Income and the demand for complementary health insurance in France Bidénam Kambia-Chopin, Michel Grignon (McMaster University, Hamilton, Ontario) Presentation Workshop IRDES, June 24-25 2010 The 2010 IRDES
Experiment #1, Analyze Data using Excel, Calculator and Graphs.
 Physics 182 - Fall 2014 - Experiment #1 1 Experiment #1, Analyze Data using Excel, Calculator and Graphs. 1 Purpose (5 Points, Including Title. Points apply to your lab report.) Before we start measuring
Internet Appendix for. Incentivizing Calculated Risk-Taking: Evidence from an Experiment with Commercial Bank Loan Officers
 Internet Appendix for Incentivizing Calculated Risk-Taking: Evidence from an Experiment with Commercial Bank Loan Officers SHAWN COLE, MARTIN KANZ, and LEORA KLAPPER This Appendix presents additional materials
Credit card debt is widespread. US households with at least one credit card report
 American Economic Journal: Applied Economics 2010, 2:1, 193 210 http://www.aeaweb.org/articles.php?doi=10.1257/app.2.1.193 Present-Biased Preferences and Credit Card Borrowing By Stephan Meier and Charles
CAPM, Arbitrage, and Linear Factor Models
 CAPM, Arbitrage, and Linear Factor Models CAPM, Arbitrage, Linear Factor Models 1/ 41 Introduction We now assume all investors actually choose mean-variance e cient portfolios. By equating these investors
Writing the Empirical Social Science Research Paper: A Guide for the Perplexed. Josh Pasek. University of Michigan.
 Writing the Empirical Social Science Research Paper: A Guide for the Perplexed Josh Pasek University of Michigan January 24, 2012 Correspondence about this manuscript should be addressed to Josh Pasek,
How To Understand And Solve A Linear Programming Problem
 At the end of the lesson, you should be able to: Chapter 2: Systems of Linear Equations and Matrices: 2.1: Solutions of Linear Systems by the Echelon Method Define linear systems, unique solution, inconsistent,
 There are three kinds of people in the world those who are good at math and those who are not. PSY 511: Advanced Statistics for Psychological and Behavioral Research 1 Positive Views The record of a month
Why High-Order Polynomials Should Not be Used in Regression Discontinuity Designs
 Why High-Order Polynomials Should Not be Used in Regression Discontinuity Designs Andrew Gelman Guido Imbens 2 Aug 2014 Abstract It is common in regression discontinuity analysis to control for high order
Penalized regression: Introduction
 Penalized regression: Introduction Patrick Breheny August 30 Patrick Breheny BST 764: Applied Statistical Modeling 1/19 Maximum likelihood Much of 20th-century statistics dealt with maximum likelihood
Optimal insurance contracts with adverse selection and comonotonic background risk
 Optimal insurance contracts with adverse selection and comonotonic background risk Alary D. Bien F. TSE (LERNA) University Paris Dauphine Abstract In this note, we consider an adverse selection problem
Procrastination and Impatience
 Procrastination and Impatience Ernesto Reuben, Paola Sapienza, and Luigi Zingales First version: December 2007 This version: July 2008 Abstract There is a large body of literature documenting both a preference
Chi Square Tests. Chapter 10. 10.1 Introduction
 Contents 10 Chi Square Tests 703 10.1 Introduction............................ 703 10.2 The Chi Square Distribution.................. 704 10.3 Goodness of Fit Test....................... 709 10.4 Chi Square
Definition. Hyperbolic discounting refers to the tendency for people to increasingly choose a
 Hyperbolic Discounting Definition Hyperbolic discounting refers to the tendency for people to increasingly choose a smaller-sooner reward over a larger-later reward as the delay occurs sooner rather than
Organizing Your Approach to a Data Analysis
 Biost/Stat 578 B: Data Analysis Emerson, September 29, 2003 Handout #1 Organizing Your Approach to a Data Analysis The general theme should be to maximize thinking about the data analysis and to minimize
Stock market booms and real economic activity: Is this time different?
 International Review of Economics and Finance 9 (2000) 387 415 Stock market booms and real economic activity: Is this time different? Mathias Binswanger* Institute for Economics and the Environment, University
Herding, Contrarianism and Delay in Financial Market Trading
 Herding, Contrarianism and Delay in Financial Market Trading A Lab Experiment Andreas Park & Daniel Sgroi University of Toronto & University of Warwick Two Restaurants E cient Prices Classic Herding Example:
Algebra 1 2008. Academic Content Standards Grade Eight and Grade Nine Ohio. Grade Eight. Number, Number Sense and Operations Standard
 Academic Content Standards Grade Eight and Grade Nine Ohio Algebra 1 2008 Grade Eight STANDARDS Number, Number Sense and Operations Standard Number and Number Systems 1. Use scientific notation to express
A Trading Strategy Based on the Lead-Lag Relationship of Spot and Futures Prices of the S&P 500
 A Trading Strategy Based on the Lead-Lag Relationship of Spot and Futures Prices of the S&P 500 FE8827 Quantitative Trading Strategies 2010/11 Mini-Term 5 Nanyang Technological University Submitted By:
AN ANALYSIS OF INSURANCE COMPLAINT RATIOS
 AN ANALYSIS OF INSURANCE COMPLAINT RATIOS Richard L. Morris, College of Business, Winthrop University, Rock Hill, SC 29733, (803) 323-2684, morrisr@winthrop.edu, Glenn L. Wood, College of Business, Winthrop
SENSITIVITY ANALYSIS AND INFERENCE. Lecture 12
 This work is licensed under a Creative Commons Attribution-NonCommercial-ShareAlike License. Your use of this material constitutes acceptance of that license and the conditions of use of materials on this
Present-Biased Preferences and Credit Card Borrowing
 DISCUSSION PAPER SERIES IZA DP No. 4198 Present-Biased Preferences and Credit Card Borrowing Stephan Meier Charles Sprenger May 2009 Forschungsinstitut zur Zukunft der Arbeit Institute for the Study of
c 2008 Je rey A. Miron We have described the constraints that a consumer faces, i.e., discussed the budget constraint.
 Lecture 2b: Utility c 2008 Je rey A. Miron Outline: 1. Introduction 2. Utility: A De nition 3. Monotonic Transformations 4. Cardinal Utility 5. Constructing a Utility Function 6. Examples of Utility Functions
Decline in Federal Disability Insurance Screening Stringency and Health Insurance Demand
 Decline in Federal Disability Insurance Screening Stringency and Health Insurance Demand Yue Li Siying Liu December 12, 2014 Abstract This paper proposes that the decline in federal disability insurance
EconS 503 - Advanced Microeconomics II Handout on Cheap Talk
 EconS 53 - Advanced Microeconomics II Handout on Cheap Talk. Cheap talk with Stockbrokers (From Tadelis, Ch. 8, Exercise 8.) A stockbroker can give his client one of three recommendations regarding a certain
II. DISTRIBUTIONS distribution normal distribution. standard scores
 Appendix D Basic Measurement And Statistics The following information was developed by Steven Rothke, PhD, Department of Psychology, Rehabilitation Institute of Chicago (RIC) and expanded by Mary F. Schmidt,
Simple Predictive Analytics Curtis Seare
 Using Excel to Solve Business Problems: Simple Predictive Analytics Curtis Seare Copyright: Vault Analytics July 2010 Contents Section I: Background Information Why use Predictive Analytics? How to use
Curriculum Map Statistics and Probability Honors (348) Saugus High School Saugus Public Schools 2009-2010
 Saugus High School Saugus Public Schools 2009-2010") Curriculum Map Statistics and Probability Honors (348) Saugus High School Saugus Public Schools 2009-2010 Week 1 Week 2 14.0 Students organize and describe distributions of data by using a number of different
Curriculum Map Statistics and Probability Honors (348) Saugus High School Saugus Public Schools 2009-2010 Week 1 Week 2 14.0 Students organize and describe distributions of data by using a number of different
Simple Linear Regression Inference
 Simple Linear Regression Inference 1 Inference requirements The Normality assumption of the stochastic term e is needed for inference even if it is not a OLS requirement. Therefore we have: Interpretation
CHAPTER 13 SIMPLE LINEAR REGRESSION. Opening Example. Simple Regression. Linear Regression
 Opening Example CHAPTER 13 SIMPLE LINEAR REGREION SIMPLE LINEAR REGREION! Simple Regression! Linear Regression Simple Regression Definition A regression model is a mathematical equation that descries the
Inflation. Chapter 8. 8.1 Money Supply and Demand
 Chapter 8 Inflation This chapter examines the causes and consequences of inflation. Sections 8.1 and 8.2 relate inflation to money supply and demand. Although the presentation differs somewhat from that
1 Present and Future Value
 Lecture 8: Asset Markets c 2009 Je rey A. Miron Outline:. Present and Future Value 2. Bonds 3. Taxes 4. Applications Present and Future Value In the discussion of the two-period model with borrowing and
Bootstrapping Big Data
 Bootstrapping Big Data Ariel Kleiner Ameet Talwalkar Purnamrita Sarkar Michael I. Jordan Computer Science Division University of California, Berkeley {akleiner, ameet, psarkar, jordan}@eecs.berkeley.edu
Biostatistics: Types of Data Analysis
 Biostatistics: Types of Data Analysis Theresa A Scott, MS Vanderbilt University Department of Biostatistics theresa.scott@vanderbilt.edu http://biostat.mc.vanderbilt.edu/theresascott Theresa A Scott, MS
The Role of Time Preferences and Exponential-Growth Bias in Retirement Savings
 The Role of Time Preferences and Exponential-Growth Bias in Retirement Savings Gopi Shah Goda Stanford University and NBER Colleen Flaherty Manchester University of Minnesota Matthew R. Levy London School
Optimal Consumption with Stochastic Income: Deviations from Certainty Equivalence
 Optimal Consumption with Stochastic Income: Deviations from Certainty Equivalence Zeldes, QJE 1989 Background (Not in Paper) Income Uncertainty dates back to even earlier years, with the seminal work of
Exact Nonparametric Tests for Comparing Means - A Personal Summary
 Exact Nonparametric Tests for Comparing Means - A Personal Summary Karl H. Schlag European University Institute 1 December 14, 2006 1 Economics Department, European University Institute. Via della Piazzuola
Data Analysis, Statistics, and Probability
 Chapter 6 Data Analysis, Statistics, and Probability Content Strand Description Questions in this content strand assessed students skills in collecting, organizing, reading, representing, and interpreting
Applying Statistics Recommended by Regulatory Documents
 Applying Statistics Recommended by Regulatory Documents Steven Walfish President, Statistical Outsourcing Services steven@statisticaloutsourcingservices.com 301-325 325-31293129 About the Speaker Mr. Steven
Two Papers on Internet Connectivity and Quality. Abstract
 Two Papers on Internet Connectivity and Quality ROBERTO ROSON Dipartimento di Scienze Economiche, Università Ca Foscari di Venezia, Venice, Italy. Abstract I review two papers, addressing the issue of
Overview of Violations of the Basic Assumptions in the Classical Normal Linear Regression Model
 Overview of Violations of the Basic Assumptions in the Classical Normal Linear Regression Model 1 September 004 A. Introduction and assumptions The classical normal linear regression model can be written
11. Analysis of Case-control Studies Logistic Regression
 Research methods II 113 11. Analysis of Case-control Studies Logistic Regression This chapter builds upon and further develops the concepts and strategies described in Ch.6 of Mother and Child Health:
The Best of Both Worlds:
 The Best of Both Worlds: A Hybrid Approach to Calculating Value at Risk Jacob Boudoukh 1, Matthew Richardson and Robert F. Whitelaw Stern School of Business, NYU The hybrid approach combines the two most
Empirical Methods in Applied Economics
 Empirical Methods in Applied Economics Jörn-Ste en Pischke LSE October 2005 1 Observational Studies and Regression 1.1 Conditional Randomization Again When we discussed experiments, we discussed already
CONTENTS OF DAY 2. II. Why Random Sampling is Important 9 A myth, an urban legend, and the real reason NOTES FOR SUMMER STATISTICS INSTITUTE COURSE
 1 2 CONTENTS OF DAY 2 I. More Precise Definition of Simple Random Sample 3 Connection with independent random variables 3 Problems with small populations 8 II. Why Random Sampling is Important 9 A myth,
Sample Size and Power in Clinical Trials
 Sample Size and Power in Clinical Trials Version 1.0 May 011 1. Power of a Test. Factors affecting Power 3. Required Sample Size RELATED ISSUES 1. Effect Size. Test Statistics 3. Variation 4. Significance
Example: Credit card default, we may be more interested in predicting the probabilty of a default than classifying individuals as default or not.
 Statistical Learning: Chapter 4 Classification 4.1 Introduction Supervised learning with a categorical (Qualitative) response Notation: - Feature vector X, - qualitative response Y, taking values in C
Does NFL Spread Betting Obey the E cient Market Hypothesis?
 Does NFL Spread Betting Obey the E cient Market Hypothesis? Johannes Harkins May 2013 Abstract In this paper I examine the possibility that NFL spread betting does not obey the strong form of the E cient
Chapter 7 Section 7.1: Inference for the Mean of a Population
 Chapter 7 Section 7.1: Inference for the Mean of a Population Now let s look at a similar situation Take an SRS of size n Normal Population : N(, ). Both and are unknown parameters. Unlike what we used
LAGUARDIA COMMUNITY COLLEGE CITY UNIVERSITY OF NEW YORK DEPARTMENT OF MATHEMATICS, ENGINEERING, AND COMPUTER SCIENCE
 LAGUARDIA COMMUNITY COLLEGE CITY UNIVERSITY OF NEW YORK DEPARTMENT OF MATHEMATICS, ENGINEERING, AND COMPUTER SCIENCE MAT 119 STATISTICS AND ELEMENTARY ALGEBRA 5 Lecture Hours, 2 Lab Hours, 3 Credits Pre-
Money and Capital in an OLG Model
 Money and Capital in an OLG Model D. Andolfatto June 2011 Environment Time is discrete and the horizon is infinite ( =1 2 ) At the beginning of time, there is an initial old population that lives (participates)
Binary Diagnostic Tests Two Independent Samples
 Chapter 537 Binary Diagnostic Tests Two Independent Samples Introduction An important task in diagnostic medicine is to measure the accuracy of two diagnostic tests. This can be done by comparing summary
Analyzing Dose-Response Data 1
 Version 4. Step-by-Step Examples Analyzing Dose-Response Data 1 A dose-response curve describes the relationship between response to drug treatment and drug dose or concentration. Sensitivity to a drug
TIPS DATA QUALITY STANDARDS ABOUT TIPS
 2009, NUMBER 12 2 ND EDITION PERFORMANCE MONITORING & EVALUATION TIPS DATA QUALITY STANDARDS ABOUT TIPS These TIPS provide practical advice and suggestions to USAID managers on issues related to performance
Composite performance measures in the public sector Rowena Jacobs, Maria Goddard and Peter C. Smith
 Policy Discussion Briefing January 27 Composite performance measures in the public sector Rowena Jacobs, Maria Goddard and Peter C. Smith Introduction It is rare to open a newspaper or read a government
South Carolina College- and Career-Ready (SCCCR) Probability and Statistics
 Probability and Statistics") South Carolina College- and Career-Ready (SCCCR) Probability and Statistics South Carolina College- and Career-Ready Mathematical Process Standards The South Carolina College- and Career-Ready (SCCCR)
South Carolina College- and Career-Ready (SCCCR) Probability and Statistics South Carolina College- and Career-Ready Mathematical Process Standards The South Carolina College- and Career-Ready (SCCCR)
Chapter 5: Analysis of The National Education Longitudinal Study (NELS:88)
") Chapter 5: Analysis of The National Education Longitudinal Study (NELS:88) Introduction The National Educational Longitudinal Survey (NELS:88) followed students from 8 th grade in 1988 to 10 th grade in
Chapter 5: Analysis of The National Education Longitudinal Study (NELS:88) Introduction The National Educational Longitudinal Survey (NELS:88) followed students from 8 th grade in 1988 to 10 th grade in
Decision Theory. 36.1 Rational prospecting
 36 Decision Theory Decision theory is trivial, apart from computational details (just like playing chess!). You have a choice of various actions, a. The world may be in one of many states x; which one
Additional sources Compilation of sources: http://lrs.ed.uiuc.edu/tseportal/datacollectionmethodologies/jin-tselink/tselink.htm
 Mgt 540 Research Methods Data Analysis 1 Additional sources Compilation of sources: http://lrs.ed.uiuc.edu/tseportal/datacollectionmethodologies/jin-tselink/tselink.htm http://web.utk.edu/~dap/random/order/start.htm
Problem Solving and Data Analysis
 Chapter 20 Problem Solving and Data Analysis The Problem Solving and Data Analysis section of the SAT Math Test assesses your ability to use your math understanding and skills to solve problems set in
Section A. Index. Section A. Planning, Budgeting and Forecasting Section A.2 Forecasting techniques... 1. Page 1 of 11. EduPristine CMA - Part I
 Index Section A. Planning, Budgeting and Forecasting Section A.2 Forecasting techniques... 1 EduPristine CMA - Part I Page 1 of 11 Section A. Planning, Budgeting and Forecasting Section A.2 Forecasting
Risk Preferences and Demand Drivers of Extended Warranties
 Risk Preferences and Demand Drivers of Extended Warranties Online Appendix Pranav Jindal Smeal College of Business Pennsylvania State University July 2014 A Calibration Exercise Details We use sales data